|
Gordon T Long Research exclusively distributed at MATASII.com
Subscribe to Gordon T Long Research - $35 / Month - LINK
Complete MATASII.com Offerings - $55/Month - LINK
SEND YOUR INSIGHTFUL COMMENTS - WE READ THEM ALL - lcmgroupe2@comcast.net
| |
|
UnderTheLens - APRIL 2024
Macro Analytics - 04/08//24
| |
HAS WAVE 2 OF INFLATION BEGUN?
OBSERVATIONS: THE "COMMON MAN" CPI
Since January 2021, the consumer price index, or CPI, has risen a cumulative 18%. Yet that measure obscures more than it reveals!
Jason Trennert, founder of the brokerage and financial advisory firm Strategas, recently highlighted an alternative way to survey inflation: the Common Man CPI. Rather than focus on an unnecessarily large basket of goods, this tool exclusively measures price increases for necessities such as food, energy, clothing and shelter.
Between 2020 and 2024, the Common Man CPI has shown worse inflation in nearly every month than the official CPI. That’s in part because of how the tools take in the economy. The CPI includes discretionary spending, including such non-necessities as luxury products, hotel stays and entertainment. As the cost of living has skyrocketed in recent years, particularly for necessities, Americans have cut back on discretionary spending and racked up unprecedented credit-card debt, which now stands at a record $1.13 trillion.
As consumers buy fewer non-essentials and focus on things like housing, the CPI becomes less illustrative of how the typical American family is contending with inflation. Whereas the annual CPI increase peaked around 9% in June 2022, the alternative measure reached nearly 12%—and a third faster, in June 2022.
Additionally, because it relies on rent prices to impute an estimate for the cost of homeownership, the CPI has been underestimating the true increase in shelter prices. Data on home prices and interest rates indicate the cost of homeownership is up 80% since January 2021, not 20% as implied by the CPI.
But it is actually even worse than that because the CPI also does not properly factor in the personal services we have come to rely on. From haircuts, to car repairs to home repairs to veterinary & handyman services the average family faces cost increases that even dwarf CPI measures. The worst part is overall Service Inflation is the one problem that the Fed has little solution for because high Fed Funds rates only exacerbate the services problem!
All this helps explain why so many Americans are dissatisfied with the economy today: Prices for the things they’re actually buying have risen—and continue to—considerably faster than common metrics report. This also means that real inflation-adjusted earnings have fallen more than the Bureau of Labor Statistics’s official 4.2% decline since January 2021.
It’s true that not everyone is feeling the pain of Bidenomics. Many high-income earners who in 2021 already held assets like equities or housing saw their portfolios rise considerably. These people are also more likely to have incomes that adjust faster to inflation and real earnings that tend to decline less than average, if at all.====>
| |
|
VIDEO PREVIEW (click image)
Pay-Per-View Page Link
|  | |
THIS WEEK WE SAW
Exp=Expectations, Rev=Revision, Prev=Previous
US
US ISM Manufacturing Prices Paid (Mar) 55.8 vs. Exp. 52.7 (Prev. 52.5)
US ISM Manufacturing PMI (Mar) 50.3 vs. Exp. 48.4 (Prev. 47.8)
US ISM Manufacturing New Orders Index (Mar) 51.4 (Prev. 49.2)
US Construction Spending MM (Feb) -0.3% vs. Exp. 0.7% (Prev. -0.2%)
Atlanta Fed GDPNow (Q1) 2.8% (prev. 2.3% on March 29th)
US Factory Orders MM (Feb) 1.4% vs. Exp. 1.0% (Prev. -3.6%, Rev. -3.8%)
US ADP National Employment (Mar) 184k vs. Exp. 148k (Prev. 140k, Rev. 155k)
US Initial Jobless Claims 221k vs. Exp. 214k (Prev. 210k, Rev. 212k)
US International Trade (USD)(Feb) -68.9B vs. Exp. -67.3B (Prev. -67.4B, Rev. -67.6B)
===> Those on the rest of the income ladder aren’t as well-positioned. Many of them see much slower pay increases amid rising prices. This is especially true for those on fixed incomes, which are adjusted for inflation only once a year, at best.
If the White House wants to understand why the public isn’t getting on board with the president’s program, it’s because they’re looking at and living with different economic realities.
| |
========================= | |
|
WHAT YOU NEED TO KNOW!
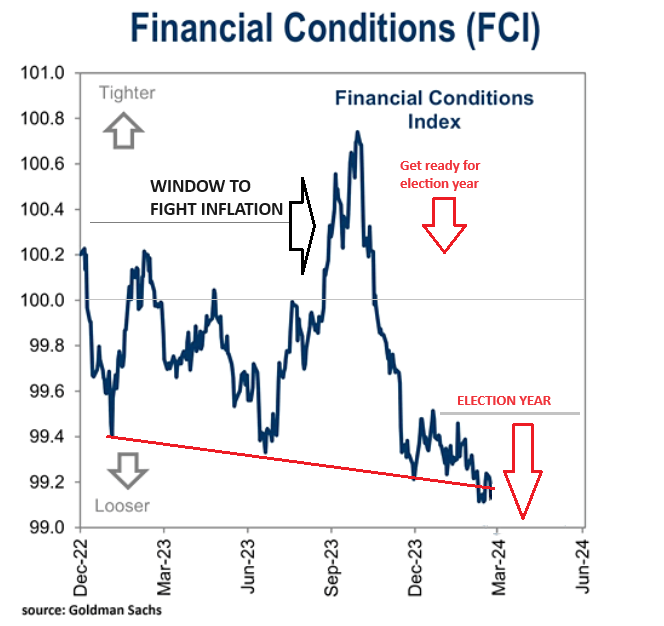
A LOST WINDOW TO FIGHT INFLATION
The all important Financial Conditions Index has collapsed in a loosening "freefall" as the Election year games begin.
The Fed was late to the battle against inflation as it believed Inflation was "Transitory". When they realized it was a serious problem they panicked with exploding Fed Fund Rate hikes. Realistically the rate hikes could only go so high or it would trigger a financial crisis. The Fed was trapped unless Inflation fell quickly before election year pressures took over. Inflation came down but the battle is a long ways from over.
Though markets have exploded higher the Fed is signaling it expects to cut rates three time before final election ballots are cast. It the Fed about to pour gasoline on the fire? Biden may require this?
RESEARCH
HAS WAVE 2 INFLATION ARRIVED? We are seeing the following:
- Steadily Rising Inflation Breakevens.
- Citi's Inflation-Surprise Index has resurged back to its highest since Dec 2022.
- The US Cleveland Fed Inflation Nowcasting CPI Y-o-Y for the current period shows inflation signals are flashing red once again.
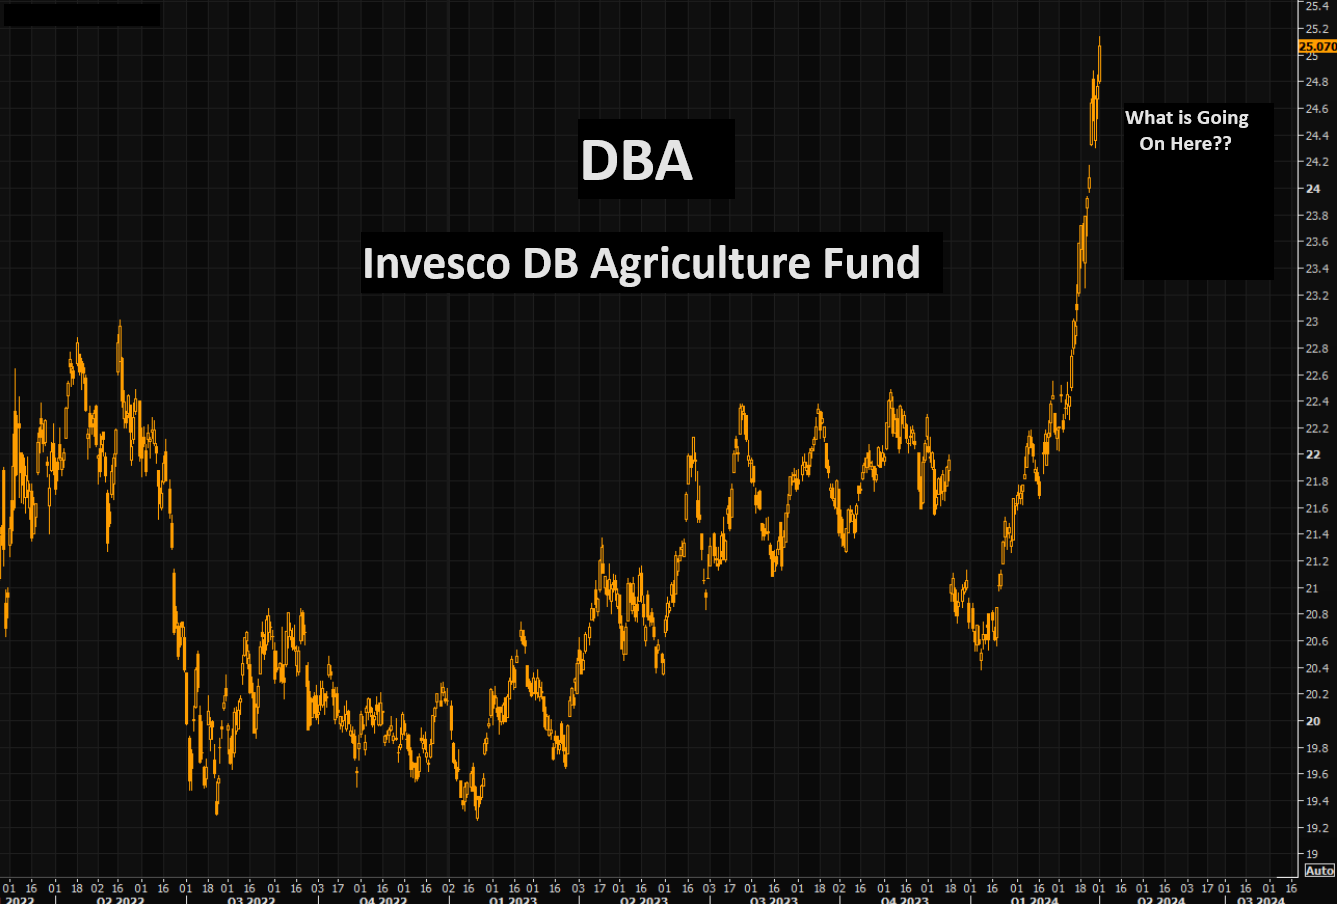
- Price increases are sweeping over the agricultural sector has evidenced by the Invesco DB Agriculture Fund exploding higher since year beginning.
- Concurrent dramatic increases in Gold, Silver, & Bitcoin are a strong indication of rising Inflation expectations.
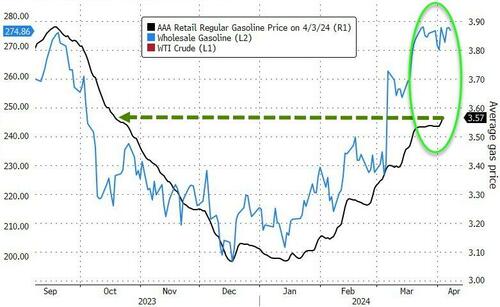
- Surging Global Oil Prices as evidenced by significant movements in Brent, WTIC and the XLE. This is steadily working itself into rising consumer and commercial prices at the pump.
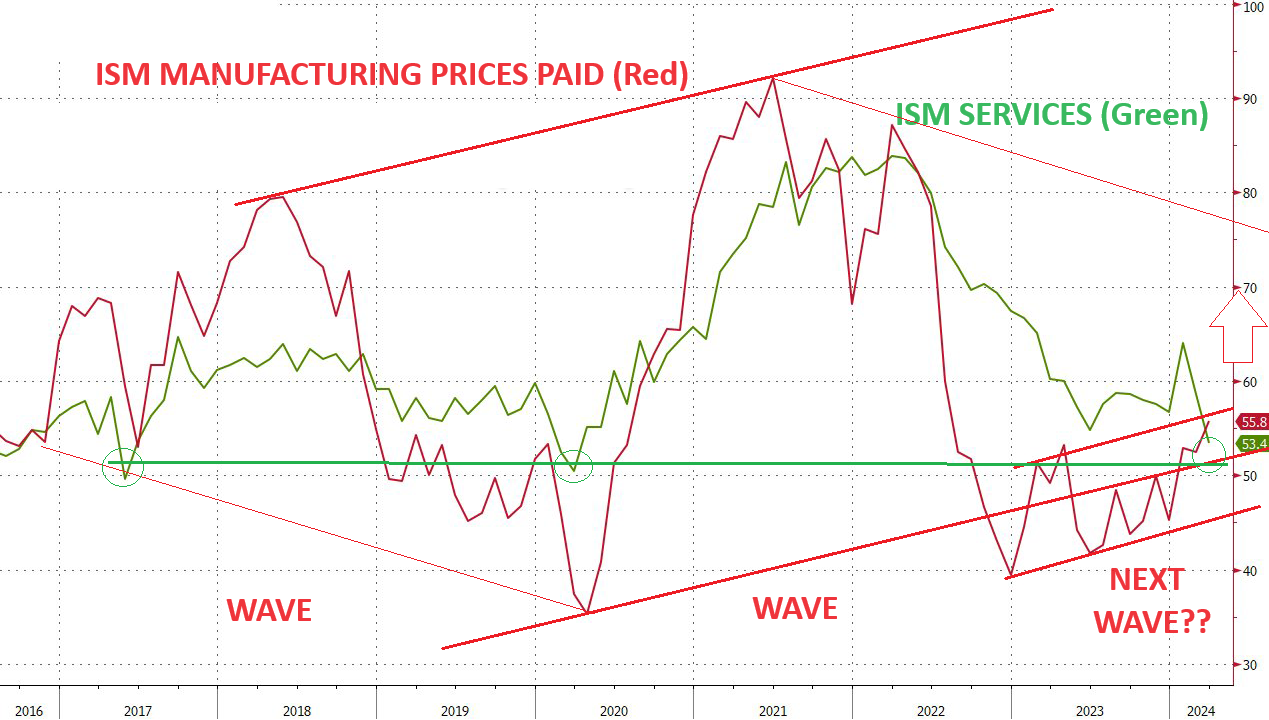
- ISM Manufacturing Prices Paid is steadily rising.
THE GDI BUFFETT INDICATOR
- We have marked up the Buffett Indicator to reflect GDI which we believe should be used during current economic conditions.
- Our work illustrates that current market valuations are at extremes not previously seen even including the major valuations distortions which occurred during the infamous Dotcom hysteria (associated with expectations for the implementation of Internet technology).
- As Buffett always advises - You must have a "Margin of Safety" in the price you pay. The charts don't show it using GDI.
- Buffett also cautions that there is a difference between "the price you pay and the value you get".
| |
|
DEVELOPMENTS TO WATCH
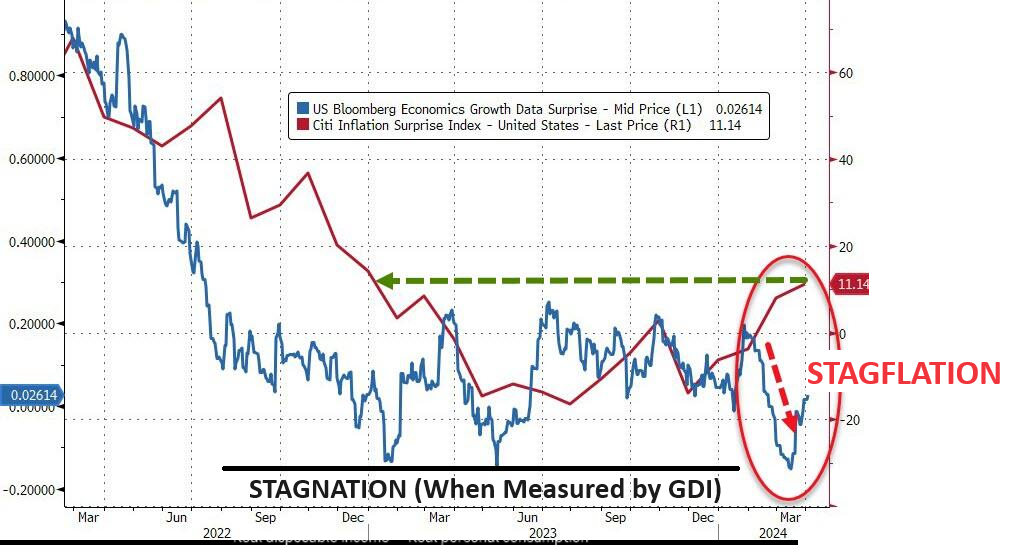
HINTS OF STAGFLATION?
- Citi's inflation-surprise index has surged back to its highest since Dec 2022 (chart right). Meanwhile when overlaid with Bloomberg's economic growth surprise index we see they are going in opposite directions??
- Though Bloomberg's data suggests economic Stagflation, together they signal that Stagflation may be nearer than many yet appreciate.
GROWING US TRADE DEFICIT & THE LOOMING "TARIFFS OF THE TRADE"!
- The US trade Deficit has once again began widening. Though Exports rose by the most in a year in February, Imports saw its second fastest gain in two years. The solid outturn caused a widening in the U.S. trade deficit and suggests net exports will be a drag on U.S. real GDP growth in the first quarter.
- U.S. exports advanced $5.8 billion in February, while imports shot $7.1 billion higher.
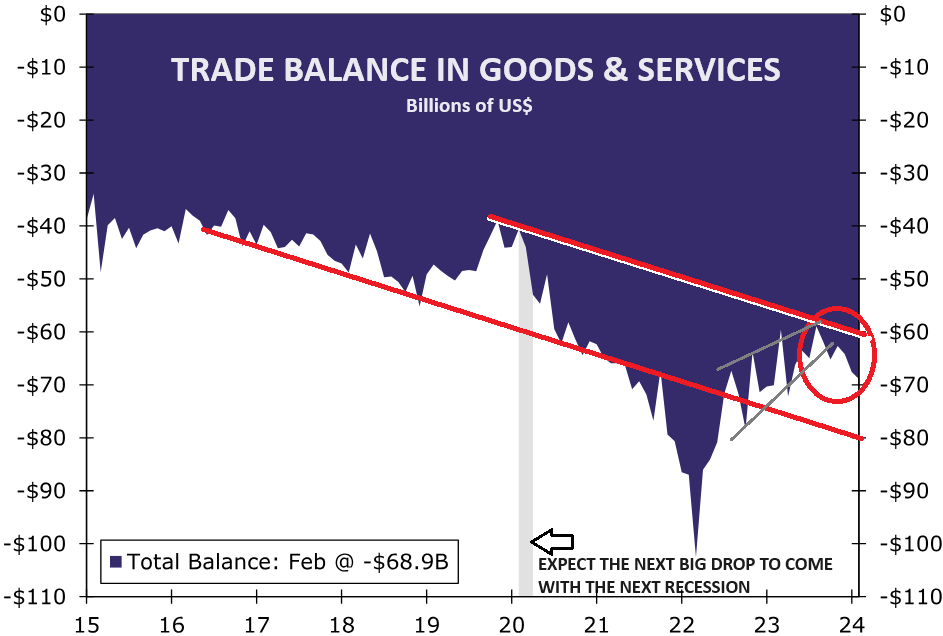
- The larger gain in imports caused the U.S. trade deficit to widen by $1.3 billion to a balance of -$68.9 billion.
- February marks the third consecutive month, or the fifth time in six months, that the trade balance has widened, a somewhat different pattern than the sharp narrowing we saw throughout 2022 and in the first half of last year
THIS IS NEITHER GOOD FOR THE US$ NOR INFLATION
| |
|
GLOBAL ECONOMIC REPORTING
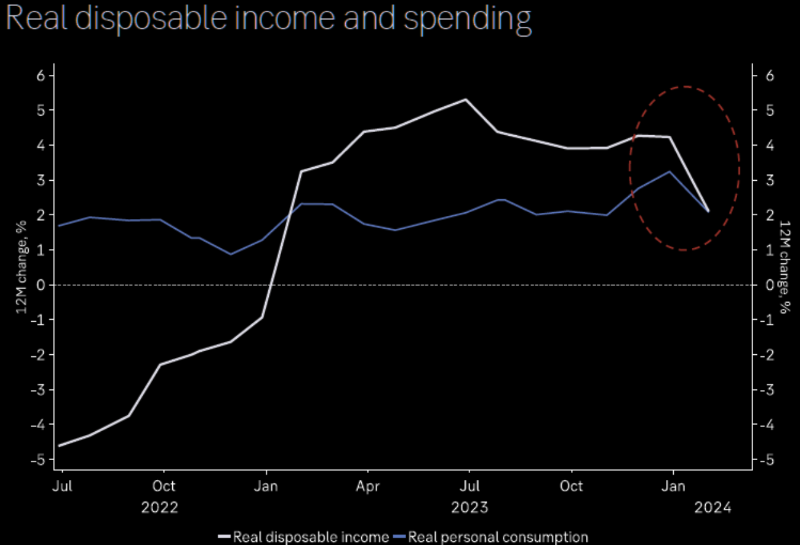
- REAL DISPOSABLE INCOME & SPENDING
- It looks like real disposable income and consumer spending is starting to come under pressure. (chart right)
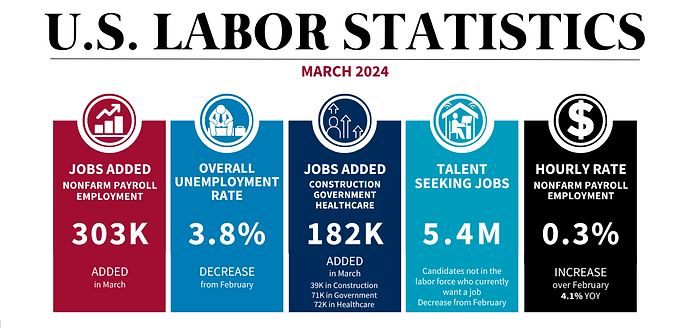
- MARCH LABOR REPORT (NFP)
- The extremely hot March Labor report delivered the breathing room the Fed needed to buy more time in tis fight against inflation.
- The US added a whopping 303K jobs, tied for the highest since Jan 2023! was above the highest Wall Street estimate of 290K and was the latest multiple-sigma beat to expectations, this month coming in at 4 Sigma.
| |
|
In this week's "Current Market Perspectives", we focus on the critical point the markets are now at and how April which is seasonality the best month of the year is likely to unfold.
=========
| |
|
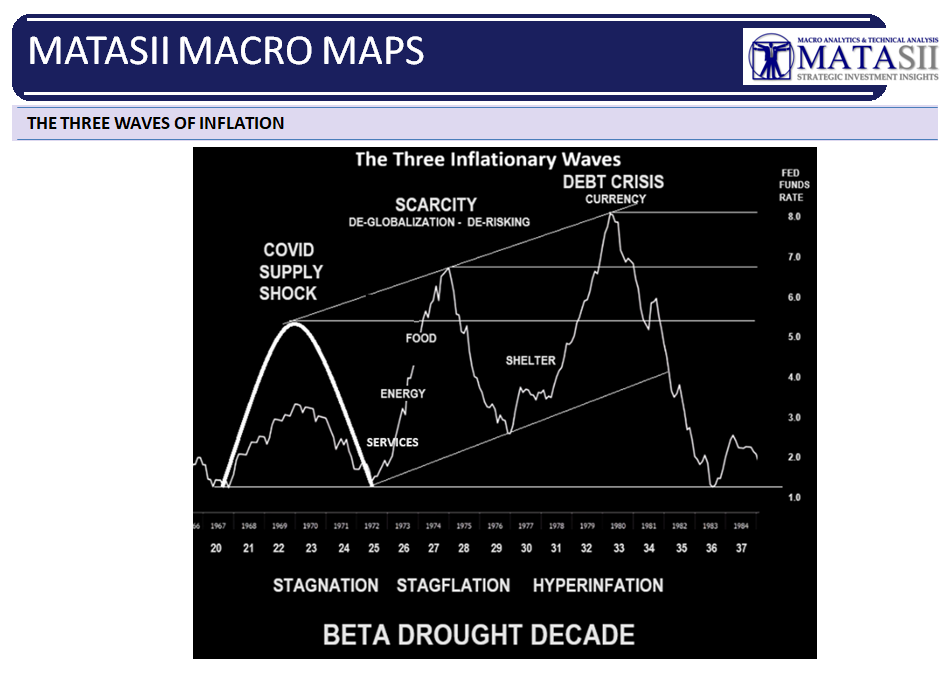
HAS WAVE 2 INFLATION ARRIVED?
We have been warning that Wave 2 was coming (Macro Map right) but it seems few are paying attention?
We said it would begin showing with Services as the wage spiral pushes inflation costs through the system. followed by rising energy costs. This is showing itself with sticky services inflation being a major concern of the Federal Reserve FOMC.
We encourage you to revisit our LONGWave - 03 13 24 - MARCH - False Beliefs & Market Shocks video where we detailed our inflationary concerns. Since then more have appeared as we outline below.
Why are the following happening?
- Steadily Rising Inflation Breakevens.
- Continuous US Services CPI Price Pressures - Still a Fed Concern
- Citi's Inflation-Surprise Index has resurged back to its highest since Dec 2022.
- The US Cleveland Fed Inflation Nowcasting CPI Y-o-Y for the current period shows inflation signals are flashing red once again.
- Price increases are sweeping over the agricultural sector has evidenced by the Invesco DB Agriculture Fund exploding higher since year beginning.
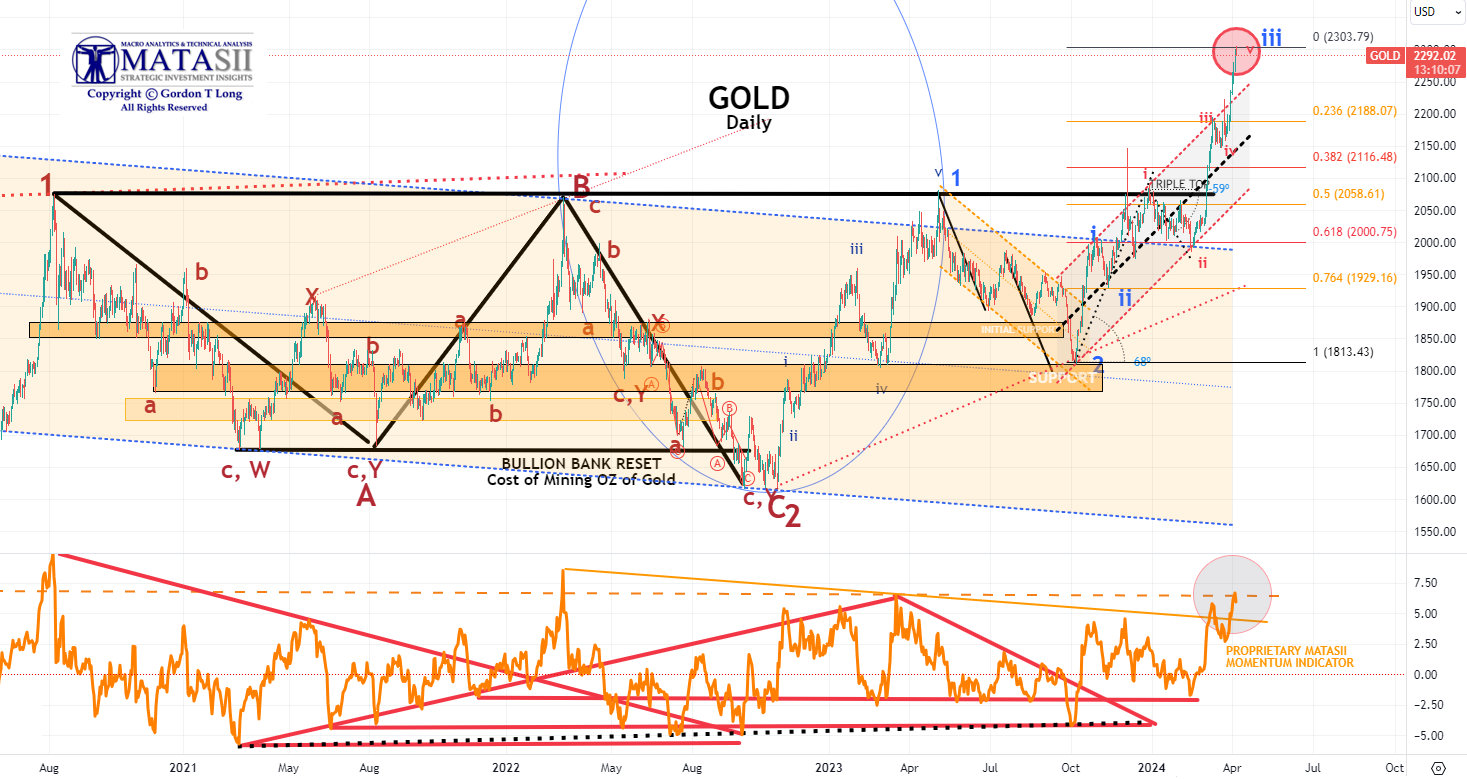
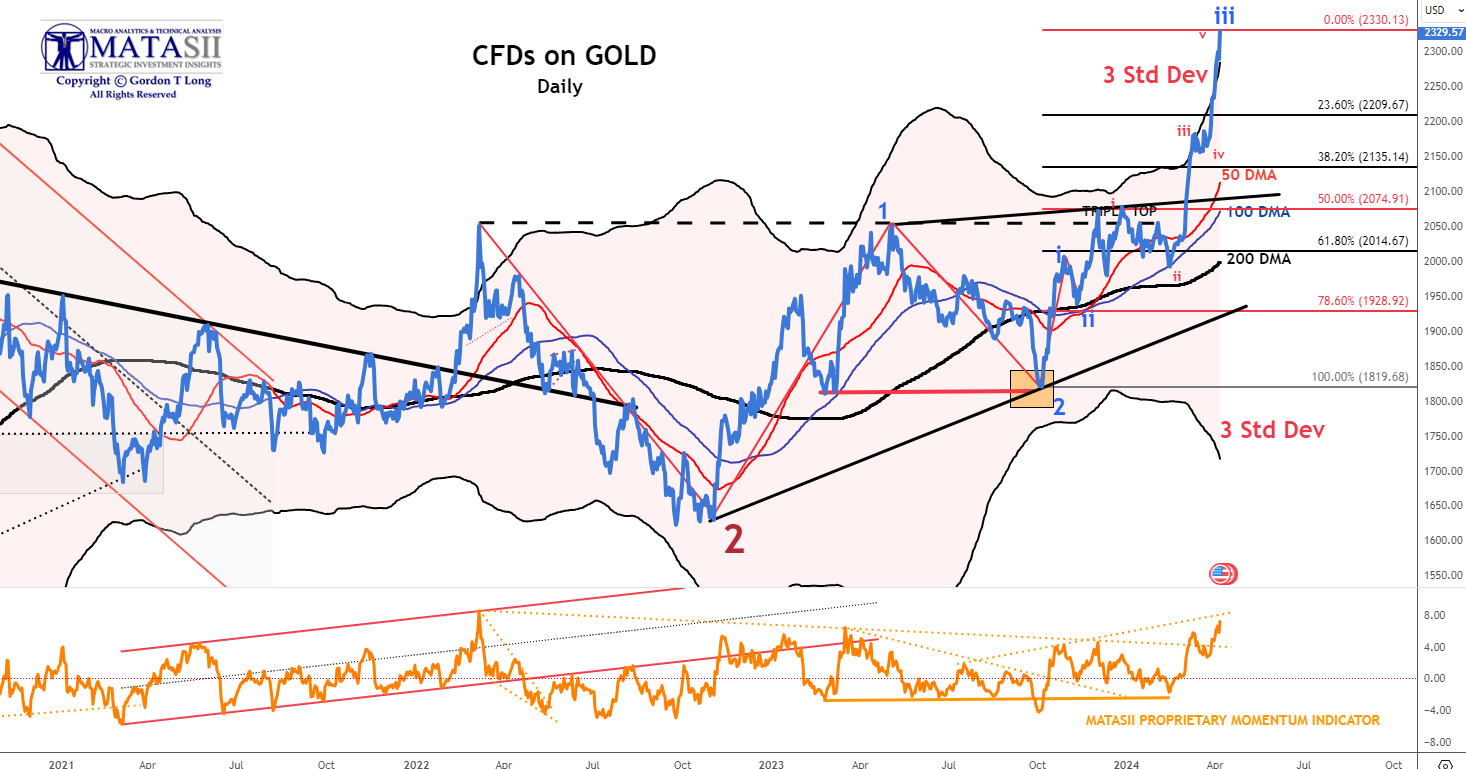
- Concurrent dramatic increases in Gold, Silver, & Bitcoin are a strong indication of rising Inflation expectations.
- Surging Global Oil Prices as evidenced by significant movements in Brent, WTIC and the XLE. This is steadily working itself into rising consumer and commercial prices at the pump.
- ISM Manufacturing Prices Paid is steadily rising.
Let's go though them:
| |
|
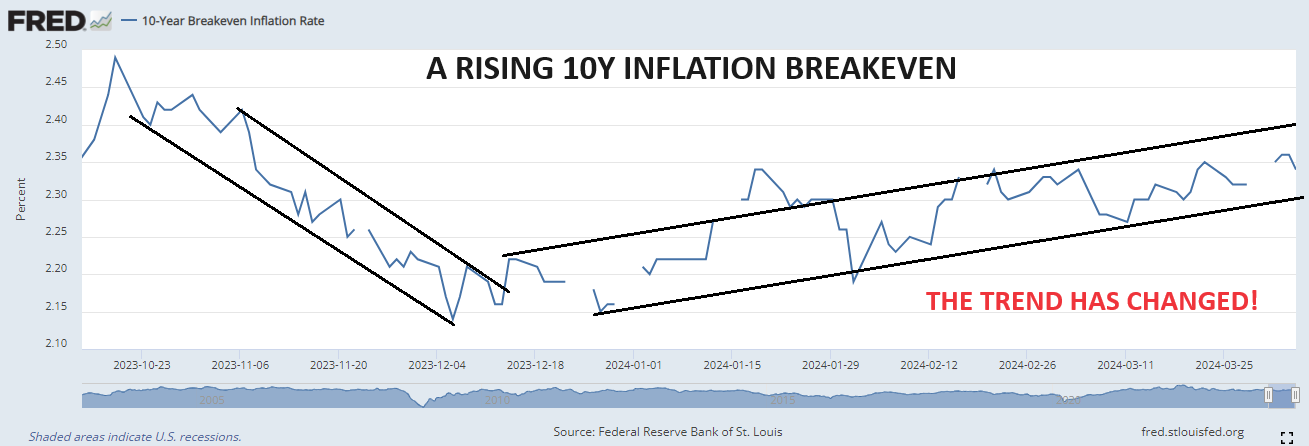
1- RISING INFLATION BREAKEVENS
Inflation Breakevens have been steadily rising since January. The Trend has definitely reversed but few seem to accept or recognize this?
This increase suggests that market participants are adjusting their expectations for future inflation upwards. Despite this clear trend in financial indicators, there may be a lag in public recognition or acceptance of this shift. This could be due to a variety of reasons, including the time it takes for economic data to permeate public consciousness, the complexity of interpreting financial indicators, or a general skepticism towards economic forecasts?
| |
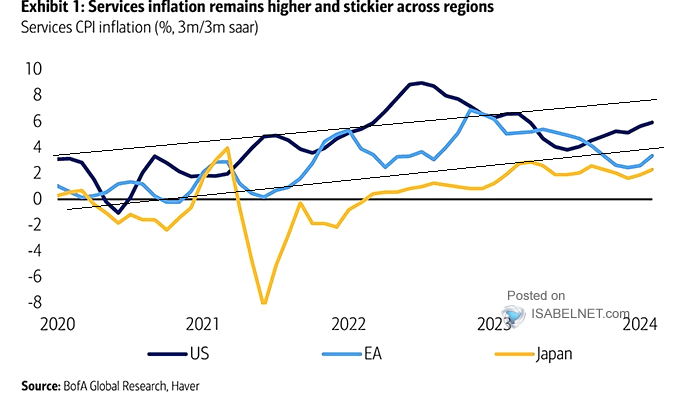
2- CONTINUOUST PRESSURE ON INCREASING US CPI SERVICES PRICES
The Federal Reserve is finding that Services Inflation is much more sticky and difficult to control. It is not controlled as much by interest rates but rather the "pass through" of inflation & tightening labor markets from the overall economy. This suggests it will take longer to abate
| |
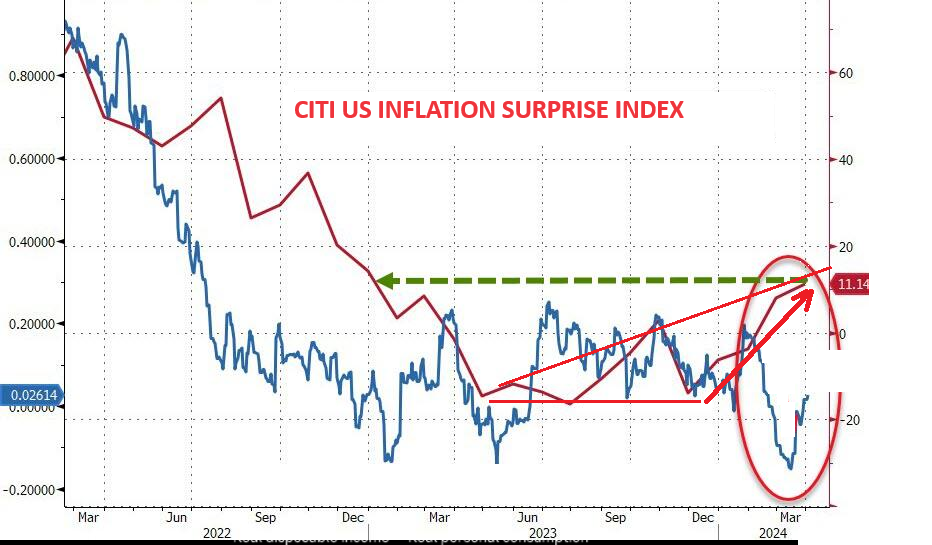
3- CITI'S US INFLATION SURPRISE INDEX
Citi's Inflation-Surprise Index has resurged back to its highest since Dec 2022
| |
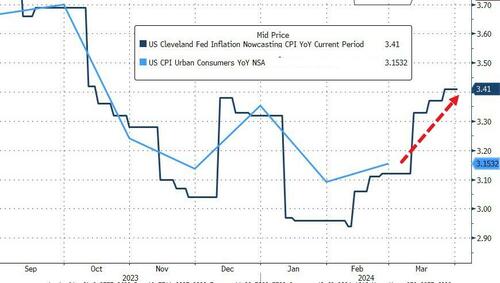
4- US CLEVELAND FED INFLATION NOWCASTING CPI
The US Cleveland Fed Inflation Nowcasting CPI Y-o-Y for the current period shows inflation signals are flashing red once again.
| |
5- WHAT IS GOING IN AGRICUTURE??
The Invesco DB Agriculture Fund has exploded higher since year beginning. Concerns about scarcity compound increasing agricultural input costs.
| |
|
6- CONCURRENT DRAMATIC INCREASES IN INFLATION CANARIES
We are witnessing concurrent dramatic increases in Gold, Silver, & Bitcoin which is historically a strong indication of rising Inflation expectations or a potential falling US Dollar reducing US purchasing power (or both).
| |
|
YOUR DESKTOP / TABLET / PHONE ANNOTATED CHART
Macro Analytics Chart Above: SUBSCRIBER LINK
| |
|
7- SURGING GLOBAL OIL PRICES
We are seeing surging global oil prices as evidenced by significant movements across the board in Brent, WTIC and the XLE. This is steadily working into rising consumer and commercial prices at the pump.
| |
|
8- ISM MANUFACTURING PRICES PAID
ISM Manufacturing prices paid is the highest it has been since July 2022 and trending upward. It may be normalizing but this still suggests further pricing pressures.
| |
|
From a supporting underlying financial perspective we are seeing (to just name a few):
- Sticky Service Inflation as shown again by the current PMI indicators.
- Surging Bond Yields as we knocked on 4.4% on the 10Y US Treasury this week
- An upturn in Loosening Global Financial Conditions (GFTI)
- The ADP Wage Growth Exploding Higher this week (LINK)
- The S&P CoreLogic Case-Shiller U.S. National Home Price Index rose 6% in January. This is up from 5.6% in December 2023. As HousingWire notes, this represents the seventh consecutive month of annual price growth. It's also the biggest increase since November 2022. By the way, inflation was around 6% at that time! So we've got both real estate and stocks bubbling up again.
| |
|
THE GDI BUFFETT INDICATOR
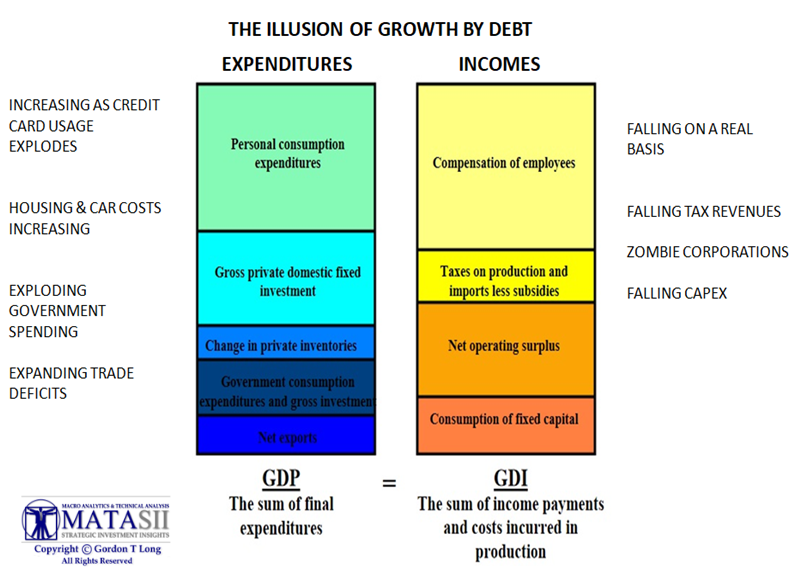
I have written often lately about the financial distortions currently occurring. One of which is the GDP:GDI divergence. In any double entry accounting system the numbers must balance to ensure accuracy and integrity are assured. This is the case with economic growth where GDP (Gross Domestic Product) is to equal GDI (gross Domestic Income). GDP represents the expenditures occurring in the economy while GDI represents the incomes (see chart right).
When you have access expenditures through major deficit spending that is not resulting in incomes in the wage of real compensation, falling tax revenues, falling real profits then GDP and GDI diverge. This has happened as a result of > $6.7T of government spending over the last three years.
The distortions spread throughout the system to include valuations.
The Buffett Indicator to assess when market valuations are excess is warning of such an occurrence!
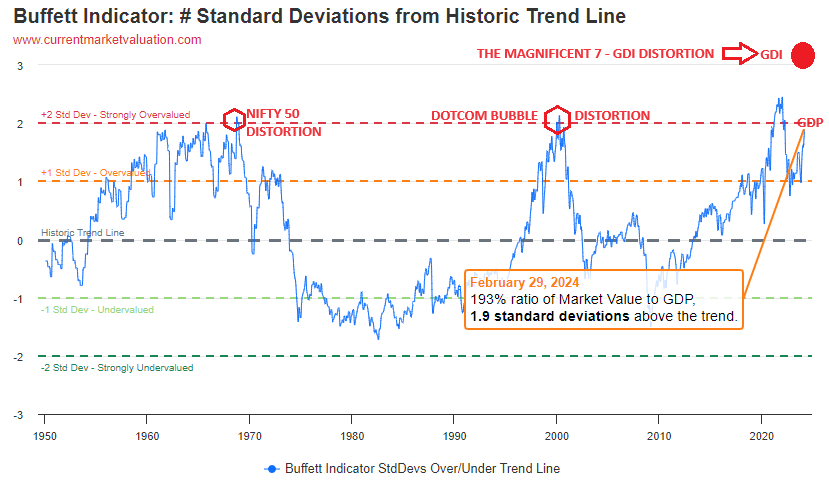
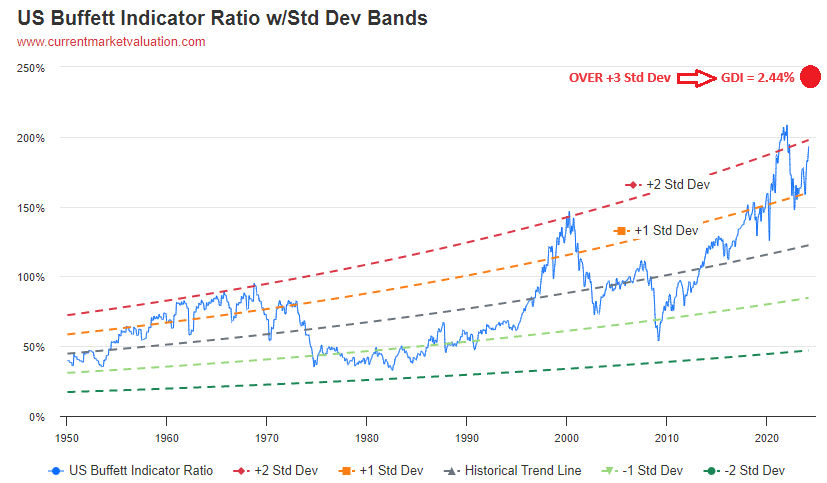
The web site Current Market Valuation.com does a well researched coverage of the Buffett Indicator which I encourage you to review. However, the numbers are much worse than they indicate because the Buffet Indicator uses the GDP when in such economic conditions as we are currently experiencing it can be well argued that the Buffett Indicator should be using GDI measures.
I have marked up the Buffett Indicator to reflect GDI. It illustrates that current market valuations are at extremes not previously seen including the major valuations distortions which occurred during the infamous Dotcom hysteria associated with expectations for the implementation of Internet technology.
| |
As Warren Buffett has always maintained in Buying assets, you must have a margin of safety. Tough to see it in the current market conditions?? | |
|
DEVELOPMENTS TO WATCH
HINTS OF STAGFLATION?
Citi's inflation-surprise index has surged back to its highest since Dec 2022 (chart right). Meanwhile when overlaid with Bloomberg's economic growth surprise index we see they are going in opposite directions??
Though Bloomberg's data suggests economic Stagflation, together they signal that Stagflation may be nearer than many yet appreciate.
Spanish economist Daniel Lacalle recently spelled out the problem referencing some further facts to what we have been highlighting for some time - the importance of Gross Domestic Income (GDI).
Gross Domestic Income proves the economy is stagnant, and if we look at GDP and GDI excluding the accumulation of debt, they show the worst year since the 1930s.
How can an economy be stagnant with 2.5% GDP growth? Here is the failure of Keynesianism in all its glory. Headline aggregated figures are optically strong due to the accumulation of debt, and employment figures are bloated by government jobs, disguising a struggling private sector and a weakening purchasing power of the currency. Cheap money is very expensive in the long run, and discontent rises as Keynesianism focuses on increasing the public sector while the productive economy suffers higher taxes and more challenges to pay the bills.
Inflation is a consequence of the misguided increase in government spending and debt monetization in the middle of a post-pandemic recovery, leading to an aggregate loss of purchasing power of the currency that is close to 24% in the past four years. The government is taking in inflation what it promises in entitlement spending. The result? You are poorer.
Americans are suffering a prohibitive tax wedge as well as the hidden tax of inflation just because the government decided to play the oldest trick in the book: promise “free stuff” and print new currency through deficit spending, which makes the allegedly free programs more expensive than ever. The failure of Keynesianism is evident.
Sadly, politicians will promise more Keynesianism and present themselves as the solution to the problem they (unbridled spending) have created.
| |
|
GROWING US TRADE DEFICIT & THE LOOMING "TARIFFS OF THE TRADE"!
The Wells Fargo economic team recently released of large report entitled: "Tariffs of the Trade -
Outlook for Trade Policy Amid the 2024 Election". They warned of what may be instore for us in a post US election economy riff for tariffs, protectionism - both sending prices higher.
A continuation of protectionist trade policy, or potential escalation, may add fodder to ongoing deglobalization in the wake of the pandemic. The reorganization of supply chains does not come without cost and could thus lead to higher prices of imported goods on a sustained basis. Yet, the short-run inflationary impact of tariffs could be mitigated if the dollar strengthens and/or the rise of automation boosts productivity.
Heading into a contentious election cycle, the nearly unilateral control of trade policy conferred upon whoever wins the presidency suggests trade policy may again take on greater importance come 2025. Uncertainty surrounding trade policy has already ticked higher to levels last seen at the start of the pandemic, suggesting businesses are attuned to the rising risk.
Meanwhile the US trade Deficit has once again began widening. Though Exports rose by the most in a year in February, Imports saw its second fastest gain in two years. The solid outturn caused a widening in the U.S. trade deficit and suggests net exports will be a drag on U.S. real GDP growth in the first quarter.
- U.S. exports advanced $5.8 billion in February, while imports shot $7.1 billion higher.
- The larger gain in imports caused the U.S. trade deficit to widen by $1.3 billion to a balance of -$68.9 billion.
- February marks the third consecutive month, or the fifth time in six months, that the trade balance has widened, a somewhat different pattern than the sharp narrowing we saw throughout 2022 and in the first half of last year (chart above).
- The recent strength in imports suggests domestic goods demand is normalizing after a relatively weak year for capital expenditures and durable good consumption.
- Imports are likely to continue to outweigh exports in the coming months.
- In factoring in the revision to a wider January trade deficit and the February data, data suggest net exports are tracking to subtract about half-a-percentage point from headline real GDP growth in the first quarter. Should that come to fruition, Q1 would mark net exports' first negative contribution to headline GDP growth since Q1-2022.
- U.S. importers have faced higher costs due to the 2018-19 trade war, but with the tariffs' limited direct hit to consumer products and elevated corporate profit margins allowing businesses to absorb most of the additional cost, there has been a limited pass-through to consumer prices.
- While the trade war’s overall effect on the economy has been marginal, the president's near unilateral control of trade policy suggests trade may again take on greater importance headed into this contentious election cycle.
| |
|
GLOBAL ECONOMIC INDICATORS: What This Week's Key Global Economic Releases Tell Us
REAL DISPOSABLE INCOME & SPENDING
It looks like real disposable income and spending is starting to come under pressure.
LABOR REPORT (NFP) - MARCH
The extremely hot March Labor report delivered the breathing room the Fed needed to buy more time in tis fight against inflation.
The US added a whopping 303K jobs, tied for the highest since Jan 2023! was above the highest Wall Street estimate of 290K and was the latest multiple-sigma beat to expectations, this month coming in at 4 Sigma.
| |
 | |
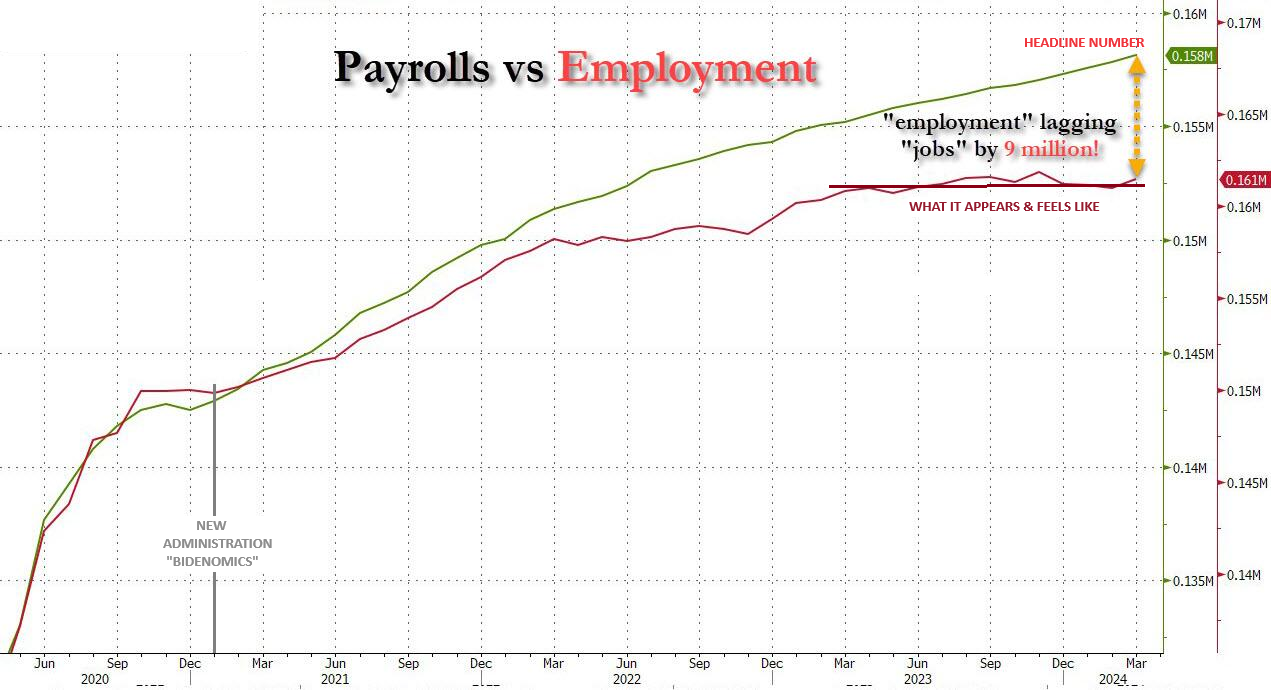
There are two surveys conducted by the Bureau of Labor Statistics (BLS). The difference between the BLS’s Establishment Survey (also known as the Current Employment Statistics or CES) and the Household Survey (also known as the Current Population Survey or CPS) lies in their scope, methodology and games being played by the government. Prior to the current administration they more or less matched on a monthly basis.
We have never seen this degree of variation which the BLS has conspicuously not explained?
Establishment Survey (CES): This survey measures employment, hours, and earnings across nonfarm industries. It counts jobs, not people, and excludes agricultural workers, private households, and the self-employed. It’s known for providing detailed industry and geographic employment data1.
Household Survey (CPS): This survey measures the labor force status of the civilian noninstitutional population, including demographic details. It counts employed people, including agricultural workers and the self-employed, and is the source of the national unemployment rate1.
| |
This issues with the report include:
- All the job gains were part time jobs! In March the number of part-time jobs soared by 691K to 28.632 million, up from 27.941 million while full-time jobs dropped by 6,000, to 132.940 million from 132.946 million.
- Since March 2023, the number of full-time workers has collapsed by 1.347 million while the number of part-time workers exploded by 1.888 million!
- The unemployment rate unexpectedly dipped, dropping to 3.8%, from 3.9%, in line with estimates, as the number of unemployed workers dipped modestly from 6.458 million to 6.429 million while the number of employed workers rose by almost half a million workers.
- The participation rate rose from 62.5% to 62.7%, above the 62.6% expected, as the overall civilian labor force increased slightly less than the number of employed people.
- According to the BLS, the number of people not in the labor force who want a job came in little changed at 5.4 million.
- The average hourly earnings came in as expected, rising 0.3% MoM, up from last month's upward revised 0.2% sequential increase (revised from 0.1%), On an annual basis, the hourly earnings rose 4.1%, as expected, and down from 4.3%. This was the lowest print in almost three years: the last time wages rose by this much was the summer of 2021.
- The job gains since 2018 have gone to immigrants, mostly illegal immigrants. (see detail). After the collapse in native-born workers in the last three months when nearly 2.5 million native-born workers lost their jobs, March saw some pick up, and 929K native-born workers were added. Meanwhile, after last month's record increase in foreign-born workers, in March illegal immigrants added another 112K jobs, pushing the total number of foreign-born workers to a new record high of 31.114 million. Said otherwise: not only has all job creation in the past 6 years has been exclusively for foreign-born workers but there has been zero job-creation for native born workers since July 2018!
-
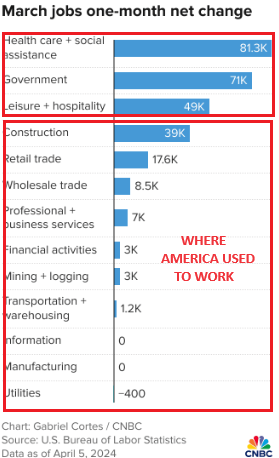
In March, employment in government increased by 71,000, higher than the average monthly gain of 54,000 over the prior 12 months. Over the month, employment increased in local government (+49,000) and federal government (+9,000).
| |
|
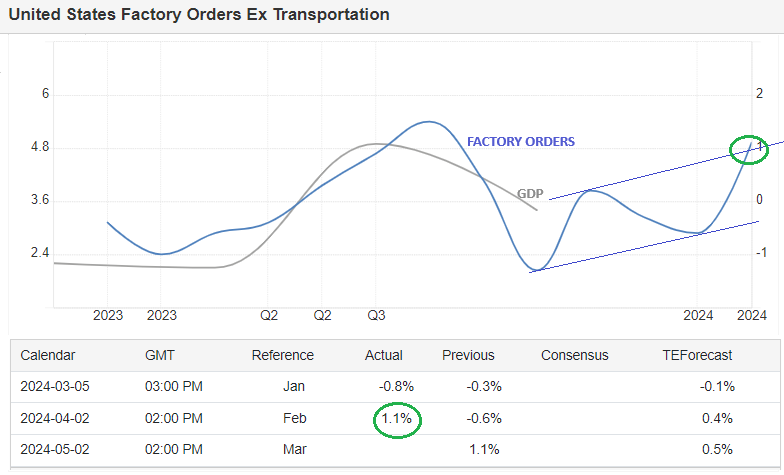
FACTORY ORDERS
- US Factory Orders MM (Feb) 1.4% vs. Exp. 1.0% (Prev. -3.6%, Rev. -3.8%)
When excluding transportation goods, new factory orders in the United States expanded by 0.9% in February of 2024.
Factory Orders Ex Transportation in the United States averaged 0.25 percent from 1992 until 2024, reaching an all time high of 5.50 percent in June of 2020 and a record low of -9.20 percent in April of 2020.
Final factory orders were revised slightly lower over the month with capital goods shipments ex-air - a key input for the government’s GDP calculation - tumbled 0.6% MoM (the worst since Feb 2021). That’s a troubling signal for future production and and limits the scope for a persistent upswing in capex.
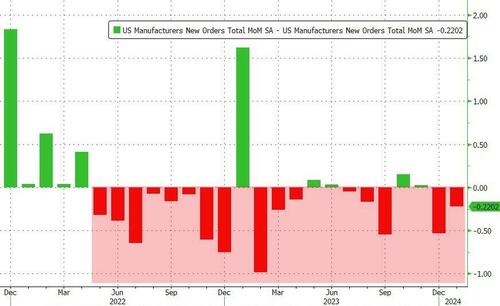
NOTE: It's that same old issue again, downward revisions!! In the last 21 months, US factory orders have been downwardly revised 17 times! (A reverse "Madoff Channel"?)
| |
|
JOLTS:
- Job openings for February came in more-or-less inline at 8.756mln (exp. 8.75mln), although January’s was revised lower to 8.748mln from 8.863mln, with the quits rate unchanged at 2.2%, albeit the prior months was revised higher from 2.1%, which was the post-COVID low.
- As Oxford Economics illustrates, the data is consistent with a labor market that is still quite healthy, easing concerns among Fed officials about the downside risks to the economy from taking a patient approach toward rate cuts.
- On the quits rate, it is still below pre-pandemic levels and consistent with the consultancy's view of gradually easing wage growth to a pace compatible with the Fed's inflation target of 2%.
| |
|
GLOBAL MACRO
WHAT DOES YOUR SCAN OF THE DATA BELOW TELL YOU? - THE MEDIA AVOIDS BAD NEWS!
We present the data in a way you can quickly see what is happening.
THIS WEEK WE SAW
Exp=Expectations, Rev=Revision, Prev=Previous
| |
|
UNITED STATES
- US S&P Global Manufacturing PMI Final (Mar) 51.9 (Prev. 52.5)
- US ISM Manufacturing PMI (Mar) 50.3 vs. Exp. 48.4 (Prev. 47.8)
- US ISM Manufacturing Prices Paid (Mar) 55.8 vs. Exp. 52.7 (Prev. 52.5)
- US ISM Manufacturing New Orders Index (Mar) 51.4 (Prev. 49.2)
- US ISM Manufacturing Employment Index (Mar) 47.4 (Prev. 45.9)
- US Construction Spending MM (Feb) -0.3% vs. Exp. 0.7% (Prev. -0.2%)
- Atlanta Fed GDPNow (Q1) 2.8% (prev. 2.3% on March 29th)
- US Factory Orders MM (Feb) 1.4% vs. Exp. 1.0% (Prev. -3.6%, Rev. -3.8%)
- US JOLTS Job Openings (Feb) 8.756M vs. Exp. 8.75M (Prev. 8.863M, Rev. 8.748M), quits rate 2.2% (prev. 2.1%, Rev. 2.2%).
- US S&P Global Services PMI Final (Mar) 51.7 (Prev. 51.7)
- US S&P Global Composite Final PMI (Mar) 52.1 (Prev. 52.2)
- US ISM Non-Manufacturing PMI (Mar) 51.4 vs. Exp. 52.7 (Prev. 52.6)
- US ISM Non-Manufacturing Prices Paid Index (Mar) 53.4 (Prev. 58.6)
- US ISM Non-Manufacturing Employment Index (Mar) 48.5 (Prev. 48.0)
- US ISM Non-Manufacturing New Orders Index (Mar) 54.4 (Prev. 56.1)
- US ADP National Employment (Mar) 184k vs. Exp. 148k (Prev. 140k, Rev. 155k)
- US Initial Jobless Claims 221k vs. Exp. 214k (Prev. 210k, Rev. 212k)
- US Continued Jobless Claims 1.791M vs. Exp. 1.813M (Prev. 1.819M, Rev. 1.810M)
- US Challenger Layoffs (Mar) 90.309k (Prev. 84.638k)
- US International Trade (USD)(Feb) -68.9B vs. Exp. -67.3B (Prev. -67.4B, Rev. -67.6B)
CHINA
- Chinese Manufacturing PMI (Mar) 50.8 vs Exp. 49.9 (Prev. 49.1)
- Chinese Non-Manufacturing PMI (Mar) 53.0 vs Exp. 51.3 (Prev. 51.4)
- Chinese Composite PMI (Mar) 52.7 (Prev. 50.7)
- Chinese Caixin Manufacturing PMI Final (Mar) 51.1 vs. Exp. 51.0 (Prev. 50.9)
JAPAN
- Japanese All Household Spending MM (Feb) 1.4% vs. Exp. 0.5% (Prev. -2.1%); YY (Feb) -0.5% vs. Exp. -3.0% (Prev. -6.3%)
- Australian Trade Balance (AUD)(Feb) 7.3B vs Exp. 10.5B (Prev. 11.0B)
UK
- UK BRC Shop Price Inflation (Mar) Y/Y 1.3% vs. Exp. 2.2% (prev. 2.5%); lowest level in more than two years
- UK S&P Global Manufacturing PMI (Mar) 50.3 vs. Exp. 49.9 (Prev. 49.9)
- UK Mortgage Approvals (Feb) 60.383k vs. Exp. 56.5k (Prev. 55.227k, Rev. 56.087k); BOE Consumer Credit (Feb) 1.378B GB vs. Exp. 1.6B GB (Prev. 1.877B GB, Rev. 1.77B GB); M4 Money Supply (Feb) 0.5% (Prev. -0.1%); Mortgage Lending (Feb) 1.51B GB vs. Exp. -0.15B GB (Prev. -1.086B GB, Rev. -1.073B GB)
- UK BRC Shop Price Inflation (Mar) Y/Y 1.3% vs. Exp. 2.2% (prev. 2.5%); lowest level in more than two years.
- UK Nationwide house price MM (Mar) -0.2% vs. Exp. 0.3% (Prev. 0.7%); Nationwide house price YY (Mar) 1.6% vs. Exp. 2.4% (Prev. 1.2%)
- UK S&P Global Manufacturing PMI (Mar) 50.3 vs. Exp. 49.9 (Prev. 49.9)
- UK S&P Global Services PMI (Mar) 53.1 vs. Exp. 53.4 (Prev. 53.4)
- UK S&P Global Composite PMI (Mar) 52.8 vs. Exp. 52.9 (Prev. 52.9)
- UK S&P Construction PMI (Mar) 50.2 vs. Exp. 50 (Prev. 49.7)
| |  |
|
EU
- EU HCOB Manufacturing Final PMI (Mar) 46.1 vs. Exp. 45.7 (Prev. 45.7)
- EU HCOB Manufacturing Final PMI (Mar) 46.1 vs. Exp. 45.7 (Prev. 45.7)
- EU HICP Flash YY (Mar) 2.4% vs. Exp. 2.6% (Prev. 2.6%)
- EU HICP-X F&E Flash YY (Mar) 3.1% vs. Exp. 3.2% (Prev. 3.3%)
- EU Unemployment Rate (Feb) 6.5% vs. Exp. 6.4% (Prev. 6.4%, Rev. 6.5%)
- EU HCOB Services Final PMI (Mar) 51.5 vs. Exp. 51.1 (Prev. 51.1)
- EU HCOB Composite Final PMI (Mar) 50.3 vs. Exp. 49.9 (Prev. 49.9)
- EU Producer Prices MM (Feb) -1.0% vs. Exp. -0.7% (Prev. -0.9%)
- EU Producer Prices YY (Feb) -8.3% vs. Exp. -8.6% (Prev. -8.6%, Rev. -8.0%)
- EU HCOB Construction PMI (Mar) 42.4 (Prev. 42.9); German HCOB Construction PMI (Mar) 38.3 (Prev. 39.1)
- EU Retail Sales YY (Feb) -0.7% vs. Exp. -1.3% (Prev. -1.0%, Rev. -0.9%); MM (Feb) -0.5% vs. Exp. -0.4% (Prev. 0.1%, Rev. 0.0%)
GERMANY
- German North Rhine-Westphalia State CPI YY (Mar) 2.3% (Prev. 2.6%); core Y/Y 3.2% vs. prev. 3.4%, M/M 0.5%; German regional inflation numbers came in cooler than the prior and within proximity to expectations for the mainland release at 13:00BST. Overall, the reaction was a modestly dovish one.
- German HCOB Manufacturing PMI (Mar) 41.9 vs. Exp. 41.6 (Prev. 41.6)
- German CPI Prelim MM (Mar) 0.4% vs. Exp. 0.6% (Prev. 0.4%)
- German CPI Prelim YY (Mar) 2.2% vs. Exp. 2.2% (Prev. 2.5%)
- German HICP Prelim MM (Mar) 0.6% vs. Exp. 0.7% (Prev. 0.6%)
- German HICP Prelim YY (Mar) 2.3% vs. Exp. 2.4% (Prev. 2.7%)
- German HCOB Manufacturing PMI (Mar) 41.9 vs. Exp. 41.6 (Prev. 41.6)
- German HCOB Services PMI (Mar) 50.1 vs. Exp. 49.8 (Prev. 49.8)
- German HCOB Composite Final PMI (Mar) 47.7 vs. Exp. 47.4 (Prev. 47.4)
- German Industrial Orders MM (Feb) 0.2% vs. Exp. 0.8% (Prev. -11.3%, Rev. -11.4%)
- German Import Prices MM (Feb) -0.2% vs prev. 0.00% (exp. 0.00%); YY (Feb) -4.9% vs. Exp. -4.6% (Prev. -5.9%)
FRANCE
- French HCOB Manufacturing PMI (Mar) 46.2 vs. Exp. 45.8 (Prev. 45.8)
ITALY
- Italian HCOB Manufacturing PMI (Mar) 50.4 vs. Exp. 48.8 (Prev. 48.7)
SPAIN
- Spanish HCOB Manufacturing PMI (Mar) 51.4 vs. Exp. 51.0 (Prev. 51.5)
SWITZERLAND
- Swiss Manufacturing PMI (Mar) 45.2 vs. Exp. 44.9 (Prev. 44.0)
- Swiss Retail Sales YY (Feb) -0.2% (Prev. 0.3%)
- Swiss Manufacturing PMI (Mar) 45.2 vs. Exp. 44.9 (Prev. 44.0)
- Swiss Retail Sales YY (Feb) -0.2% (Prev. 0.3%)
AUSTRALIA
- Australian Building Approvals (Feb) -1.9% vs. Exp. 3.3% (Prev. -1.0%, Rev. -2.5%)
- Australian Exports MM (Feb) -2.2% (Prev. 1.6%); Imports MM (Feb) 4.8% (Prev. 1.3%)
NEW ZEALAND
- New Zealand ANZ Commodity Price MM -1.3% (Prev. 3.5%, Rev. 3.6%)
| |
CURRENT MARKET PERSPECTIVE | |
|
ENERGY, GOLD, BITCOIN SENDING
A CLEAR MESSAGE
POLITICAL WEAPONIZATION OF THE DOLLAR IS AN INCREASING WORRY!
Click All Charts to Enlarge
| |
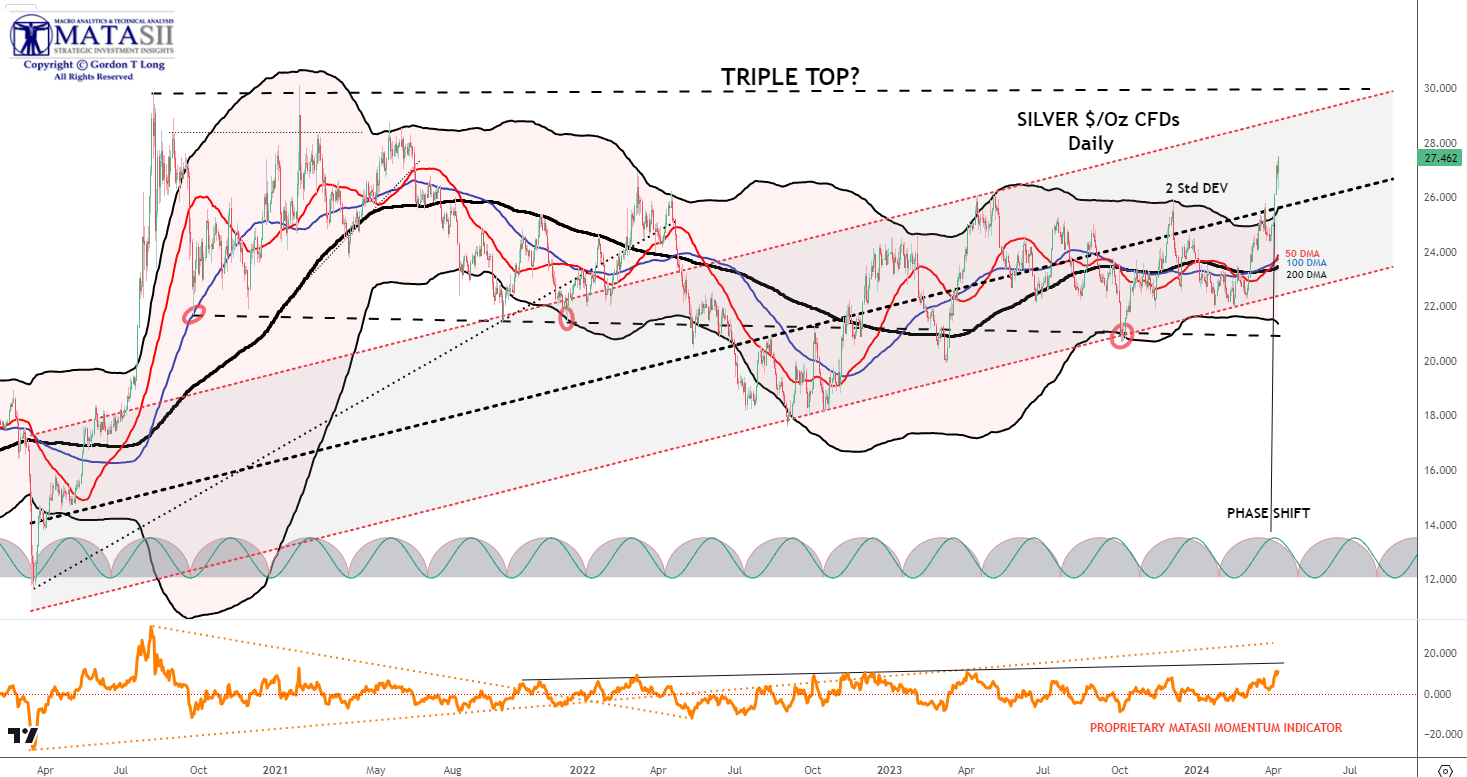
SILVER: Is Silver about to follow Gold (and other Inflation hedges) to new highs?? | |
|
1 - SITUATIONAL ANALYSIS
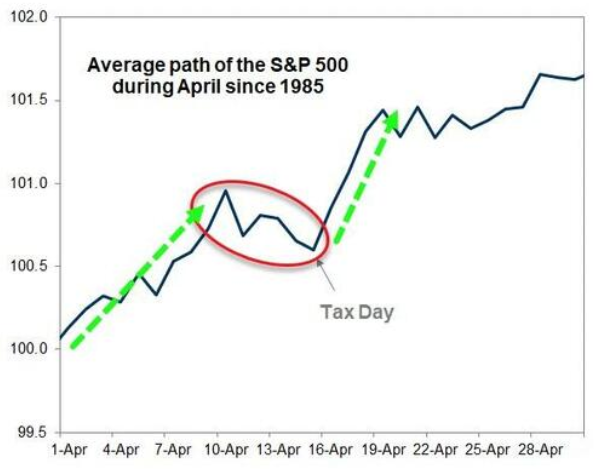
US TAX DAY April 15th: Seasonality will likely come into play here as the retail community tends to sell stocks into 4/15 to raise cash for these payments. Post payments we have historically seen a bullish trend develop.
Seasonality Says:
LONG until April 9th - Then SELL - LONG Again After April 15th
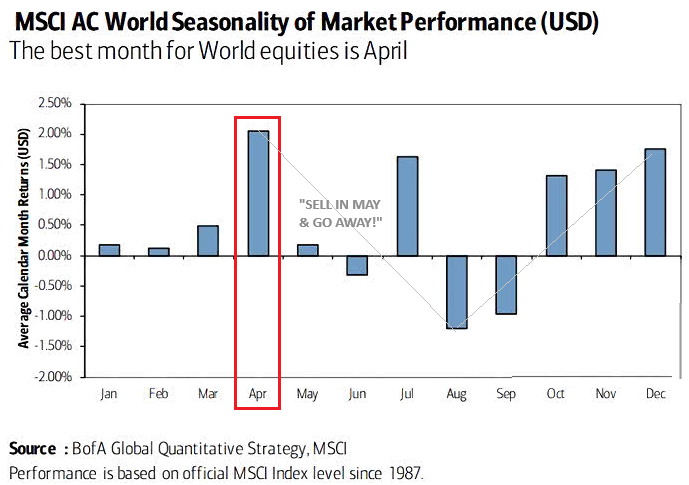
CHART TOP RIGHT: April is normally considered the most favorable month in the world for equities!
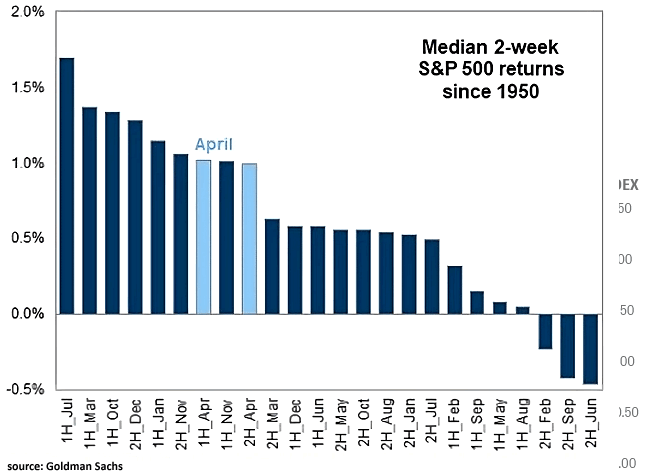
CHART BOTTOM RIGHT: The first two weeks and the last two weeks of April have historically been seasonality quite strong
CHART BELOW: Tax Day could Trigger some tradable volatility? Remember the market moving CPI is Wednesday 04/10 proceeding Tax Day on 04/15.
| |
|
|
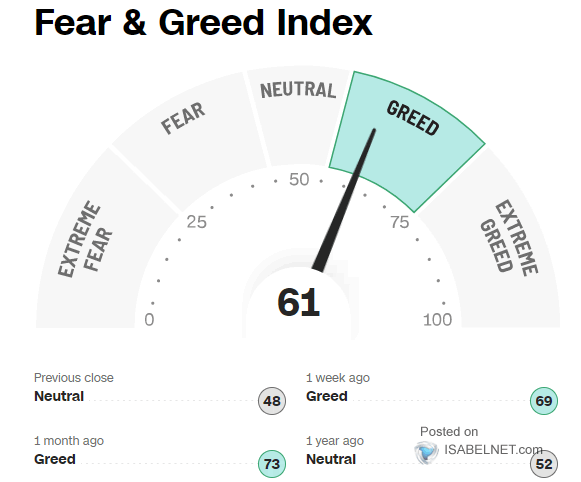
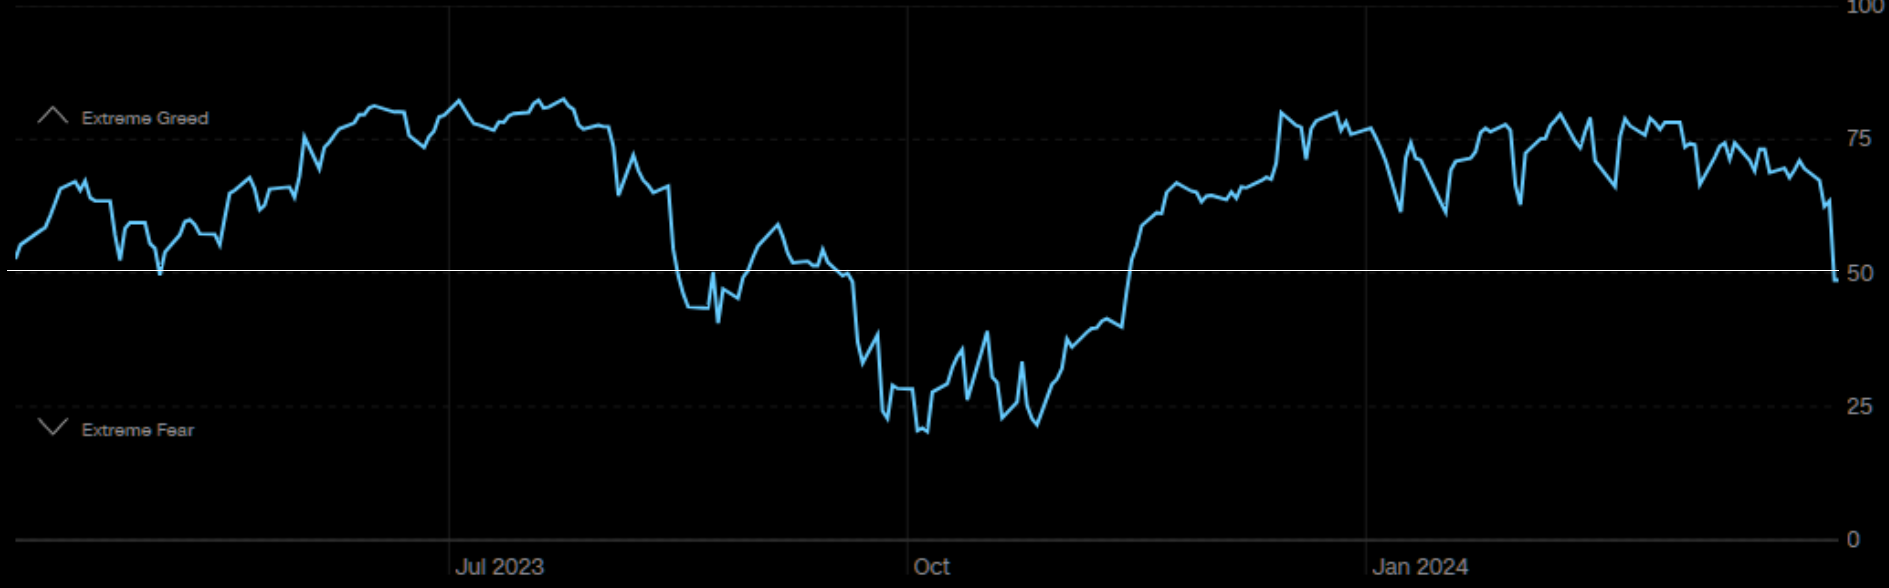
SENTIMENT MAY BE "ADJUSTING"?
We have seen some degree of market weakness over the last week as the S&P 500 tested the 21 DMA for support. It appears that increasing numbers of investors are nervous about some degree of pullback after a historic run-up without any real corrective consolidation.
The Fear & Greed Index reflects this as it has lowered quite noticeably though registering a Greed reading (chart right).
CHART BELOW
Another measure of sentiment shows we are back in neutral territory in measuring extreme Greed versus Extreme Fear. Is a Fear Shock about to kick in, at least temporarily??
| |
|
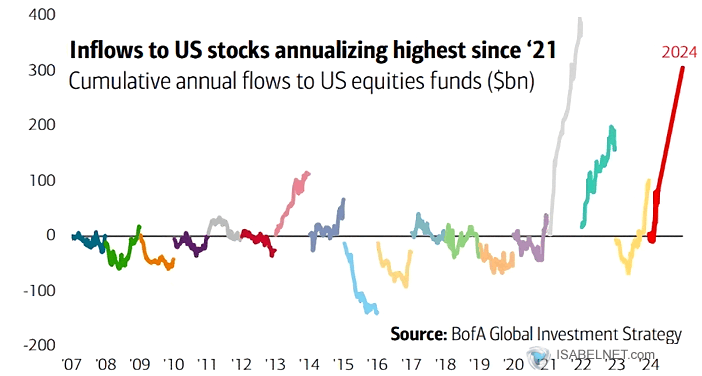
2 - FUNDAMENTAL ANALYSIS
Investor appetite for equities remains strong, driven by confidence in earnings growth matching improving longer term economic growth estimates (chart right).
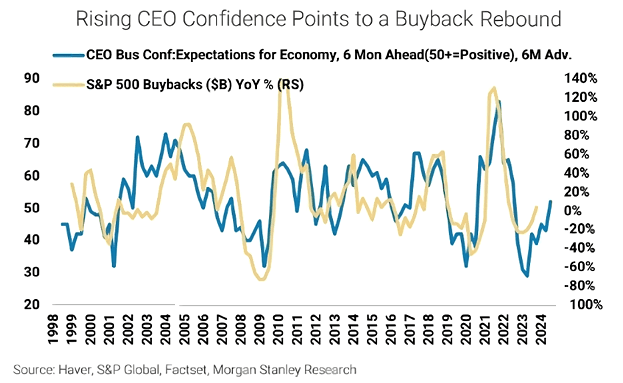
CEO'S INCREASING MORE CONFIDENT!
Any potential corrective / consolidation is to likely be short lived since CEO's are becoming increasingly more confidence with earnings outlooks looking strong. Typically this has lead to increased buyback levels (see chart below).
NOTE: Corporate Buybacks are in a closed window due to pending Q1 earnings releases.
| |
|
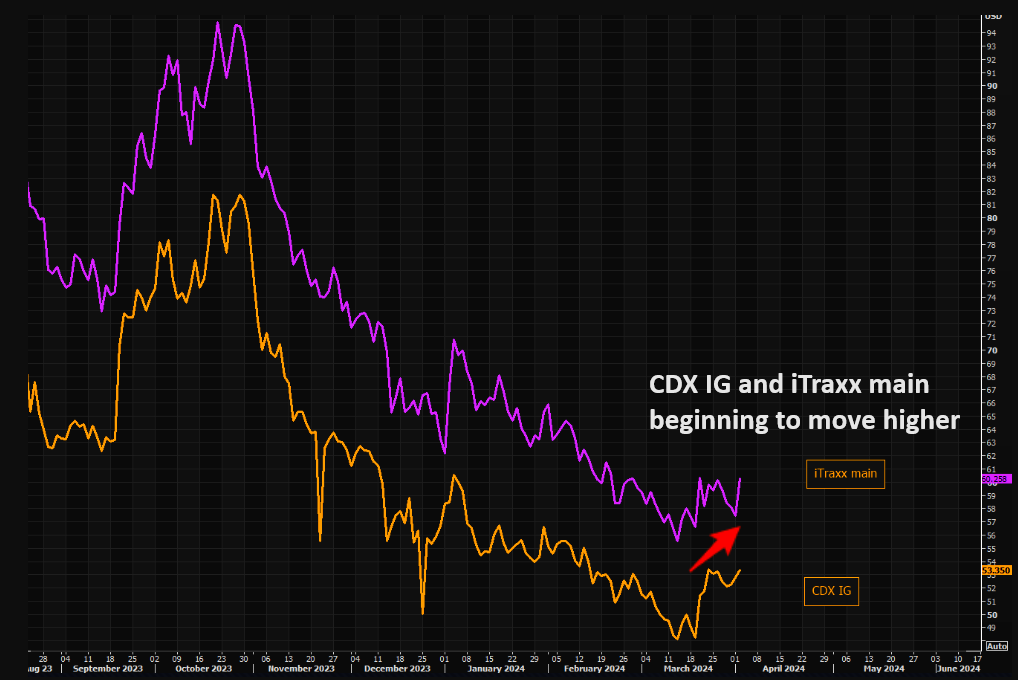
CREDIT MARKETS
Since Credit always leads markets, we are watching it closely. This includes:
- Inverted yield curves
- Negative swap spreads
- Collateral shortages
- Tightening of credit standards by banks and
- Reduced commercial lending
- The High Yield Corporate "JNK" Market. (BELOW)
CREDIT RISK PROTECTION IS GETTING MORE EXPENSIVE
As the chart to the right indicates, CDX IG and iTraax are to have bottomed and have turned up.
| |
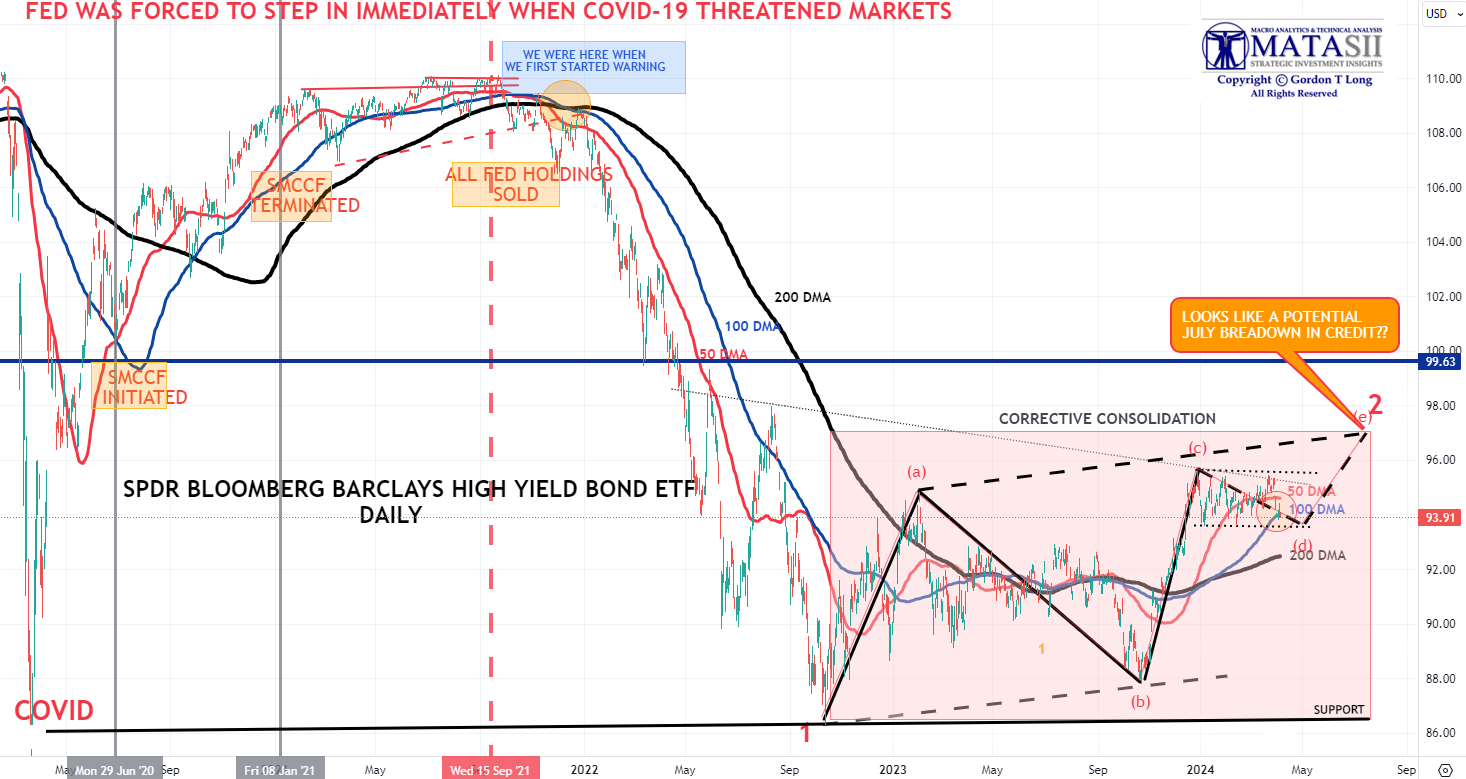
THE HIGH YIELD CORPORATE "JNK" MARKET
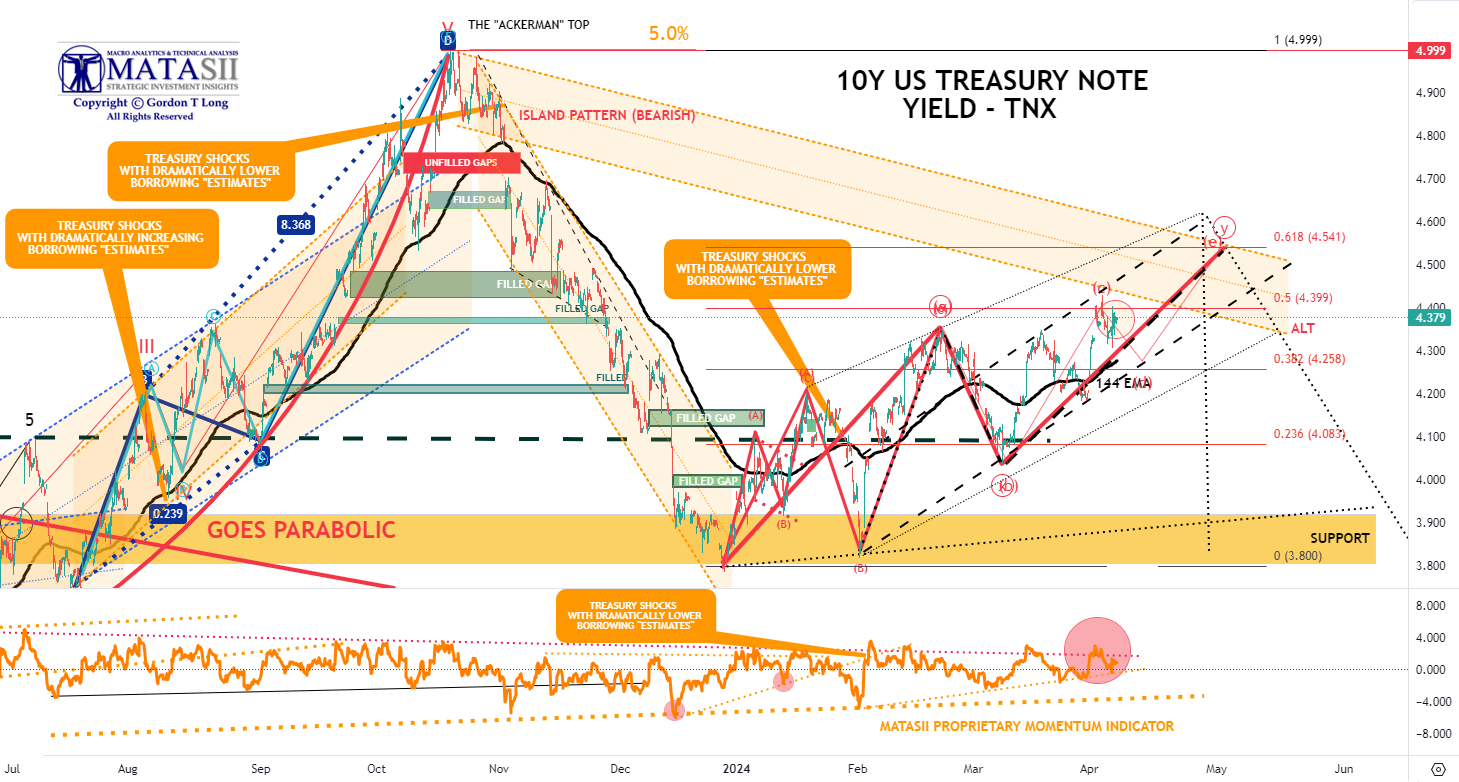
There is a strong technical patterns on 2-year, 10-year, and 30-year US Treasuries showing an Ascending Triangle, all suggesting yields are heading higher (chart right).
This appears to match the HY Credit Markets which show a possible approaching conclusion to their major corrective consolidation. The technical Ascending Triangle (ABCDE) in the JNK suggests this may be completed over the next 90 days (chart below)
| |
YOUR DESKTOP / TABLET / PHONE ANNOTATED CHART
Macro Analytics Chart Above: SUBSCRIBER LINK
| |
3 - TECHNICAL ANALYSIS
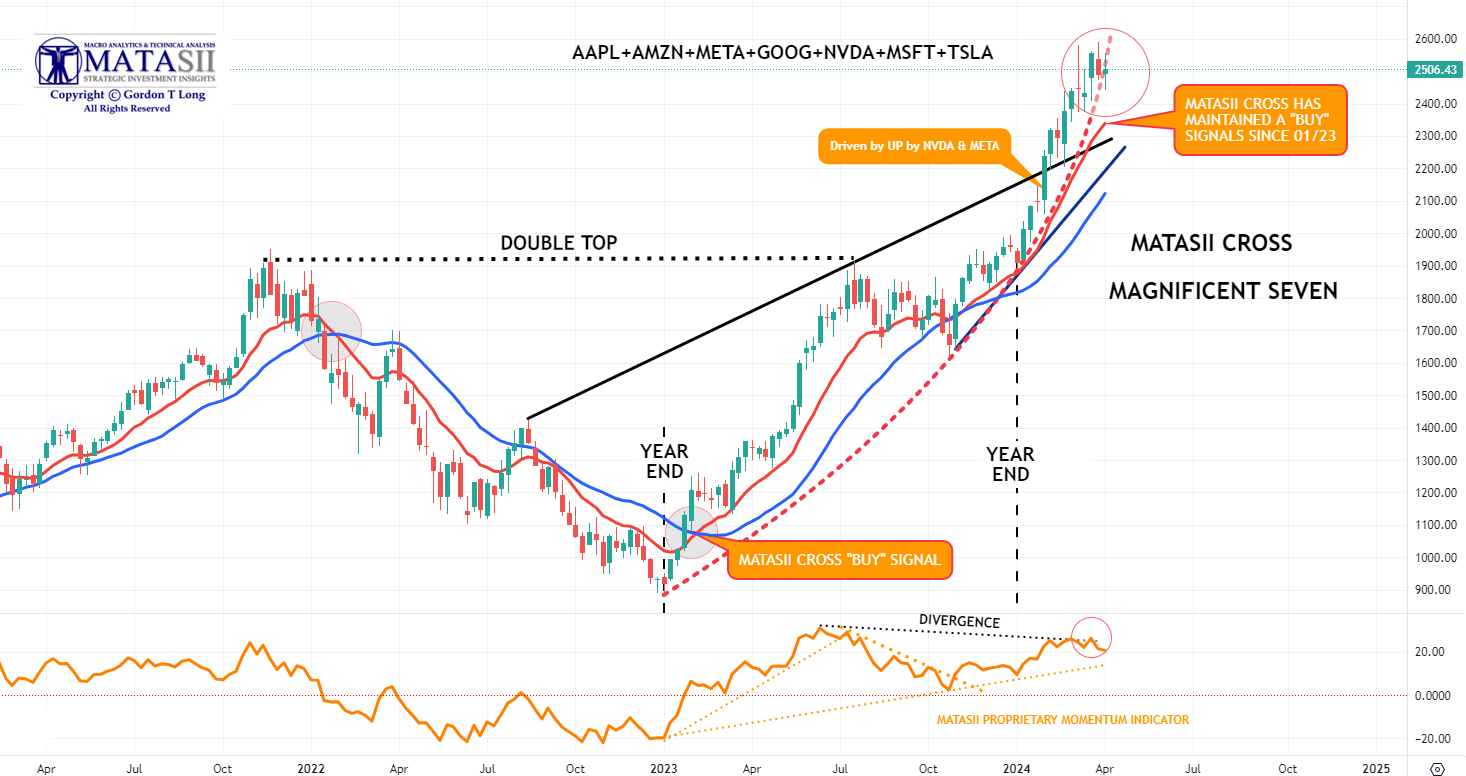
THE HEADLINE MARKET: MAGNIFICENT 7
- We are reaching the vertical lift part of the parabolic (geometric) lift shown by the dashed red line.
- We have intermediate term Divergence with momentum (bottom pane).
- In the short term Momentum appears to be rolling over (bottom pane).
MATASII CROSS: WEEKLY - CONTINUES TO SIGNAL A MAG-7 BUY
| |
YOUR DESKTOP / TABLET / PHONE ANNOTATED CHART
Macro Analytics Chart Above: SUBSCRIBER LINK
| |
|
"CURRENCY" MARKET (Currency, Gold, Black Gold (Oil) & Bitcoin)
CONTROL PACKAGE
There are EIGHT charts we have outlined in prior chart packages which we will continue to watch closely as a CURRENT "control set".
-
US DOLLAR -DXY - MONTHLY (CHART LINK)
-
US DOLLAR - DXY - DAILY (CHART LINK)
-
GOLD - DAILY (CHART LINK)
-
GOLD cfd's - DAILY (CHART LINK)
-
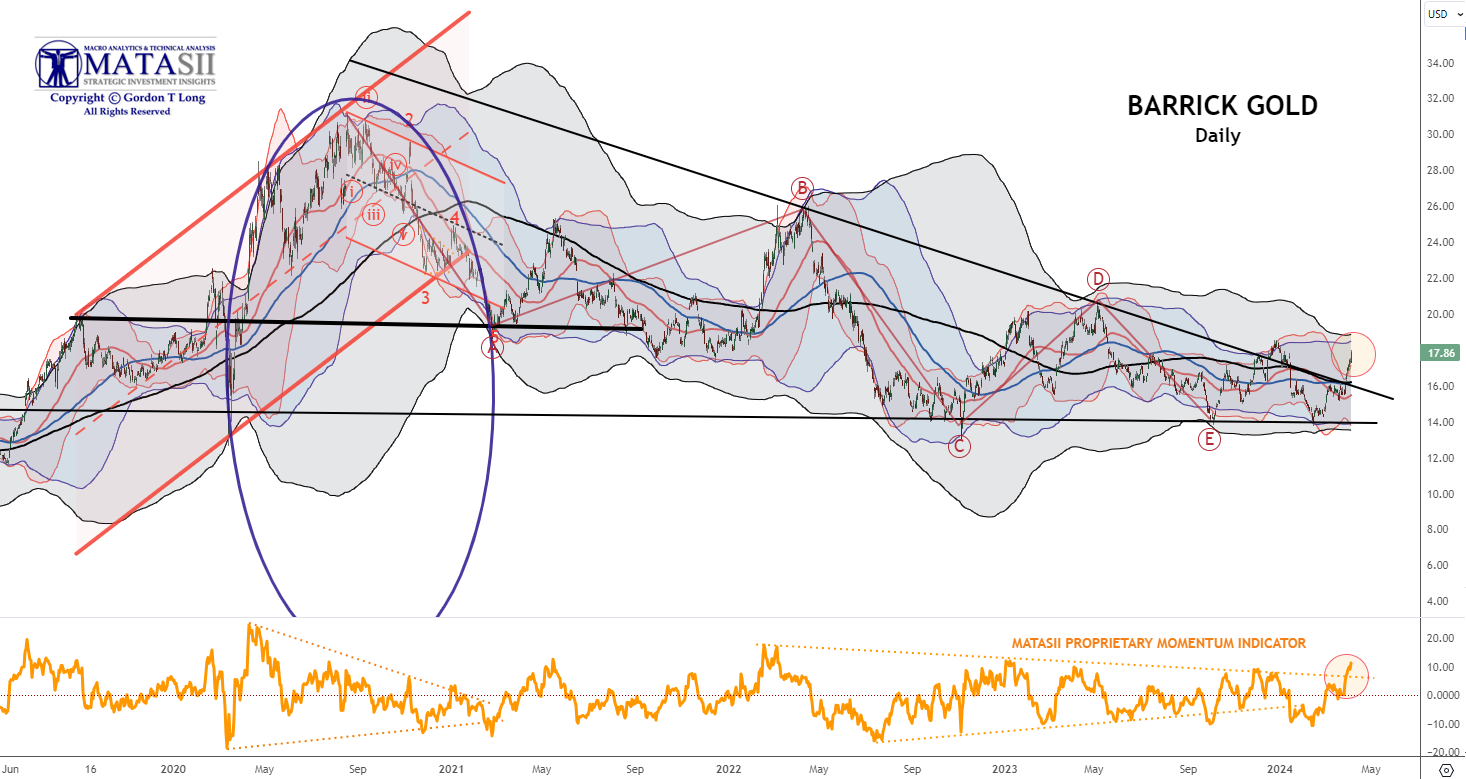
GOLD - Integrated - Barrick Gold (CHART LINK)
-
OIL - XLE - MONTHLY (CHART LINK)
-
OIL - WTIC - MONTHLY - (CHART LINK)
-
BITCOIN - BTCUSD -WEEKLY (CHART LINK)
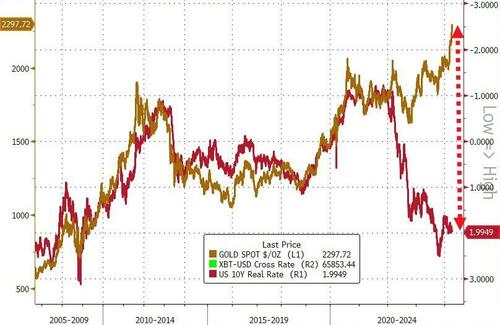
CHART ABOVE RIGHT
As gold pushes to higher & higher record highs (in USD terms), Real yields refuse to play along?? I side with BoAML's Michael Hartnett and believe that what we are seeing is Gold aggressively discounting a coming collapse in Real Rates.
GOLD cfd's - DAILY
The 3 Std Deviation band for Gold has gone almost vertical with Gold prices tracking it!! Frankly, in over 40 years I don't believe I have seen this technically occur with a 3 Std Dev in Gold? Something is either broken, panic has set in somewhere or there is an "elephant(s)" now playing the market?
|  | |
YOUR DESKTOP / TABLET / PHONE ANNOTATED CHART
Macro Analytics Chart Above: SUBSCRIBER LINK
| |
INTEGRATED GOLD MINERS
We have a close eye on Gold and the INTEGRATED GOLD MINERS as represented by Barrick Gold. Barrick which broken out of its long term declining overhead resistance trend. It is likely time to be adding to your Gold and Silver positions on pullback opportunities.
| |
|
YOUR DESKTOP / TABLET / PHONE ANNOTATED CHART
Macro Analytics Chart Above: SUBSCRIBER LINK
| |
|
US EQUITY MARKETS
CONTROL PACKAGE
There have FIVE charts we have outlined in prior chart packages that we will continue to watch closely as a CURRENT "control set".
- The S&P 500 (CHART LINK)
- The DJIA (CHART LINK)
- The Russell 2000 through the IWM ETF (CHART LINK),
- The MAGNIFICENT SEVEN (CHART ABOVE WITH MATASII CROSS - LINK)
- Nvidia (NVDA) (CHART LINK)
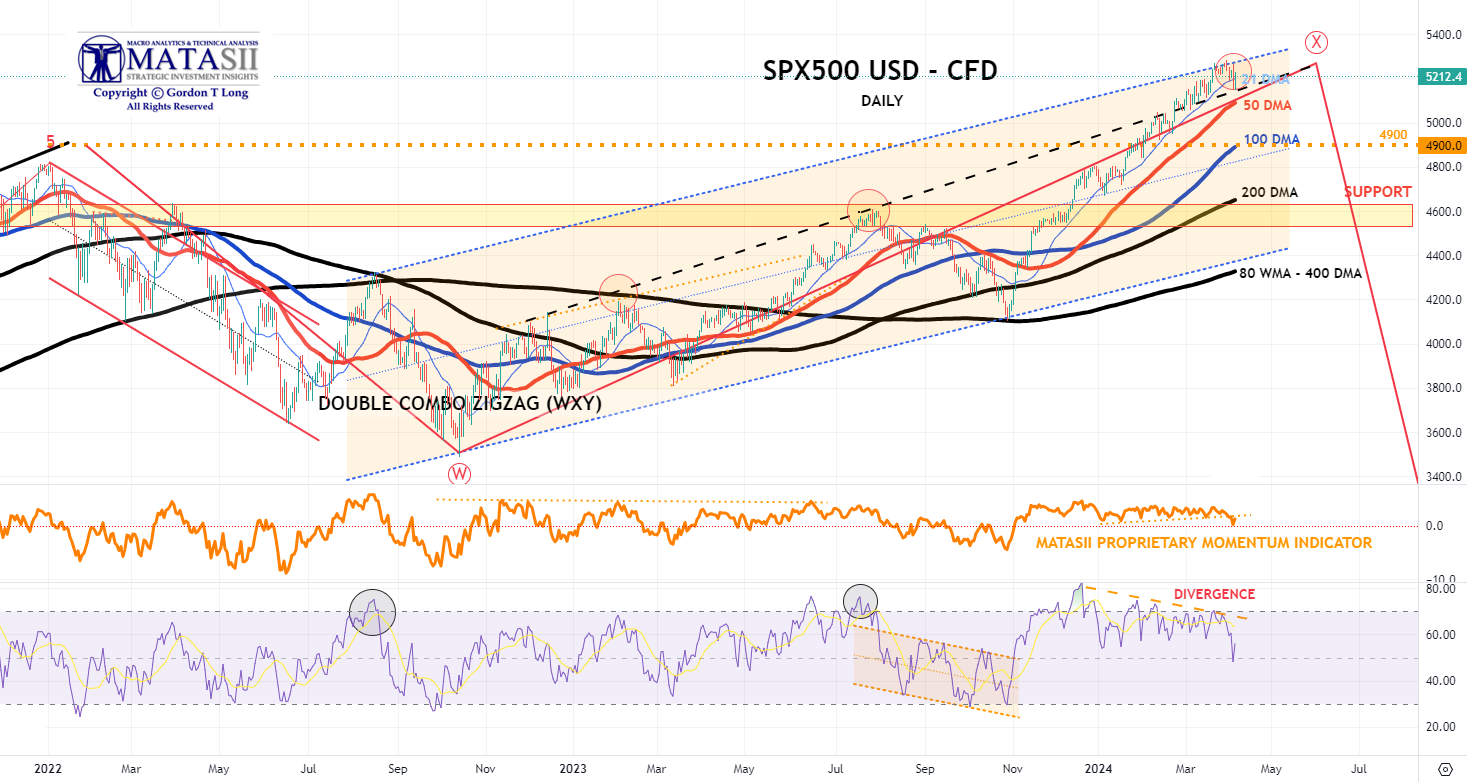
S&P 500 CFD
| |
YOUR DESKTOP / TABLET / PHONE ANNOTATED CHART
Macro Analytics Chart Above: SUBSCRIBER LINK
| |
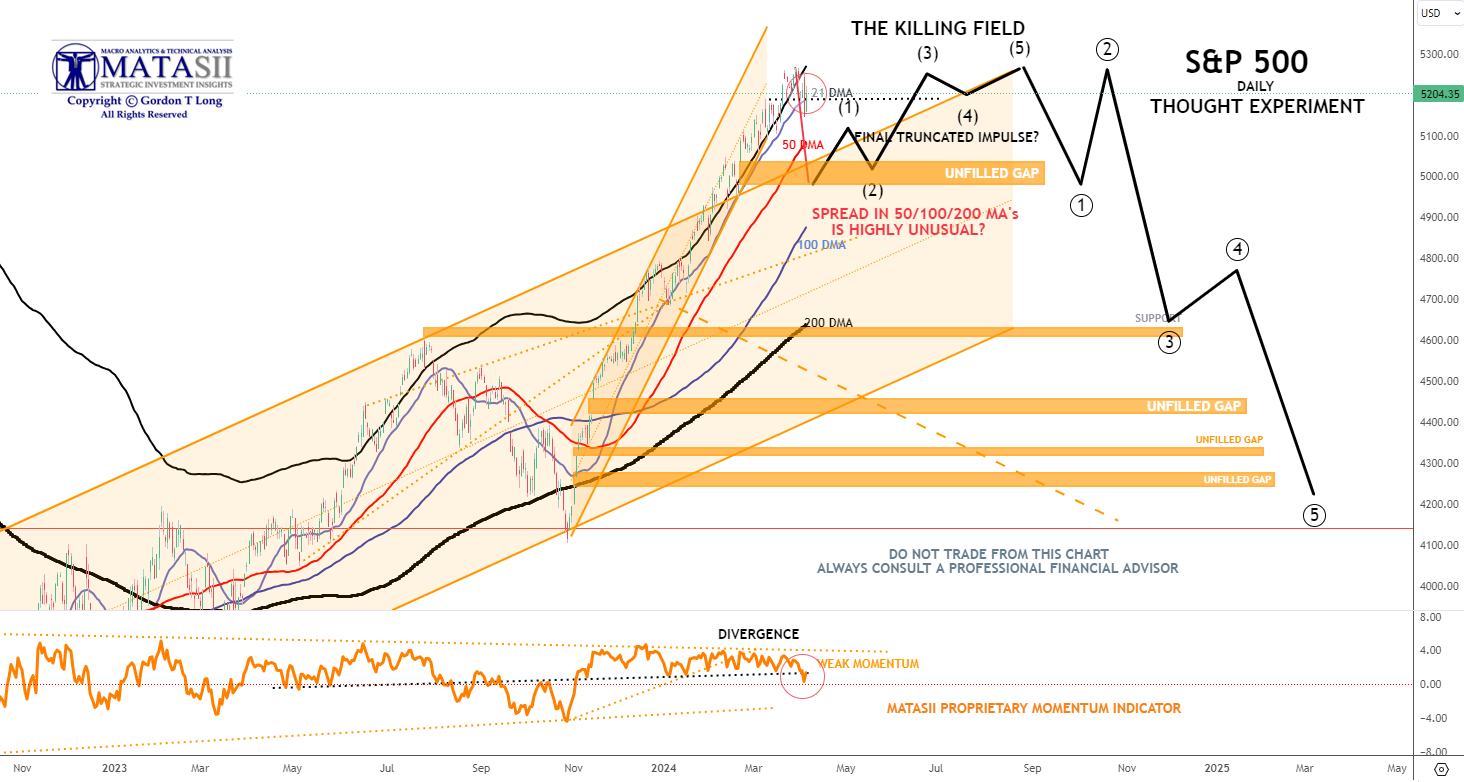
S&P 500 - Daily - Our Though Experiment
Our Though Experiment, which we have discussed previously, suggests we have put in a near term top (or very close to it) and will now consolidate before possibly completing one final small impulse higher or put in a 1-2 Wave of a much higher degree.
NOTE: To reiterate what I previously wrote - "the black labeled activity shown below, between now and July, looks like a "Killing Field" where the algos take Day Traders, "Dip Buyers", "Gamma Guys" and FOMO's all out on stretchers!"
| |
YOUR DESKTOP / TABLET / PHONE ANNOTATED CHART
Macro Analytics Chart Above: SUBSCRIBER LINK
| |
STOCK MONITOR: What We Spotted
| |
BOND MARKET
CONTROL PACKAGE
There have FIVE charts we have outlined in prior chart packages that we will continue to watch closely as a CURRENT "control set".
- The 10Y TREASURY NOTE YIELD - TNX - HOURLY (CHART LINK)
- The 10Y TREASURY NOTE YIELD - TNX - DAILY (CHART LINK)
- The 10Y TREASURY NOTE YIELD - TNX - WEEKLY (CHART LINK)
- The 30Y TREASURY BOND YIELD - TNX - WEEKLY (CHART LINK)
- REAL RATES (CHART LINK)
- FISHER'S EQUATION = 10Y Yield = 10Y INFLATION BE% +REAL % = 2.382% + 1.976% = 4.358%
As rate-cut expectations fell from 6 this year to 3, Treasury yields rose... non-stop... all week with the belly of the curve underperforming (5Y yields up 28bps on the week). Yields all ended back up near their year-to-date highs.
| |
YOUR DESKTOP / TABLET / PHONE ANNOTATED CHART
Macro Analytics Chart Above: SUBSCRIBER LINK
| |
NOTICE Information on these pages contains forward-looking statements that involve risks and uncertainties. Markets and instruments profiled on this page are for informational purposes only and should not in any way come across as a recommendation to buy or sell in these assets. You should do your own thorough research before making any investment decisions. MATASII.com does not in any way guarantee that this information is free from mistakes, errors, or material misstatements. It also does not guarantee that this information is of a timely nature. Investing in Open Markets involves a great deal of risk, including the loss of all or a portion of your investment, as well as emotional distress. All risks, losses and costs associated with investing, including total loss of principal, are your responsibility.
FAIR USE NOTICE This site contains copyrighted material the use of which has not always been specifically authorized by the copyright owner. We are making such material available in our efforts to advance understanding of environmental, political, human rights, economic, democracy, scientific, and social justice issues, etc. We believe this constitutes a ‘fair use’ of any such copyrighted material as provided for in section 107 of the US Copyright Law. In accordance with Title 17 U.S.C. Section 107, the material on this site is distributed without profit to those who have expressed a prior interest in receiving the included information for research and educational purposes. If you wish to use copyrighted material from this site for purposes of your own that go beyond ‘fair use’, you must obtain permission from the copyright owner.
========
| |
MATASII'S STRATEGIC INVESTMENT INSIGHTS | |
2020 VIDEOS OUTLINING THE COMING RISE IN INFLATION, STAGLFLATION & COMMODITY PRICES | |
IDENTIFICATION OF HIGH PROBABILITY TARGET ZONES | |
Learn the HPTZ Methodology!
Identify areas of High Probability for market movements
Set up your charts with accurate Market Road Maps
Available at Amazon.com
| |
The Most Insightful Macro Analytics On The Web | | | | |