|
Gordon T Long Research exclusively distributed at MATASII.com
Subscribe to Gordon T Long Research - $35 / Month - LINK
Complete MATASII.com Offerings - $55/Month - LINK
SEND YOUR INSIGHTFUL COMMENTS - WE READ THEM ALL - lcmgroupe2@comcast.net
| |
|
LONGWave - JUNE 2024
Technical Analysis - 06/17/24
| |
THE ADVANCING REGULATORY STATE
OBSERVATIONS: BIDEN'S POLL NUMBER ADJUSTED DOWN FOR INFLATION LIKE YOUR PAY CHECK!
When President Joe Biden was told by an interviewer that food prices are up 30 percent in four years, he completely dismissed it, countering with "American families have more money to spend!”
FACT CHECK
But that’s simply not true, and the Biden administration’s own data prove it. The average American worker’s weekly paycheck has risen about 14 percent under Biden, which is less than the 20 percent general inflation rate and even less than the 30 percent inflation rate for food, which is what Biden was specifically asked about.
Both the president and his lead economic advisor, Jared Bernstein, have fallaciously claimed in multiple interviews that inflation was 9 percent when Biden took office.
FACT CHECK
Again, the administration’s own data disprove this talking point. Inflation was only 1.4 percent at Biden’s inauguration.
When confronted with this fact, Bernstein redirected awkwardly with another falsehood that inflation, excluding food and energy prices, was at 9 percent in the second quarter of 2021.
FACT CHECK
Again, the Biden administration’s own data disproves this. The inflation Bernstein referenced, “core” inflation, was 3.7 percent at that time. Furthermore, Biden didn’t take office in the second quarter of 2021, but in the start of the first quarter. At that time, even the core inflation rate, which Bernstein referenced, was 1.4 percent – the same as the overall inflation rate.
Not to be dissuaded by the facts, Bernstein then pivoted to excusing the inflation rate entirely, claiming people are better off because their earnings are now rising faster than prices.
FACT CHECK
Apparently, Bernstein is completely unfamiliar with any statistics produced by his colleagues. In April — the most recent data available — prices rose faster than the average weekly paycheck. What that weekly paycheck can actually buy has fallen 4.4 percent since Biden took office, costing the typical American family thousands of dollars annually in lost purchasing power. Add in the additional borrowing costs from today’s higher interest rates, and that is thousands more in financial pain. ===>
| |
|
VIDEO PREVIEW (click image)
Pay-Per-View Page Link
|  | |
THIS WEEK WE SAW
Exp=Expectations, Rev=Revision, Prev=Previous
US
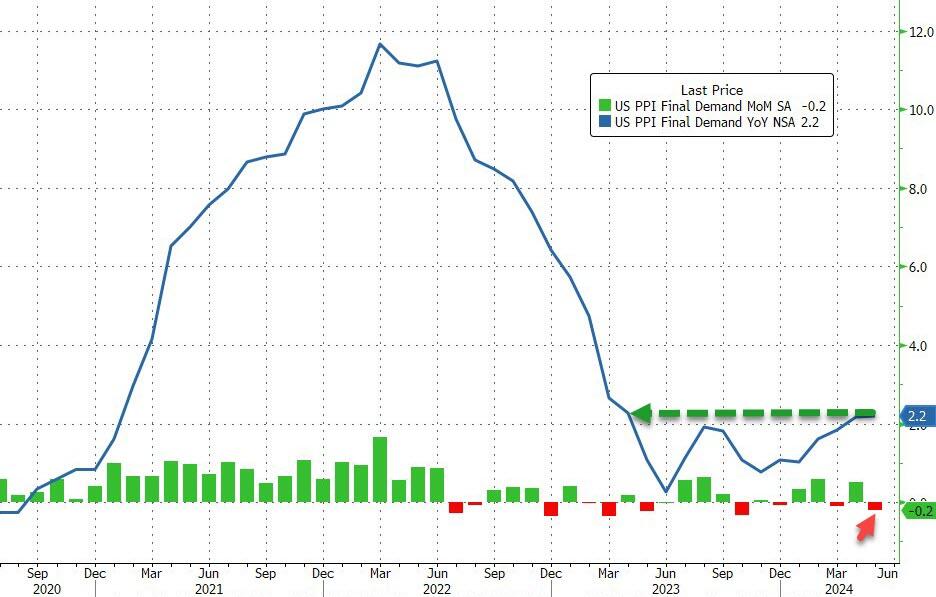
US PPI Final Demand MM (May) -0.2% vs. Exp. 0.1% (Prev. 0.5%)
US PPI Final Demand YY (May) 2.2% vs. Exp. 2.5% (Prev. 2.2%, Rev. 2.3%)
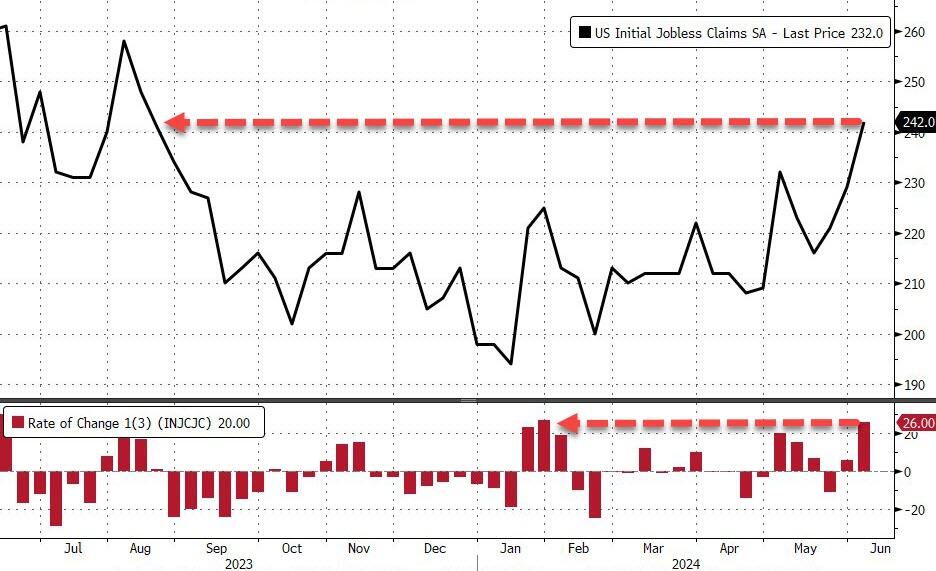
US Initial Jobless Claims w/e 242.0k vs. Exp. 225.0k (Prev. 229.0k)
US Continued Jobless Claims w/e 1.82M vs. Exp. 1.798M (Prev. 1.792M, Rev. 1.790M)
===> The combined effect has been the equivalent of reducing the typical American family’s annual income by $8,100.
But it seems no figures or statistics can change the mind of the political elites when it comes to inflation and how much Americans are hurting today. Never mind that the price of common foodstuffs like eggs, bread and peanut butter have risen 35 percent under Biden — the pain is all in your head.
The Biden administration’s and Big Media's dismissive attitude to the financial plight of the American people adds insult to injury. Nothing is more elitist than telling working-class folks that their problems are imaginary! Ask Marie Antoinette how that turned out for her?
American families have soured on Bidenomics, not because of rhetoric, but because of reality. The spendthrift policies of this administration and its congressional allies have created a cost-of-living crisis, which is why millions of Americans are demanding a change in direction.
Much like the average weekly paycheck, you might conclude that the president’s poll numbers have been adjusted down for inflation.
| |
========================= | |
|
WHAT YOU NEED TO KNOW!
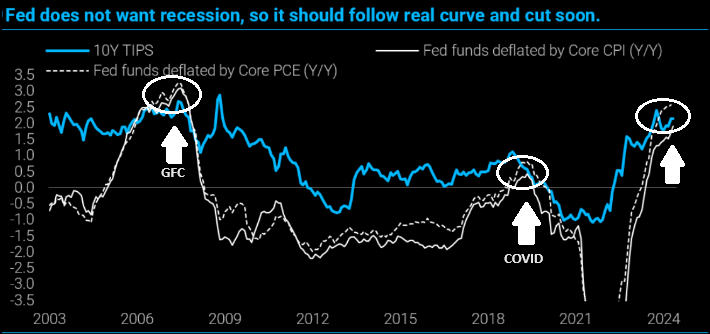
REAL RATES v POTENTIAL RECESSIONS
The disinflation in May CPI is overstated relative to real growth in activity, and lower goods prices only spur activity by raising real wages in a full employment economy. Nevertheless, the core pace has settled around 3.5%, low enough for the Fed to cut 50BP off the funds rate, at least. This should be done sooner rather than later, given the Fed's stated bias to avoid recession.
RESEARCH
MID YEAR UPDATES TO THIS YEAR'S ANNUAL THESIS PAPER
THE REGULATORY STATE
RELEASED - 01-17-24 --- 212 Page Paper
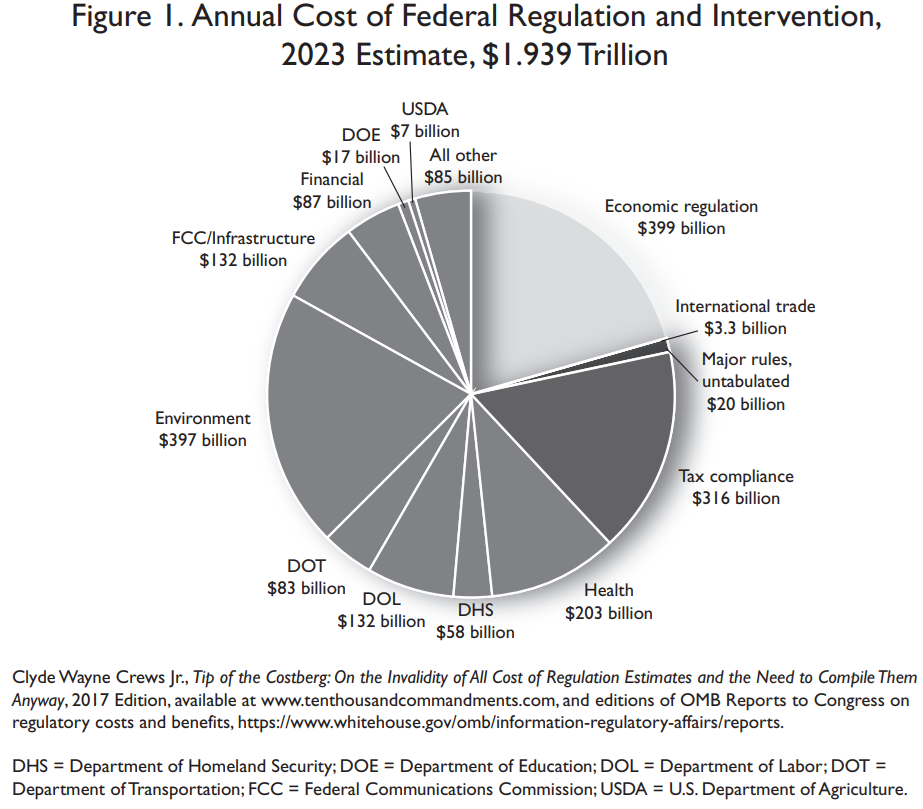
CRUSHING COST OF REGULATIONS - The Hidden Financial Numbers Exposed
- During calendar year 2022, while agencies issued 3168 rules, Congress enacted 247 laws. Thus, agencies issued 13 rules for every law enacted by Congress.
- Since January 2021, the Biden Administration finalized 923 federal rules costing $1.6T.
- The Biden Administration finalized regulations imposing costs of over $1 trillion in just the last few months as agencies rush to protect their regulatory actions from possible rollback measures in the event that Biden loses the 2024 election.
THE EXPLODING COST OF WASHINGTON'S BUREAUCRATIC OVERREACH
- Since 2009, more than 5,300 regulations have been finalized that are expected to cost $2.6 trillion in present and future costs.
- The recent JCNF report confirms what was already clear from the regulatory tsunami unleashed by the Biden administration. The president is weaponizing agencies’ regulatory authority and bypassing the legislative process in favor of heavy-handed rulemaking, which has become the hallmark of this administration.
- The Loper Bright legal case presents the opportunity for the Supreme Court to restore the separation of powers, rein in the federal bureaucracy, and give Americans a voice by returning the power to Congress to approve major or costly regulatory changes.
CHEVRON DEFERENCE DOCTRINE - The Litigation To Stop Government Over-Reach
- The impact of the Chevron Doctrine on small businesses is clearly demonstrated in the Loper Bright v. Raimondo case currently before the Supreme Court. In that case, a group of family-run fishing businesses are challenging a costly federal rule that required them to pay for third-party monitors that cost up to $700 per day per ship, amounting to up to 20% of a ship’s take-home pay. Fortunately, the Loper Bright case presents an opportunity for the Supreme Court to rein in this kind of unconstitutional overreach by the regulatory state.
- “I don’t want to say that Chevron is responsible for all the ills of the modern administrative state, just most of them.”
| |
|
DEVELOPMENTS TO WATCH
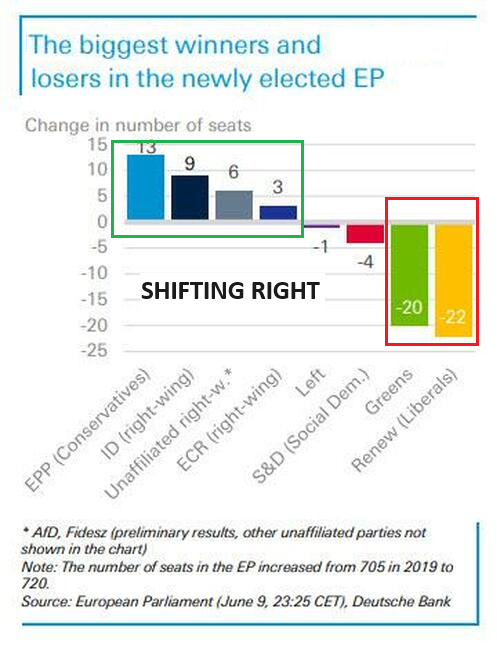
US WARNINGS FROM EU ELECTIONS
- A decided shift to the right which will likely be more exaggerated in the National Elections.
- Shift shows some national leaders may be in trouble.
- Immigration and Security mounting problem.
BIDEN'S EXECUTIVE BORDER ORDER MISLEADING
ACCORDING TO GOLDMAN SACHS & US BORDER PATROL
"The ultimate effect would be a fraction of this as most affected immigrants would likely attempt other modes of entry. Legal challenges to the new rules might even block implementation altogether." Goldman Sachs
Even if it was working as advertised, it would still admit 1.8 million illegals per year. Plus a massive carveout exempting all those whose home countries — like China and Venezuela — won’t accept them back.
NOTE: Over 150,000 people from those two nations alone have jumped the border so far this year.
| |
|
GLOBAL ECONOMIC REPORTING
MAY CPI
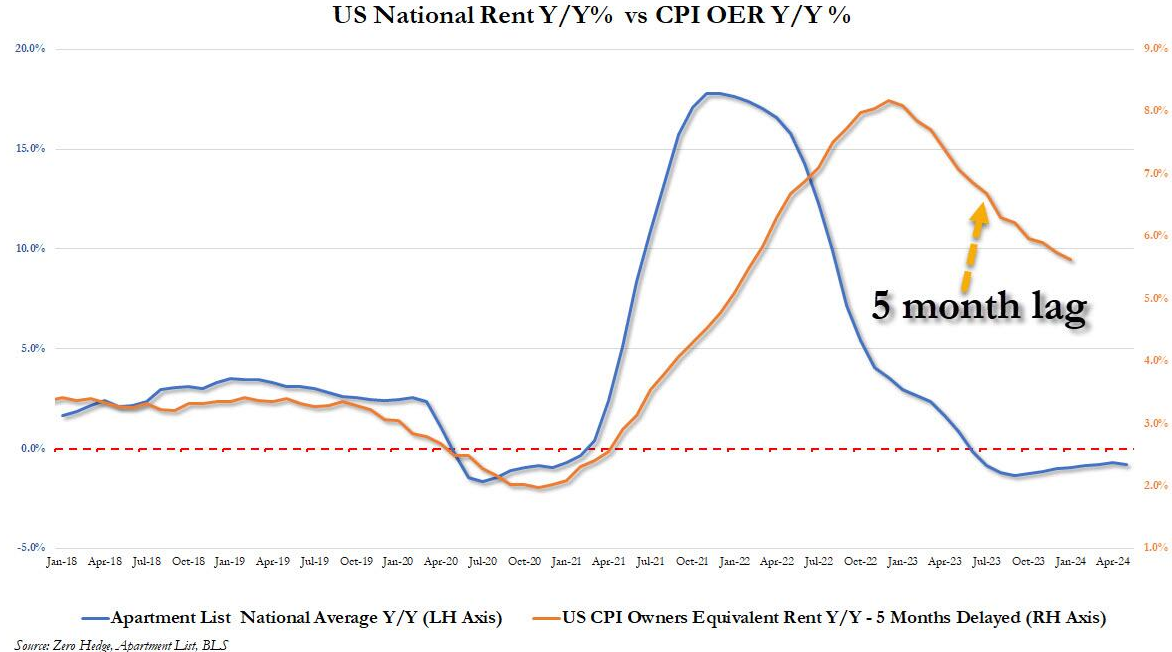
- With real-time rent flat to down for the past year, the BLS-tracked OER 5-months lagged, is up 5.6%, and will decline gradually for the next 18 months as it catches down to real-time rents, even as the latter are actively rising. A 0.2% monthly core CPI reading is likely to be the base case for the balance of the year, especially as it looks more and more like the long-awaited slowdown in shelter costs will hit as soon as the next report.
MAY PPI
- The headline producer price index unexpectedly tumbled 0.2% MoM in May (+0.1% MoM exp) from a +0.5% MoM rise in April. That's the biggest MoM decline since Oct 2023.
- This left the YoY change in the headline index down from a revised 2.3% in April to +2.2%, (well below the +2.5% YoY expected). That is still the highest YoY since April 2023. Core PPI was unchanged MoM in May, (cooler than the +0.3% MoM exp).
- On a YoY basis, Core PPI dropped from +2.5%.
JOBLESS CLAIMS
- The number of Americans applying for jobless benefits for the first time surged last week to 242k (up from 229k and well above the 225k exp). That is the highest since August 2023.
- The last three weeks have seen the largest surge in claims since January.
| |
|
In this week's "Current Market Perspectives", we focus on the signals that sentiment, fundamentals and various markets (Credit, Bond and Equity) are currently giving us.
=========
| |
|
MID YEAR UPDATES TO THIS YEAR'S ANNUAL THESIS PAPER
THE REGULATORY STATE
RELEASED - 01-17-24 --- 212 Page Paper
FULL 212 PAGE PDF DOWNLOAD
| |
|
1- CRUSHING COST OF REGULATIONS
Lately I have been talking about the pressures that Small Businesses in America are under. It is more than unprecedented Inflation; Wage Price Spiral & Rising Minimum Wages; Financial Stretched Consumers but increasingly exploding Government Regulations.
I was finally able to get my hands on the data and take a deep dive into why Small Business is screaming about this problem.
Budgetary pressures have incentivized the use of off-budget regulations requiring private outlays and adjustments, rather than adding more unpopular deficit spending. Mandates like family leave, child care and job training initiatives could involve either increased observable government spending or new regulations on business. Just as consumers wind up shouldering much of the corporate income tax, the regulatory compliance costs and mandates borne by businesses will percolate throughout the economy, sneaking their way into consumer prices.
This is one of the reasons there have been no large-scale tax hikes in years, because the hidden tax of regulation has proved appealing to lawmakers. Unlike on-budget spending, many regulations are hard to quantify and can come into existence "under-the-radar" versus the highly visible legislative process. The executive branch of government can enact its policies through the bureaucracy. The Biden Administration has done exactly that while the public glare was on Bidenomics.
Immediately on assuming office President Joe Biden:
- Declared the Trump tax and regulatory reduction agenda consisted of “harmful policies and directives that threaten to frustrate the Federal Government’s ability to confront ... problems.”
- SEE: Executive Order 13992 of January 20, 2021, “Revocation of Certain Executive Orders Concerning Federal Regulation,” Federal Register, Vol. 86, No. 14, January 25, 2021, pp. 7049– 7050, https://www.govinfo.gov/content/pkg/FR-2021-01-25 /pdf/2021-01767.pdf.
- Immediately initiated a progressive “modernization” of the regulatory review process.
- SEE: Presidential Memorandum of January 20, 2021, “Modernizing Regulatory Review,” Federal Register, Vol. 86, No. 15 (January 26, 2021), pp. 7223–7224, https://www .govinfo.gov/content/pkg/FR-2021-01-26/pdf/2021-01866.pdf.
- Reoriented the Office of Management and Budget away from regulatory supervision and restraint and toward the promotion of regulatory initiatives.
- SEE: Clyde Wayne Crews Jr., “A Look at ‘Modernizing Regulatory Review,’” OpenMarket (blog), Competitive Enterprise Institute, January 21, 2021, https://cei.org/blog/a-look-at -modernizing-regulatory-review/.
Below is what this meant:
| |
|
TEN THOUSAND COMMANDMENTS - The Annual Snapshot of the Federal Regulatory State
PRODUCED BY: COMPETITIVE ENTERPRISE INSTITUTE (CEI) - 2023 143 PAGES REPORT
FINDINGS:
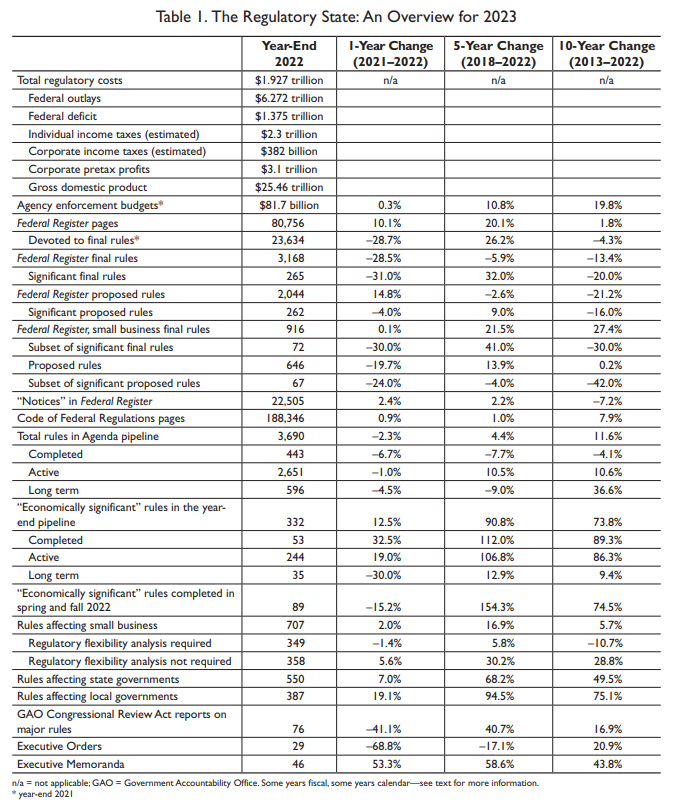
- During calendar year 2022, while agencies issued 3168 rules, Congress enacted 247 laws. Thus, agencies issued 13 rules for every law enacted by Congress.
- The “Unconstitutionality Index”—the ratio of regulations issued by agencies to laws passed by Congress and signed by the president—highlights the entrenched delegation of lawmaking power to unelected agency officials. The average ratio over the past 10 years is 22 rules for every law
- Since January 2021 the Biden Administration finalized 923 federal rules costing $1.6T.
- The Biden Administration finalized regulations imposing costs of over $1 trillion in just the last few months as agencies rush to protect their regulatory actions from possible rollback measures in the event that Biden loses the 2024 election.
- U.S. households pay $14,514 annually on average in a hidden regulatory tax. This amount exceeds every item in the household budget except housing. A typical American household spends more on embedded regulation than on health care, food, transportation, entertainment, apparel, services, or savings.
- When regulatory costs are combined with federal outlays of $6.27 trillion, the federal government’s share of the entire economy reaches 31.4 percent. State and local spending and regulation would add to these costs.
- The Congressional Budget Office’s February 15, 2023 Budget and Economic Outlook, covering fiscal year 2022 and projections for 2023 to 2033, showed discretionary, entitlement and interest spending of $6.272 trillion in fiscal year 2022, with spending projected to top $7 trillion in 2026 and hit nearly $10 trillion by 2033. Unprecedented open-ended deficits now standing at $1.4 trillion annually are expected to top $2 trillion annually by 2030. The national debt now tops $34 trillion, up from almost $20 trillion since 2017.
- Of 99,429 final rules issued since the Congressional Review Act passed in 1996 during the Clinton administration, just 20 rules have been revoked, including one guidance document.
- Economically, significant regulations are a special category of significant regulations. These rules each have at least $100 million of economic impact. The Biden administration’s spring and fall 2022 editions of the Unified Agenda contained a combined 89, (compared with 105 in 2021), completed economically significant rules. Even taking the dip into account, Biden’s count of completed economically significant rules is higher than anything seen in the Bush, Obama and Trump years.
- Biden issued just 29 executive orders in 2022, after issuing 77 in 2021. This reduction reflects a change in strategy, rather than a more modest view of executive power. Biden’s "Memoranda" continue to outstrip recent predecessors; these typically escape formal review.
| |
|
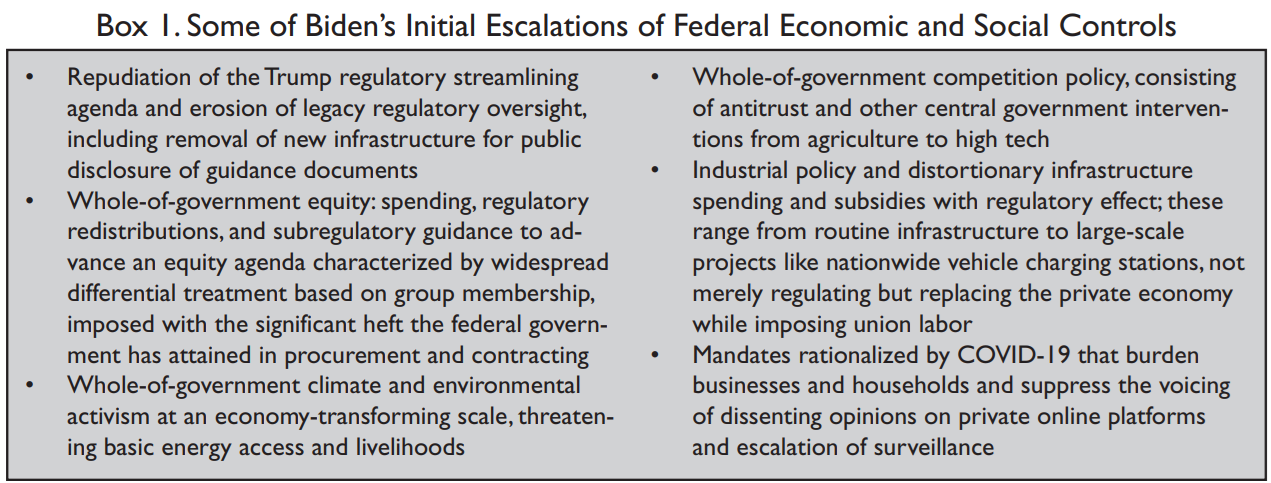
BIDEN ADMINISTRATION'S REPUDIATION & "WHOLE-OF-GOVERNMENT" INTERVENTION INITIATIVES
Biden has escalated his whole-of-government campaigns on equity, climate and other progressive ends. Biden’s repudiation of the Trump agenda of regulatory cost freezes and streamlining has been thorough. Biden has unleashed Trump-resistant agencies. They quickly moved to remove guidance document portals and now collude on the assorted whole-of-government campaigns.
| |
|
2- THE EXPLODING COST OF WASHINGTON'S BUREAUCRATIC OVERREACH
PRODUCED BY: JOB CREATORS NETWORK FOUNDATION - 2023 (JCNF) REPORT
Since 2009, more than 5,300 regulations have been finalized that are expected to cost $2.6 trillion in present and future costs.
The Obama administration played a significant role in imposing this onslaught of regulations, finalizing rules between 2009 and 2016 with projected costs of more than $870 billion.
President Joe Biden has continued and accelerated this trend, unleashing an unprecedented wave of federal regulations far costlier than any recent presidential administration.
UNPRECEDENTED WEB OF RED TAPE
From January to early May of this year, President Biden finalized regulations projected to cost around $1.2 trillion. In total, Biden’s wave of new regulations has been far costlier than even Obama’s regime of rules and mandates.
Across a similar timeframe, the Obama-Biden administration finalized regulations projected to cost $309 billion, while the Trump-Pence administration finalized regulations projected to actually reduce costs by $159.4 billion.
Similarly, a report authored by Professor Casey Mulligan of the University of Chicago for the Committee to Unleash Prosperity, examined the impact that President Biden’s regulations will have on families. The report found that the new rules imposed in just the first two years of the Biden administration will lead to almost $10,000 in added present and future costs for the average household. Further, the report estimates that, should regulatory costs rise at the same rate under Biden as they did under Obama, the costs imposed across an eight-year Biden term would reach $60,000 per household.
.
These sweeping regulations will impose new costs on nearly every facet of our economy, from manufacturing to healthcare to small businesses and utilities.
-
EMISSIONS STANDARDS: The Biden administration’s costliest regulations to date have been the new emissions standards for light- and medium-duty vehicles finalized earlier this year by the Environmental Protection Agency (EPA). These new standards are projected to cost some $870 billion and will raise prices for families already dealing with the impact of inflation.
-
BENEFICIAL OWNERSHIP REPORTING: New beneficial ownership reporting requirements for businesses is expected to cost $84 billion.
-
PFAS DRINKING WATER REGULATIONS are expected to cost 63.4 billion.
-
TRANSPARENCY: New staffing and transparency requirements for Medicare and Medicaid ($43.1 billion).
-
AUTOMOBILE REGULATIONS have hit American families and workers particularly hard, largely as a result of the left’s crusade to implement radical climate policies. A 2021 study published by Cambridge University found that auto regulations have added around $6,000 to $7,000 in costs per vehicle over the long term.
- Similarly, a Heritage Foundation report from 2016 found that President Obama’s fuel economy standards would raise prices for consumers by at least $3,800 per vehicle.
- In line with his climate agenda, auto regulations have been a costly focus of the Biden administration. According to a report by the Committee to Unleash Prosperity, the largest source of new costs imposed on households by Biden’s regulations has been new auto emissions standards.
- Costly mandates from Washington not only lead to higher prices for consumers looking to buy a car, they also lead to fewer available choices.
- According to an analysis by S&P, higher fuel economy standards have led manufacturers to phase out certain models.
- In all, there were 16 fewer affordable car models available to consumers in 2023 compared to 2017.
- President Biden is also undertaking an effort to phase out gas powered cars and force everyone into adopting electric vehicles, despite the fact that these cars are much more expensive and consumers have made clear they are not interested.
-
HOUSEHOLD APPLIANCES: The Biden administration has unveiled a series of new regulations aimed at household appliances.
- So far, President Biden has imposed new rules and mandates on air conditioners, furnaces, ceiling fans, washing machines, dish washers, water heaters, light bulbs, gas stoves, and more.
- The price tag for these new regulations will have a devastating impact on families’ budgets. An analysis by the Alliance for Consumers estimated that Biden’s new standards for washing machines will increase per-unit prices by $200 and new gas furnace efficiency standards will cost consumers $494 on average.
- Biden’s ban on certain refrigerants will increase the cost of refilling air conditioner units by $1,000 or more.
- Some regulations being advocated would force certain products out of the market altogether. For example, liberal politicians have actively pushed for a ban on gas stoves, which would force consumers to install new electric outlets and adopt newer electric models, imposing additional upfront costs on families.
-
BUREAUCRATIC RED TAPE: Empowered by misguided legal doctrine, regulators have spent decades piling up costly rules and regulations on American industries, hamstringing economic growth and job creation. As a result, businesses must wade through an overwhelming maze of red tape that diverts resources towards compliance rather than growth and innovation.
- Federal regulations cost American manufacturers approximately $350 billion in 2022, a 26% increase compared to 2012.
- A study released by the National Association of Manufacturers estimated that the average manufacturing company in the U.S. pays over $29,000 per employee to comply with federal regulations.
- Even more worrisome, the burden of regulations is hardest on smaller manufacturers. Manufacturers with fewer than 50 employees pay an astounding $50,100 per employee each year to comply with federal regulations.
- These costs hold back our manufacturing industry at a time when the country should be focused on reshoring jobs and manufacturing.
- The costs of overregulation are especially harmful to small businesses that are already struggling to get by. According to JCN’s SBIQ national poll of small businesses, 54 percent of respondents say complying with regulations is time consuming.
| |
|
3- CHEVRON DEFERENCE DOCTRINE - Litigation Update
The Chevron Deference Doctrine is a bureaucracy-empowering legal doctrine that has distorted the U.S. system of government for decades at the expense of everyday citizens. The doctrine, which arose out of Chevron v. NRDC (1984), holds that an executive agency’s interpretation of a statute is entitled to deference unless Congress has explicitly said otherwise.
Conservatives and Republican policymakers have long been critical of the doctrine, saying it gives unelected regulators far too much power to make policy by going beyond what Congress intended when it approved various laws. The authority of regulatory agencies has been increasingly questioned in recent years as the conservative majority on the Supreme Court has grown. Conservative Justices Clarence Thomas, Samuel Alito, and Neil Gorsuch have expressed skepticism of the Chevron doctrine.
“I don’t want to say that Chevron is responsible for all the ills of the modern administrative state,
just most of them.”
The impact of the Chevron Doctrine on small businesses is clearly demonstrated in the Loper Bright v. Raimondo case currently before the Supreme Court. In that case, a group of family-run fishing businesses are challenging a costly federal rule that required them to pay for third-party monitors that cost up to $700 per day per ship, amounting to up to 20% of a ship’s take-home pay. Fortunately, the Loper Bright case presents an opportunity for the Supreme Court to rein in this kind of unconstitutional overreach by the regulatory state.
FOLLOW: #ChevronDoctrine
The Fishing Case that Could Put the Chevron Doctrine Out to Sea
Thomas S. Holmgren: Goldberg Segalla is a national civil litigation firm. (FOLLOW: @GoldbergSegalla)
- On January 17, the U.S. Supreme Court heard oral argument in Loper Bright Enterprises v. Raimondo, No. 22-451, an environmental-law dispute concerning fishery management in federal waters.
- The case reached the court via a petition of four commercial fishing companies challenging a federal fisheries regulation, the Magnuson-Stevens Act, which provides that the National Marine Fisheries Service can require private vessels to “carry” federal observers onboard to allow for the enforcement of the agency’s regulations, (federally-prescribed fishing “catch” limits being the most obvious), and can require the private vessels to pay the federal observers salaries while they are monitoring.
- The D.C. Circuit Court of Appeals previously found that the agency’s view that the regulation allowed for the imposition of those obligations, in its ambiguity, was reasonable under the Chevron Doctrine. That decision and the Chevron Doctrine are now both under scrutiny.
-
The Chevron Doctrine originated in Chevron U.S.A. Inc. v. Natural Resources Defense Council, Inc. et al. 467 US 837 (1984), a Clean Air Act case in which the court needed to decide if the Clean Air Act permitted the Environmental Protection Agency to define the term “stationary source” for the purpose of their enforcement of the air pollution regulation. In siding with the EPA, the court created a test that would become known as the Chevron two-step. In the first step, courts determine if Congress has spoken to the “precise question at issue,” and if they have not, the statute is deemed to be ambiguous, and courts move to step two. In that second step, courts decide whether the agency’s interpretation is “reasonable,” and will defer to the agency as long as their interpretation of the statute is not unreasonable. In practice, the doctrine has compelled federal courts to defer to a federal agency’s interpretation of an ambiguous or unclear statute that Congress delegated to the agency to administer.
- The doctrine’s critics believe that it gives agencies too long of a leash when there is no affirmative power for them to act. Justice Brett Kavanaugh used a significant portion of his time during oral argument time to highlight how such a system results in significant “shocks to the system every four or eight years when a new administration comes in” and implements “massive change” in areas like securities law, communications law, and environmental law, where new heads of agency have vastly different interpretations than their predecessors/ political counterparts.
- After nearly four hours of oral argument, in which a majority of the justices appeared ready to discard the Chevron Doctrine in favor of a principle under which the Supreme Court would reclaim some of the interpretive power it gave to agencies when it created the doctrine, it appears that we could be moving to a post-Chevron world when a decision is issued this term.
-
While some level of deference to an agency interpretation is expected to remain, the impact of overruling — or even limiting — Chevron, will be tremendous. We will provide an additional update when the Supreme Court issues its decision.
The SCOTUS high court’s Chevron decision is expected to drive a new litigation ‘Flood’.
| |
|
DEVELOPMENTS TO WATCH
US WARNINGS FROM EU ELECTIONS
- A decided shift to the right which will likely be more exaggerated in the National Elections.
- Shift shows some national leaders may be in trouble.
- Immigration and Security mounting problem.
The results for the European Parliament elections across 27 European Union (EU) member states show the biggest news being the shellacking of Emmanuel Macron’s Renaissance Party by Marie Le Pen’s National Rally in France. With his party having received only around half as much support as Le Pen’s party, President Macron has called a snap election, commencing at the end of June—a battle the former Rothschild banker is better equipped to fight on short notice than the populist leader, given his support from the corporate media and donor class.
IMPACT TO EUROPEAN PARLIAMENT
-
Voter turnout remained steady at 51%, which suggests that a majority of the electorate does not consider European Parliament (EP) elections to be second-order events.
- Heightened geopolitical uncertainty did not mobilize more voters and raise awareness for EU-level action needed to solve current challenges around security and industrial competitiveness.
- Centrist majority holds with 56% of total votes – EU is likely to continue to run a centrist policy course. Widely, centrist parties have kept their majority. This means that the EU legislative process on future policy priorities (defense integration, boosting competitiveness) is unlikely to be hampered in the next 5-year legislative term.
- The shift to the right in the EP (all right-wing parties winning 22% of total votes) is likely to have some impact on the policy debate and could influence the shape of new legislation in policy areas like migration and the Green Deal.
| |
IMPACT TO KEY EU MEMBER STATES
The biggest impact of the election result could be at a national level with President Macron announcing the dissolution of the French parliament after the defeat of his Renaissance party. Moreover, the election outcome may serve as a barometer to where national politics is headed in other EU member states:
-
France - Macron dissolves parliament and calls early elections on June 30 for round 1 and July 7 for round 2 . Macron’s Renaissance party suffered heavy losses in the EP elections and the French President immediately announced the dissolution of parliament. A legislative election does not affect Macron's status as President. At the EU level, Le Pen's National Rally will likely continue to be a part of the far-right fringe party group ID, with limited influence in the EU parliament. Domestically, the weak showing of French President Macron’s Renaissance party, (coming in second place in the EP election), might provide tailwinds for Le Pen's National Rally in the legislative election. The strong result of the centre-left Socialist party might have consequences for the centre-left/left bloc in France. The EP results and recent polls suggest that the outcome of the legislative elections might lead to a government less likely to easily comply with EU fiscal rules, either intentionally or as a result of a potential weak political alliance.
-
Germany – Weak election result of Scholz's SDP might fuel a debate about Scholz’s nomination for a second term for the 2025 national elections. Scholz’s Social Democrats secured 14% of total votes, which is roughly the same as in the last EP elections in 2019, but far less than in the general elections 2021. This rather weak result might fuel a debate about whether he is the right candidate to lead the SPD into next year's general elections. The budget process for 2025 is shaping up to be a critical test for the coalition's cohesion in the coming months.
-
Italy – increasing leverage at the EU level? Although Giorgia Meloni’s Brothers of Italy did less well than expected, (with approval rates falling below 26%), this is unlikely to have an immediate impact on domestic government stability. At the European level, she has gained influence as (tacit) support for VdL might give her increasing leverage at the EU level (including a powerful portfolio in the next commission; e.g., the internal market portfolio).
| |
|
BIDENS EXECUTIVE BORDER ORDER MISLEADING
ACCORDING TO GOLDMAN SACHS & US BORDER PATROL
Even though President Biden announced changes on June 4th that would restrict a channel that might otherwise account for around 700k potential immigrants annually at current unauthorized migration rates, Goldman Sachs concludes that:
"The ultimate effect would be a fraction of this as most affected immigrants would likely attempt other modes of entry. Legal challenges to the new rules might even block implementation altogether."
Here are the details:
The new asylum restrictions announced on June 4 are likely to face legal challenges and logistical constraints, but could lower net unauthorized immigration and limit the potential for upside immigration surprises this year.
The policy would set a limit of 2.5k unauthorized migrants encountered per day (over a 7-day average) at the border outside of official ports of entry. Once the 2.5k limit is reached—this is likely to happen immediately as the daily rate was reported to be 3.5k in May—US authorities would expel apprehended migrants back across the border, rather than releasing many of them into the US to await a court date.
At a pace of 3.5k per day, this would in theory affect as many as 1.3 million immigrants per year. However, nearly half of these are detained when apprehended and are not allowed into the US. The remainder—around 700k at an annual rate in May—are released into the US to await a court hearing and the new program would mainly affect this segment. While this could result in a meaningful decline in immigration if implemented, the actual effect is likely to be a fraction of this, for three reasons.
- First, several groups are excluded from this policy, such as unaccompanied children—which account for roughly a quarter of these border crossings—as well as victims of severe trafficking and other vulnerable migrants. Those who express a fear of persecution in their home country would also still be eligible for asylum through an expedited process with a higher standard.
- Second, the policy does not apply to asylum seekers at official ports of entry, where around half of asylum-seekers also pass initial screenings and enter the US. It seems likely that many of those affected by the new policy will likely seek asylum at official ports of entry instead.
- Third, the effect could also be partly offset by an increase in other unauthorized inflows, such as those who cross the border and are not intercepted.
| |
|
It doesn't work as announced:
BORDER PATROL DOCUMENT RIGHT: Border Patrol agents in southern California have been instructed to admit migrants from all but 6 of the 100+ countries in the eastern hemisphere — days after @POTUS issued an executive order in which he stated migrants would be removed from the country and not allowed to seek asylum.
A senior administration official told reporters on Tuesday “we anticipate we will continue to enhance our ability to return migrants to the Eastern Hemisphere.” That is not the case, according to the instructions given to Border Patrol in San Diego, where migrants from all over the world are crossing daily.
Even if it was working as advertised, it would still admit 1.8 million illegals per year. Plus a massive carveout exempting all those whose home countries — like China and Venezuela — won’t accept them back.
NOTE: Over 150,000 people from those two nations alone have jumped the border so far this year.
| |
|
GLOBAL ECONOMIC INDICATORS:
What This Week's Key Global Economic Releases Tell Us
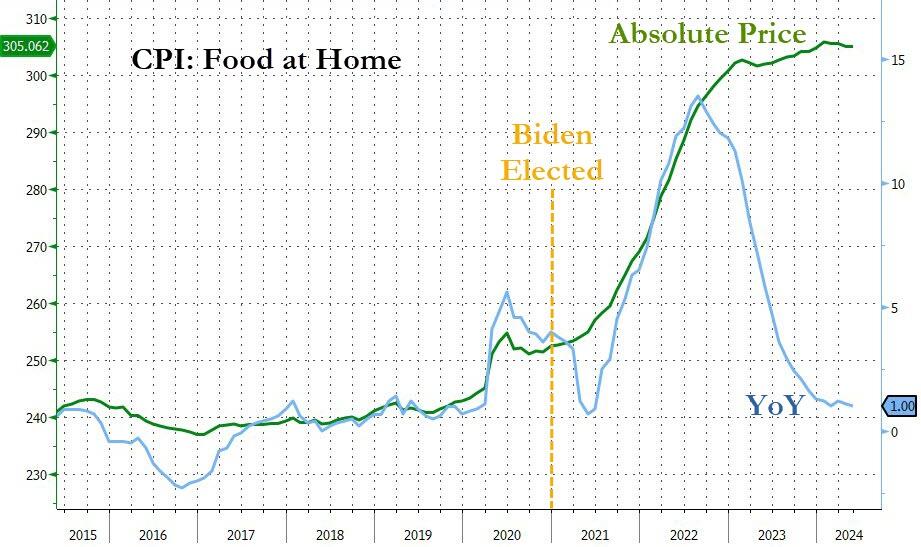
MAY CPI
CHART RIGHT: While the Biden administration will continue to gaslight voters with comments like "inflation is tumbling"... every man, woman and child who actually buy food know prices have NEVER been higher. People aren't stupid and see it for what it is - old time politics - that Biden was weened on. It's a new era and a new electorate!
CPI delivered the kind of downside surprise that bond bulls and the Fed have been waiting for, as both headline and core came in a tenth lower than expected, largely driven by a 3.6% drop in gasoline prices - the biggest reason why the headline CPI was flat on the month Indeed. At 0.16% the rise in core nearly rose just 0.1% when rounded. Meanwhile, in what may have been the biggest surprise, super-core services, ex housing, fell by 0.04%, the first negative reading since September 2021!
CHART BELOW
With real-time rent flat to down for the past year, the BLS-tracked OER 5-months lagged, is up 5.6%, and will decline gradually for the next 18 months as it catches down to real-time rents, even as the latter are actively rising.
A 0.2% monthly core CPI reading is likely to be the base case for the balance of the year, especially as it looks more and more like the long-awaited slowdown in shelter costs will hit as soon as the next report.”
|  | |
|
MAY PPI
The headline producer price index unexpectedly tumbled 0.2% MoM in May (+0.1% MoM exp) from a +0.5% MoM rise in April.
That's the biggest MoM decline since Oct 2023.
This left the YoY change in the headline index down from a revised 2.3% in April to +2.2%, (well below the +2.5% YoY expected)...
That is still the highest YoY since April 2023. Core PPI was unchanged MoM in May, (cooler than the +0.3% MoM exp).
On a YoY basis, Core PPI dropped from +2.5%.
| |
|
JOBLESS CLAIMS
The number of Americans applying for jobless benefits for the first time surged last week to 242k (up from 229k and well above the 225k exp). That is the highest since August 2023.
The last three weeks have seen the largest surge in claims since January.
| |
|
GLOBAL MACRO
WHAT DOES YOUR SCAN OF THE DATA BELOW TELL YOU? - THE MEDIA AVOIDS BAD NEWS!
We present the data in a way you can quickly see what is happening.
THIS WEEK WE SAW
Exp=Expectations, Rev=Revision, Prev=Previous
| |
|
UNITED STATES
- US Non-Farm Payrolls (May) 272.0k vs. Exp. 185.0k (Prev. 175.0k, Rev. 165k)
- US Unemployment Rate (May) 4.0% vs. Exp. 3.9% (Prev. 3.9%)
- US Average Earnings YY (May) 4.1% vs. Exp. 3.9% (Prev. 3.9%, Rev. 4.0%)
- US PPI Final Demand MM (May) -0.2% vs. Exp. 0.1% (Prev. 0.5%)
- US PPI Final Demand YY (May) 2.2% vs. Exp. 2.5% (Prev. 2.2%, Rev. 2.3%)
- US Initial Jobless Claims w/e 242.0k vs. Exp. 225.0k (Prev. 229.0k)
- US Continued Jobless Claims w/e 1.82M vs. Exp. 1.798M (Prev. 1.792M, Rev. 1.790M)
CHINA
- Chinese CPI MM (May) -0.1% vs. Exp. 0.0% (Prev. 0.1%)
- Chinese CPI YY (May) 0.3% vs. Exp. 0.4% (Prev. 0.3%)
- Chinese PPI YY (May) -1.4% vs. Exp. -1.5% (Prev. -2.5%)
JAPAN
- Japanese GDP Revised QQ (Q1) -0.5% vs. Exp. -0.5% (Prev. -0.5%)
- Japanese GDP Revised Annualized (Q1) -1.8% vs. Exp. -1.9% (Prev. -2.0%)
- Japanese Corp Goods Price MM (May) 0.7% vs. Exp. 0.4% (Prev. 0.3%, Rev. 0.5%)
- Japanese Corp Goods Price YY (May) 2.4% vs. Exp. 2.0% (Prev. 0.9%, Rev. 1.1%)
| |  |
|
EU
- EU Industrial Production MM (Apr) -0.1% vs. Exp. 0.2% (Prev. 0.6%, Rev. 0.5%)
- EU Industrial Production YY (Apr) -3.0% vs. Exp. -1.9% (Prev. -1.0%, Rev. -1.2%)
SWEDEN
- Swedish CPIF YY (May) 2.3% vs. Exp. 2.1% (Prev. 2.3%); CPIF Ex Energy YY (May) 3.0% vs. Exp. 2.70% (Prev. 2.90%)
AUSTRALIA
- Australian NAB Business Confidence (May) -3.0 (Prev. 1.0)
- Australian NAB Business Conditions (May) 6.0 (Prev. 7.0)
- Australian Employment (May) 39.7k vs. Exp. 30.0k (Prev. 38.5k)
- Australian Full Time Employment (May) 41.7k (Prev. -6.1k)
- Australian Unemployment Rate (May) 4.0% vs. Exp. 4.0% (Prev. 4.1%)
- Australian Participation Rate (May) 66.8% vs. Exp. 66.7% (Prev. 66.7%)
UK
- UK RICS Housing Survey (May) -17 vs. Exp. -6 (Prev. -5, Rev. -7)
| |
CURRENT MARKET PERSPECTIVE | |
|
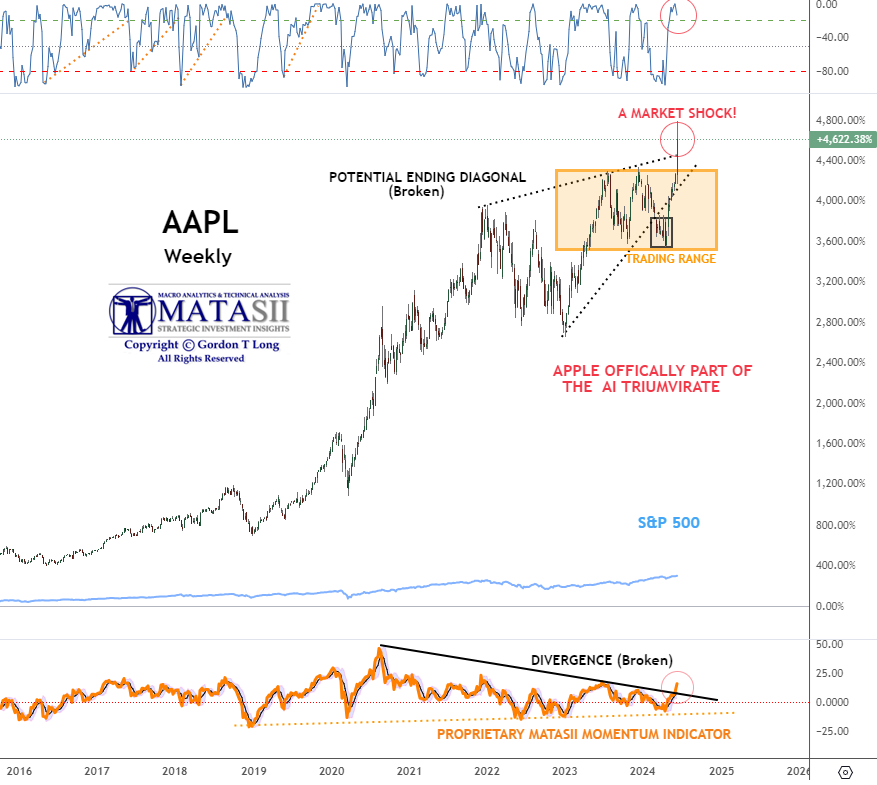
AAPL OFFICIALY PART OF AI TRIUMVIRATE
FRENCH DEBT CREATES STORM CLOUDS OVER EU DEBT
Click All Charts to Enlarge
| |
AAPL EXPLODES OUT OF TRADING RANGE - AAPL exploded out of its trading range as its aggressive buyback program continues. The Price lift is seen as a vote of confidence that AAPL has officially become a sustainable part of the AI Triumvirate leadership along with Nvidia & Microsoft. | |
|
1 - SITUATIONAL ANALYSIS
BANKING TROUBLES IN EUROPE!
French President Emmanuel Macron's decision to abruptly call a national election in two weeks based on the serious blow inflicted from last week's EU election appears to have backfired on him. The EU Bond market suddenly borders on crisis as French-German Bonds spreads have exploded higher on fear of a potential Socialist French Parliament not interested in abiding by the 3% Debt-to-GDP EU Governance Rule. It will be a very busy weekend in EU Banking circles.
- French ETF's (EWQ) have been gaping lower and lower. This is at the most oversold levels since Sept 2022.
- European banks (SX7E) have become very oversold almost immediately.
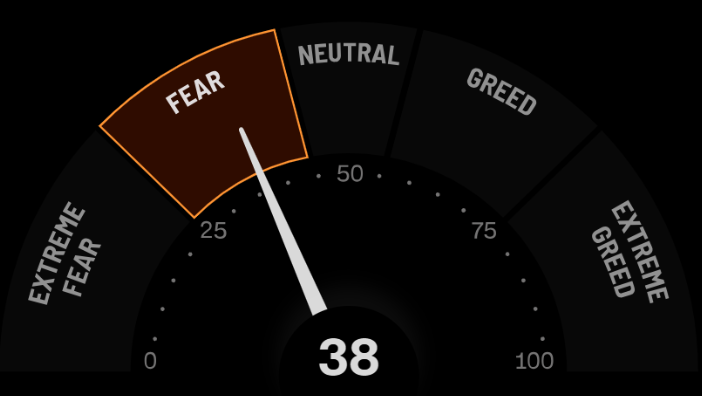
CHART TOP RIGHT: The Fear & Greed Index has dropped quickly to 38! Is it reflecting, though knowing something is terribly wrong, a fear of missing out (FOMO) on the rally continuing?
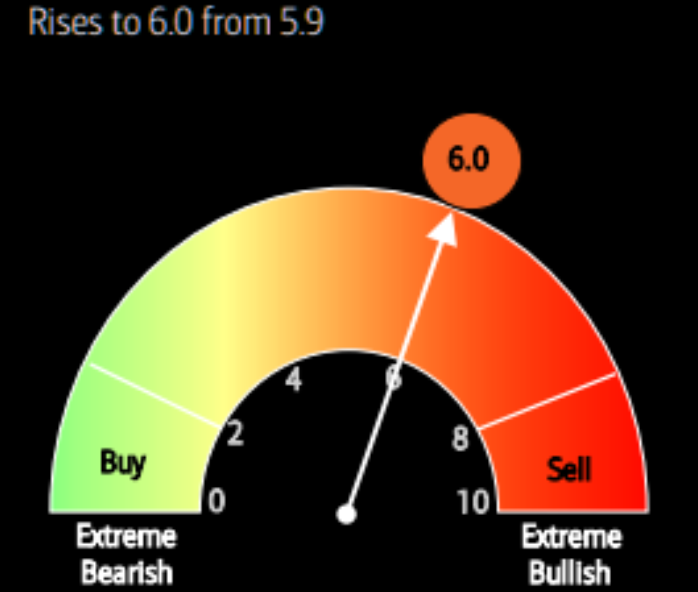
CHART BOTTOM RIGHT: The BoA Bear-Bull Indicator is at the highest levels in awhile. Still not yet a "clear" contrarian sell, but it is getting there!
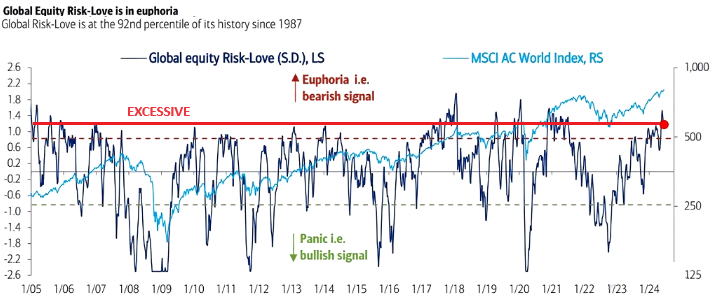
CHART BELOW: BoA's Global Risk-Love Indicator stands at 92 percentile and suggests investors exercise caution and focus on managing Risk.
| | |
| |
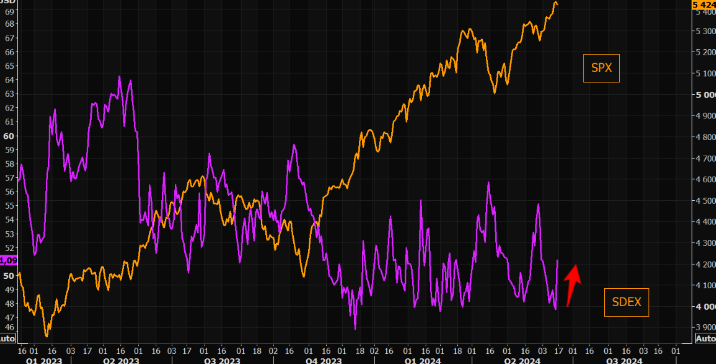
The crowd is very long and in need of downside protection. We are seeing skew catch rather aggressive "bids". | |
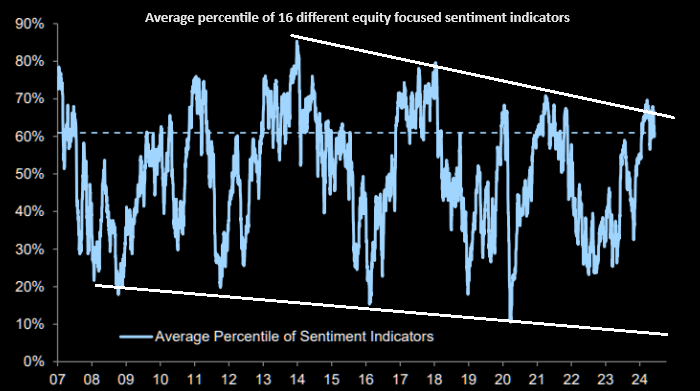
The average percentile of 16 different equity focused sentiment indicators though not at all time highs is elevated especially against a longer term weakening trend. | |
|
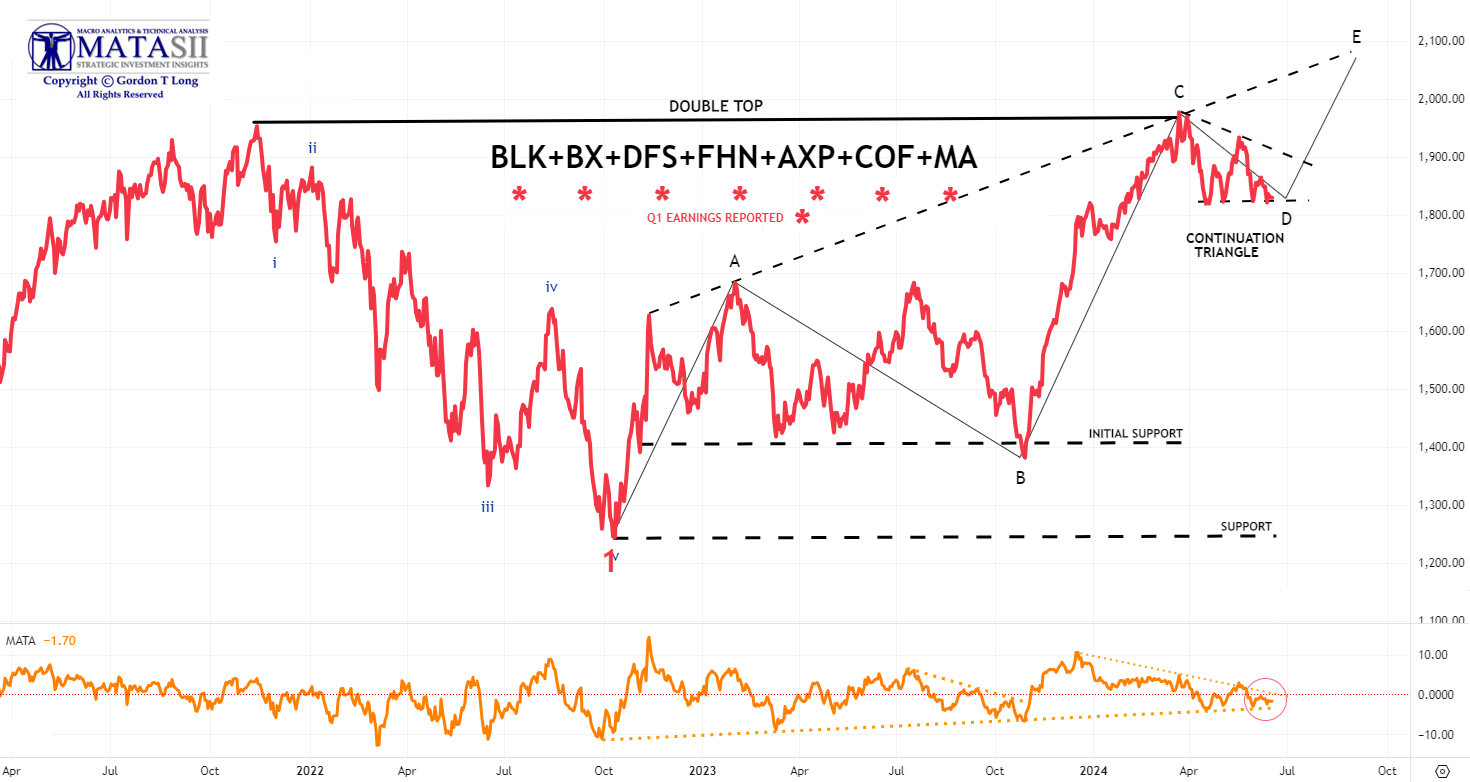
"AS GO THE FINANCIALS, SO GO THE BANKS: AS GO THE BANKS, SO GO THE MARKETS"
MATASII FINANCIAL STOCK INDEX
We continue to keep an eye on both the Bank and Financial stocks to give us an early signal of market direction. We have been showing the banks over the last few weeks, but the Financials now appear to be giving a clearer signal.
- The MATASII Financial Index stocks has begun to exhibit a potential continuation triangle pattern.
- The Elliott Wave analysis supports an "E" wave higher as part of a potential ABCDE pattern.
- Momentum (bottom pane) has found long term support and needs to be watched to see if it breaks shorter term overhead resistance, shown by a dotted descending orange momentum trend line.
| |
|
YOUR DESKTOP / TABLET / PHONE ANNOTATED CHART
Macro Analytics Chart Above: SUBSCRIBER LINK
| |
|
2 - FUNDAMENTAL ANALYSIS
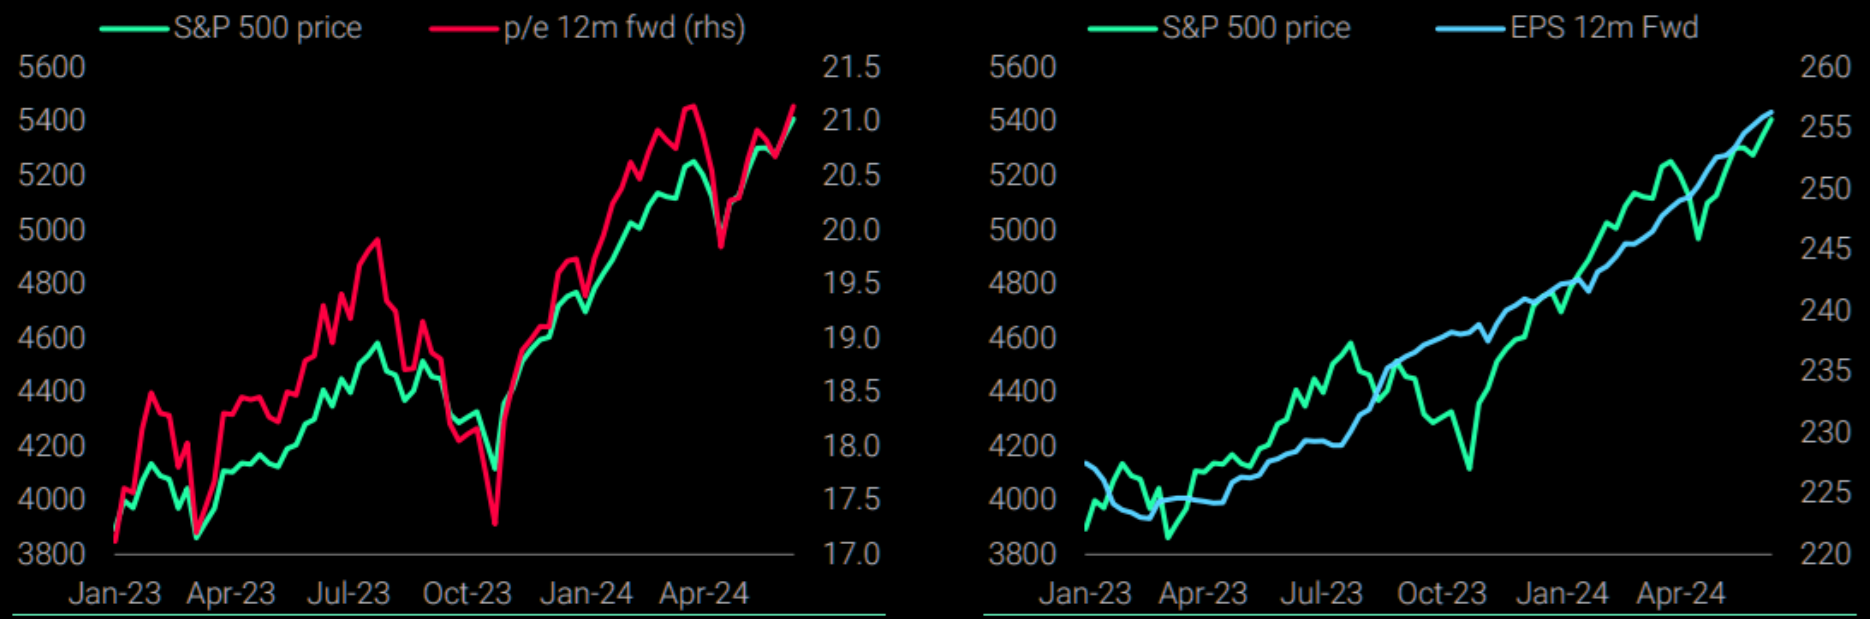
FORWARD PE'S & EPS
Should we believe the 12 Month Forward Earnings per Share estimates, remembering that it is all based on a cap weighted S&P 500 driven by the Magnificent Seven? Especially as the Magnificent Seven is increasingly driven by three component stocks (Apple, Nvidia and Microsoft) all hinging their net growth outlooks on AI? That may not be outright gambling, but then it is not prudent investing - it is better termed speculation!
| |
|
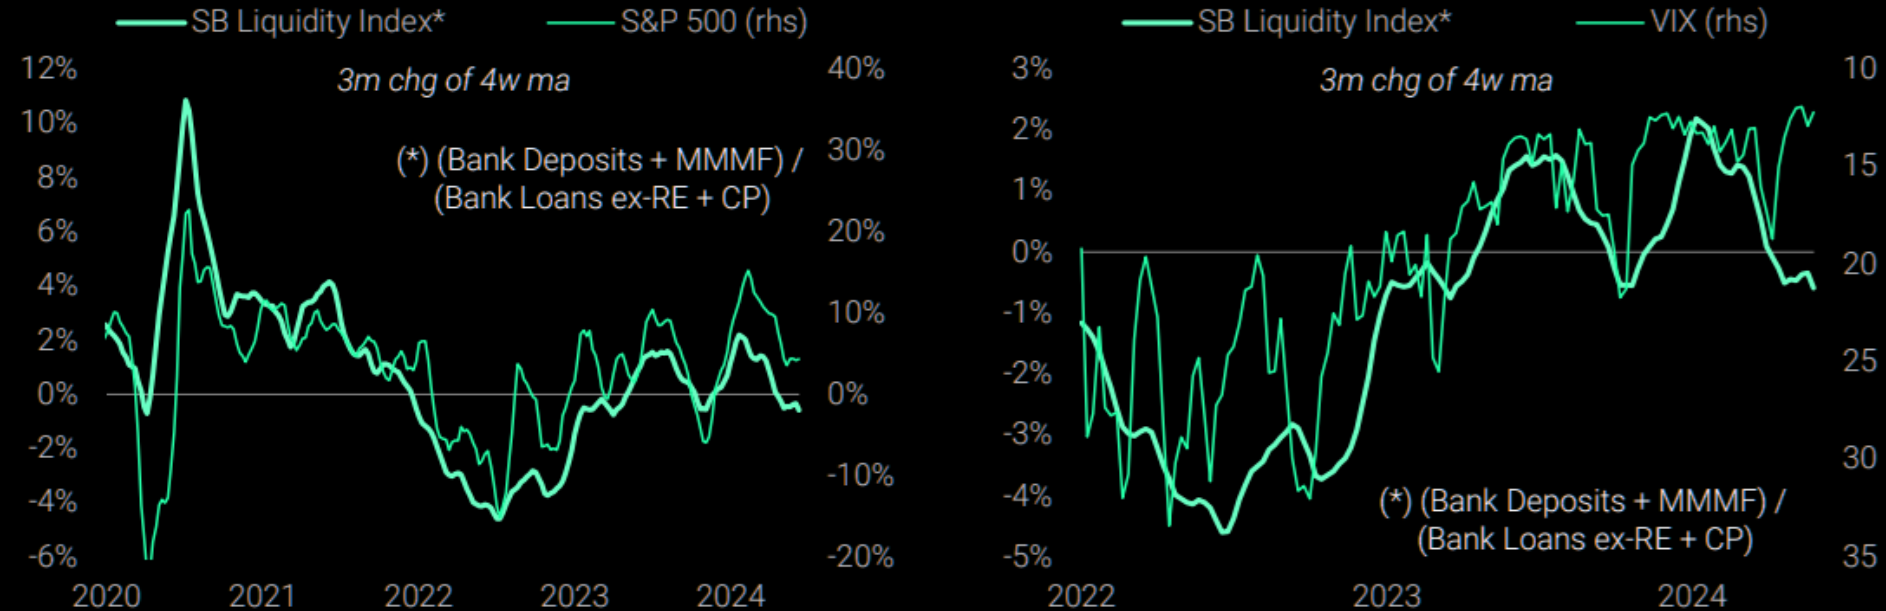
LIQUIDITY
We are seeing a less supportive liquidity trend picture for equities when we define it as (Bank Deposits +MMMF) /(Bank Loans Ex-Real Estate + Commercial Paper). As you would expect, VIX tends to rise when liquidity tightens - which it has.
| |
|
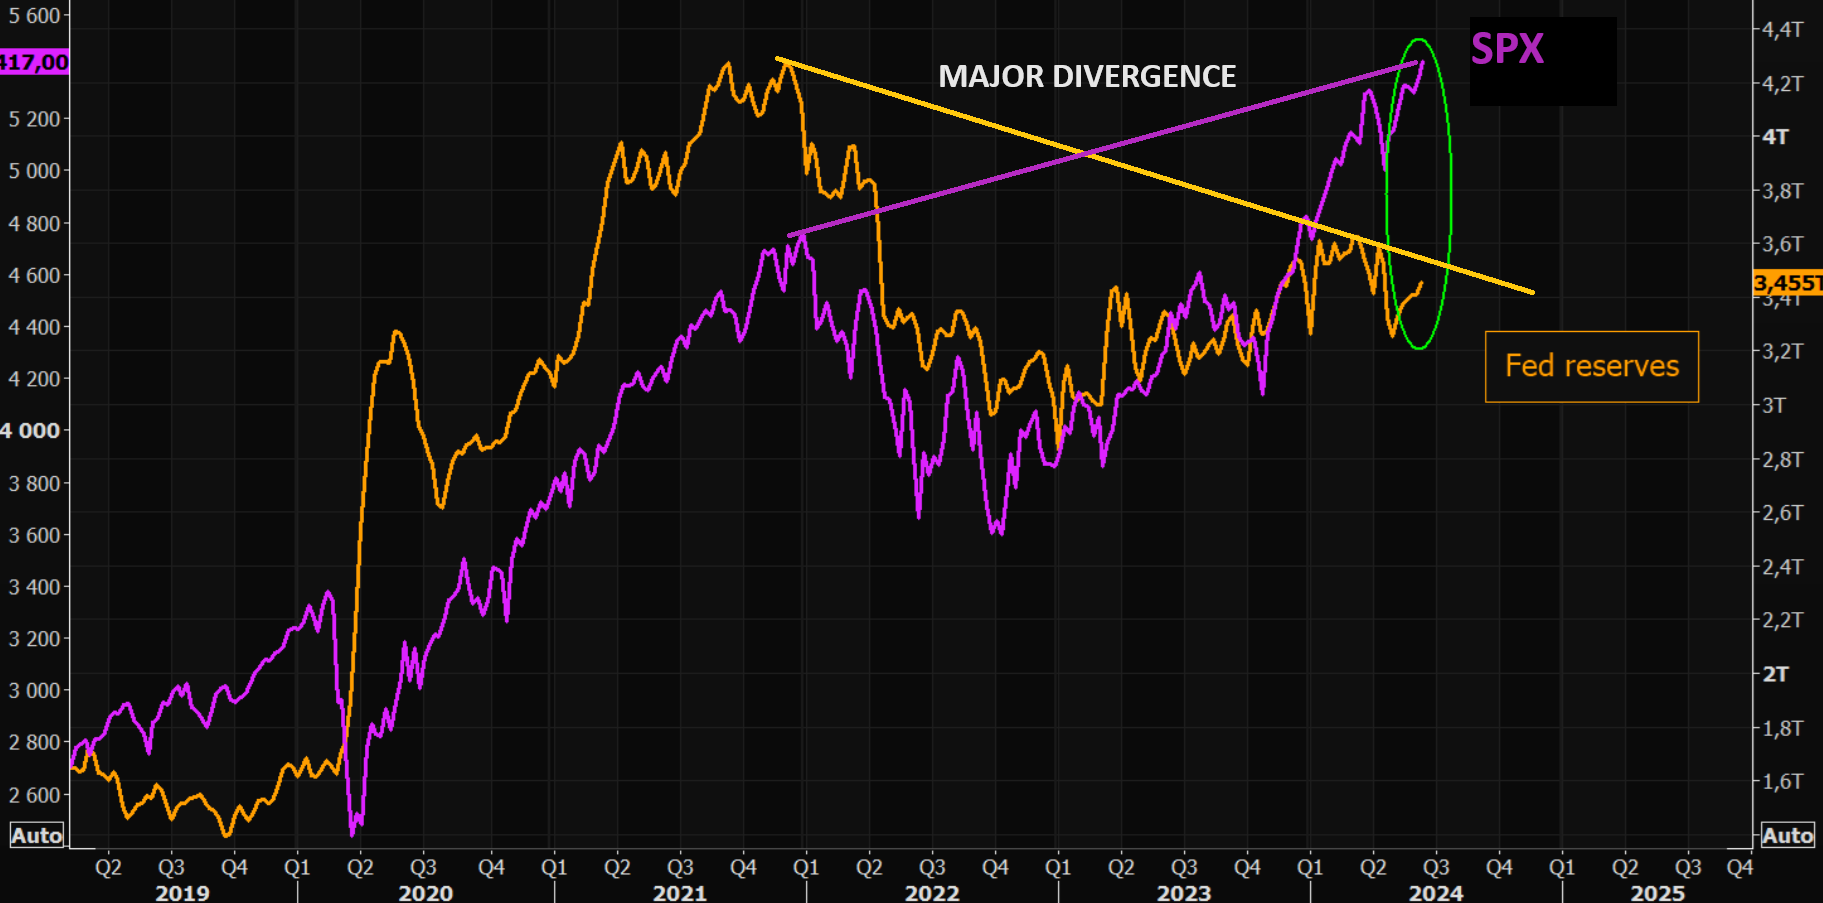
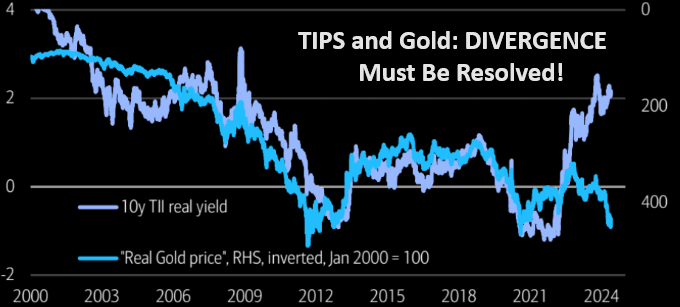
S&P 500 vs FED BANK RESERVES
There are two glaring problems with the chart below:
- The "Jaws-of-Death" will be closed at some point.
- We have a major Divergence which is always a warning to be taken seriously!
| |
|
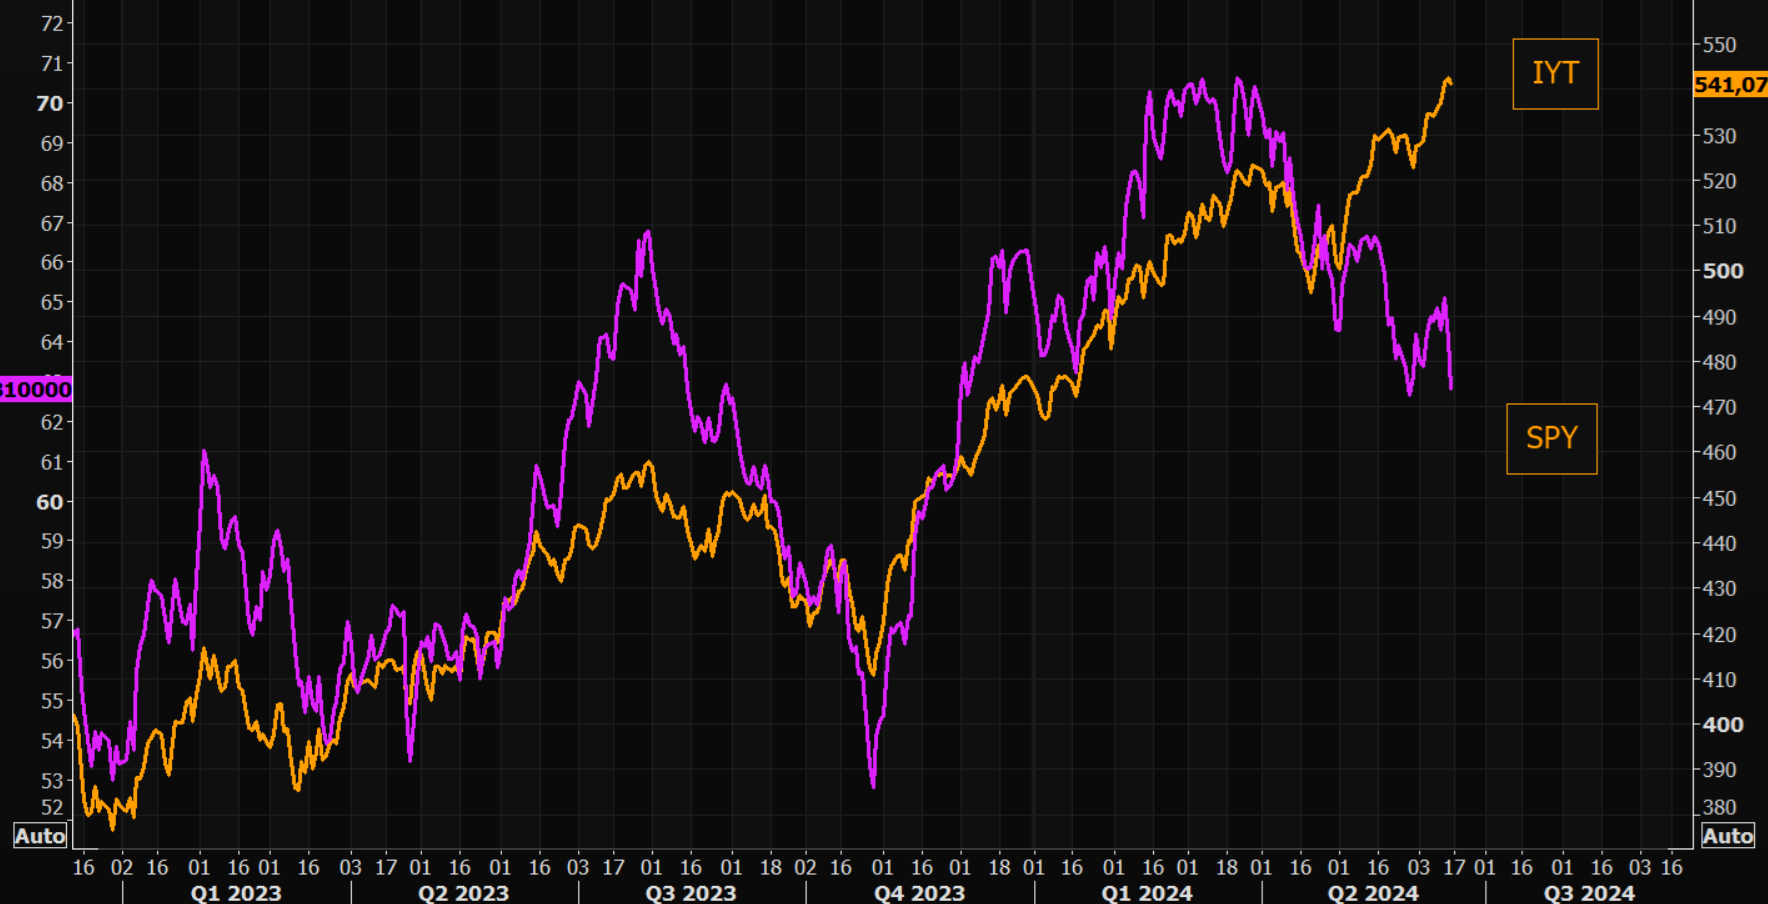
DOW THEORY
In last week's Newsletter we outlined our growing concerns with the Trannies within the DOW Theory (LINK). The gap between Transports and SPY is only getting wider and wider. Is tech so powerful that we can dismiss from "all" PROVEN old relationships? NOTE: More Divergence!
| |
|
MARKET DRIVERS
As goes NVDA, so goes the MAG-7, As Goes Mag-7 so goes The Market.
| |
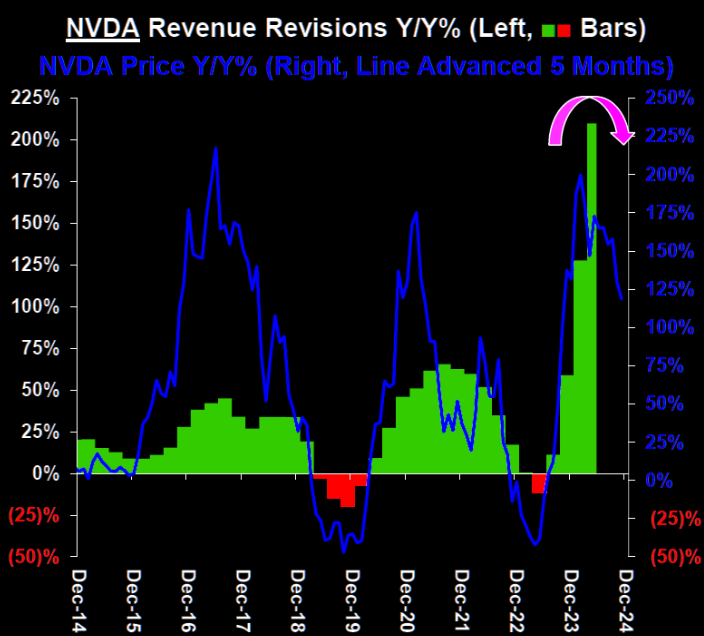
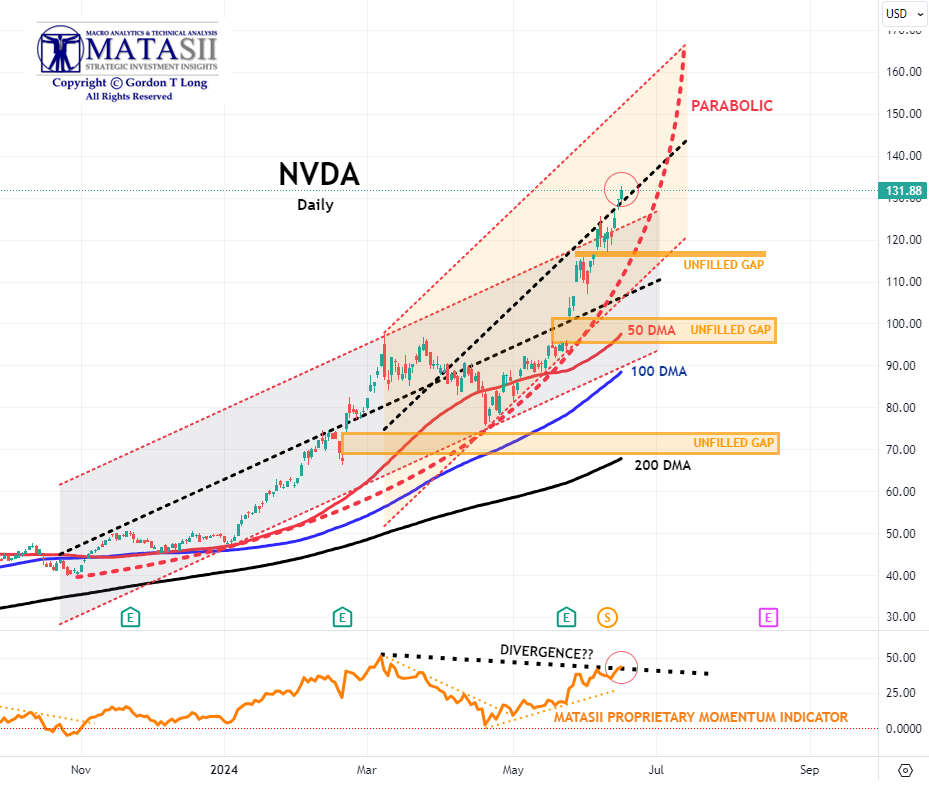
NVDA - Daily
CHART RIGHT: NVDA stock Y-o-Y% change tracks the growth rate of revenue & EBITDA revisions. Both look to have peaked (Revenue shown to the Right)?
- NVDA continues to reach for new highs!.
- NVDA's lift this week pushed through the pre-split upper channel boundary trend line which now aligns with the black dotted rising mid-channel trend line shown below.
- The Dotted Black Trend line in the MATASII Proprietary Momentum Indicator (lower pane below) is suggesting a potential Divergence has been set up. This is normally seen as a warning to the downside that is ahead if the Divergence isn't removed by a movement higher in Momentum.
- At some point the major unfilled gaps (at much lower levels) must be filled. NVDA therefore may no longer become a Short to Intermediate Long Term hold, but rather a position trading stock as others entering the space and force margins to contract.
| |
YOUR DESKTOP / TABLET / PHONE ANNOTATED CHART
Macro Analytics Chart Above: SUBSCRIBER LINK
| |
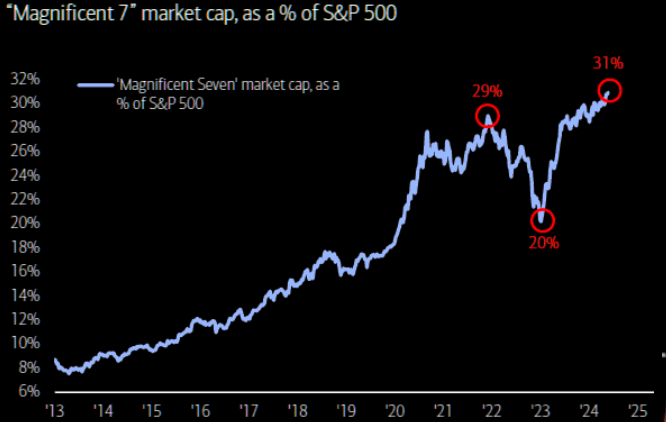
MAGNIFICENT 7
Magnificent 7 is up a magnificent 24% YTD (chart right), contributing >50% of SPX return (NVDA alone = 25%) as monopolistic mega tech monopolizes performance..
Total CAPEX + R&D for the Magnificent Seven this year is expected to total $348bn. (Think about that for a second.)
Here’s another way to frame it - the Magnificent 7 is reinvesting 61% of their operating free cash flow back into
CAPEX + R&D!
- The basket of 'Magnificent 7' stocks soared for the 7th week in the last 8 (and the best week in the last 8) before pulling back ever so slightly at Friday's close.
- We continue to be concerned about the momentum Divergence signal that has been occurring for some time (bottom pane). Continued caution advised.
| |
YOUR DESKTOP / TABLET / PHONE ANNOTATED CHART
Macro Analytics Chart Above: SUBSCRIBER LINK
| |
"CURRENCY" MARKET (Currency, Gold, Black Gold (Oil) & Bitcoin) | |
|
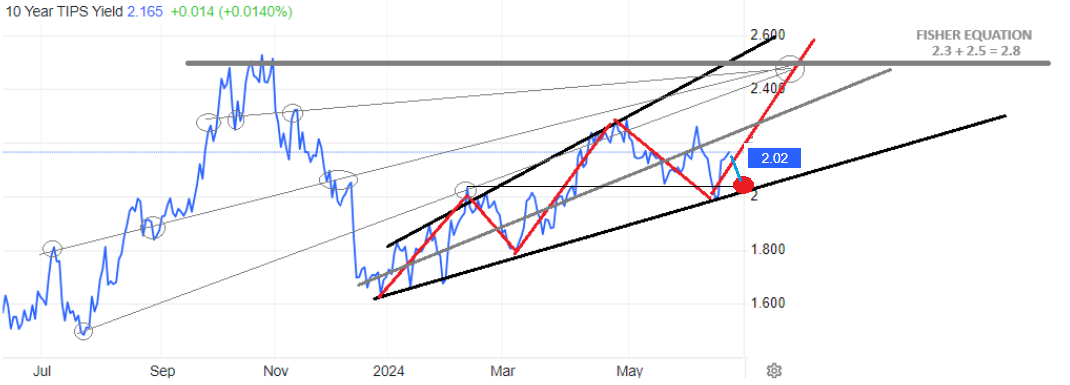
10Y REAL YIELD RATE (TIPS)
Real Rates reached our initial overhead resistance level of 2.25% before falling off hard as part of our expected "X" leg lower (chart right). Wednesday's CPI pushed real rates towards previous lows.
| |
CONTROL PACKAGE
There are TEN charts we have outlined in prior chart packages, which we will continue to watch closely as a CURRENT Control Set:
-
US DOLLAR -DXY - MONTHLY (CHART LINK)
-
US DOLLAR - DXY - DAILY (CHART LINK)
-
GOLD - DAILY (CHART LINK)
-
GOLD cfd's - DAILY (CHART LINK)
-
GOLD - Integrated - Barrick Gold (CHART LINK)
- SILVER - DAILY (CHART LINK)
-
OIL - XLE - MONTHLY (CHART LINK)
-
OIL - WTIC - MONTHLY - (CHART LINK)
-
BITCOIN - BTCUSD -WEEKLY (CHART LINK)
-
10y TIPS - Real Rates - Daily (CHART LINK)
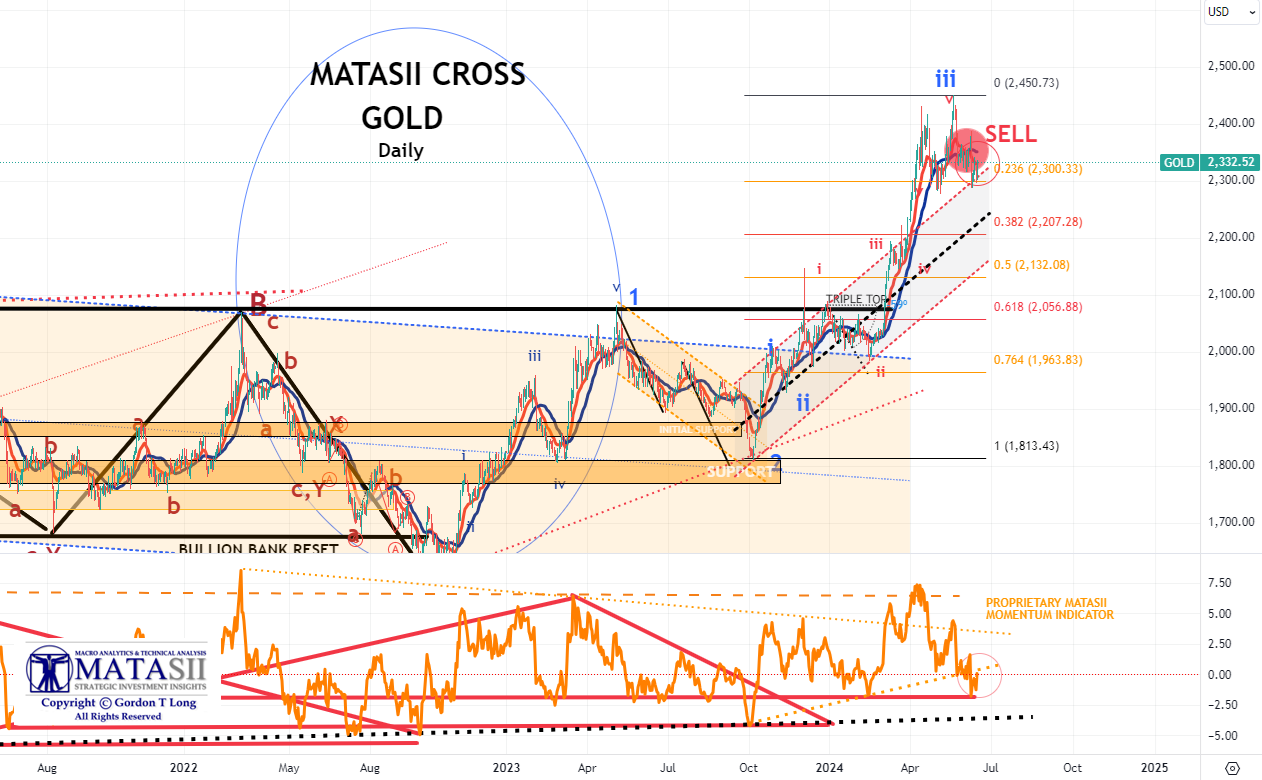
GOLD - DAILY
- Gold continues to weaken as inflation pressures weaken and yields fall.
- The Elliott Wave count still suggests a strong likelihood of a minimum retracement of 38.2% and the 100 DMA.
- Momentum support (lower pane) shows gold has found an important support line. it should be noted there is another longer duration trend support slightly lower (dotted black line).
- Though the MATASII CROSS has given an initial SELL signal on the Daily chart, we caution it may be short lived!
|  | |
YOUR DESKTOP / TABLET / PHONE ANNOTATED CHART
Macro Analytics Chart Above: SUBSCRIBER LINK
| |
|
CHART RIGHT: Is the market finally ready for a break out? Low volume pre-summer vacation break-out moves can be "frustrating".
CONTROL PACKAGE
There are FIVE charts we have outlined in prior chart packages that we will continue to watch closely as a CURRENT "control set":
- The S&P 500 (CHART LINK)
- The DJIA (CHART LINK)
- The Russell 2000 through the IWM ETF (CHART LINK)
- The MAGNIFICENT SEVEN (CHART ABOVE WITH MATASII CROSS - LINK)
- Nvidia (NVDA) (CHART LINK)
| |
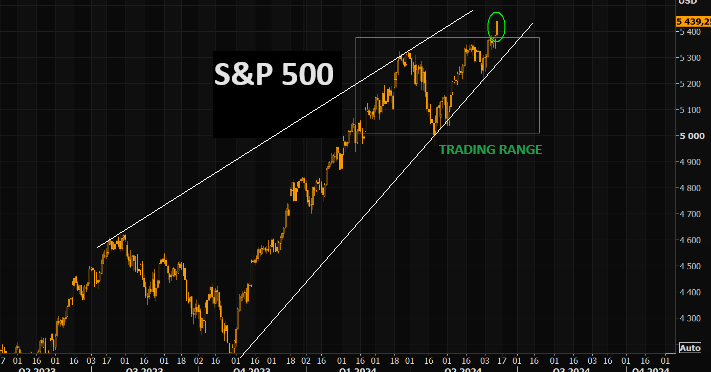
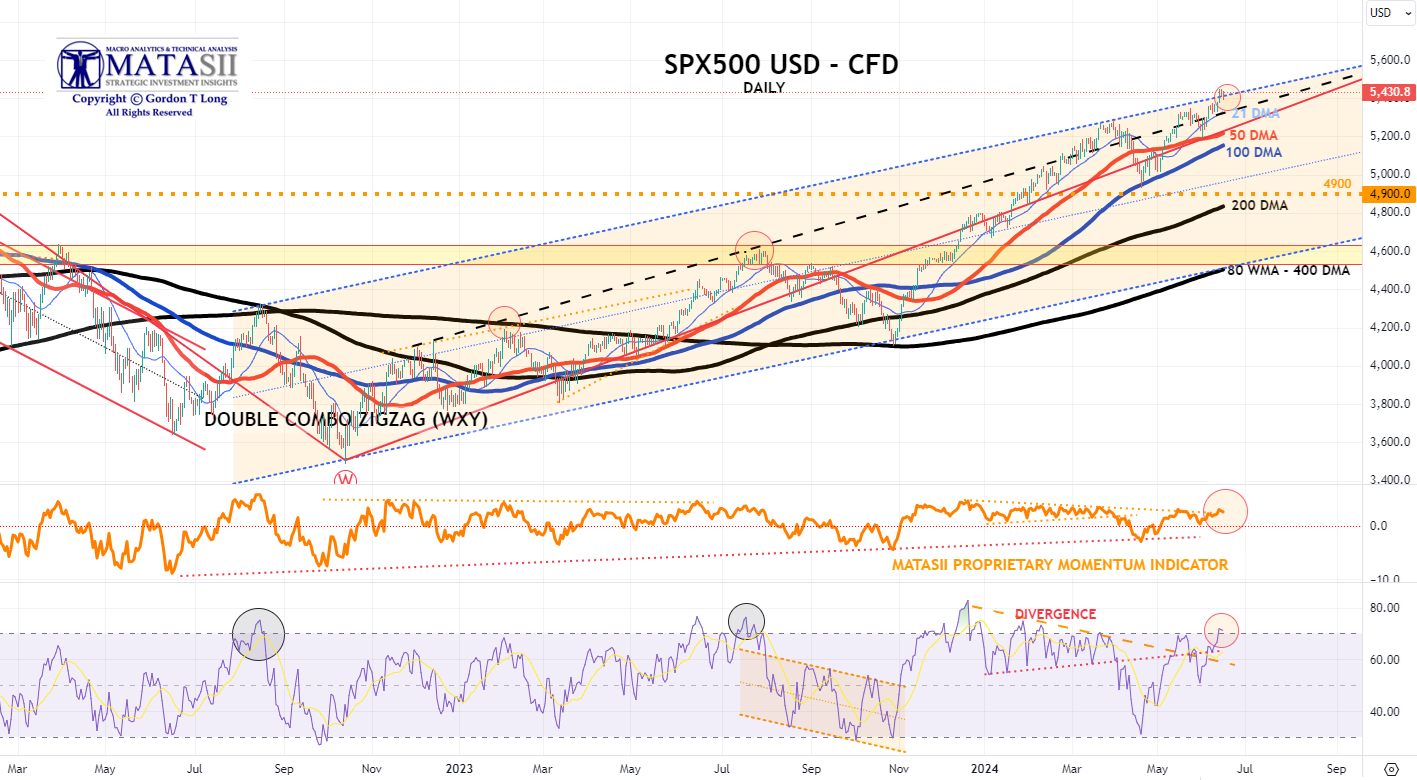
S&P 500 CFD
- The S&P 500 cfd rose aggressively this week through its long term upper trend channel boundary line. (NOTE: see Thought Experiment note below.)
- However, the MATASII Proprietary Momentum Indicator (middle pane) appears to be showing signs of weakening within a Divergence pattern with price and stopped by its overhead momentum resistance trend line.
- We also have an excess RSI level, though it could go slightly higher and sustain itself in the near term.
| |
YOUR DESKTOP / TABLET / PHONE ANNOTATED CHART
Macro Analytics Chart Above: SUBSCRIBER LINK
| |
S&P 500 - Daily - Our Thought Experiment
OUR CURRENT ASSESSMENT IS THAT THE INTERMEDIATE TERM IS LIKELY TO LOOK LIKE THE FOLLOWING
NOTE: To reiterate - "the black labeled activity shown below, between now and July, looks like a "Killing Field", where the algos take Day Traders, "Dip Buyers", the "Gamma Guys" and FOMO's all out on stretchers!"
- The S&P just hit a new all time high this week.
- However, the MATASII Proprietary Momentum Indicator appears to be showing signs of weakening (lower pane) with firm support quite a bit lower.
- The Divergence in Momentum (lower pane) needs to be noted along with a clear long term ending wedge.
| |
YOUR DESKTOP / TABLET / PHONE ANNOTATED CHART
Macro Analytics Chart Above: SUBSCRIBER LINK
| |
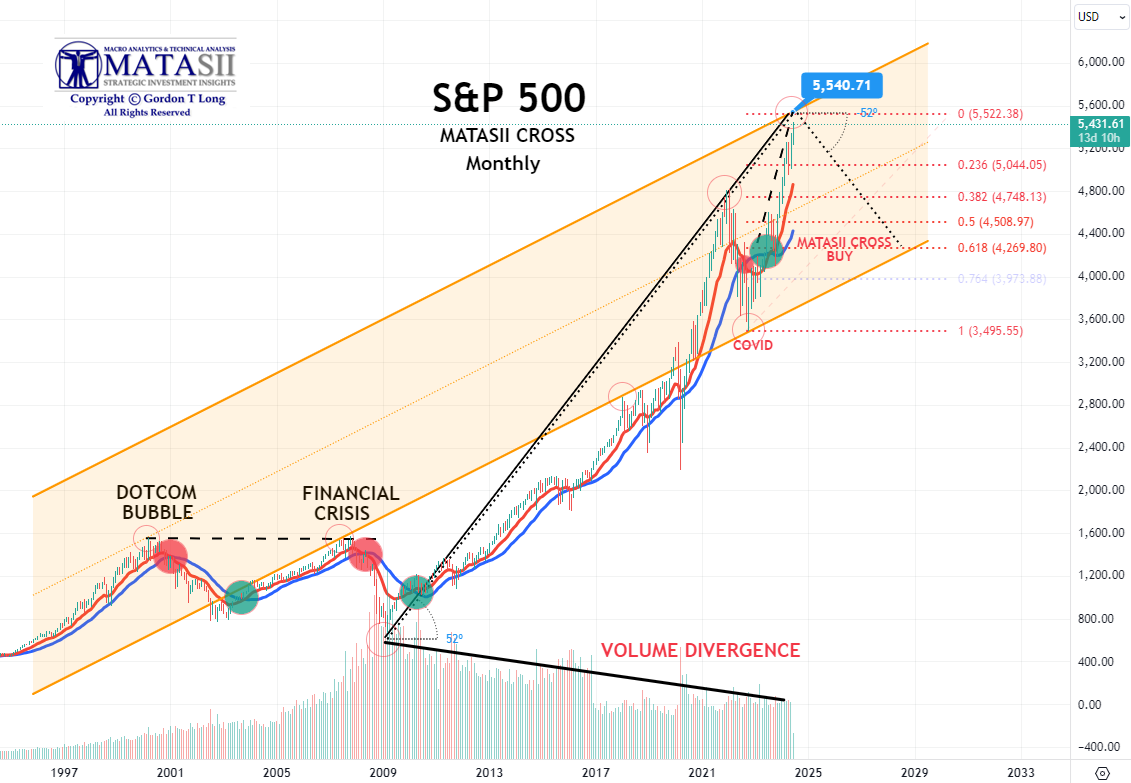
S&P 500 - Monthly - Our Thought Experiment
- We continue to move towards our target of 5540 shown here and on our daily chart (above).
| |
YOUR DESKTOP / TABLET / PHONE ANNOTATED CHART
Macro Analytics Chart Above: SUBSCRIBER LINK
| |
STOCK MONITOR: What We Spotted
|  | |
CONTROL PACKAGE
Remember when "developed world" central banks pretended their inflation target was 2%? Well, that lie died a miserable death today - and will do so again for good measure tomorrow - after the BOC cut rates for the first time in 4 years, and less than a year after its last rate hike, from 5.0% to 4.75% even as Canada's inflation remains a very sticky 2.7%.
And just to underscore the death of the 2% inflation target, tomorrow the ECB will also cut rates for the first time since March 2016, (and 8 months after the last rate hike), even though core Eurozone CPI remains 3%.
Of course, despite all the posturing, the Fed won't be far behind especially once it becomes clear that the myth of strong US job growth was just a mirage, and either in July or September, the Fed will join the party despite core US inflation stuck at a blistering 2.8%.
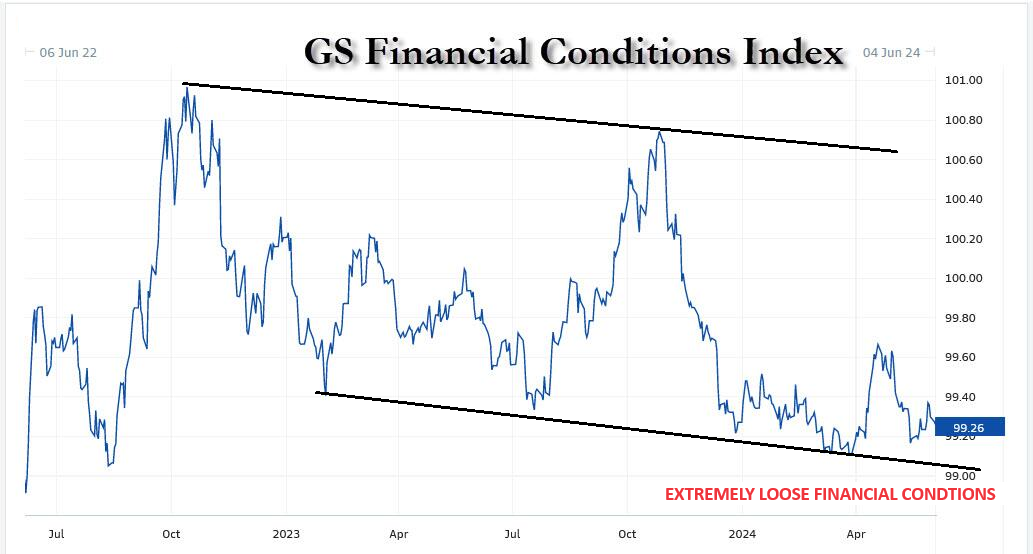
It was this long overdue realization that the G7 central banks have officially raised their inflation target by about 1% that helped pushed bond yields to fresh two month lows, and down more some 35bps in just the past week, down for a 5th straight day as financial conditions have eased dramatically (see chart of Goldman Financial Conditions Index above), undoing any jawboned tightening the Fed tried to inject into the market in recent months: indeed, the latest rate pricing shows a sharp dovish shift in the Fed cut narrative for Sept, rising to 80% vs 45% just one week ago. As Goldman's trader notes, CTAs will become a focus if yields keep moving lower. -- Tyler Durden
There are FIVE charts we have outlined in prior chart packages that we will continue to watch closely as a CURRENT "control set":
- The 10Y TREASURY NOTE YIELD - TNX - HOURLY (CHART LINK)
- The 10Y TREASURY NOTE YIELD - TNX - DAILY (CHART LINK)
- The 10Y TREASURY NOTE YIELD - TNX - WEEKLY (CHART LINK)
- The 30Y TREASURY BOND YIELD - TNX - WEEKLY (CHART LINK)
- REAL RATES (CHART LINK)
FISHER'S EQUATION = 10Y Yield = 10Y INFLATION BE% +REAL % = 2.188% + 2.031% = 4.219%
3YR AUCTION: The US sold USD 53bln of 3yr notes at a high yield of 4.559%, tailing the When Issued by 1.1bps, much larger than the six auction average of a tail of 0.1bps and prior stop-through of 0.3bps. The B/C was also weak at 2.43x, beneath the 2.63x prior and 2.57 six auction average. The soft reception was led by a drop in direct demand which came in beneath the prior average, but indirect demand was relatively stable at 64%, albeit not enough to offset the drop in direct demand, seeing dealers take a chunky 20% of the auction. The soft 3yr auction added to the soft 2yr, 5yr, and 7yr supply recently, with participants perhaps sitting on the sidelines ahead of key risk events like the US CPI and FOMC on Wednesday.
10-YEAR REVIEW: A very strong 10-year note auction. The US sold USD 39bln of 10yr notes at a high yield of 4.438%, stopping through the 4.458% WI by 2bps vs the prior and six auction averages of a tail of 1.1bps, also showing the largest stop-through since February 2023. The B/C of 2.67x was also stronger than the prior and six auction average of c. 2.50x. The breakdown of bidders saw a huge increase in indirect demand, rising to 74.6% from 65.5%, well above the 65.4% average. Direct demand dipped to 13.8% from 18.7%, falling beneath the 17.53% average, but the huge Indirect takedown saw dealers (forced surplus buyers) left with just 11.6% of the auction, beneath the 15.7% prior and 17.03% average. The strong 10-year note auction is on the heels of a slew of disappointing short-end and belly auctions, perhaps with uncertainty around the Fed/inflation keeping participants on the sidelines in the more Fed-exposed part of the curve and opting for longer-dated supply instead. The strong demand comes despite the huge event risk on Wednesday - which tends to see buyers take a step back - with both US CPI and the FOMC rate decision with accompanying Dot Plots due. There is the 30-year Bond auction on Thursday too, post Fed and CPI. Note, that analysts also highlight with bond volatility at the low end of multi-year ranges. It is likely that supported some buyers to step in.
| |
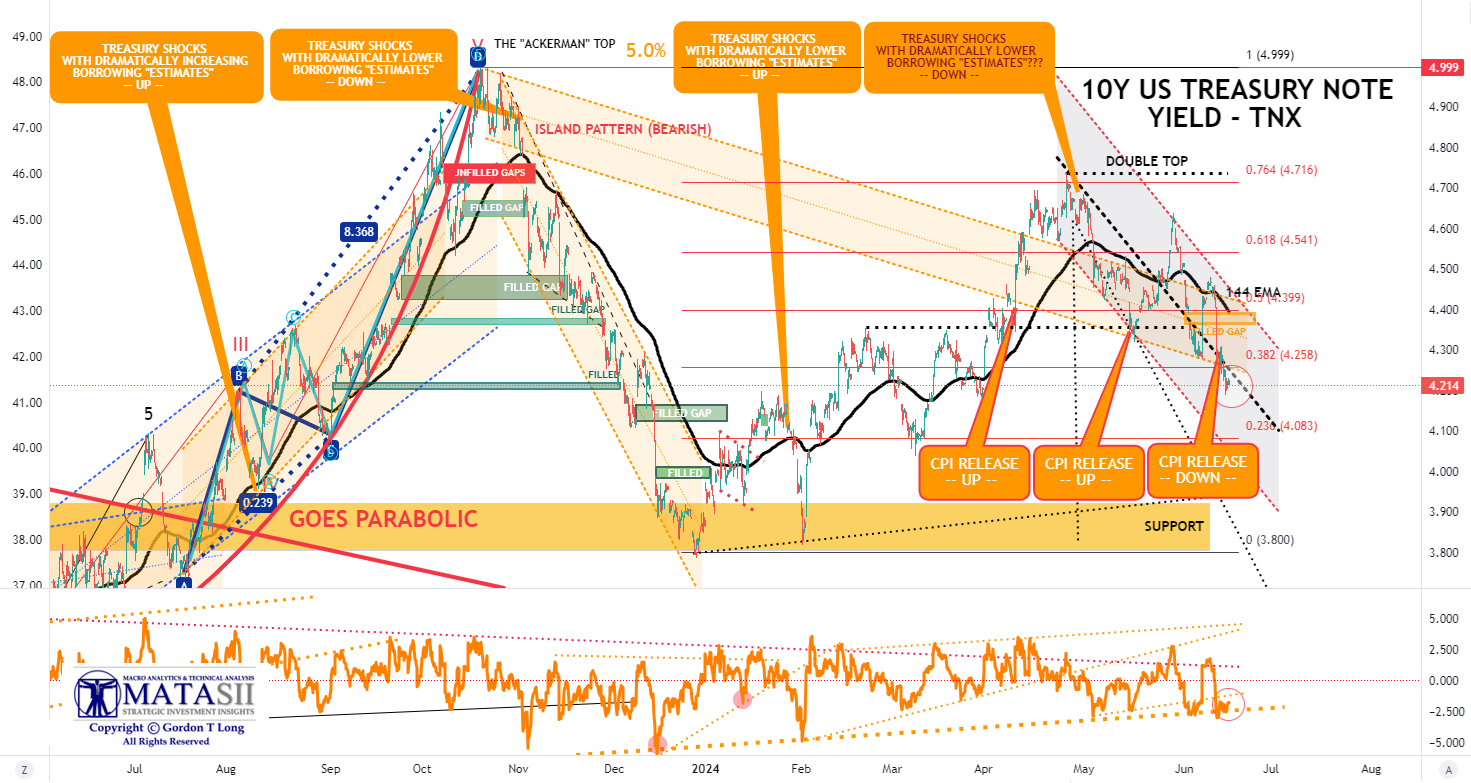
10Y UST - TNX - Hourly
- The TNX plunged on the release of the My CPI finding support again at the descending long term trend channel's lower boundary line.
- Importantly in the near term is that Momentum (lower pane) appears to have reached a longer term support level.
| |
YOUR DESKTOP / TABLET / PHONE ANNOTATED CHART
Macro Analytics Chart Above: SUBSCRIBER LINK
| |
NOTICE Information on these pages contains forward-looking statements that involve risks and uncertainties. Markets and instruments profiled on this page are for informational purposes only and should not in any way come across as a recommendation to buy or sell in these assets. You should do your own thorough research before making any investment decisions. MATASII.com does not in any way guarantee that this information is free from mistakes, errors, or material misstatements. It also does not guarantee that this information is of a timely nature. Investing in Open Markets involves a great deal of risk, including the loss of all or a portion of your investment, as well as emotional distress. All risks, losses and costs associated with investing, including total loss of principal, are your responsibility.
FAIR USE NOTICE This site contains copyrighted material the use of which has not always been specifically authorized by the copyright owner. We are making such material available in our efforts to advance understanding of environmental, political, human rights, economic, democracy, scientific, and social justice issues, etc. We believe this constitutes a ‘fair use’ of any such copyrighted material as provided for in section 107 of the US Copyright Law. In accordance with Title 17 U.S.C. Section 107, the material on this site is distributed without profit to those who have expressed a prior interest in receiving the included information for research and educational purposes. If you wish to use copyrighted material from this site for purposes of your own that go beyond ‘fair use’, you must obtain permission from the copyright owner.
========
| |
MATASII'S STRATEGIC INVESTMENT INSIGHTS | |
2020 VIDEOS OUTLINING THE COMING RISE IN INFLATION, STAGLFLATION & COMMODITY PRICES | |
IDENTIFICATION OF HIGH PROBABILITY TARGET ZONES | |
Learn the HPTZ Methodology!
Identify areas of High Probability for market movements
Set up your charts with accurate Market Road Maps
Available at Amazon.com
| |
The Most Insightful Macro Analytics On The Web | | | | |