|
LONGWave - APRIL 2024
Technical Analysis - 04/22/24
| |
THE TAX PAYER COST FOR UNCONTROLLED IMMIGRATION
OBSERVATIONS: WHAT KIND OF ECONOMY HAVE WE WROUGHT?
A PART TME WORK ECONOMY: The hard fact is virtually all the jobs added YTD are part-time jobs. Full-time jobs have actually been disappearing since December of last year. In fact considering that the year-over-year measure of full-time jobs has fallen it would normally be recognized as a pillar of being in recession territory.
IMMIGRANT HIRING: Most of the new part-time jobs are going to immigrants, many of whom are in the country illegally. There has been zero job creation for native-born Americans since mid-2018. While immigrants are not harming the economy by working, the scale of new foreign-born workers has papered over the employment struggles of the native-born population (those who legally pay taxes).
GOVERNMENT JOBS: Being completely obscured is the fact that government jobs accounted for almost a quarter of those added—way above the standard ten to twelve percent. Just like with government spending and economic growth, government hiring boosts the official jobs number while draining the actual, value-producing economy.
PRIVATE SECTOR RECESSION: As we have pointed out with the difference between GDP and GDI, the U.S. economy is already experiencing a private-sector recession. However, government spending and hiring are propping up the official data enough to hide it.
A recession is inevitable, thanks to the last decade of interest rate manipulation by the Federal Reserve—and especially to its dramatic actions during the pandemic. The recession-like condition in full-time jobs is further evidence that we are right.
LOST PURCHASING POWER: The US dollars is worth about 20 percent less than they were four years ago on a purchasing power basis, with no prospect of that trend reversing.
STUDENT DEBT FORGIVENESS: President Biden is scrambling to put the brakes on energy production and to transfer money from the working class to his base of left leaning and indoctrinated college graduates, all before he’s up for re-election in November!
| |
 | |
THIS WEEK WE SAW
Exp=Expectations, Rev=Revision, Prev=Previous
US
US NY Fed Manufacturing (Apr) -14.3 vs. Exp. -7.5 (Prev. -20.9)
US Retail Sales MM (Mar) 0.7% vs. Exp. 0.3% (Prev. 0.6%, Rev. 0.9%)
US Retail Control (Mar) 1.1% vs. Exp. 0.4% (Rev. 0.3%)
US Industrial Production MM (Mar) 0.4% vs. Exp. 0.4% (Prev. 0.1%, Rev. 0.4%)
US Manufacturing Output MM (Mar) 0.5% vs. Exp. 0.3% (Prev. 0.8%, Rev. 1.2%)
US Building Permits Number (Mar) 1.458M vs. Exp. 1.515M (Prev. 1.524M, Rev. 1.523M)
US Housing Starts Number (Mar) 1.321M vs. Exp. 1.487M (Prev. 1.521M, Rev. 1.549M)
Atlanta Fed GDPnow (Q1) was raised to 2.9% from 2.8%.
US Philly Fed Business Index (Apr) 15.5 vs. Exp. 2.3 (Prev. 3.2)
US Philly Fed Prices Paid 23.0 (Prev. 3.7)
US Leading Index MM (Mar) -0.3% vs. Exp. -0.1% (Prev. 0.1%, Rev. 0.2%)
US Existing Home Sales (Mar) 4.19M vs. Exp. 4.2M (Prev. 4.38M)
US Initial Jobless Claims 212k vs. Exp. 215k (Prev. 211k, Rev. 212k)
US Continued Jobless Claims 1.812M vs. Exp. 1.810M (Prev. 1.817M, Rev. 1.810M)
| |
========================= | |
|
WHAT YOU NEED TO KNOW!
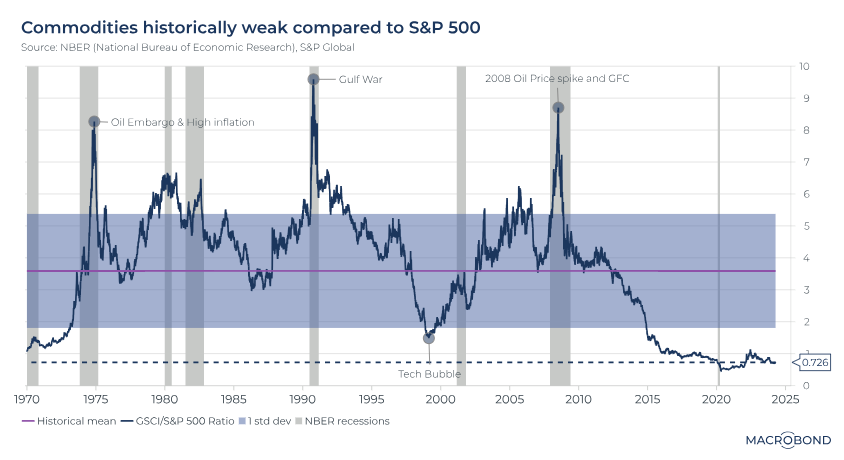
ARE COMMODITIES UNDERPRICED??
It isn't so much that commodities are underpriced to an unprecedented level, but rather both the S&P 500 and US$ together are excessively over-valued!
When the dollar starts weakening along with the Equity markets it will be time to buy Commodities aggressively. The first wave of this occurring is already signaling with Gold, Silver, Copper, Cocoa and a few others. All indicate where we are headed.
RESEARCH
THE TAX PAYER COST FOR UNCONTROLLED IMMIGRATON
- As of March 2024, border security is routinely experiencing daily encounters of over 7,000 with a cumulative total of that during an April 10 press conference. House Speaker Mike Johnson (R-La.) said he estimates that nearly 16 million illegal immigrants entered the United States under the Biden administration.
- Adjusted for inflation, the lifetime cost to taxpayers of each illegal immigrant is over $80,000 according to reporting by the Center for Immigration Studies.
- Using Speaker Mike Johnson's April 10th update of 16M Illegal Immigrants, the Tax Payer cost of Illegal Immigration is $1.28 TRILLION.
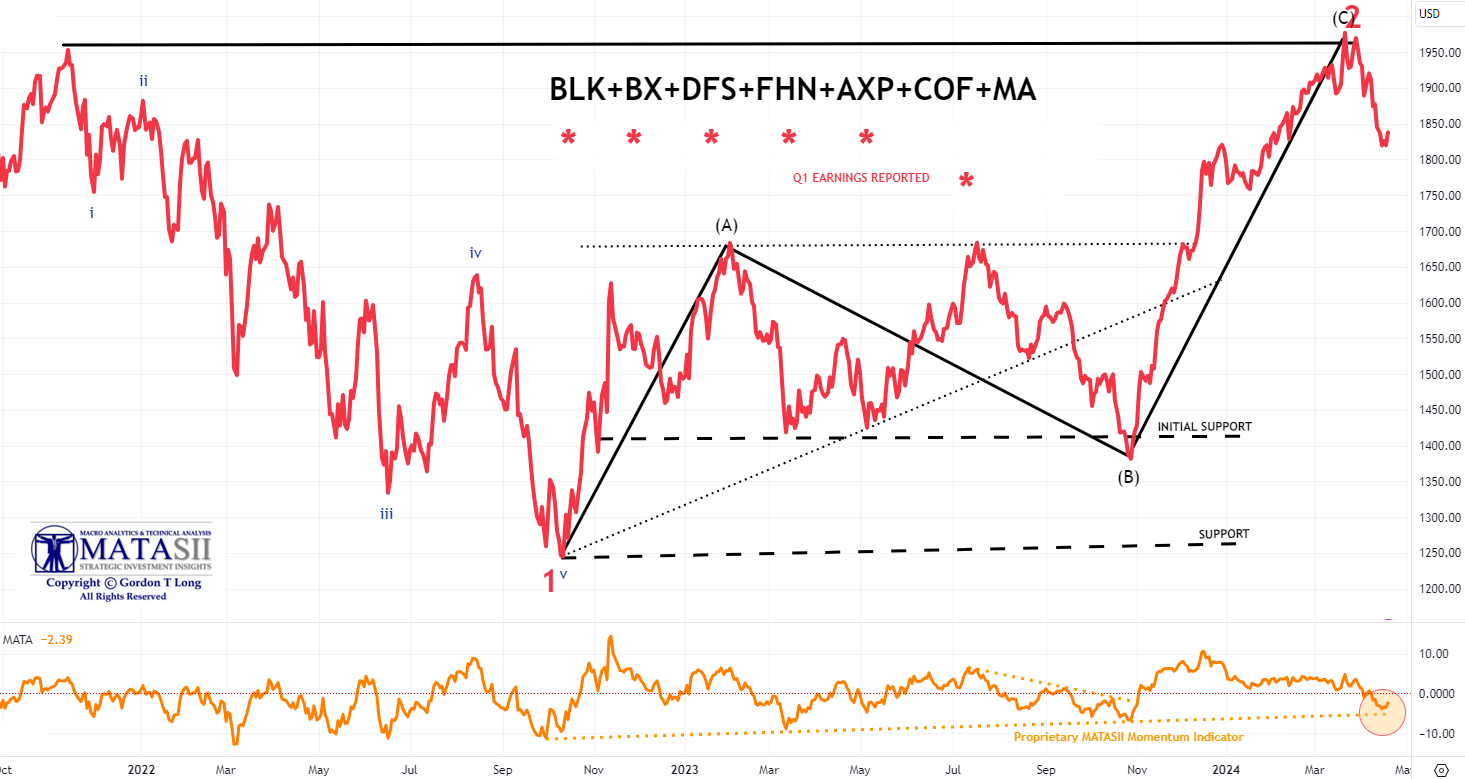
2024 Q1 EARNINGS
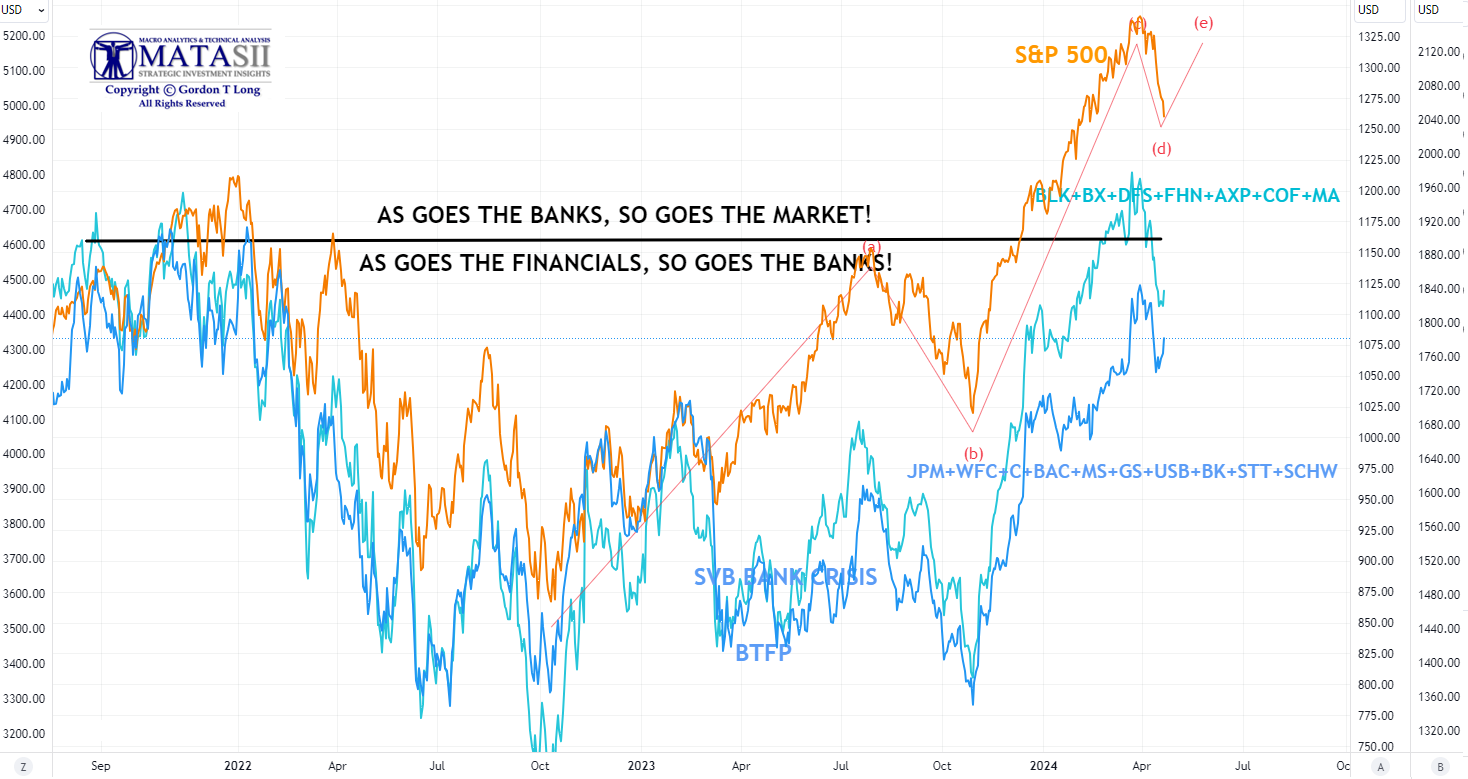
- Bank stocks, though initially weak on earnings release, have been trending up while the overall market weakened.
- The Financials appear to be trying to follow the Banking stocks higher against the overall trend of the market.
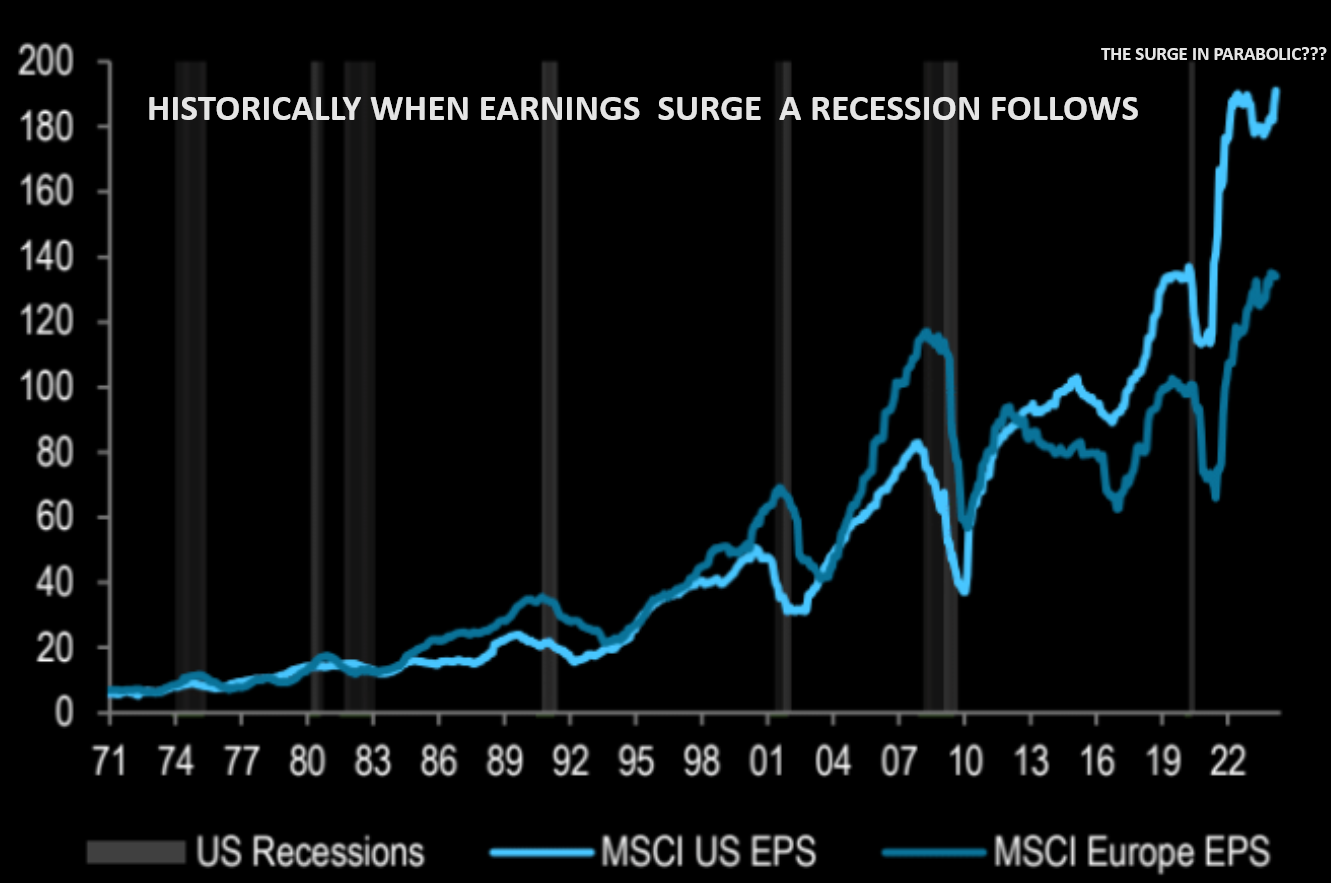
- Earnings are at or near all-time highs in Europe and US. Historically when Earnings surge a Recession follows. The surge this time is parabolic! Does this fit with the current "No-Landing" - "No Recession" narrative?
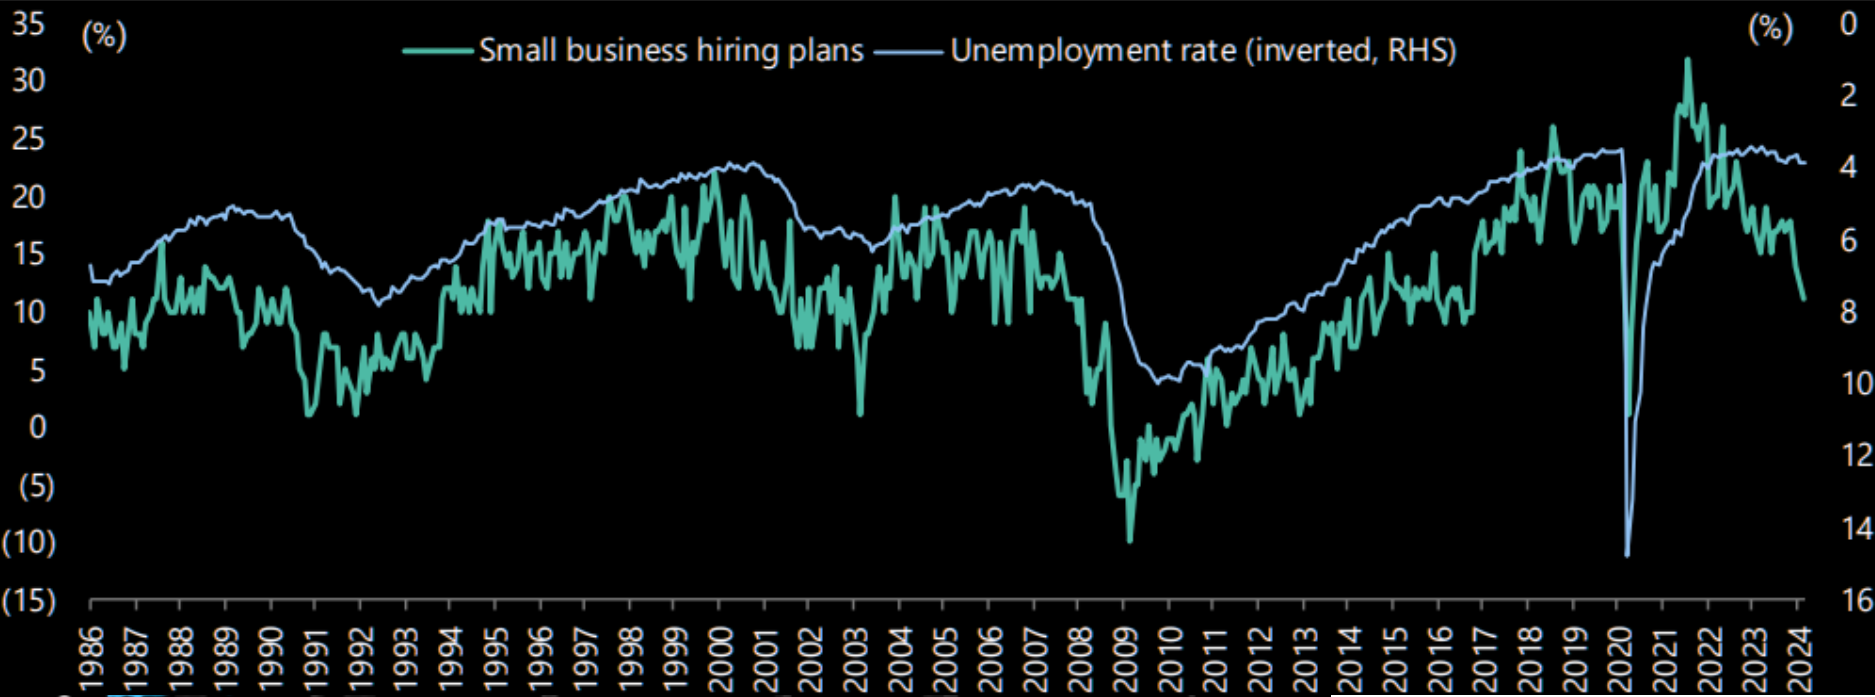
- Small Business hiring plans are plunging - does this correlate with a strong earnings outlook? Maybe for the major global corporations, but not for America that historically has been built on small business.
| |
|
DEVELOPMENTS TO WATCH
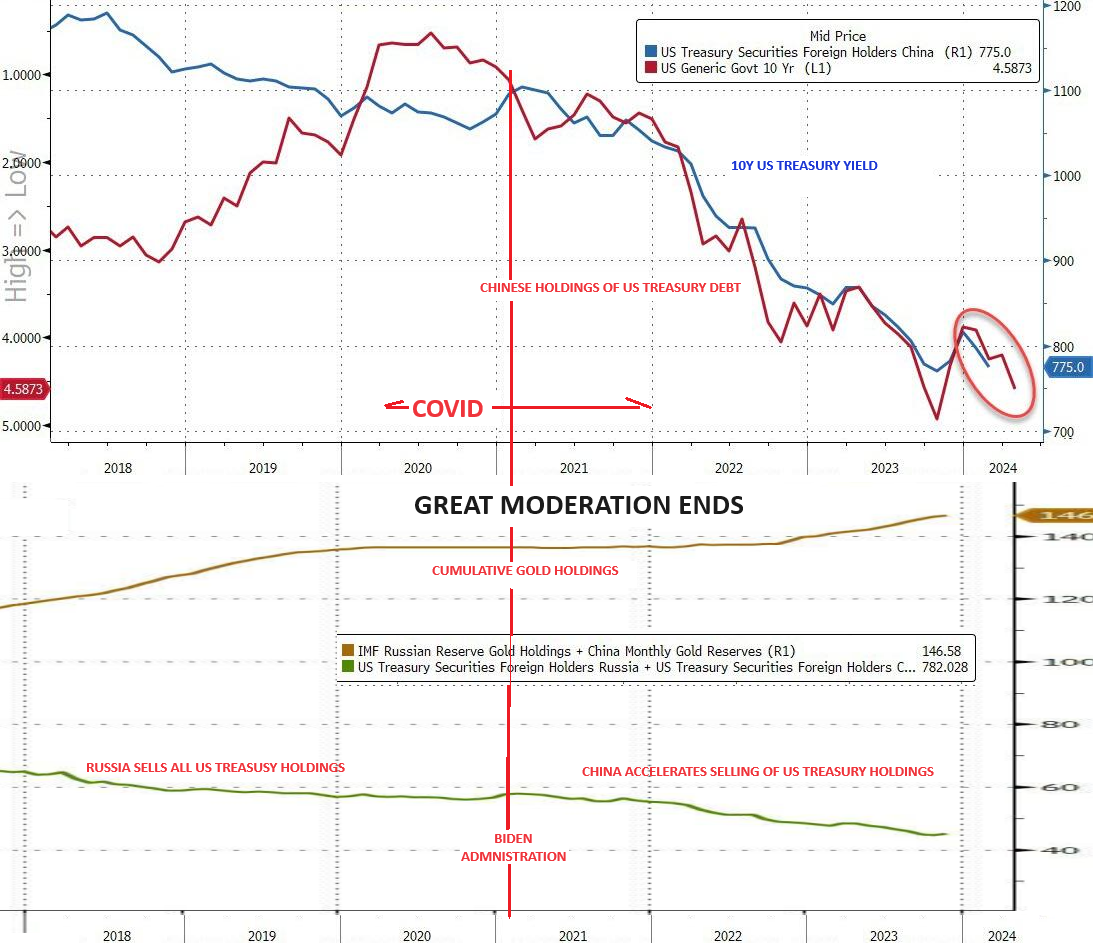
CHINA: IS CHINA CONTRIBUTING TO RISING US TREASURY YIELDS?
- In 2013 China held around $1.3T of US Treasury Debt. When China's holdings fell to ~0.9T, it was an obvious problem. The latest TICs report was a real eye opener with China plummeting to $0.775T.
- The correlation with rising US Treasury Yields is readily apparent (chart right - Top pane).
- It is also clear (chart right - bottom pane) that China is using the sales to buy Gold.
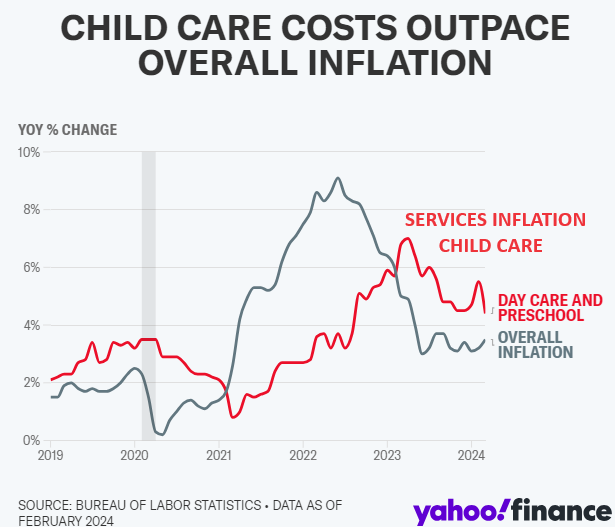
SERVICE INFLATION: EXPLODING CHILD CARE INFLATION
- Parents are drowning in childcare costs, and high inflation is adding to their laundry list of daily expenses.
- According to a recent survey from childcare platform Care.com:
- The average cost to enroll a child in a licensed day care can set you back $16,692 annually in 2024, or $321 a week for just one child. Infant care in a home day care costs $230 a week, or $11,960 a year.
- The price of a full-time nanny stood at an average of $766 per week, tallying up to $39,832 annually.
- A typical family with an income of $69,651 in New York could spend 22.1% of their annual income on childcare, while minimum-wage earners, making about $24,544, would spend 62.7% of their annual income on infant care.
| |
|
GLOBAL ECONOMIC REPORTING
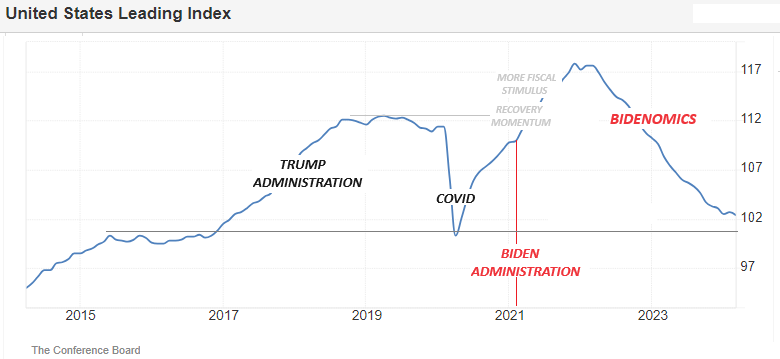
- LEADING ECONOMIC INDICATOR (LEI)
- The LEI’s six-month and annual growth rates remain negative, but the pace of contraction has slowed.
- Overall, the Index points to a fragile—even if not recessionary—outlook for the U.S. economy.
- According to the Conference Board: "rising consumer debt, elevated interest rates, and persistent inflation pressures continue to pose risks to economic activity in 2024."
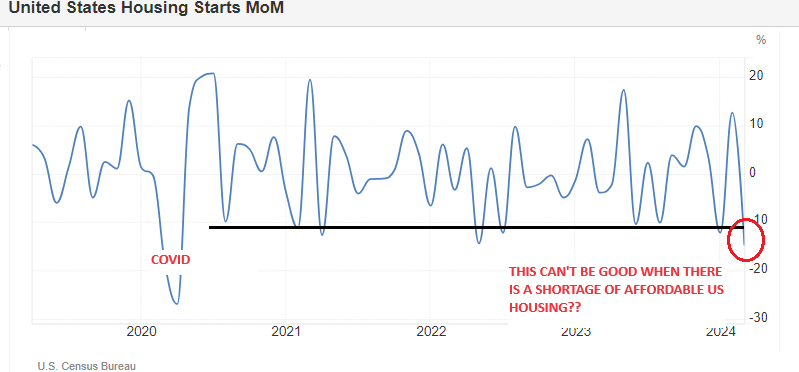
- HOUSING STARTS/BUILDING PERMITS
- “The drop in permits and the spike in mortgage rates following the release of the March CPI report lend some downside risk to our forecast for a modest rise in housing starts over the rest of 2024.”
- RETAIL SALES
- "that the retail sales number is a nominal dollar growth rate and with inflation running so hot this is accounting for much of the growth. Real retail sales, i.e. retail sales adjusted for inflation, are much weaker and essentially have been flat for the past three years".
- EMPIRE SURVEY
- The report summarizes that business activity continued to decline in New York.
- The headline general business conditions index rose but remained below zero.
| |
|
In this week's "Current Market Perspectives", we focus on what the Credit Markets (CDX) are telling us versus the MOVE (Bond Volatility)) and VIX (Equity Volatility) along with the current level of Real Rates.
=========
| |
|
THE TAX PAYER COST FOR UNCONTROLLED IMMIGRATON
The anticipated annual expense related to handling illegal immigration in the United States is substantial. As of 2023, American taxpayers bear a significant financial burden due to various costs associated with illegal immigration.
As of March 2024 border security is routinely experiencing daily encounters of over 7,000 with a cumulative total of that. During an April 10 press conference, House Speaker Mike Johnson (R-La.) said he estimates that nearly 16 million illegal immigrants entered the United States under the Biden administration.
Financial data is extremely limited as many government agencies simply don't report and therefore it is difficult to assemble. This is what we have sourced (sources are as indicated).
- U.S. Department of Homeland Security (DHS) is distributing $300 million to sanctuary cities that provide services like shelter and food to illegal immigrants. (1)
- The $300 million in grants will be provided through the Shelter and Services Program (SSP), according to an April 12 press release. SSP offers funding to non-federal entities like NGOs and local governments that provide support to illegal immigrants released into the United States by the DHS. Out of the $300 million, $275 million will be distributed in the first allocation, with the remaining $25 million to be allocated later this year to meet operational requirements.
- In addition to the $300 million funding, the DHS also announced $340.9 million for the SSP competitive grant program. (1)
- Last year, over $780 million was distributed through SSP and another program that went to organizations and sanctuary cities across the country that provided services to illegal immigrants. Well-known sanctuary cities include Los Angeles, Chicago, New Orleans, New York City and San Francisco.
- CHNV PROGRAM: In January 2023, the Biden administration announced the Cubans, Haitians, Nicaraguans, and Venezuelans (CHNV) program that allows people from the four nations the right to live and work lawfully in the United States for a period of two years under a legal mechanism called “humanitarian parole.” In an April 12 press release, CBP said that more than 404,000 individuals from these four nations who arrived via commercial flights “were granted parole under these processes.” According to a Freedom of Information Act (FOIA) lawsuit filed by the Center for Immigration Studies (CIS), “hundreds of thousands of inadmissible aliens from foreign airports” were ferried into some 43 American airports in the past year through CBP-approved secretive flights. CBP did not reveal the names of the 43 American airports that received 320,000 illegal immigrants last year. Instead, the agency admitted that the process was creating law enforcement vulnerabilities.(1) COSTS: UNREPORTED
- Sources such as Newsweek hint that the true cost may be even higher, possibly reaching $150 billion annually, an amount shared by both federal and state governments. In all actuality, the financial impact could be much worse.(2)
- Estimates suggest that illegal immigrants cost each household about $1,000, adding up to more than $120 billion a year.
- Border Crisis Costs Municipalities $202 Billion - and at least another $159 million per day. (3)
- Adjusted for inflation, the lifetime cost to taxpayers of each illegal immigrant is over $80,000.(4)
- Under Biden’s orders, Homeland Security has released into the United States nearly 2 million illegal border-crossers (so far!), meaning their lifetime cost to taxpayers will be close to $150 billion. Add in another 1 million got-aways — border infiltrators who were detected (by cameras or ground sensors or other means) but not apprehended because the Border Patrol had its hands full dealing with all the illegal immigrants turning themselves in knowing they’d be released — and the lifetime cost for taxpayers soars past $200 billion.(4)
Using Speaker Mike Johnson's April 10th update of 16M this number would be $1.28 TRILLION .
SOURCES:
- Epoch Times: Authored by Naveen Athrappully via The Epoch Times,
- Epoch Times: Authored by Chadwick Hagan via The Epoch Times,
- Center for Immigration Studies - 02-03-2023
- Center for Immigration Studies - 02-10-2023
| 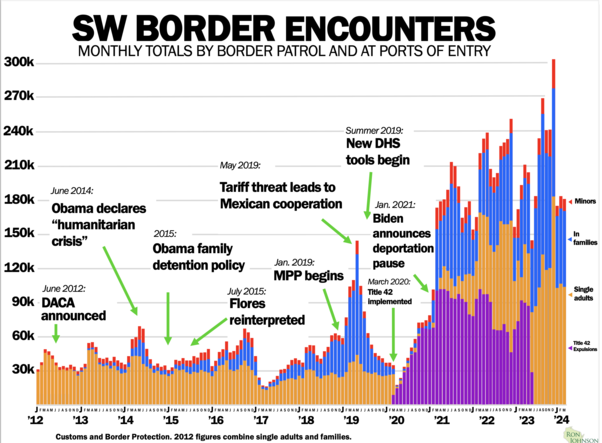 | |
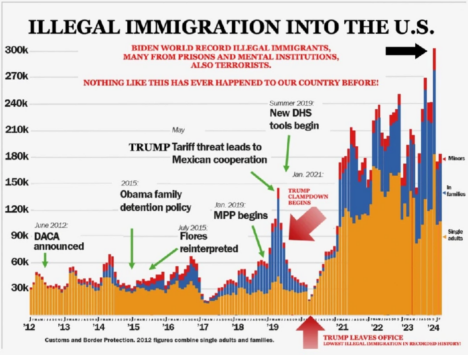
BACKGROUND ON CHART ABOVE: As the chart above shows, the peak of the first wave of migrants occurred in 2014. President Obama correctly called it a humanitarian crisis and his Homeland Security secretary said it was a "bad day" when apprehensions exceeded 1,000.
Responding to the second wave in 2018 and 2019, President Trump enacted policies and entered into agreements with Mexico and Guatemala that greatly reduced the migration of children and families. Under Senator Johnson's leadership as Chairman of the Homeland Security and Governmental Affairs Committee from 2015-2020, Senator Johnson's committee was able to the following:
- Established quantifiable, objective metrics for DHS to use to measure border security (Border Security Metrics Act of 2015, included in the NDAA).
- Held more than 30 hearings and released two staff reports examining the factors that have led to our failure to secure our borders, including one examining lessons we can learn from Israel’s approach to border security, aviation security and cybersecurity.
- During the humanitarian crisis at the border in 2018, the committee held more than 20 bipartisan staff briefings, several member briefings, and also took staff delegation trips to the border, culminating in a majority staff report in 2018 examining the staggering increase in family unit illegal border crossings from 2015-2019, and providing recommendations to address the problem.
- Developed a proposal in 2019 for a streamlined process called Operation Safe Return that became the basis for two DHS expedited processing programs at our border that have helped reduce holding time for illegal crossings and make the process more effective and efficient.
- Unfortunately, under the Biden Administration, or the third wave, border security is routinely experiencing daily apprehensions over 4,000. This is a direct result of the Biden Administration's policies. Biden transition officials asked Trump Homeland Security officials how to prevent a border crisis. They were explicitly told to keep the Migrant Protection Protocols (a.k.a. Remain in Mexico) and other agreements with Mexico and Central American countries in place. Upon assuming office, instead of heeding that advice, President Biden completely dismantled the very policies that had ended the surge. The border is now in a crisis that far exceeds anything during the previous administrations and the media is silent.
SOURCE: Senator Ron Johnson's August 16, 2021 Border Security Round Table - Participants included: Mark Morgan - Former Commissioner of U.S. Customs and Border Protection Brandon Judd - President of the National Border Patrol Council, Laurie Badura - Mother of Fentanyl victim and founder of Saving Others For Archie, Mark Podoll - Green Lake County Sheriff, Martin Schulteis - Washington County Sheriff, Ryan Waldschmidt - Fond du Lac County Sheriff.
| |
FOR FULL AND BALANCED COVERAGE WE SUBMIT THE FOLLOWING:
1- GENERALLY ACCEPTED MAINSTEAM MEDIA "CONSENSUS" DATA POSITION (NOT OURS WHICH IS NEARLY 10X LARGER)
- Net Cost of Illegal Immigration:
- At the federal, state, and local levels, the net cost of illegal immigration is at least $150.7 billion.
- This figure is derived by subtracting the tax revenue paid by illegal aliens (approximately $32 billion) from the gross negative economic impact of illegal immigration ($182 billion).
-
In 2017, the estimated net cost was around $116 billion, indicating an increase of nearly $35 billion in just five years1.
- Cost Breakdown:
- Taxpayers pay $182 billion annually to provide services and benefits to illegal aliens and their dependents.
- Tax payments by illegal aliens cover only around a sixth of the costs they create at all levels in the country.
- Evidence shows that many illegal aliens work in the underground economy and frequently avoid paying income tax altogether.
-
Some even receive net cash profits through refundable tax credit programs1.
- Individual Impact:
- Each American taxpayer bears an annual cost of $1,156 due to illegal immigration (or $957 after factoring in taxes paid by illegal aliens).
- Each illegal alien or U.S.-born child of illegal aliens costs the U.S$8,776 annually1.
- Comprehensive Examination:
- This cost study report provides a comprehensive examination of the financial impact of illegal immigration.
- Costs range from emergency medical care to in-state tuition, incarceration, and welfare programs.
-
The burden falls on American citizens and legal immigrants, as only a fraction of these costs is recouped from taxes paid by illegal aliens1.
In summary, the annual expense related to handling illegal immigration includes a wide range of costs, impacting taxpayers, public services, and various aspects of life in the United States1.
| |
|
2- MAINSTREAM REASON WHY THE RECENT IMMIGRATION BILL WAS NOT APPROVED BY CONGRESS? (NOT OUR OPINION WHICH IS THAT THE BILL DIDN'T HALT ILLEGAL IMMIGRATION BUT RATHER WAS AIMED AT PRIMARILY FINANCING & FACILITATING FASTER BORDER CLEARING & DISBURSEMENT OF "EARMARKS")
The recent Immigration Bill faced significant opposition and ultimately failed in the Senate. Here are some key points about the bill and the reasons behind its failure:
-
Bill Overview:
- The bill, known as the Emergency National Security Supplemental Appropriations Act, is aimed to address border policy and foreign aid.
- It included provisions related to border barriers, detention facilities, and hiring more immigration officers and judges.
- The bill sought to expedite the asylum process and increase the standard of evidence needed for asylum status.
-
It also allocated funds for interdicting fentanyl and human trafficking, as well as providing aid to Ukraine and Israel1.
-
Opposition and Distortions:
- Former President Donald Trump and other Republican leaders opposed the bill even before its release.
- Some Republicans distorted the bill’s provisions, claiming it would allow up to 5,000 illegal entries per day.
- Controversy centered on emergency authority to “summarily remove” people crossing illegally, even if seeking asylum.
-
Critics argued that presidents already had such authority, but courts had blocked Trump’s attempts1.
-
Senate Vote:
- On February 7, the bill failed in the Senate.
- All but four Republicans and a few Democrats opposed it.
-
Despite bipartisan efforts, political considerations influenced the outcome12.
-
Complexity and Political Landscape:
- Immigration bills face challenges due to ideological differences, partisan politics and competing priorities.
- Balancing security, humanitarian concerns and economic needs remains difficult.
-
The bill’s failure reflects broader divisions within Congress13.
In summary, the recent immigration bill encountered opposition, distortions and political dynamics, leading to its failure in the Senate12.
| |
2024 Q1 EARNINGS
KEY METRICS
Earnings Scorecard: For Q1 2024 (with 14% of S&P 500 companies reporting actual results), 74% of S&P 500 companies have reported a positive EPS surprise and 58% of S&P 500 companies have reported a positive revenue surprise.
Earnings Growth: For Q1 2024, the blended (year-over-year) earnings growth rate for the S&P 500 is 0.5%. If 0.5% is the actual growth rate for the quarter, it will mark the third-straight quarter of year-over-year earnings growth for the index.
Earnings Revisions: On March 31, the estimated (year-over-year) earnings growth rate for the S&P 500 for Q1 2024 was 3.4%. Six sectors are reporting (or are expected to report) lower earnings today (compared to March 31) due to negative EPS surprises and downward revisions to EPS estimates.
Earnings Guidance: For Q2 2024, 7 S&P 500 companies have issued negative EPS guidance and 5 S&P 500 companies have issued positive EPS guidance.
Valuation: The forward 12-month P/E ratio for the S&P 500 is 19.9. This P/E ratio is above the 5-year average (19.1) and above the 10-year average (17.8).
|  | |
REPORTING THIS WEEK
MONDAY
- Ericsson (ERICB SS) Q1 (SEK): Net Sales 53.325bln (exp. 54.140bln). Adj. EBIT 4.305bln (exp. 2.807bln). Adj. gross margin 42.7% (exp. 40.2%). Network gross margin 44.3% (prev. 40.6% Y/Y); Sees sales stabilizing in H2 2024.
TUESDAY
- Bank of America (BAC) -3.5%: Was very choppy post-earnings; EPS, revenue, NII, and NIM beat with strong revenue breakdown, although CRE charge-offs rose to USD 304mln (prev. 115mln in Q4 and 39mln in Q3), albeit still at a low level. Post-earnings, next quarter NII view surpassed expectations.
- Morgan Stanley (MS) +2.5%: Strong earnings; EPS, revenue beat with strong Wealth Management revenue.
- Bank of New York Mellon (BK) -2%: Top and bottom line surpassed Wall St. expectations alongside a new USD 6bln buyback program. But, forecasts lower-than-expected NII for 2024.
- United Health (UNH) +5%: Better-than-expected results.
- PNC Financial Services (PNC) -2%: Mixed earnings; bottom line and NII beat, but top line missed and said soft demand weighed on loan growth.
WEDNESDAY
- ASML ADR (ASML) -7%: Revenue and bookings missed, with next quarter top-line guidance light.
- ASML (ASML NA) Q1 (EUR): Revenue 5.29bln (exp. 5.39bln). Bookings 3.61bln (exp. 4.63bln). Adj. EPS 3.11 (exp. 2.68). 2024 outlook unchanged; Guides Q2 revenue between 5.7-6.2bln (exp. 6.62bln)
- United Airlines (UAL) +17%: Posted a much shallower loss per share than expected and beat on revenue, while for the FY adj. EPS was light but revenue midpoint topped forecasts.
- United Airlines Holdings Inc (UAL) - Q1 2024 (USD): Adj. EPS -0.15 (exp. -0.57), Revenue 12.50bln (exp. 12.45bln). PRASM USD 15.79 (exp. 15.68)Revenue passenger miles 57.43bln (exp. 57.36bln). Available seat miles 71.67bln (exp. 71.19bln). Load factor 80.1% (exp. 80.7%). Co. said the demand environment remained strong. (PR Newswire) Shares rose 5.2% pre-market. +5.3% in pre-market trade
- J.B. Hunt (JBHT) -8%: Metrics disappointed with underwhelming commentary.
- Citizens Financial (CFG) +2%: EPS and net income beat.
- US Bancorp (USB) -3.5%: Total avg. deposits, loans, NII, and NIM were light, although do note top and bottom line marginally beat.
- Travelers (TRV) -7.5%: Fell short on EPS and net premiums written.
- Prologis (PLD) -7%: Lowers FY24 core FFO ex-items guidance.
- Omnicom (OMC) +1.5%: EPS and revenue surpassed Wall St. expectations alongside positive commentary.
THURSDAY
- Netflix Inc (NFLX) Q1 2024 (USD): EPS 5.28 (exp. 4.52), Revenue 9.37bln (exp. 9.28bln), Q1 Subscriber Additions 9.33mln (exp. 5.11mln). Guides Q2 EPS USD 4.68 (exp. 4.54). Guides Q2 revenue USD 9.49bln (exp. 9.51bln). Guides Q2 Subscriber Additions to be lower in Q2 vs Q1 due to typical seasonality (exp. 3.51mln). Guides Q2 operating margin 26.6% (exp. 25.4%).Will stop reporting quarterly member ship number and ARM starting from Q1 2025 earnings. Shares -6.1% pre-market
- L'Oreal shares gained as much as 4.2% in the European session after strong results and making note of strong growth in China.
| Earnings are at or near all-time highs in Europe and US. Historically when Earnings surge a Recession follows. The surge this time is parabolic! Does this fit with the current "No-Landing" - "No Recession" narrative? | Small Business hiring plans are plunging - does this correlate with a strong earnings outlook? Maybe for the major global corporations but not for America that historically has been built on small business. | |
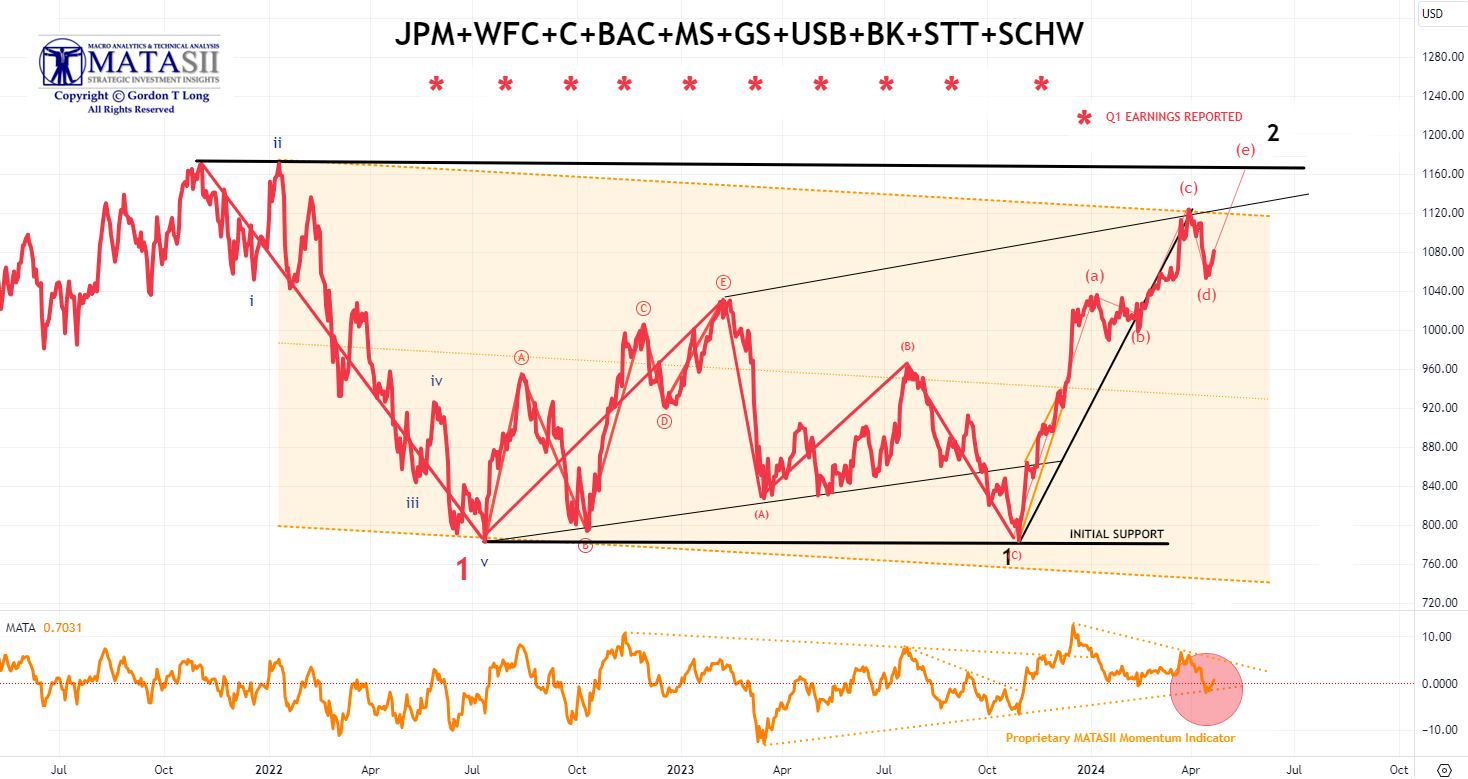
BANKING STOCKS
Bank stocks though initially weak on earnings release have been trending up since while overall market weakened.
| |
FINANCIALS STOCKS
The Financials appear to be trying to follow the Banking stocks higher against the overall trend of the market.
| |
|
DEVELOPMENTS TO WATCH
CHINA: IS CHINA CONTRIBUTING TO RISING US TREASURY YIELDS?
I recall not long ago (it seems) checking the TICS report on US Treasury Holdings and seeing Japan and China as the dominant holders, with China holding around $1.3T. When China's holdings fell to ~0.9T it was an obvious problem. The latest TICs report was a real eye opener with China now down to $0.775T.
A little less than half of what they held as recently as 2013! (Chart below - top pane)
Yes China's FX reserves are not growing as fast, but when I look at the rate of China's buying of Gold (chart below - bottom pane) there is no other conclusion than China is getting out of US Debt as fast as is possible, and doing it in a fashion to not completely destabilize the global system.
US Treasury Yields are not rising simply because of Inflation and then end of the Great Moderation. They are rising because China is selling and there is now too few buyers to pick up the magnitude of the selling. It makes you wonder just how much China's selling has had to do with the end of the Great Moderation and the Inflation shock since Covid?
| |
|
SERVICE INFLATION: EXPLODING CHILD CARE INFLATION
Parents are drowning in childcare costs, and high inflation is adding to their laundry list of daily expenses.
According to a recent survey from childcare platform Care.com:
- The average cost to enroll a child in a licensed day care can set you back $16,692 annually in 2024, or $321 a week for just one child. Infant care in a home day care costs $230 a week, or $11,960 a year.
- The price of a full-time nanny stood at an average of $766 per week, tallying up to $39,832 annually.
- A typical family with an income of $69,651 in New York could spend 22.1% of their annual income on childcare, while minimum-wage earners, making about $24,544, would spend 62.7% of their annual income on infant care.
- In New York, the average cost of infant care is $15,394 annually per child, or $1,283 per month, according to the Economic Policy Institute. For a four-year-old, those expenses average $12,358 a year, or $1,030 each month.CO
- The cost of day care and preschool rose 4.4% in March compared to a year ago. While that’s slightly down from the 5.5% year-over-year increase reported in February, it’s still a struggle for millions of families.
- The problem has worsened as some childcare centers have been forced to shut down or are at risk of closing following the expiration of pandemic-era funds. The cost of childcare accelerated during the pandemic.
COMPARED TO COLLEGE (Which Biden wants to Forgive - Is Child Care next?)
- In-state tuition for a four-year public college in New York is just $7,938.
- Across the US, there are 33 states where childcare is more expensive than college, the Economic Policy Institute found. In some areas, infant care can set you back tens of thousands of dollars more than a college education.
- In Washington, D.C., childcare costs $18,487 more than in-state tuition for a four-year college.
“To think that … paying for childcare costs more than it would to send your kid to college is wild” .
| |
|
GLOBAL ECONOMIC INDICATORS: What This Week's Key Global Economic Releases Tell Us
LEADING ECONOMIC INDICATOR (LEI)
The Conference Board Leading Economic Index® (LEI) for the U.S. decreased by 0.3 percent in March 2024 to 102.4.
Over the six-month period between September 2023 and March 2024, the LEI contracted by 2.2 percent—a smaller decrease than the 3.4 percent decline over the previous six months.
As Reported by the Conference Board (LINK)
- "Negative contributions from:
- The yield spread
- New building permits
- Consumers’ outlook on business conditions
- New orders and
- Initial unemployment insurance claims drove March’s decline.
- The LEI’s six-month and annual growth rates remain negative, but the pace of contraction has slowed.
-
Overall, the Index points to a fragile—even if not recessionary—outlook for the U.S. economy.
- Indeed, rising consumer debt, elevated interest rates, and persistent inflation pressures continue to pose risks to economic activity in 2024.
- The Conference Board forecasts GDP growth to cool after the rapid expansion in the second half of 2023.
- As consumer spending slows, US GDP growth is expected to moderate over Q2 and Q3 of this year.”
HOUSING STARTS/BUILDING PERMITS
Building permits, the more forward-looking gauge of housing activity, fell 4.3% in March to 1.458mln from 1.523mln, and shy of the expected 1.515mln, while Housing starts tumbled 14.7% to 1.321mln (prev. 1.549mln), well short of the expected 1.487mln and outside the lower bound of the forecast range of 1.487mln.
As Oxford Economics states:
“The drop in permits and the spike in mortgage rates following the release of the March CPI report lend some downside risk to our forecast for a modest rise in housing starts over the rest of 2024.”
- Nonetheless, the consultancy adds their current baseline assumes housing starts will rise to an annual pace of about 1.5mln in the second half from 1.42mln in Q1.
- In addition, Oxford expect single-family starts, where there continues to be a shortage of supply, to drive the gains in housing starts in 2024.
| |
 | |
RETAIL SALES
Headline retail sales rose by 0.7%, above the 0.3% forecast but down from the prior (upwardly revised) 0.9%.
The ex-autos measure surged 1.1% from the prior 0.6%, above the 0.3% forecast, while ex-gas and autos rose by 1.0% from the prior 0.5% - showing widespread gains across consumer spending.
The control group, which feeds into US GDP, rose by 1.1%, accelerating from the prior 0.3% and above the 0.4% forecast.
Overall, a very strong report with the economy still showing resilience in the wake of Fed rate hikes.
LOOKING INTO THE REPORT
- Upside in gas stations (+2.1%), miscellaneous store retailers (+2.1%), non-store retailers (+2.7%), and general merchandise stores (+1.1%) led the upside.
- Underperforming areas of business included Sporting goods, hobby/musical instruments and book stores (-1.8%), Clothing (-1.6%), Electronics (-1.2% and Motor vehicle and parts dealers (-0.7%). Despite the overall hot report with revisions higher, ING highlights:
"that the retail sales number is a nominal dollar growth rate and with inflation running so hot this is accounting for much of the growth. Real retail sales, i.e. retail sales adjusted for inflation, are much weaker and essentially have been flat for the past three years".
Nonetheless, the Atlanta Fed GDPNow Q1 tracker has been bumped up to 2.8% from 2.4%.
EMPIRE SURVEY
- Headline NY Fed Manufacturing activity index in April rose to -14.3 from -20.9, but not as much vs expectations of -7.5.
- New orders remained well in contractionary territory at -16.2, but saw a slight improvement from -17.2 in March.
- The Prices Paid component increased to 33.7 from 28.7 while employment saw a slight rise to -5.1 from -7.1.
- Looking ahead, the six-month conditions eased to 16.7 from 21.6.
- The report summarizes that business activity continued to decline in New York.
- The headline general business conditions index rose but remained below zero.
"New orders and shipments both declined significantly, and unfilled orders continued to shrink. Delivery times shortened, and inventories edged higher. Labor market conditions remained weak, with employment and hours worked moving lower. The pace of input price increases picked up somewhat, while the pace of selling price increases held steady. Though firms expect conditions to improve over the next six months, optimism remained subdued".
Despite a weak headline print, analysts at Pantheon highlight it is probably not a cause for concern and recently it has been a woeful guide to the national ISM manufacturing index.
| |
|
GLOBAL MACRO
WHAT DOES YOUR SCAN OF THE DATA BELOW TELL YOU? - THE MEDIA AVOIDS BAD NEWS!
We present the data in a way you can quickly see what is happening.
THIS WEEK WE SAW
Exp=Expectations, Rev=Revision, Prev=Previous
| |
|
UNITED STATES
- US NY Fed Manufacturing (Apr) -14.3 vs. Exp. -7.5 (Prev. -20.9)
- US Retail Sales MM (Mar) 0.7% vs. Exp. 0.3% (Prev. 0.6%, Rev. 0.9%)
- US Retail Control (Mar) 1.1% vs. Exp. 0.4% (Rev. 0.3%)
- US Industrial Production MM (Mar) 0.4% vs. Exp. 0.4% (Prev. 0.1%, Rev. 0.4%)
- US Manufacturing Output MM (Mar) 0.5% vs. Exp. 0.3% (Prev. 0.8%, Rev. 1.2%)
- US Building Permits Number (Mar) 1.458M vs. Exp. 1.515M (Prev. 1.524M, Rev. 1.523M)
- US Housing Starts Number (Mar) 1.321M vs. Exp. 1.487M (Prev. 1.521M, Rev. 1.549M)
- Atlanta Fed GDPnow (Q1) was raised to 2.9% from 2.8%.
- US Philly Fed Business Index (Apr) 15.5 vs. Exp. 2.3 (Prev. 3.2)
- US Philly Fed Prices Paid 23.0 (Prev. 3.7)
- US Leading Index MM (Mar) -0.3% vs. Exp. -0.1% (Prev. 0.1%, Rev. 0.2%)
- US Existing Home Sales (Mar) 4.19M vs. Exp. 4.2M (Prev. 4.38M)
- US Initial Jobless Claims 212k vs. Exp. 215k (Prev. 211k, Rev. 212k)
- US Continued Jobless Claims 1.812M vs. Exp. 1.810M (Prev. 1.817M, Rev. 1.810M)
CHINA
- Chinese GDP QQ (Q1) 1.6% vs. Exp. 1.4% (Prev. 1.0%)
- Chinese GDP YY (Q1) 5.3% vs. Exp. 4.6% (Prev. 5.2%)
- Chinese Industrial Production YY (Mar) 4.5% vs. Exp. 6.0% (Prev. 7.0%)
- Chinese Retail Sales YY (Mar) 3.1% vs. Exp. 4.6% (Prev. 5.5%)
- Chinese House Prices YY (Mar) -2.2% (Prev. -1.4%)
JAPAN
- Japanese Machinery Orders MM (Feb) 7.7% vs. Exp. 0.8% (Prev. -1.7%)
- Japanese Machinery Orders YY (Feb) -1.8% vs. Exp. -6.0% (Prev. -10.9%)
- Japanese Trade Balance Total (JPY)(Mar) 366.5B vs. Exp. 299.9B (Prev. -379.4B, Rev. -377.8B)
- Japanese Exports YY (Mar) 7.3% vs. Exp. 7.0% (Prev. 7.8%)
- Japanese Imports YY (Mar) -4.9% vs. Exp. -4.7% (Prev. 0.5%)
- Japanese National CPI YY (Mar) 2.7% vs. Exp. 2.9% (Prev. 2.8%)
- Japanese National CPI Ex. Fresh Food YY (Mar) 2.6% vs. Exp. 2.6% (Prev. 2.8%)
- Japanese National CPI Ex. Fresh Food & Energy YY (Mar) 2.9% vs. Exp. 3.0% (Prev. 3.2%)
UK
- UK Average Earnings (Ex-Bonus) (Feb) 6.0% vs. Exp. 5.8% (Prev. 6.1%); Average Week Earnings 3M YY (Feb) 5.6% vs. Exp. 5.5% (Prev. 5.6%)
- UK ILO Unemployment Rate (Feb) 4.2% vs. Exp. 4.0% (Prev. 3.9%)
- UK Employment Change (Feb) -156k vs. Exp. 45k (Prev. -21k); HMRC Payrolls Change (Mar) -67k (Prev. 20k, Rev. -18k)
- UK Employment Change (Feb) -156k vs. Exp. 45k (Prev. -21k)
- UK ILO Unemployment Rate (Feb) 4.2% vs. Exp. 4.0% (Prev. 3.9%)
- UK HMRC Payrolls Change (Mar) -67k (Prev. 20k, Rev. -18k)
- UK Average Earnings (Ex-Bonus)(Feb) 6.0% vs. Exp. 5.8% (Prev. 6.1%)
- UK CPI YY (Mar) 3.2% vs. Exp. 3.1% (Prev. 3.4%); All Services 6.0% vs Exp. 5.9% (prev. 6.1%); MM 0.6% vs. Exp. 0.4% (Prev. 0.6%); click here for more detail.
- UK Core CPI YY (Mar) 4.2% vs. Exp. 4.1% (Prev. 4.5%); MM (Mar) 0.6% vs. Exp. 0.5% (Prev. 0.6%)
- UK Retail Sales MM (Mar) 0.0% vs. Exp. 0.3% (Prev. 0.0%, Rev. 0.1%); YY (Mar) 0.8% vs. Exp. 1.0% (Prev. -0.4%, Rev. -0.3%)
| |  |
|
EU
- EU Industrial Production MM (Feb) 0.8% vs. Exp. 0.8% (Prev. -3.2%, Rev. -3.0%)
- EU Industrial Production YY (Feb) -6.4% vs. Exp. -5.7% (Prev. -6.7%, Rev. -6.6%)
- EU ZEW Survey Expectations (Apr) 43.9 (Prev. 33.5)
- EU ZEW Survey Expectations (Apr) 43.9 (Prev. 33.5)
- EU HICP Final MM (Mar) 0.8% vs. Exp. 0.8% (Prev. 0.6%); HICP Final YY (Mar) 2.4% vs. Exp. 2.4% (Prev. 2.4%)
- EU HICP-X F&E MM (Mar) 0.9% vs. Exp. 0.8% (Prev. 0.6%); HICP-X F,E,A&T Final YY (Mar) 2.9% vs. Exp. 2.9% (Prev. 2.9%); HICP-X F&E Final YY (Mar) 3.1% vs. Exp. 3.1% (Prev. 3.1%); HICP-X F, E, A, T Final MM (Mar) 1.1% vs. Exp. 1.1% (Prev. 1.1%)
- EU Construction Output MM (Feb) 1.83% (Prev. 0.48%, Rev. 0.19%)
GERMANY
- German ZEW Economic Sentiment (Apr) 42.9 vs. Exp. 35.0 (Prev. 31.7); ZEW Current Conditions (Apr) -79.2 vs. Exp. -76.0 (Prev. -80.5); German ZEW says a recovering global economy is boosting expectations for Germany, with half of the respondents anticipating the country's economy to pick up over the next 6 months.
- German Wholesale Price Index MM (Mar) 0.2% (Prev. -0.1%); YY (Mar) -3.0% (Prev. -3.0%)
- German ZEW Economic Sentiment (Apr) 42.9 vs. Exp. 35.0 (Prev. 31.7)
- German ZEW Current Conditions (Apr) -79.2 vs. Exp. -76.0 (Prev. -80.5)
- German Producer Prices MM (Mar) 0.2% vs. Exp. 0.1% (Prev. -0.4%); YY (Mar) -2.9% vs. Exp. -3.2% (Prev. -4.1%)
ITALY
- Italian Consumer Prices Final MM* (Mar) 0.0% vs. Exp. 0.1% (Prev. 0.1%); Consumer Prices Final YY* (Mar) 1.2% vs. Exp. 1.3% (Prev. 1.3%); CPI (EU Norm) Final YY* (Mar) 1.2% vs. Exp. 1.3% (Prev. 1.3%); CPI (EU Norm) Final MM* (Mar) 1.2% vs. Exp. 1.2% (Prev. 1.2%)
POLAND
- Polish CPI Final MM (Mar) 0.2% (Prev. 0.2%); CPI Final YY (Mar) 2.0% (Prev. 1.9%)
SOUTH AFRICA
- South African CPI YY (Mar) 5.3% vs. Exp. 5.4% (Prev. 5.6%); CPI MM (Mar) 0.8% vs. Exp. 0.9% (Prev. 1.0%); Core Inflation YY (Mar) 4.9% vs. Exp. 4.9% (Prev. 5.0%); Core Inflation MM (Mar) 0.7% vs. Exp. 0.8% (Prev. 1.2%)
SINGAPORE
- Singapore Non-Oil Exports MM (Mar) -8.4% vs. Exp. 4.5% (Prev. -4.8%)
- Singapore Non-Oil Exports YY (Mar) -20.7% vs. Exp. -7.0% (Prev. -0.1%)
AUSTRALIA
- Australian Employment (Mar) -6.6k vs. Exp. 10.0k (Prev. 116.5k)
- Australian Full Time Employment (Mar) 27.9k (Prev. 78.2k)
- Australian Unemployment Rate (Mar) 3.8% vs. Exp. 3.9% (Prev. 3.7%)
- Australian Participation Rate (Mar) 66.6% vs. Exp. 66.7% (Prev. 66.7%)
- Australian NAB Business Confidence (Q1) -2 (Prev. -6)
NEW ZEALAND
- New Zealand CPI QQ (Q1) 0.6% vs Exp. 0.6% (Prev. 0.5%)
- New Zealand CPI YY (Q1) 4.0% vs Exp. 4.0% (Prev. 4.7%)
- RBNZ Sectoral Factor Model Inflation Index (Q1) 4.3% (Prev. 4.5%)
| |
CURRENT MARKET PERSPECTIVE | |
|
"YOU MEAN A DOWN WEEK IS STILL POSSIBLE??"
A CORRECTIVE / CONSOLIDATION IS THE BEST THING THAT COULD HAPPEN!
(IF YOU WANT HIGHER EQUITY MARKETS!)
Click All Charts to Enlarge
| |
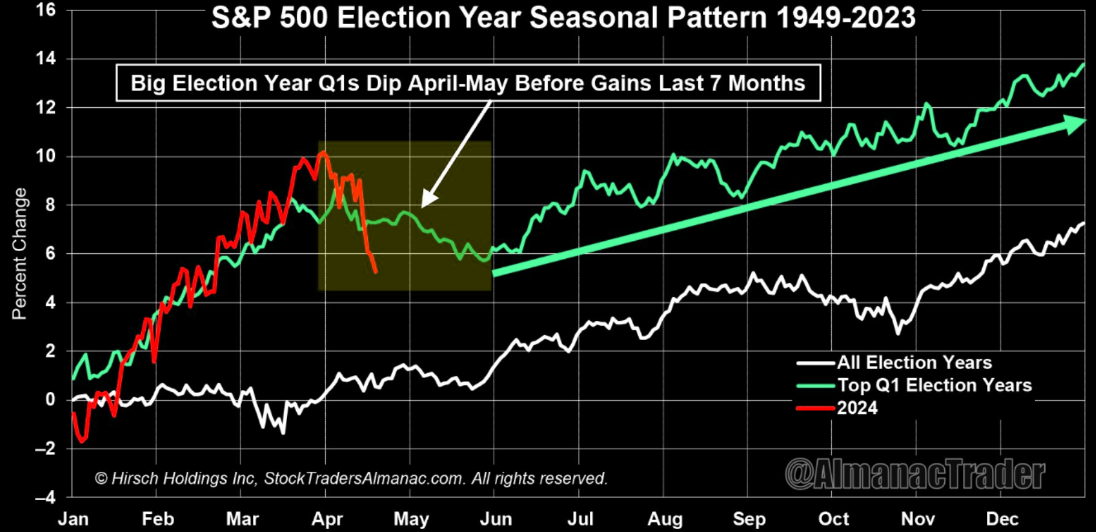
HISTORICAL ELECTION YEAR PERFORMANCE: 2024 was the 3rd best Election Q1 since 1950. Chop continues up ~2.5% April-October. Only 2 losses in the last 7 months of election years since 1950: 2000 (Dotcom Bubble bursts) & 2008 (Financial Crisis). | |
|
1 - SITUATIONAL ANALYSIS
This was a week characterized by:
- Data supporting 'No Landing' from a Growth perspective and
- Disappointment from a Disinflation perspective.
FedSpeak was without exception hawkish as they suddenly realized that all that 'pivot' optimism did nothing but dramatically ease financial conditions and interfere with their 'best laid plans' for a rate-cut and soft landing.
Friday, Nasdaq was down over 2% while The Dow managed to gain 0.5%. Small Caps were almost unchanged by the end of the day with the S&P lagging.
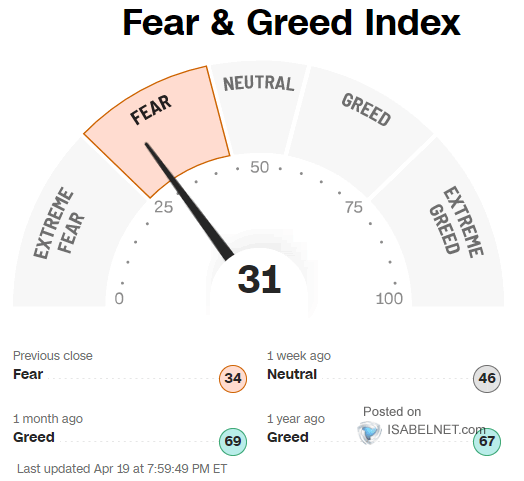
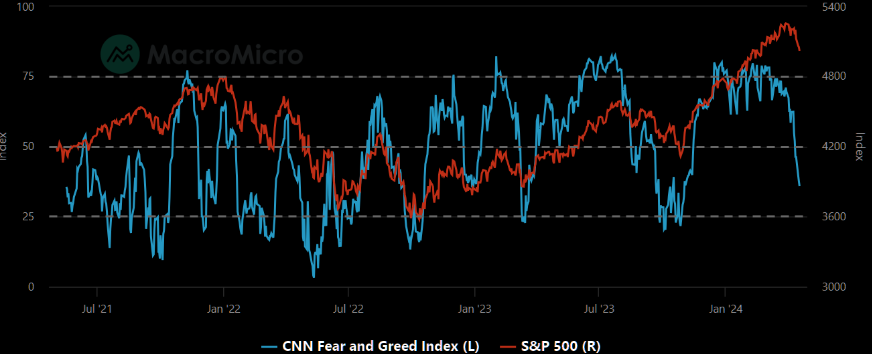
We are moving further into fear territory. This sell-off feels, so far, very well behaved. (Chart Right).
CHART BELOW: A lot of fear across various indicators, but things haven't fully spilled over to equities...yet?
|  | |
WEEK'S RECAP
-
INDEXES: Technically we are now in bear market since we are down over 22% from the prior highs.
- All the majors ended the week red (with The Dow desperately trying to get back to even).
- Nasdaq was down over 5.5% on the week! S&P and Small Caps down around 3%.
- Nasdaq is down for six straight days for its biggest weekly drop since Nov 2022, breaking below its 100DMA as CTA 'sell threshold's' were crossed.
- The Russell 2000, Nasdaq, and Dow are all back below their 100DMA, and the S&P 500 is pushing down towards its 100DMA (having blow thru the CTA 'sell' thresholds).
- The NDX is now pacing for its worst week in over a year (down 6 of 7 weeks) as a complicated technical backdrop (CTAs, lower retail participation, NDX now testing 100-dma, seasonality), sideways earnings revisions thus far (ASML, TSM and even Sheridan’s NFLX EPS revisions were only 1-2% last night), a tense geopolitical backdrop (overnight headlines) and elevated positioning are testing conviction into a busy week of earnings.
-
VIX: Soared this week to six-month highs, and credit markets also finally started to crack.
-
MAG7: basket broke below its 50DMA this week - the first time since October, when The Fed 'pivoted' and save the world. The market cap of the MAG7 is now down over $1 Trillion from its highs a week ago.
-
AI LEADERS: crashed relative to firms 'at risk from AI', plunging to their lowest in two months.
- Of note is that the AI Leaders are perfectly back to their prior peak in 2021 (which was driven by chip demand for crypto mining and COVID disruptions), breaking down to the 100DMA and through the medium-term uptrend.
- NVDA plunged 10% Friday back to two month lows, closing below its 50DMA for the first time since Nov 2023.
-
SEMIS: were basically brutally beaten down this week.
-
BANKS: had a decent week with Wells Fargo and Morgan Stanley outperforming. JP Morgan is still lagging from the drop on its last Friday's earnings.
-
TREASURY YIELDS: Ended the week higher, but not before plunging overnight on a flight-to-quality bid as initial Israeli missiles hit Iran, taking yields lower on the week.
- By the close of the week, the belly slightly underperformed but yields were all up by around 8-10bps.
- 5.00% remains a key level for the 2Y Yield.
-
US DOLLAR: Rallied for the second straight week, hitting its highest since early Nov 2023 last night on the mid-east attacks before sliding back.
- PRECIOUS METALS:
- Spot Gold prices spiked overnight Thursday on the Israel attack, pulled back, then rallied up to $2400 once again to close at the highs. Gold closed the week at a new record high...
- Silver soared 3% on the week to new cycle highs (its highest since Feb 2021)..
- Silver has been broadly speaking outperforming gold in recent weeks after peaking at a gold-to-silver ratio of around 92x in January, it is ow down to 83 (still well above the 65x average since 1980, implying silver remains 'cheap' to gold.
-
OIL: Despite two major attacks in the Middle East, oil prices ended lower for the second week in a row (well WW3 hasn't started yet). Some knock-on effects from an evaporation of hope for demand-sponsoring rate-cuts also weighed on sentiment as WTI
NOTES:
- CTA group sold $25B globally this week ($9B in SPX) with next week expected to bring another $27B globally (and $10B SPX) in a flat tape scenario. As a reminder the medium term threshold (aka most important) level is 4886 – less than 100 handles away from spot.
- Next week brings 43% of SPX set to report earnings highlighted by META/MSFT/GOOGL (aka $6.1T of mkt cap) reporting on Thurs night...on the macro front, key reports include 1Q GDP on Thurs & March PCE on Fri.
| |
|
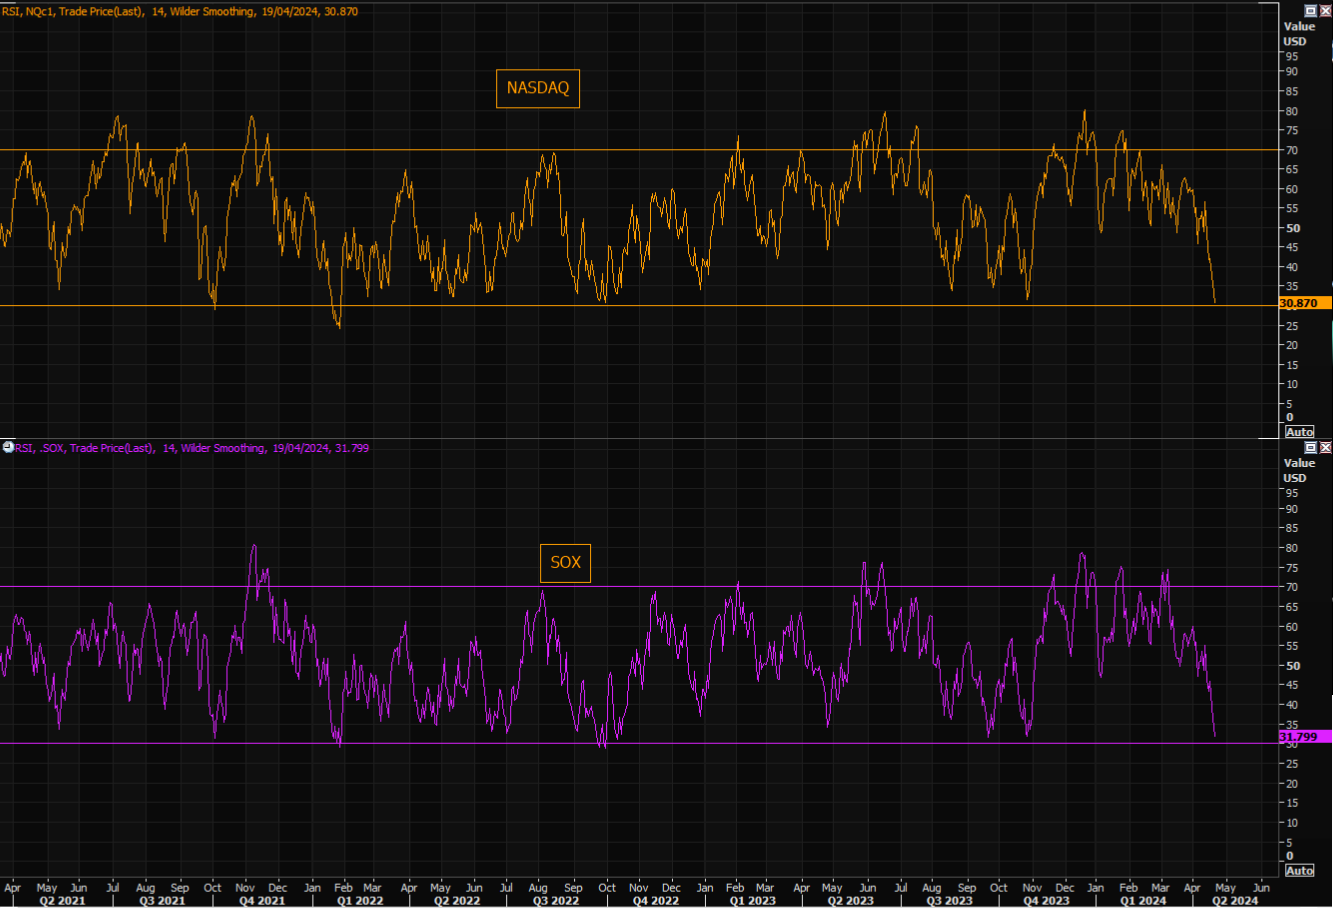
CHART TOP RIGHT: NASDAQ and SOX RSI hitting lowest levels in a while, but as we all know, oversold can stay in oversold mode for longer than most think possible.
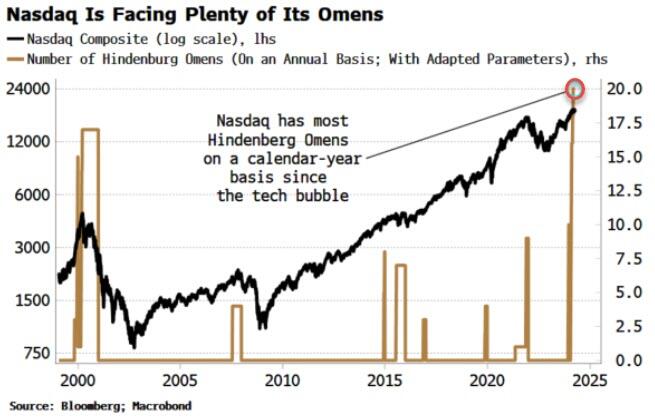
CHART BOTTOM RIGHT: The market has seen more Hindenburg Omens than in any year since the peak
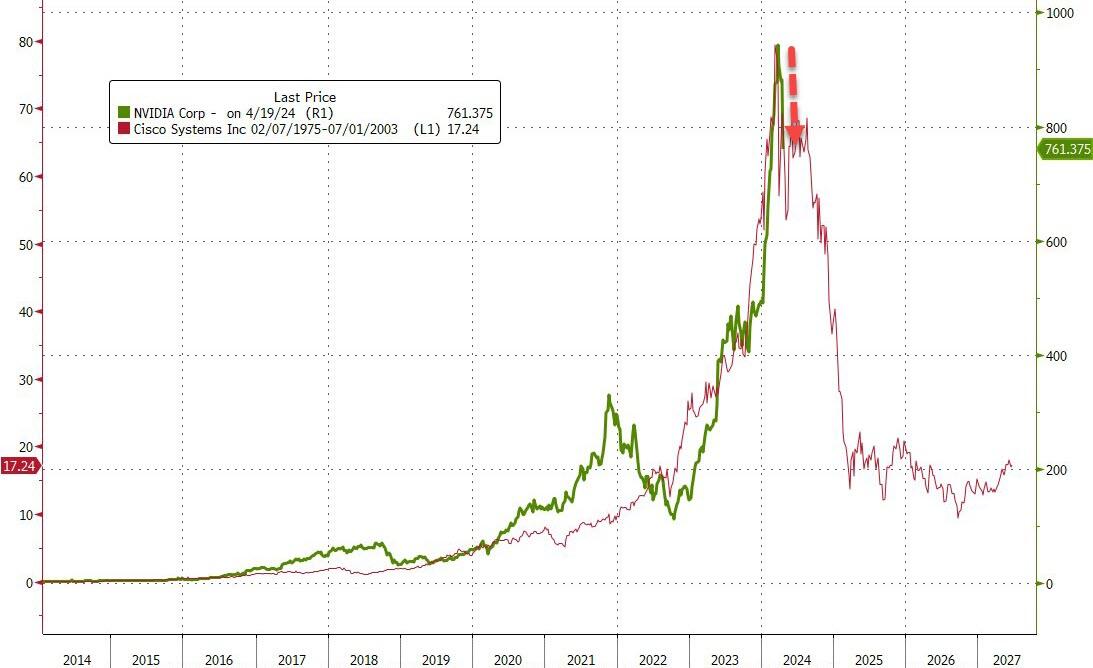
CHART BELOW: CSCO analog doesn't look so crazy anymore.
| |
|
|
2 - FUNDAMENTAL ANALYSIS
CREDIT MARKETS LEAD
As you are well aware, we are strong believers that Credit Markets LEAD and Equity & Bond Markets FOLLOW.
In the way of a reminder let's revisit what we previously outlined in the Mid-Week Subscribers update for those that might be new subscribers.
The Bond Market (MOVE) and the Equity Market (VIX) before we look at the Credit Markets (CDX) to see what the signals are.
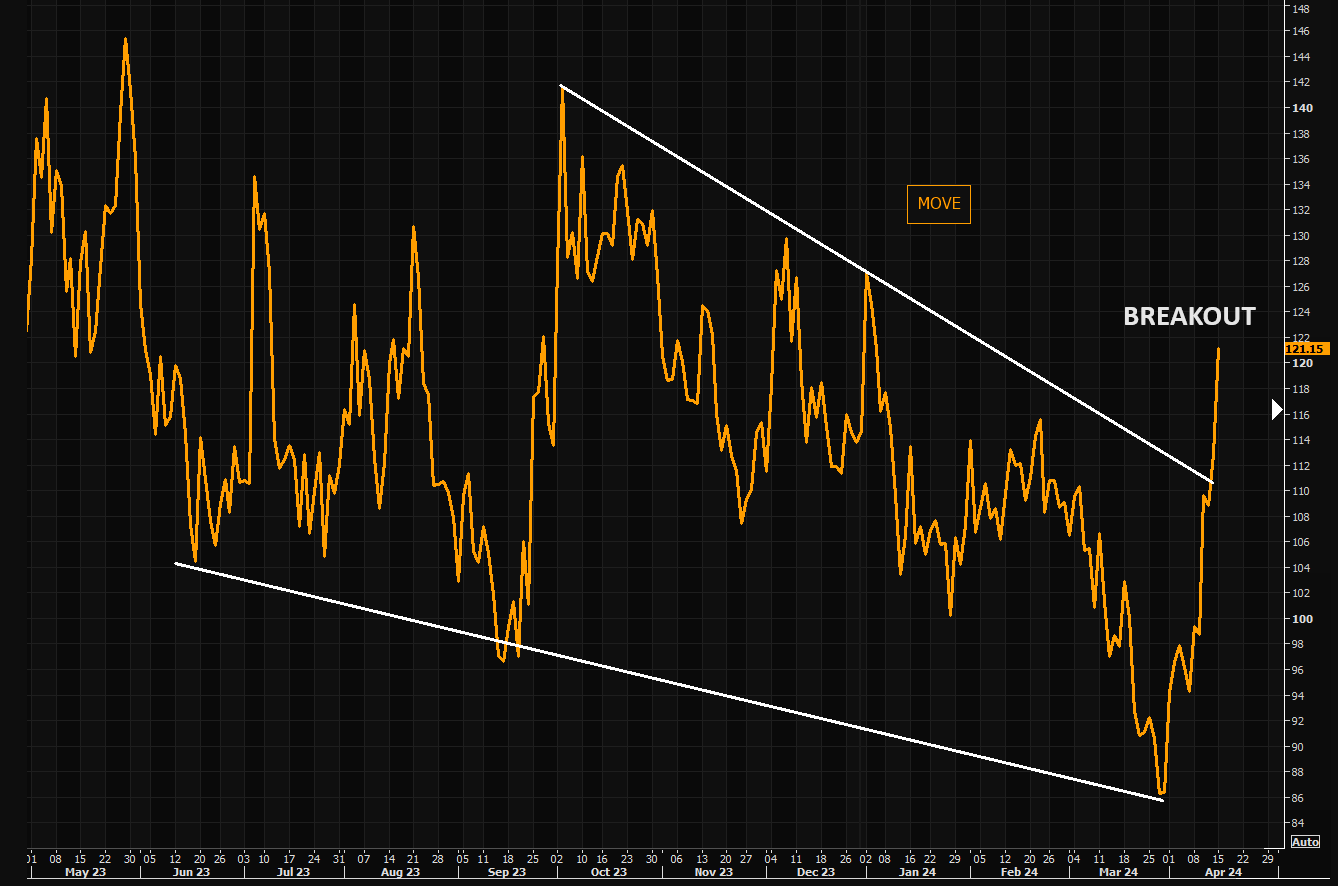
VOLATILITY - MOVE & VIX
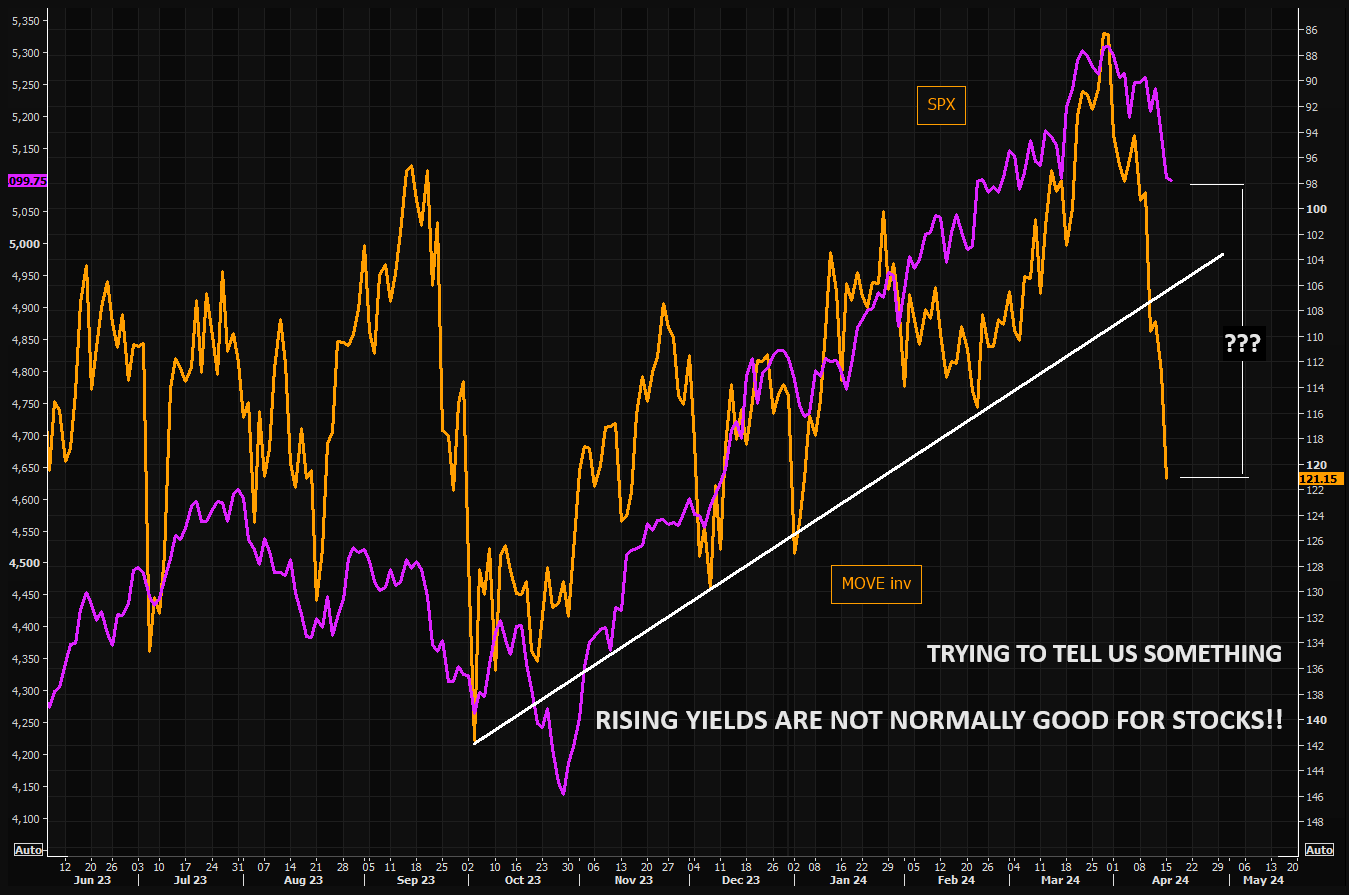
It took bond volatility, MOVE, three months to reach more "normal" levels of volatility. This has basically been reversed in a few sessions. The latest move in the MOVE has been huge (CHART ABOVE)
CHART BELOW
Remembering that you don't compare mean reverting to trending assets, the gap between bond volatility and SPX is now simply huge.
| |
|
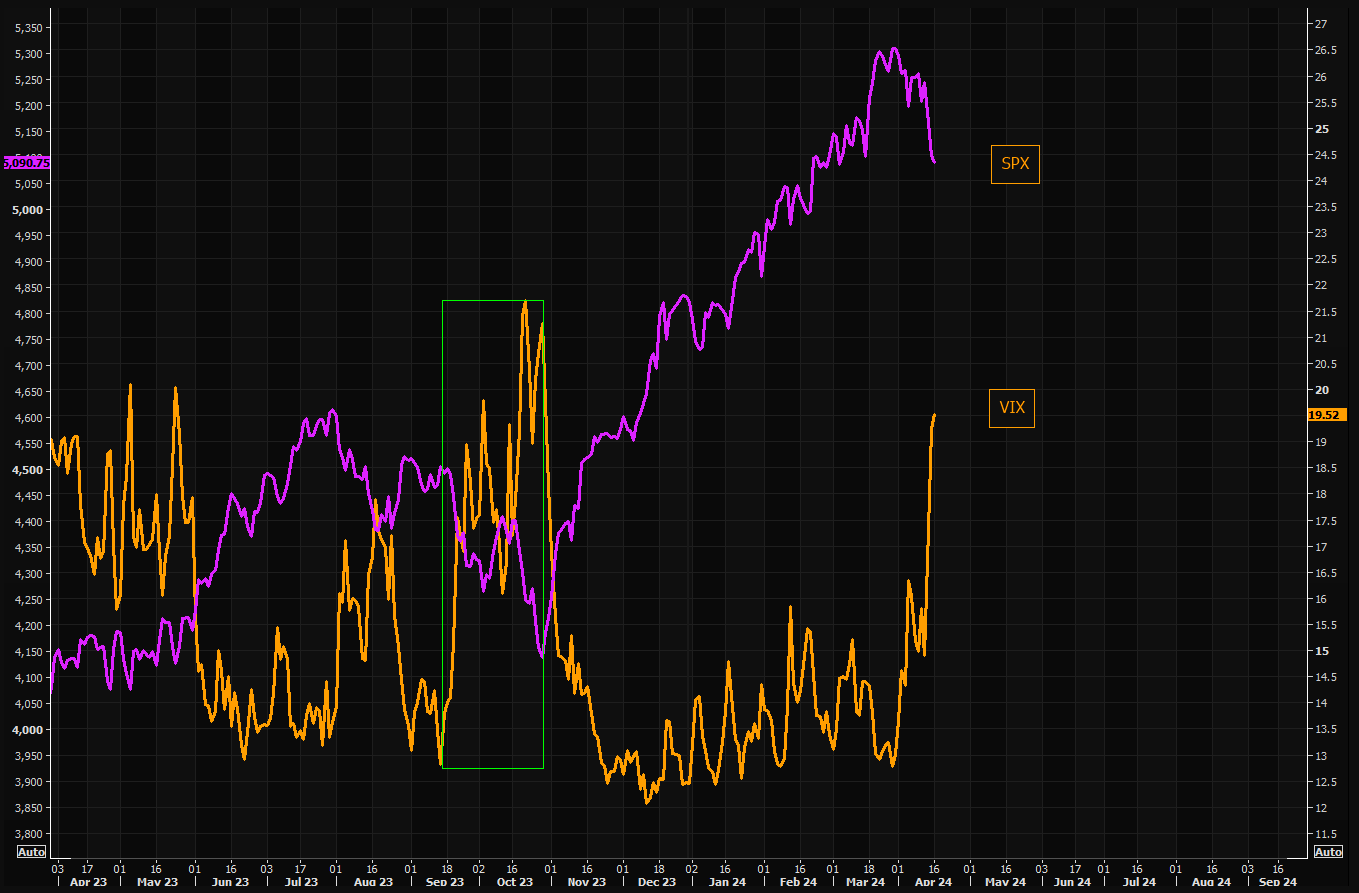
The reaction in VIX has been extreme.
Last time we had a similar pick up in VIX was in Sep/Oct. The initial move higher in VIX was accompanied with a 5.5% sell off in SPX.
The VIX eventually surged even higher during the autumn, and the total SPX sell off reached around 8%.
SORTING OUT VOLATILITY v CREDIT MARKETS
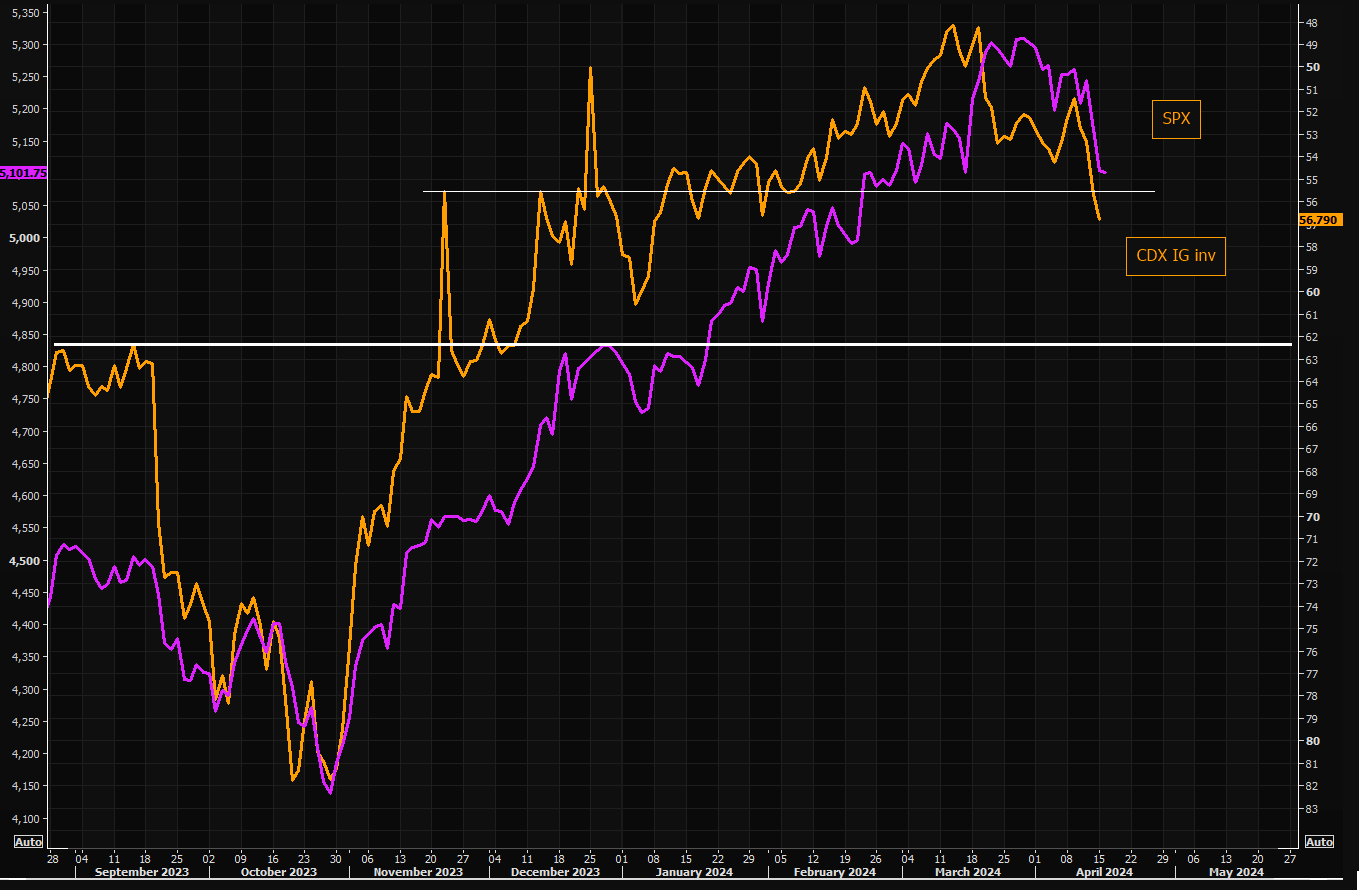
Credit protection is up, but far from panic.
| |
While the VIX has exploded to the upside, credit protection, CDX IG, is showing much less panic (chart right)
Compare SPX to the CDX IG and you realize this appears at this stage to be nothing more than just a normal sell off, with little panic.
(Chart Right shows SPX vs CDX IG inverted.
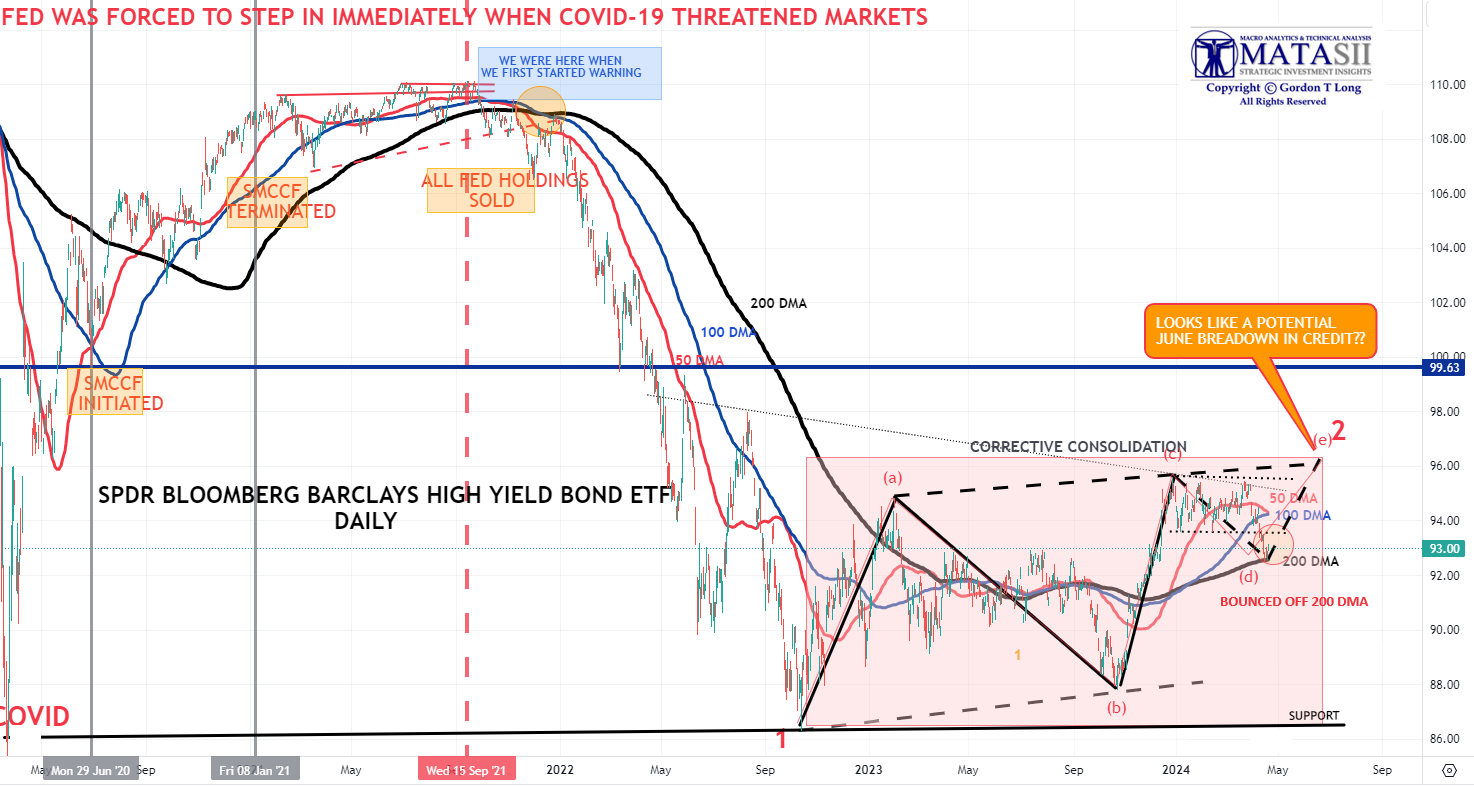
CHART BELOW: The High Yield Credit sector as represented by the "JNK" is currently reflecting nothing more than a consolidation to the 200 DMA before completing a potential final leg up.
This is normally good for the equity markets.
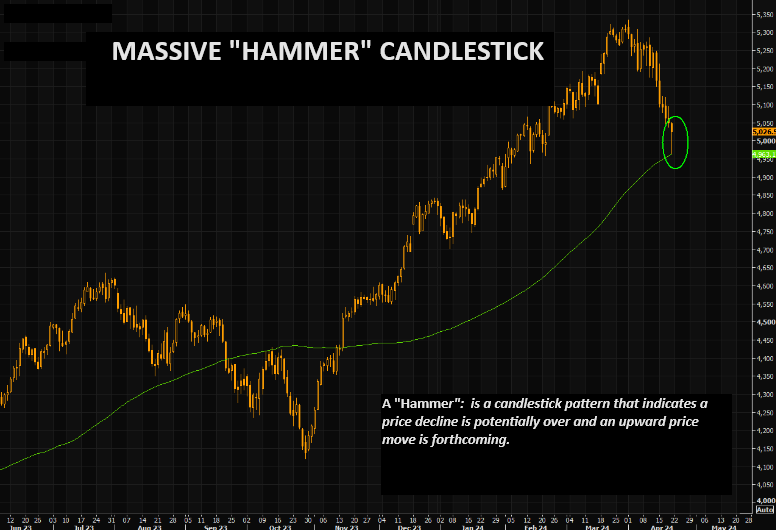
Note below that we bounced off the 200 DMA on Friday which matches the "Hammer Candlestick" in the S&P 500 (see S&P chart later).
| |
YOUR DESKTOP / TABLET / PHONE ANNOTATED CHART
Macro Analytics Chart Above: SUBSCRIBER LINK
| |
3 - TECHNICAL ANALYSIS
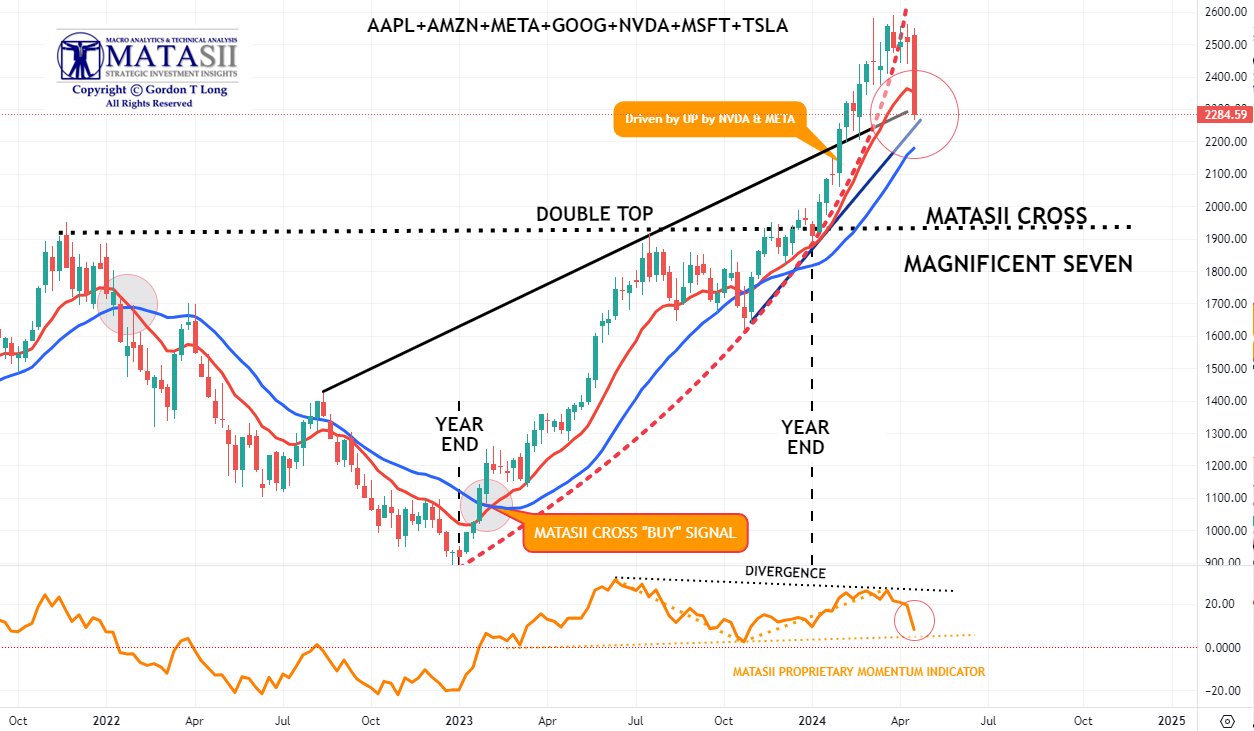
THE HEADLINE MARKET: MAGNIFICENT 7
- We are reaching the vertical lift part of the parabolic (geometric) lift shown by the dashed red line.
- We have intermediate term Divergence with momentum (bottom pane).
- In the short term Momentum has rolled over but hasn't yet decisively broken the Momentum trend line support. (bottom pane).
MATASII CROSS: WEEKLY - CONTINUES TO SIGNAL A MAG-7 BUY
| |
YOUR DESKTOP / TABLET / PHONE ANNOTATED CHART
Macro Analytics Chart Above: SUBSCRIBER LINK
| |
|
"CURRENCY" MARKET (Currency, Gold, Black Gold (Oil) & Bitcoin)
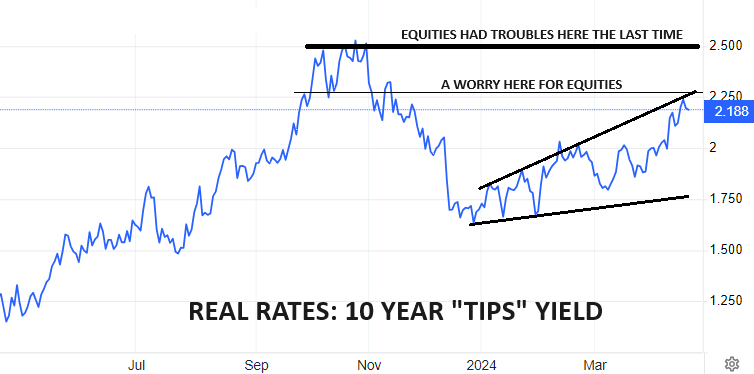
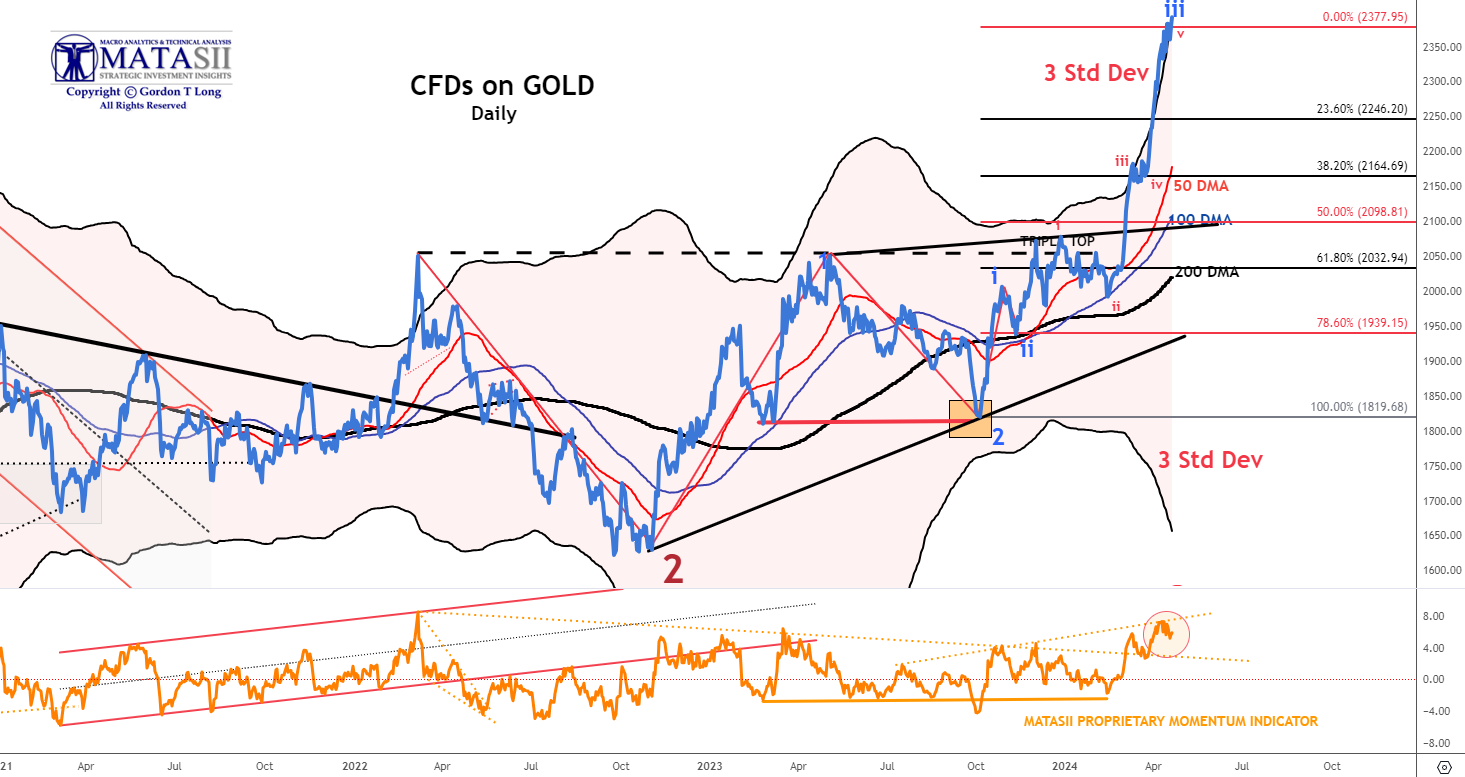
CHART RIGHT: As gold pushes to higher & higher record highs (in USD terms), Real yields have so far refused to play along (right)?? Normally Gold falls when real yields rise and are historically negatively correlated.
What we believe is that what we are seeing is Gold aggressively discounting a coming collapse in Real Rates which we expect between 2.25% - 2.5%.
CONTROL PACKAGE
There are NINE charts we have outlined in prior chart packages which we will continue to watch closely as a CURRENT "control set".
-
US DOLLAR -DXY - MONTHLY (CHART LINK)
-
US DOLLAR - DXY - DAILY (CHART LINK)
-
GOLD - DAILY (CHART LINK)
-
GOLD cfd's - DAILY (CHART LINK)
-
GOLD - Integrated - Barrick Gold (CHART LINK)
-
OIL - XLE - MONTHLY (CHART LINK)
-
OIL - WTIC - MONTHLY - (CHART LINK)
-
BITCOIN - BTCUSD - WEEKLY (CHART LINK)
-
10y TIPS - Real Rates - Daily (CHART LINK)
GOLD cfd's - DAILY
The 3 Std Deviation band for Gold has gone almost vertical with Gold prices tracking it!! Frankly, in over 40 years I don't believe I have seen this technically occur with a 3 Std Dev in Gold? Something is either broken, panic has set in somewhere or there is an "elephant(s)" now playing the market?
NOTE: Gold CFD's have not corrected (below) whereas Gold Bullion has.(GOLD - DAILY (CHART LINK))
|  | |
YOUR DESKTOP / TABLET / PHONE ANNOTATED CHART
Macro Analytics Chart Above: SUBSCRIBER LINK
| |
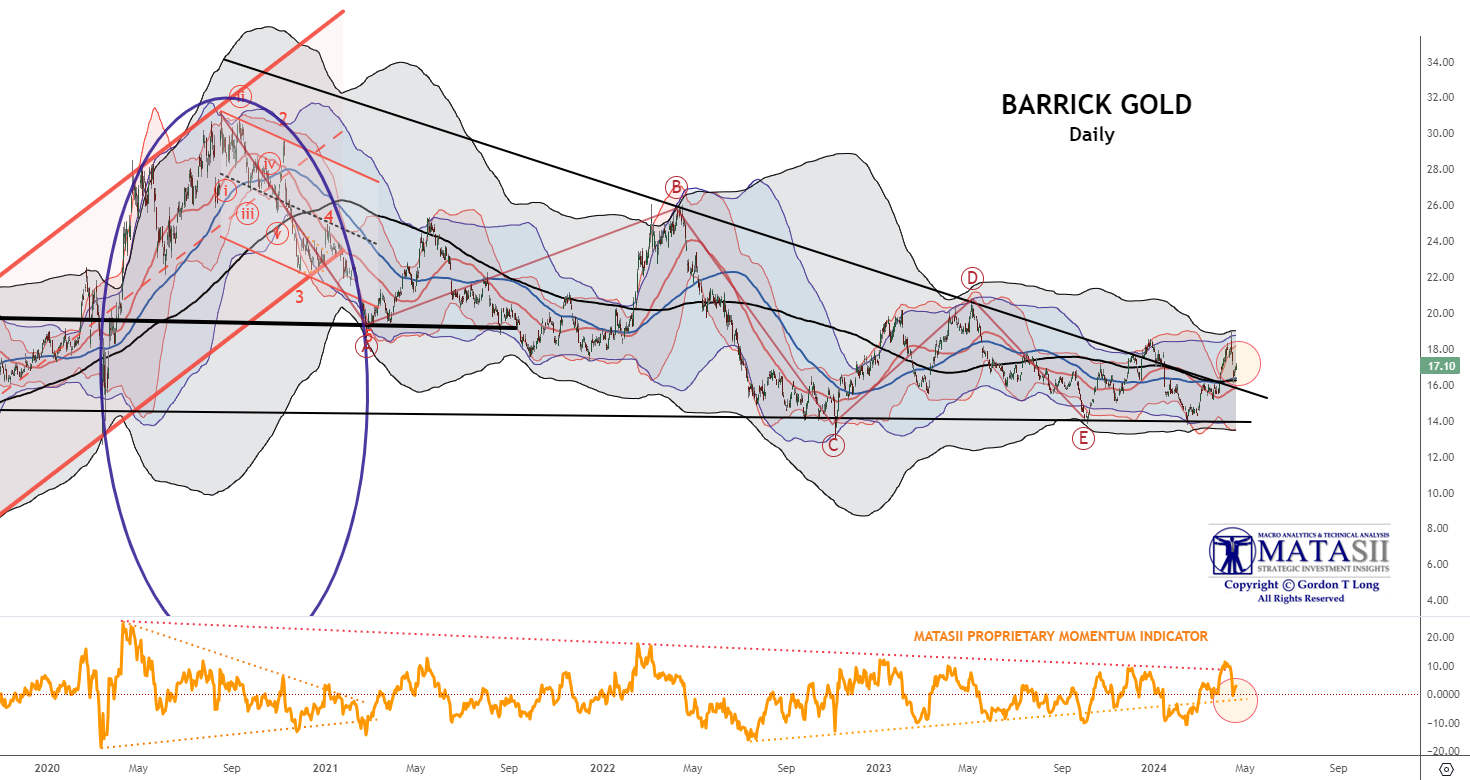
INTEGRATED GOLD MINERS
We continue to have a close eye on Gold and the INTEGRATED GOLD MINERS as represented by Barrick Gold. Barrick has broken out of its long term declining overhead resistance trend.
It has been pulling back this week as Gold Bullion has. It may be a good opportunity to be adding to your Gold and Silver positions on any real pullbacks.
| |
|
YOUR DESKTOP / TABLET / PHONE ANNOTATED CHART
Macro Analytics Chart Above: SUBSCRIBER LINK
| |
|
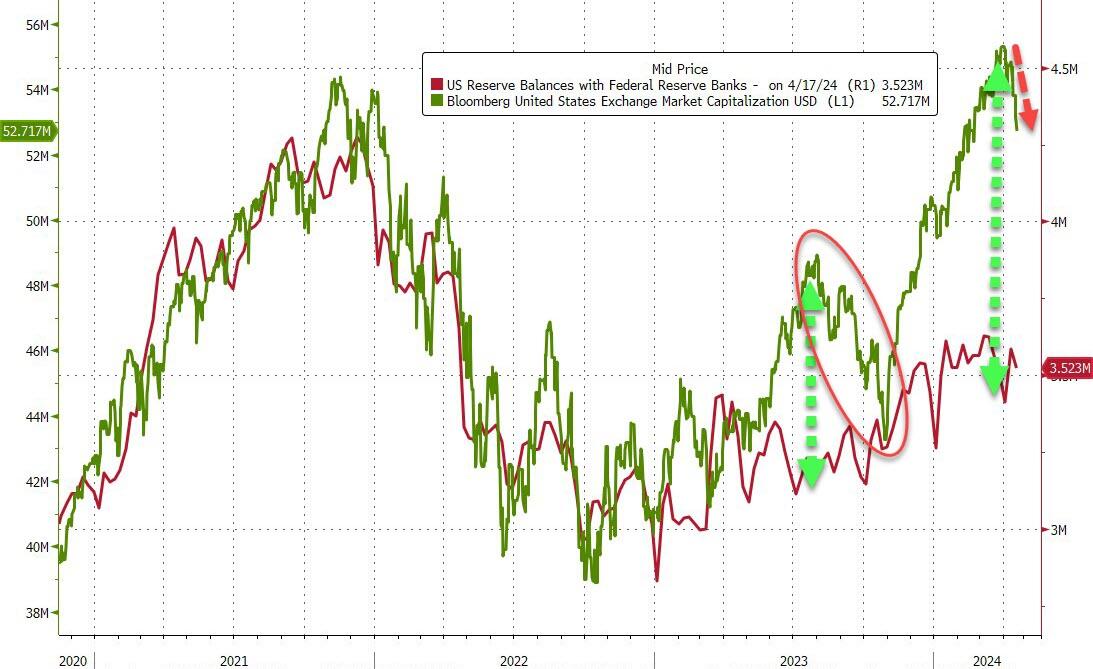
US EQUITY MARKETS
Are bank reserves at The Fed still the driving force for reality? (Chart Right)
We saw the reality check from Aug-Oct last year; are we about to get another?
CONTROL PACKAGE
There have FIVE charts we have outlined in prior chart packages that we will continue to watch closely as a CURRENT "control set".
-
The S&P 500 (CHART LINK)
-
The DJIA (CHART LINK)
-
The Russell 2000 through the IWM ETF (CHART LINK),
-
The MAGNIFICENT SEVEN (CHART ABOVE WITH MATASII CROSS - LINK)
-
Nvidia (NVDA) (CHART LINK)
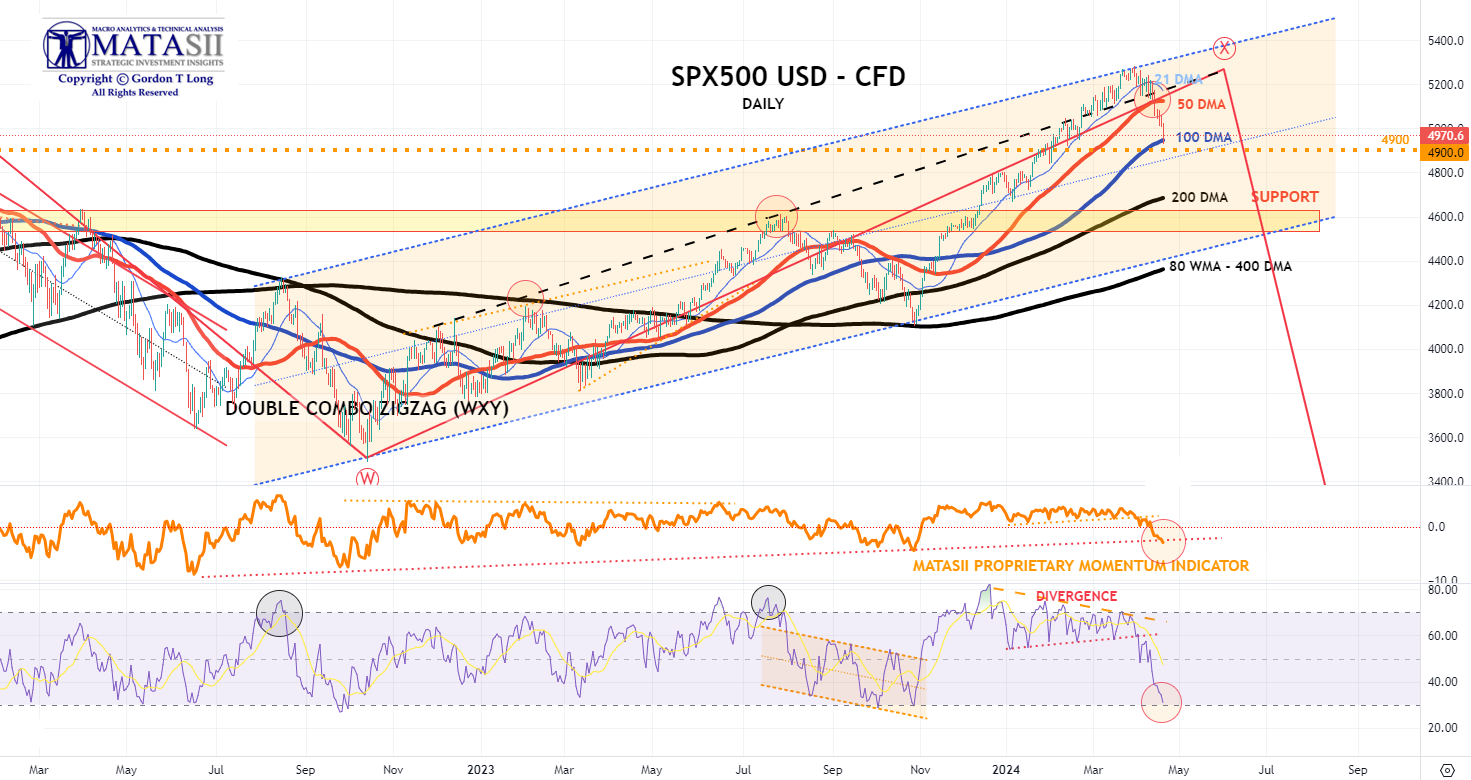
S&P 500 CFD
The S&P 500 cfd aggressively led the S&P 500 to its cfd 100 DMA but not yet the S&P 500 cash index (see "Thought Experiment")
| |
YOUR DESKTOP / TABLET / PHONE ANNOTATED CHART
Macro Analytics Chart Above: SUBSCRIBER LINK
| |
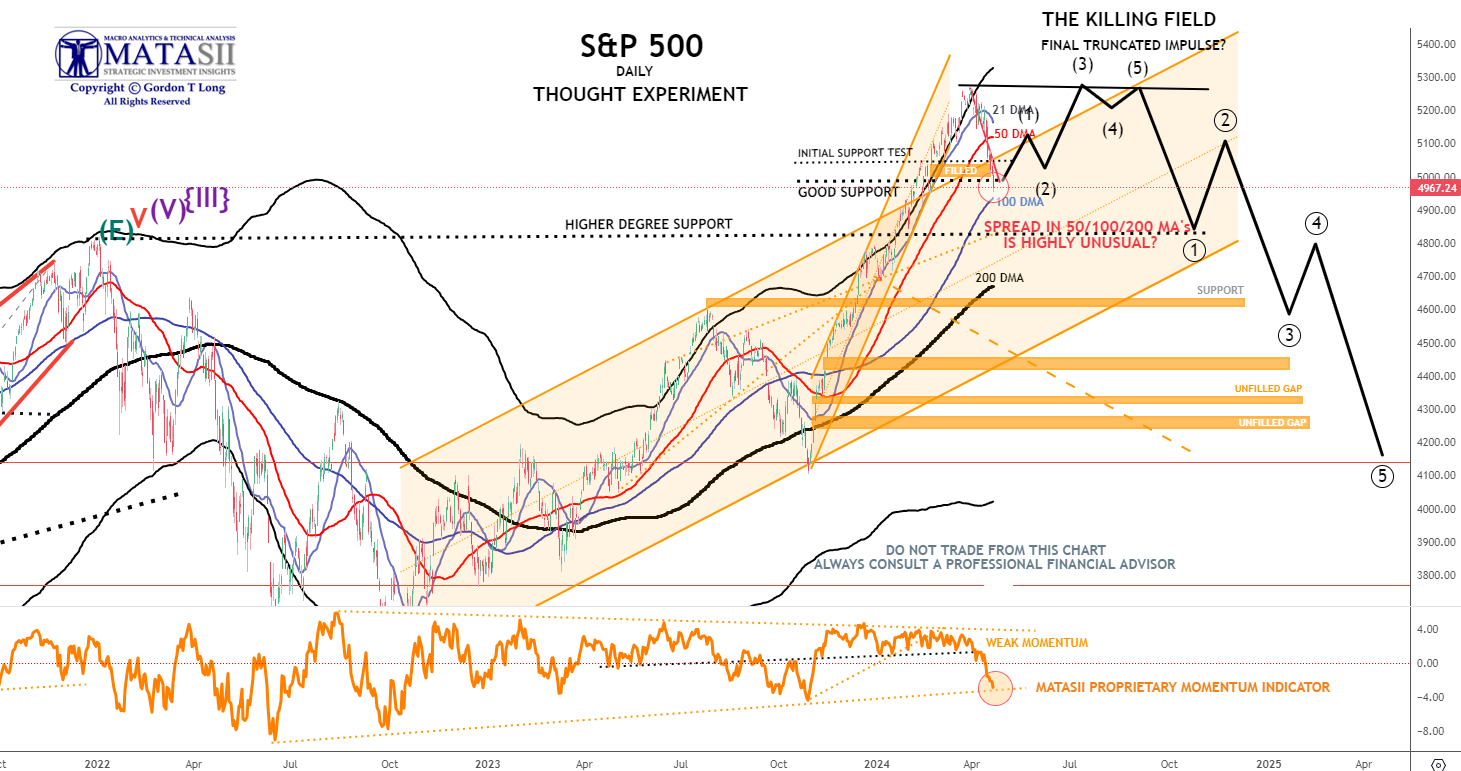
S&P 500 - Daily - Our Though Experiment
The SPX put in a massive "Hammer Candle" overnight Friday, touching the 100 day at intraday lows. These are very rare candles when it comes to indexes. When occurring, post sell offs, they tend to mark that the price decline is over and prices will rise from there (See chart right)
Our Though Experiment, which we have discussed many times previously in the way of a projection, suggests we have put in a near term top (or very close to it) and will now consolidate before possibly completing one final small impulse higher OR put in a final Wave 5 of a higher degree.
NOTE: To reiterate what I previously wrote - "the black labeled activity shown below, between now and July, looks like a "Killing Field" where the algos take Day Traders, "Dip Buyers", the "Gamma Guys" and FOMO's all out on stretchers!"
| |
YOUR DESKTOP / TABLET / PHONE ANNOTATED CHART
Macro Analytics Chart Above: SUBSCRIBER LINK
| |
STOCK MONITOR: What We Spotted
MONDAY
- The stock sell-off continued Monday to see the S&P 500 lose 2.6% across Friday and Monday, its largest two-day sell-off in more than a year, and now closing beneath its 50d MA for the first time in five months, according to Bloomberg, reflective of the weakening technical backdrop for risk assets.
- The VIX climbed above 19. While stock futures had made a recovery attempt during the overnight session after geopolitical hedges from the weekend were unwound, later reporting Israel was working on a retaliation contributed to renewed risk off conditions during stateside trade, with gold, oil, and haven currencies all finding some momentum into the APAC session here.
- Treasuries saw heavy losses, with the focus returning to the hot US economic conditions, highlighted by the massive beat in retail sales earlier, although yields did pare off highs as the geopolitical angst rose again into the NY afternoon.
- The Dollar Index hit new YTD peaks, while USD/JPY also found new multi-decade highs above 154, although some of the Iran/Israel angst has put a stop to the Yen's rot for now.
INFLATION BREAKEVENS: 5yr BEI +3.7bps at 2.494%, 10yr BEI +3.4bps at 2.440%, 30yr BEI +3.0bps at 2.368%.
REAL RATES: 10Y -- 2.1681%
STOCK SPECIFIC
- Goldman Sachs (GS) +3%: Earnings impressed; EPS, revenue, and other key metrics all beat, alongside a strong revenue breakdown.
- Charles Schwab (SCHW) +2%: Post-earnings, CFO expects net interest margin expansion through 2024. In earnings, they were mixed - top and bottom line marginally beat, but internals were more mixed.
- Tesla (TSLA) -5%: Lays off "more than 10%" of its global workforce. Separately, CEO Musk announced a cut in the price of the FSD package to USD 99/month.
- Apple (AAPL) -2%: iPhone shipments fell 10% in Q1 and short of Wall St. expectations as it was hurt by intensifying competition by Android, according to IDC.
- Informatica (INFA) -7%, Salesforce (CRM) -7%: Salesforce is in advanced negotiations to acquire Informatica, WSJ reports. The sources add the price being discussed is below INFA''s current share price of USD 38.48.
- Blackbaud (BLKB) +3%: Clearlake offers USD 80/shr to acquire Blackbaud (BLKB). Note, BLKB closed Friday at USD 76.72.
- Snap One Holdings (SNPO) +30%: To be acquired by Resideo (REZI) -4% for USD 10.75/shr. Note, SNPO closed Friday at USD 8.14/shr.
- Encore Wire (WIRE) +11%: To be acquired by Prysmian for USD 290/shr. Note, WIRE closed Friday at USD 260.98.
- Medical Properties Trust (MPW) +18%: Sold stakes in five Utah hospitals to a new JV with an affiliated investment fund for USD 886mln.
- Cisco (CSCO) -0.5%: Upgraded at BoFA citing three catalysts for growth acceleration.
- Alcoa (AA) +4: Benefitting from the surge in Aluminium prices.
- Lockheed Martin (LMT) +0.6%: Wins US missile defence contract worth USD 17bln, according to Reuters sources.
TUESDAY
- Stocks were choppy on Tuesday amid hawkish Fed speeches and mixed earnings reports as the indices attempted to find some ground after recent selling, with the VIX back under 19 and a lack of response (so far) from Israel.
- There were two key Fed speeches with both Vice Chair Jefferson and Chair Powell himself walking back comments around rate cuts, that weighed on Treasuries as yields continued to climb higher.
- There are now 40bps of cuts priced for the year in money markets vs 44bps beforehand.
- Banks were an area of weakness with Bank of America (BAC) and Bank of NY Mellon (BK) dipping post-earnings, although Morgan Stanley (MS) outperformed.
- Meanwhile, tech found some general recovery, while a solid UNH report supported Healthcare.
- The Dollar was ultimately flat. Note a mini-flash crash in USD/JPY in the NY morning ignited suspicions of BoJ intervention, although note the pair has recovered already.
- Oil prices were flat, although nat gas saw a late session spike which was followed by TC Energy (TRP) announcing it was responding to an incident in Yellowhead County involving NGTL with the affected section of pipeline having been shut down.
INFLATION BREAKEVENS: 5yr BEI -0.4bps at 2.495%, 10yr BEI -0.8bps at 2.429%, 30yr BEI -0.1bps at 2.366%.
REAL RATES: 10Y -- 2.239%
STOCK SPECIFIC
- Apple (AAPL) -2%: Insider sales from COO and CFO
- Microsoft (MSFT) flat: Plans to invest USD 1.5bln in G42, a UAE-based AI company with ties to China.
- Live Nation (LYV) -7.5%: Set to be sued by the DoJ, according to WSJ.
- Tesla (TSLA) -2.5%: Confirmed it is planning to layoff 10% if its global workforce. Following this, JPMorgan said TSLA layoffs show delivery miss about demand, not supply.
- Lockheed Martin (LMT) +0.5%: Secured a USD 17bln contract from US Missile Defense Agency.
- AMD (AMD) +2%: Upgraded at HSBC on reset expectations.
- Amazon (AMZN) flat: Prime subs jump 8% in US to new high of 180mln, according to Consumer Intelligence Partners.
- Envestnet (ENV) +9.5%: Is exploring options including a sale with the help of a financial advisor, according to Reuters sources.
WEDNESDAY
- Stocks were sold on Wednesday with losses led by the Nasdaq as the Tech sector underperformed with semis weighed on by a poor ASML earnings report.
- Stocks had pared some of the weakness after a stellar 20yr bond auction before selling resumed into the closing bell.
- Elsewhere, the Dollar was sold as it tracked US yields lower which in turn supported the Yen, Franc and Euro but the Antipodes outperformed despite the risk-off tone of trade.
- GBP only saw slight gains vs the Buck but it was weaker vs the Euro despite hotter-than-expected inflation, but BoE officials did not seem too concerned. There were few developments on geopolitics today other than reports suggesting Israel was going to respond to Iran on Monday, but ultimately decided to wait - a response seems a given but it is still a matter of when and how.
- Elsewhere, trade concerns between the US and China are rising after US President Biden was calling for higher tariffs on Chinese steel.
- The lack of updates saw oil prices pare some of the recent strength with inventory data showing a larger build than expected supporting the move while gold prices saw slight losses, despite the weaker dollar.
- Attention turns to more Fed speak overnight and on Thursday, with Thursday US data focusing on Jobless Claims, Existing Homes Sales and the Philly Fed business index.
INFLATION BREAKEVENS: 5yr BEI -3.0bps at 2.457%, 10yr BEI -2.2bps at 2.400%, 30yr BEI -2.1bps at 2.341%.
REAL RATES: 10Y -- 2.1858%
STOCK SPECIFIC
- Tapestry (TPR) -1% Capri (CPRI) -3%: FTC is preparing to sue to block Tapestry's USD 8.5bln takeover of Capri Holdings, according to NYT.
- Mobileye (MBLY) +3%: Secured orders for 46mln of the EyeQ6 Lite driver-assistance chips.
- Eli Lilly (LLY) +0.5%: Weight loss drug (Trezepatide) met all primary endpoints and key secondary endpoints in two Phase 3 clinical trials.
- Sage Therapeutics (SAGE) -20%: Phase 2 study of dalzanemdor did not meet primary endpoint.
- Autodesk (ADSK) -6%: Said it will further delay its annual 10-K filing due to an ongoing internal investigation of its board of directors.
- Knight-Swift Transportation (KNX) -4%: Lowers Q1 and Q2 guidance.
- Microsoft (MSFT) -0.7%: To reportedly avoid a formal EU probe over USD 13bln OpenAI deal, according to Bloomberg.
- Zuora (ZUO) +12%: Exploring potential options after receiving acquisition interest from potential buyers, according to Reuters sources.
- Snap (SNAP) +5%: US House Speaker Johnson says TikTok divest-or-ban bill is moving fast through Congress.
THURSDAY
- Stocks were subdued on Thursday, unwinding initial gains as the bearish trend continued.
- The downside came on the heels of Fed's Williams opening up the door to potential rate hikes, even though they are not his current base case.
- The weakness was led by tech, with TSM selling off after its earnings report where it trimmed its outlook for the semiconductor industry as a whole, despite decent quarterly figures and its own guidance.
- Treasuries bear-flattened after Fed's Williams, in addition to the hot Philly Fed survey, with prices paid at a YTD peak and the overall index at its highest level since 2022, not to mention set up for next week's 2s, 5s, and 7s auctions with little scheduled for Friday, although Goolsbee does speak ahead of the FOMC blackout.
- In FX, the Dollar edged higher as the Yen continued to weaken as participants await possible intervention. Euro was sold amid particularly dovish comments from ECB's Villeroy.
- Meanwhile, oil prices were choppy amid signs of technical fatigue in the oil market juxtaposed against some fresh Iranian bellicose rhetoric.
- Note that metals were bid, with copper and base metals in particular breaking out higher.
INFLATION BREAKEVENS: 5yr BEI -0.5bps at 2.473%, 10yr BEI +0.1bps at 2.414%, 30yr BEI +0.5bps at 2.357%.
REAL RATES: 10Y -- 2.2254%
STOCK SPECIFIC
- TSMC (TSM) -5%: Reversed initial gains after a strong report; slightly trimmed 2024 semi-industry growth forecast and semi demand for IoT remains sluggish in addition to announcing its Earthquake related costs.
- Equifax (EFX) -8.5%: Next quarter and FY guidance disappointed.
- CSX (CSX) +1.5%: Top and bottom line surpassed Wall St. expectations.
- Alaska Air (ALK) +4%: Posted a shallower loss per shr., revenue beat, with Q2 and FY profit view beating.
- Comerica (CMA) +1.5%: Beat on NII and avg. deposits.
- Marsh & McLennan (MMC) +2% and Ally Financial (ALLY) +6.5%: Reported solid results.
- Las Vegas Sands (LVS) -8.5%: Operating profit was short with Macau operations results also light.
- Elevance Health (ELV) +3%: Topped on EPS and raised FY outlook.
- Blackstone (BX) -2.5%: Lowered quarterly dividend.
- Tesla (TSLA) -3.5%: Downgraded at Deutsche.
- BlackRock (BLK), MSCI (MSCI) -1%: US House Committee is probing index funds that channelled billions of Dollars into blacklisted Chinese companies; probe is focused on BlackRock and MSCI, according to WSJ.
- Google (GOOGL) +0.5%: CEO Pichai says plan to share more AI progress on earnings call (earnings date April 25th).
- Nordstrom (JWN) +4.5%: Family reportedly weighing taking the retailer private, according to WSJ.
FRIDAY
- Stocks were sold with losses largely led by the Nasdaq with notable downside in Nvidia (NVDA) and Netflix (NFLX) shares.
- The latter was hit on a slightly disappointing next quarter revenue guidance and stopping to report subscriber count, while NVDA weakness was seemingly a continuation of the weak ASML earning report reaction earlier in the week, in addition to a collapse in Super Micro (SMCI) shares on a lack of upside pre-announcement also hit the chip space.
- Weakness was also observed overnight as Israel retaliated against Iran which led to upside in Treasuries and oil, but the moves in the latter two assets had pared the majority of the move as it came to fruition not too much damage was dealt and neither side intend to retaliate again.
- The tech weakness kept stocks pressured, however.
- There was a lack of US data on Friday, but Fed's Goolsbee sounded a bit more hawkish than his normal dovish self, noting progress on inflation has stalled, and it makes sense to wait for more clarity before moving.
- The Dollar was flat on Friday but GBP lagged on some dovish Ramsden commentary, who said the risks to UK inflation outlook are tilted to the downside vs February forecasts.
- There were also soft UK retail sales this morning.
- Attention next week turns to a plethora of earnings, as well as US GDP and US PCE.
INFLATION BREAKEVENS: 5yr BEI -0.5bps at 2.473%, 10yr BEI +0.1bps at 2.414%, 30yr BEI +0.5bps at 2.357%.
REAL RATES: 10Y -- 2.193%
STOCK SPECIFIC
- Netflix (NFLX) -9%: Posted light Q2 revenue guidance and announced it is to stop reporting subscriber counts. Although, EPS, revenue, subscriber additions, and operating margin all topped expectations.
- SLB (SLB) -2.5%: Top and bottom line were more-or-less in line, although revenue declined due to seasonality; it remains confident in the FY outlook.
- Procter & Gamble (PG) +0.5%: EPS beat and raised FY core EPS growth view.
- American Express (AXP) +6%: Top and bottom line beat.
- Regions Financial (RF) -1%: EPS light of forecasts.
- Tesla (TSLA) -2%: Recalling certain 2024 Cybertruck vehicles over unintended acceleration from a trapped pedal, according to NHTSA.
- KB Home (KBH) +1%: Board authorised a USD 1bln share buyback and raised quarterly dividend 25% to USD 0.25/shr.
- Paramount (PARA) +13.5%: Sony and Apollo are in talks to jointly bid for Paramount, potentially offering an all-cash deal to take the Co. private, NYT reports.
- Super Micro (SMCI) -23%: Desks cited a lack of a positive pre-announcement for earnings after the Co. announced its post-earnings call on April 30th. As such, Nvidia (NVDA) closed down 9% with the semiconductor ETF SOXX falling 4%.
| |
BOND MARKET
CONTROL PACKAGE
There have FIVE charts we have outlined in prior chart packages that we will continue to watch closely as a CURRENT "control set".
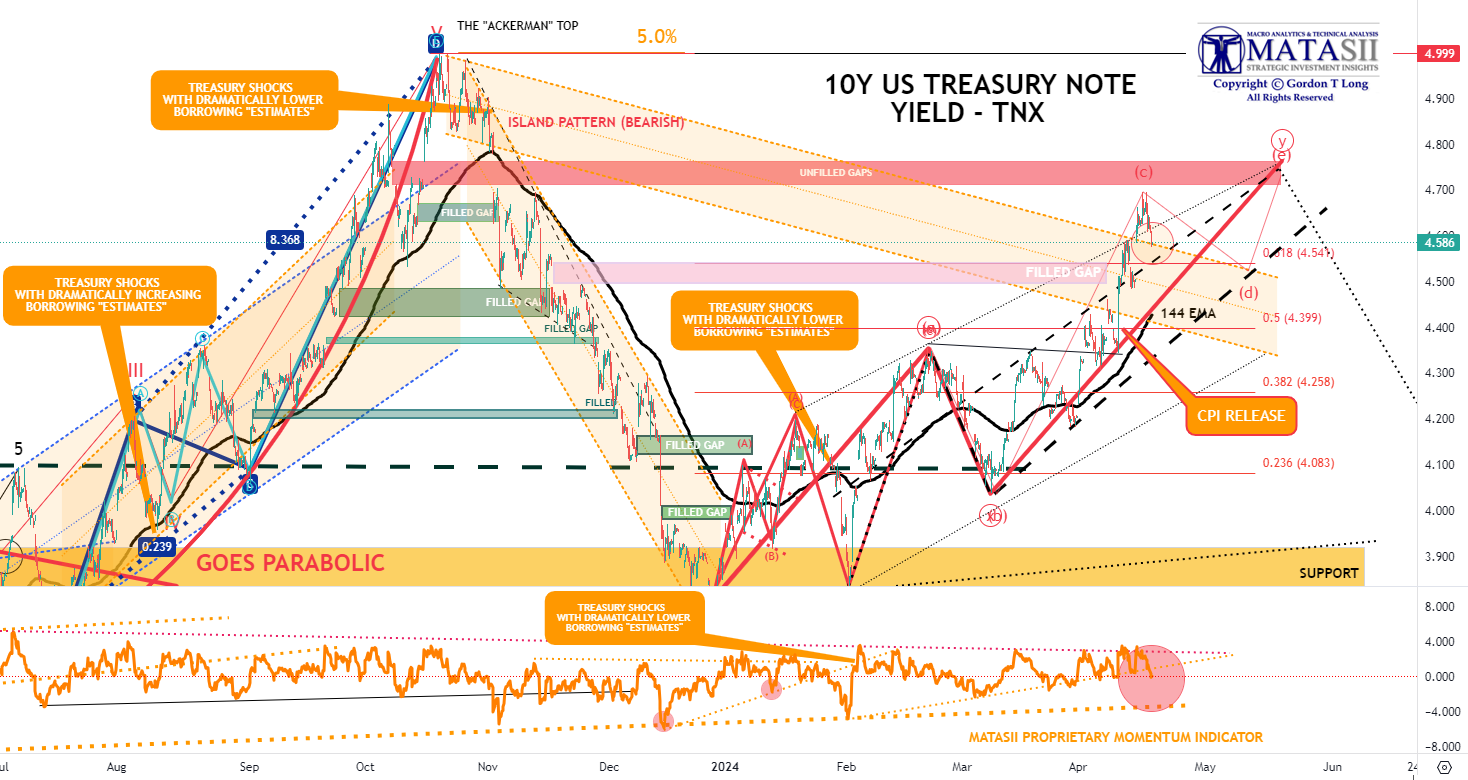
- The 10Y TREASURY NOTE YIELD - TNX - HOURLY (CHART LINK)
- The 10Y TREASURY NOTE YIELD - TNX - DAILY (CHART LINK)
- The 10Y TREASURY NOTE YIELD - TNX - WEEKLY (CHART LINK)
- The 30Y TREASURY BOND YIELD - TNX - WEEKLY (CHART LINK)
- REAL RATES (CHART LINK)
FISHER'S EQUATION = 10Y Yield = 10Y INFLATION BE% +REAL % = 2.414% + 2.193% = 4.607%
WEDNESDAY TREASURY AUCTION
Another super strong demand showing for 20yr Treasuries with the USD 13bln reopening stopping through the WI by 2.5bps, the largest stop-through since 2023, better than March's 2bp stop-through and the six-auction avg. 0.2bps. The auction was covered 2.82x, above the prior 2.79x and avg. 2.57x, Dealers were left with 9.1%, beneath the prior 9.3% and avg. 13.7%, with Indirects taking a chunky 74.7%, above the prior 73.5% and avg. 68.0%. After recent heavy selling, the auction was seen as a litmus test for dip-buying appetite, and it has clearly passed with flying colors.
Yields fell on the 10Y TNX (below)
|  | |
YOUR DESKTOP / TABLET / PHONE ANNOTATED CHART
Macro Analytics Chart Above: SUBSCRIBER LINK
| |
NOTICE Information on these pages contains forward-looking statements that involve risks and uncertainties. Markets and instruments profiled on this page are for informational purposes only and should not in any way come across as a recommendation to buy or sell in these assets. You should do your own thorough research before making any investment decisions. MATASII.com does not in any way guarantee that this information is free from mistakes, errors, or material misstatements. It also does not guarantee that this information is of a timely nature. Investing in Open Markets involves a great deal of risk, including the loss of all or a portion of your investment, as well as emotional distress. All risks, losses and costs associated with investing, including total loss of principal, are your responsibility.
FAIR USE NOTICE This site contains copyrighted material the use of which has not always been specifically authorized by the copyright owner. We are making such material available in our efforts to advance understanding of environmental, political, human rights, economic, democracy, scientific, and social justice issues, etc. We believe this constitutes a ‘fair use’ of any such copyrighted material as provided for in section 107 of the US Copyright Law. In accordance with Title 17 U.S.C. Section 107, the material on this site is distributed without profit to those who have expressed a prior interest in receiving the included information for research and educational purposes. If you wish to use copyrighted material from this site for purposes of your own that go beyond ‘fair use’, you must obtain permission from the copyright owner.
========
| |
MATASII'S STRATEGIC INVESTMENT INSIGHTS | |
2020 VIDEOS OUTLINING THE COMING RISE IN INFLATION, STAGLFLATION & COMMODITY PRICES | |
IDENTIFICATION OF HIGH PROBABILITY TARGET ZONES | |
Learn the HPTZ Methodology!
Identify areas of High Probability for market movements
Set up your charts with accurate Market Road Maps
Available at Amazon.com
| |
The Most Insightful Macro Analytics On The Web | | | | |