|
LONGWave - AUGUST 2023
Technical Analysis
| |
THE US CREDIT RATING IS IN ACTUALITY NOW 'HY' OR 'JUNK'!
The reality is that it ended making sense to apply a credit rating on the US government when the US came off the gold standard in August of 1971. The point of a rating is to indicate the likelihood of default. Nobody is really worried about the US government defaulting because the Federal Reserve can always create more money. But that doesn’t mean there is no risk in buying US Treasuries. That risk is about the fact they are denominated in US dollars and that risk is about Inflation or currency debasement.
As a Fiat Currency, the US dollar is losing its purchasing power against real wealth. US dollars are only paper claims against real wealth, claims that must be settled before they become actual wealth. Until then they are just paper promises unbacked by anything other than an ability to tax a citizenship that may or may not be able to render up US dollars.
Dollar depreciation is like a default. If a government has to resort to a printing press to pay off its bills, you still get your money back when a government bond matures, but you lose purchasing power. The dollars you get back won’t buy as much as they did when you initially gave the government the money for the bonds..
So, an honest rating of US government debt would be junk status — not because of the default risk, but because of the high likelihood (almost an absolute guarantee) that it will continue to inflate away the dollar’s value.
That raises a key question: If you’re guaranteed to lose with a bond, what should the rating be? At some point, people need to realize that the fact the US government will have to print money in order to pay its debts is a reason not to buy Treasuries. Keep in mind, Treasuries are just future payments of US dollars. So, you should really be looking at the rating of the currency and consider what the dollar will be worth in 30 years. Will that 4% interest cover what you lose through inflation over that period of time and give you some kind of positive return?
The bottom line is the rating is meaningless. All US government debt is junk. You must have a plan to protect yourselves from dollar-denominated debt as quickly as you can!
| |
|
THIS WEEK WE SAW
Exp=Expectations, Rev=Revision, Prev=Previous
INFLATION
US CPI YY (Jul) 3.2% vs. Exp. 3.3% (Prev. 3.0%)
US Core CPI YY (Jul) 4.7% vs. Exp. 4.8% (Prev. 4.8%)
US CORE Services: CPI Ex-ShelterCore Services reaccelerated in July (+0.2% M-o-M, and from +3.9% to +4.0% Y-o-Y).
PPI SUPER CORE METRIC: ex food, energy and trade, rose 0.2% (above the expected and prior of 0.1%), while the Y/Y rose 2.7%, matching the prior month's pace, albeit it was revised up from 2.7%.
GROWTH
Chinese Exports YY (Jul) -14.5% vs. Exp. -12.5% (Prev. -12.4%)
Chinese Imports YY (Jul) -12.4% vs. Exp. -5.0% (Prev. -6.8%)
Chinese Trade Balance (CNY)(Jul) 575.7B (Prev. 491.3B)
Chinese Exports YY (CNY)(Jul) -9.2% (Prev. -8.3%)
Chinese Imports YY (CNY)(Jul) -6.9% (Prev. -2.6%)
Chinese Trade Balance (USD)(Jul) 80.6B vs. Exp. 70.6B (Prev. 70.6B)
| |
========================= | |
|
WHAT YOU NEED TO KNOW
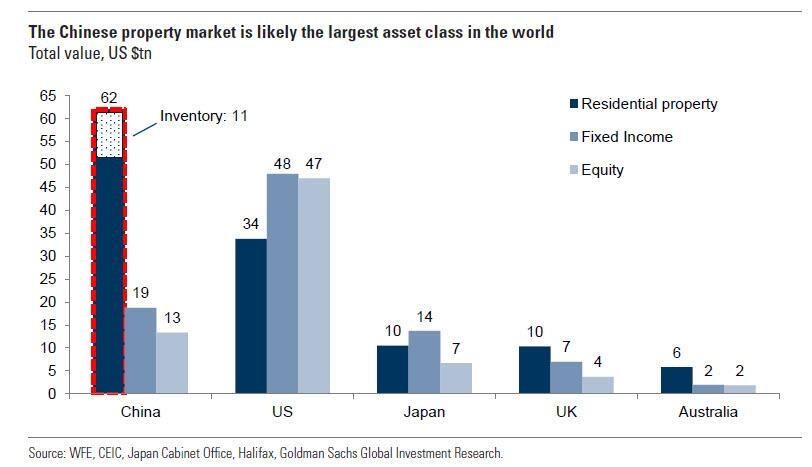
CHINA: A Lot of Hurt Going On!
More bad news came for China's Post Lockdown recovery when Country Garden Holdings, a major Chinese developer, announced it had missed payments on Dollar bonds and again ignited worry in Chinese Commerical Real Estate market - the Yuan suffered. Additionally, Chinese trade data bombed, with exports showing the worst decline (-14.5% Y-o-Y in July) since Feb 2020, while imports too were crunched (-12.4%) - reflecting weak domestic demand, and iterating ongoing issues with lack of consumption and investment growth in China. Dismal Chinese trade data suggests no more hikes and 2024 cuts.
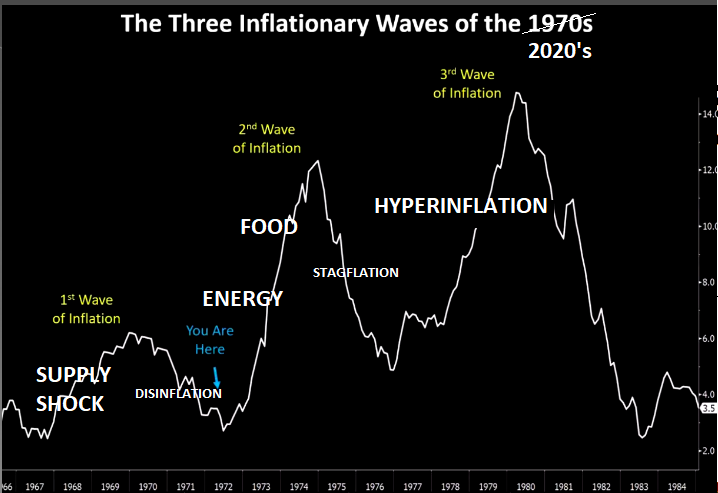
INFLATION: Following The Same 1970's Script
- Inflation is a heavily lagging economic indicator. Don’t get blindsided by waiting on inflation data to turn up before being convinced of Price-Growth’s return.
- The non-reaction to China’s weak inflation data on Wednesday appears to suggest the market is looking through lagging data, and sensing perhaps China has turned a corner as the cumulative impact of stimulus begins to gain traction.
- It was also the same last week when US yields rose on the back of rising term premium, the market getting a whiff of supply and thus inflation concerns. It’s a trend we can expect to continue of market-implied measures of inflation.
MARKETS ARE MOST OFTEN WRONG AT POINTS OF MAJOR ECONOMIC TURNING POINTS
CREDIT DOWNGRADES: Banks, Municipal Bonds and Lender Option Bonds
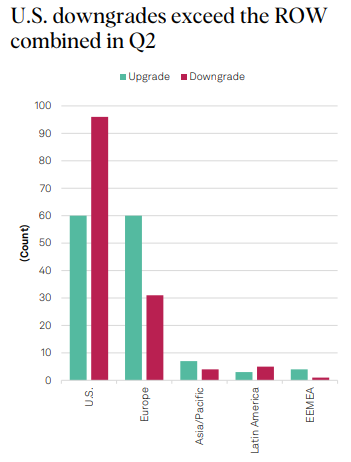
- The U.S. Is Driving Increasing Default Numbers. U.S. downgrades exceed the ROW, but negative bias is growing in most regions combined in Q2.
- In the U.S., lower-rated corporate borrowers are vulnerable to liquidity constraints, with earnings under pressure, debt service costs rising and the maturity wall approaching. Labor costs and shortages are becoming more prominent as some of the supply chain challenges start to abate.
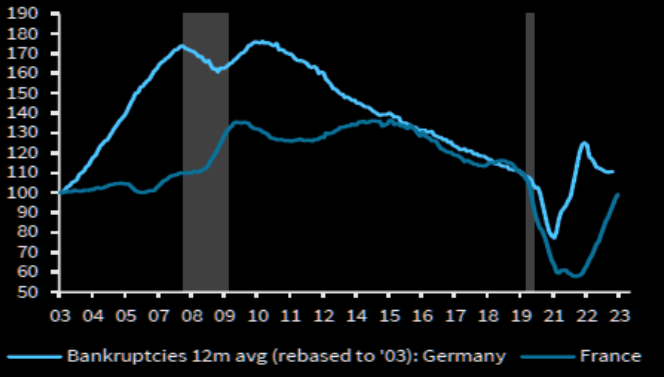
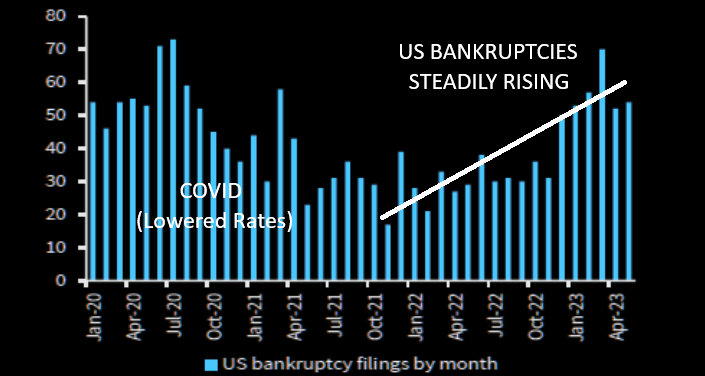
- Bankruptcies are on the rise in the US. Meanwhile defaults in Europe are rising, but the overall level is still low, despite the recent spike in financial stress.
EARNINGS SEASON: Buy The Rumor, Sell the News!
- With 85% of the index having now reported results, the 78% beat rate is back well above trend and at its highest level in nearly 2Y.
- Earnings reactions remain negative on average, no matter the surprise-type, a dynamic we haven’t seen since 2Q17.
GLOBAL ECONOMIC REPORTING: What This Week's Key Global Economic Reports Tell Us
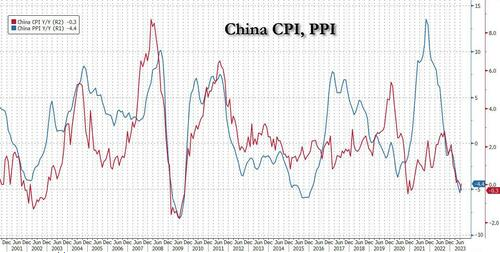
- China's CPI printed negatively for the first time in two years, which is likely to produce a deflationary impulse on core goods inflation.
- Both US Goods and Services CPI (Y-o-Y) slowed in July - but Services remain extremely high at +6.1%. The Fed will be watching its new favorite signal - Core Services CPI Ex-ShelterCore Services. CPI Ex-Shelter reaccelerated in July (+0.2% M-o-M, and from +3.9% to +4.0% Y-o-Y).
- The PPI data was hotter than expected in July for the first time since the January report, at least for the headline M/M, which rose 0.3% (exp. 0.2%) and accelerated from the prior 0.0%, which was revised down from 0.1%. Sticky margins are thus one sign that inflation is becoming ingrained.
=========================
| |
|
CONCLUSION
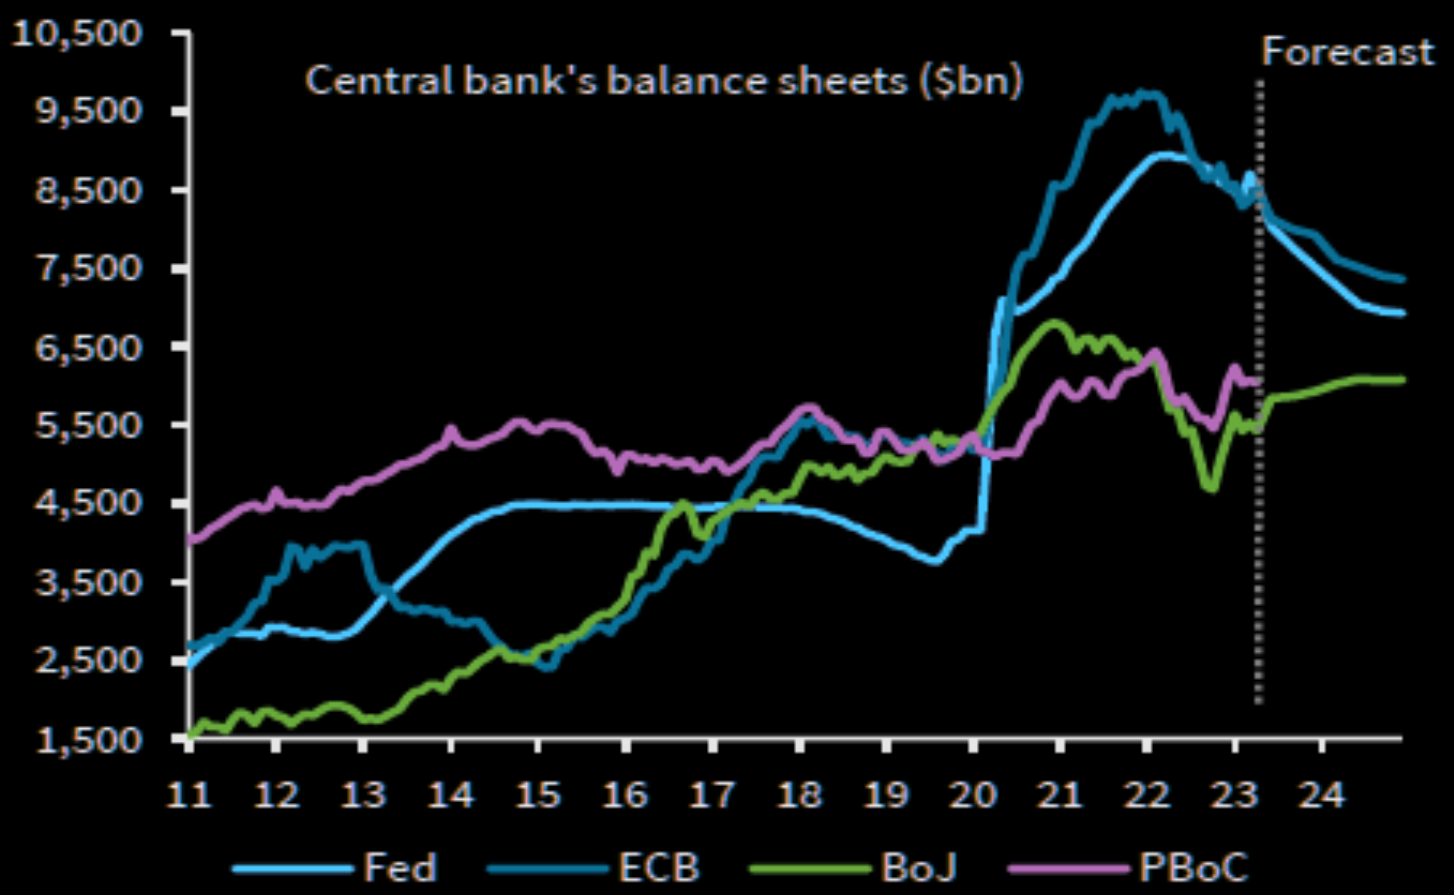
With Lending tightening and Bank Balance Sheets shrinking, this has historically meant Liquidity would be shrinking. However, today with massive Bidenonomic spending occurring, Covid Forbearance still underway for Student Loans, Covid Savings still not all spent; as well as Financial Institutions with capital available for placement, the US economy has yet to feel the real pain of coordinated central bank balance sheet reduction actions.
However, central bank actions can be expected to prevail over time.
In this week's expanded "Current Market Perspectives", we focus on the current weakness in Technology, Banks and the Financial Institutions.
=========
| |
|
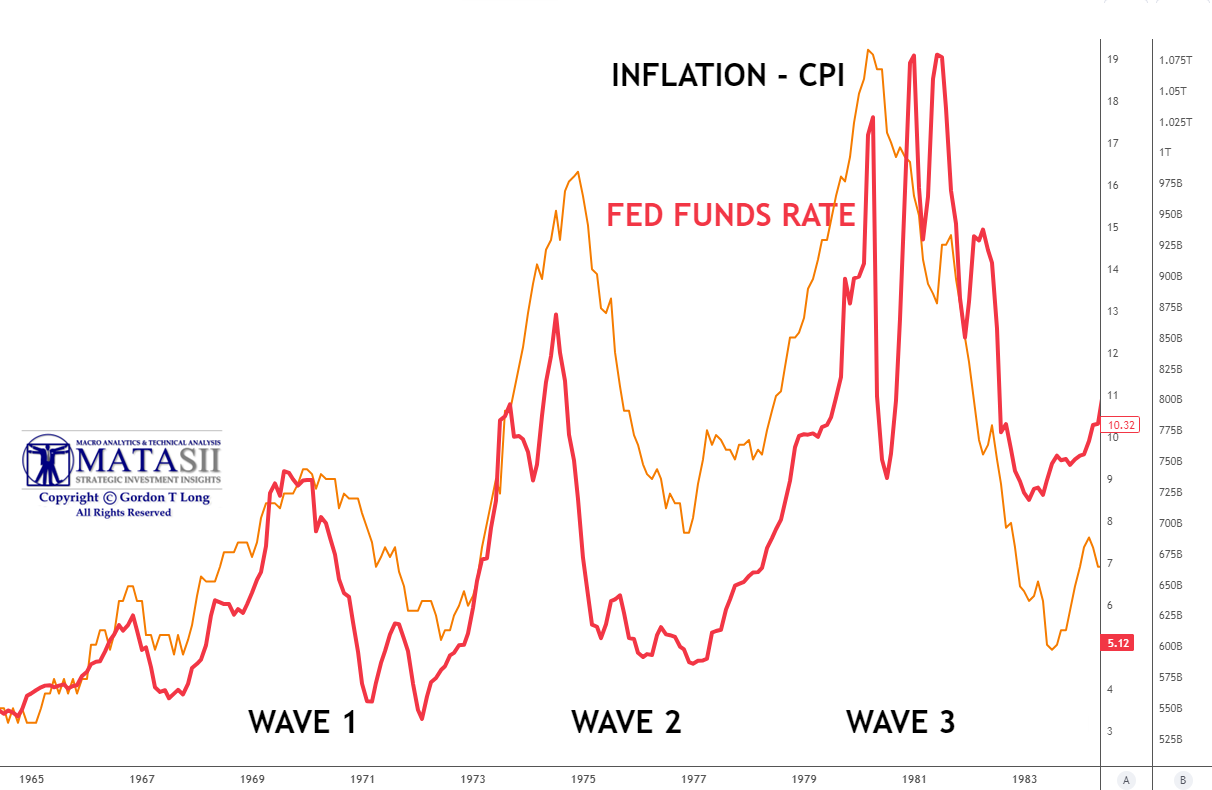
INFLATION: Following The Same 1970's Script
The big theme of the week was 'inflation' appearing to be stickier than many 'soft landing' narratives had accounted for. This pushed Fed rate expectations higher on the week (erasing the dovish response to last week's payrolls).
It might look like it’s been defeated, but US inflation is poised to begin accelerating again soon.
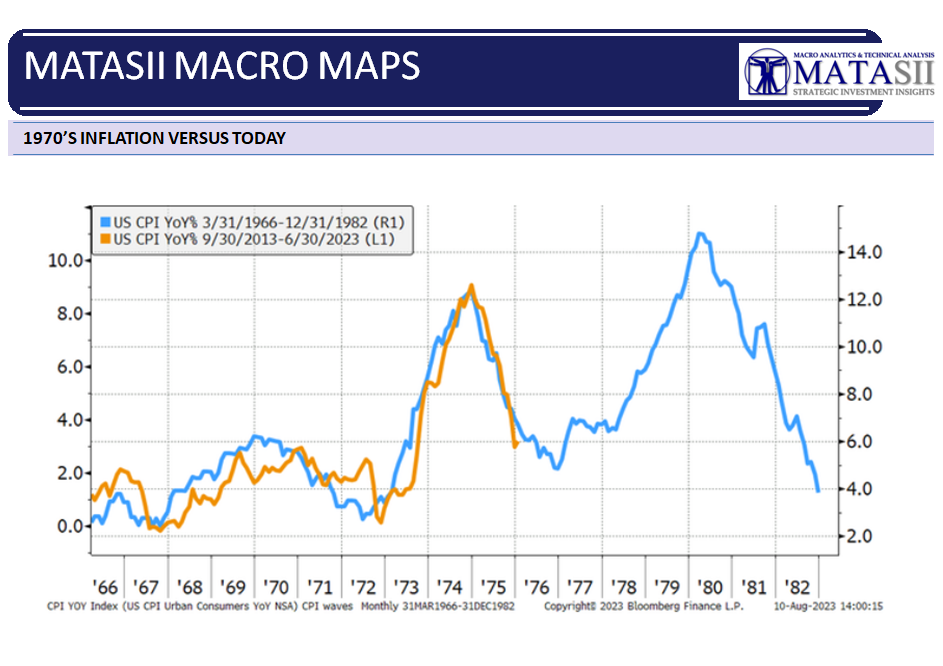
Stocks and bonds are unpriced for this outcome. The chart on the right from this week's video shows what happened in the 1970's, while the chart below shows how closely we are tracking it today.
| |
|
INFLATION IS A HEAVILY LAGGING ECONOMIC INDICATOR
Don’t get blindsided by waiting on inflation data to turn up before being convinced of Price-Growth’s return.
It’s a delicate balancing act as excess liquidity continues to be supportive of risk assets for now. But once the inflation data is showing clear signs of rising, it will already be too late to get ahead of the selloff.
MARKETS ARE MOST OFTEN WRONG AT POINTS OF MAJOR ECONOMCI TURNING POINTS
The non-reaction to China’s weak inflation data on Wednesday appears to suggest the market is looking through lagging data, and sensing perhaps China has turned a corner, as the cumulative impact of stimulus begins to gain traction. It was also the same last week when US yields rose on the back of rising term premium, the market getting a whiff of supply and thus inflation concerns. It’s a trend we can expect to continue of market-implied measures of inflation.
SOME KEY HEADLINES YOU MAY HAVE MISSED (Poorly Covered By US Media):
ENERGY:
-
European NatGas Prices Explode 40% Higher - Australian Coinspreaker, Google Coverage Dutch TTF futures surged 40% on Wednesday, coming on the back of a slew of strikes across Australian LNG plants, at a time when Europe increasingly relies on seaborne supply. There was strong upside, albeit not to the same extreme degree, in US natural gas futures too. Analysts point to Asia being dependent on Australian supply of natural ga, and therefore, will likely need to compete with Europe to find supplies elsewhere across the globe as long as the strikes go on.
-
Our Oil Predicament Explained: Heavy Oil And The Diesel Fuel It Provides Are Key Gail Tverberg
FOOD:
-
World Food Prices Jump the Most in 18 months - Food and Agriculture Organization of the United Nations (FAO)
-
Rice Crisis Sends Prices To Highest Levels Since 2008 - BBC News
-
Tyson Foods Plunges As Earnings Fall Short Amid Waning Meat Demand Tyson Foods Earnings Report
| |
|
CREDIT DOWNGRADES: Banks, Municipal Bonds and Lender Option Bonds
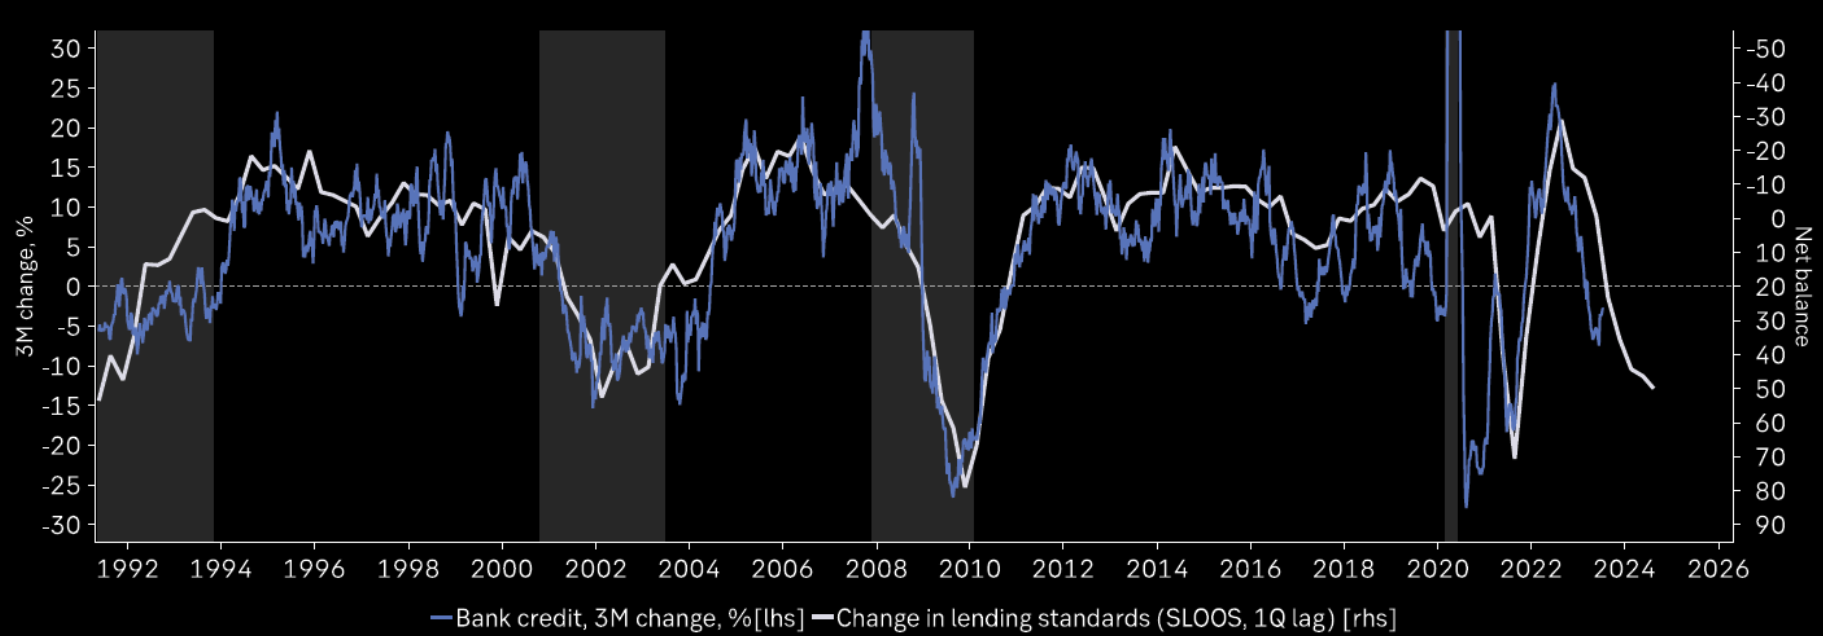
The SLOOS report continues to show credit tightening by banks and lending institutions. This is resulting in pressures on their margins, which credit rating agencies are warning clients of.
CHART RIGHT: Credit contraction is highly likely to begin weighing on US growth in Q3 and Q4 2023.
| |
FITCH - Continues its Assault on US Financial Sector
After the prior week's US Credit downgrade, this week Fitch said it is taking various rating actions on US enhanced municipal bonds and tender option bonds, corresponding to actions taken on their associated enhancement providers and liquidity providers.
Additionally:
Fitch downgraded the Long-Term Issuer Default Ratings (IDR) and Government Support Ratings (GSR) of the Federal Home Loan Bank of Atlanta (FHLBATL) and the Federal Home Loan Bank of Des Moines (FHLBDM) to 'AA+' and 'aa+' from 'AAA' and 'aaa', respectively. The Short-Term IDR was affirmed at 'F1+'. The Rating Watch Negative has been removed. The Rating Outlook is Stable. These rating actions follow Fitch's downgrade of the U.S. sovereign's Long-Term IDR to 'AA+' on Aug. 1, 2023
| |
MOODY'S
Ratings agency Moody's downgraded some US banks and warned of possible cuts to others.
Downgraded
- M&T's (MTB),
- Old National (ONB),
- Associated Banc-Corp (ASB),
- BOK Financial (BOKF),
- Webster (WCFB),
- Fulton (FULT), and
- Pinnacle Financial Partners (PNFP).
Also placed Bank of New York Mellon (BK), US Bancorp (USB), Truist (TFC), State Street (STT), and Northern Trust (NTRS) on review for downgrade.
The CRA said that many banks Q2 results showed growing profitability pressures that will reduce their ability to generate internal capital," adding that this came "as a mild US recession is on the horizon for early 2024 and asset quality looks set to decline, with particular risks in some banks’ commercial real estate portfolios.
| |
S&P GLOBAL RATINGS
S&P Global Ratings is reporting:
- In the U.S., lower-rated corporate borrowers are vulnerable to liquidity constraints, with earnings under pressure, debt service costs rising and the maturity wall approaching.
- Labor costs and shortages are becoming more prominent as some of the supply chain challenges start to abate.
- Macroeconomic factors and geopolitical developments are additional risks. Speculative-grade issuers are making progress reducing or extending near-term maturities, although those with maturing debt rated 'B-' and lower could be particularly challenged. Health care and media entertainment have more of such debt due in the next 24 months.
- S&P Global Ratings Credit Research & Insights expects global bond issuance to fall marginally this year, by 1.5%, to roughly $7.2 trillion. Financial markets displayed remarkable resilience in the face of numerous potential stressors in the second quarter. This resilience helped spur dealmaking and improve issuance comparisons for most sectors, though some faced challenges through midyear. In particular, structured finance and international public finance had double-digit declines.
- Corporate borrowers have made progress in reducing upcoming maturities, lowering speculative-grade nonfinancial debt coming due in second-half 2023 and full-year 2024 by 31% and 23%, respectively. But global corporate maturities ramp up steadily in coming years, putting pressure on companies to seek opportunities for refinancing. Challenges lie ahead for borrowers as they face higher-for-longer interest rates, uncertain financing conditions, and an overhang of pandemic-era debt.
We encourage you to read S&P Global Ratings' Latest Full Report .
| 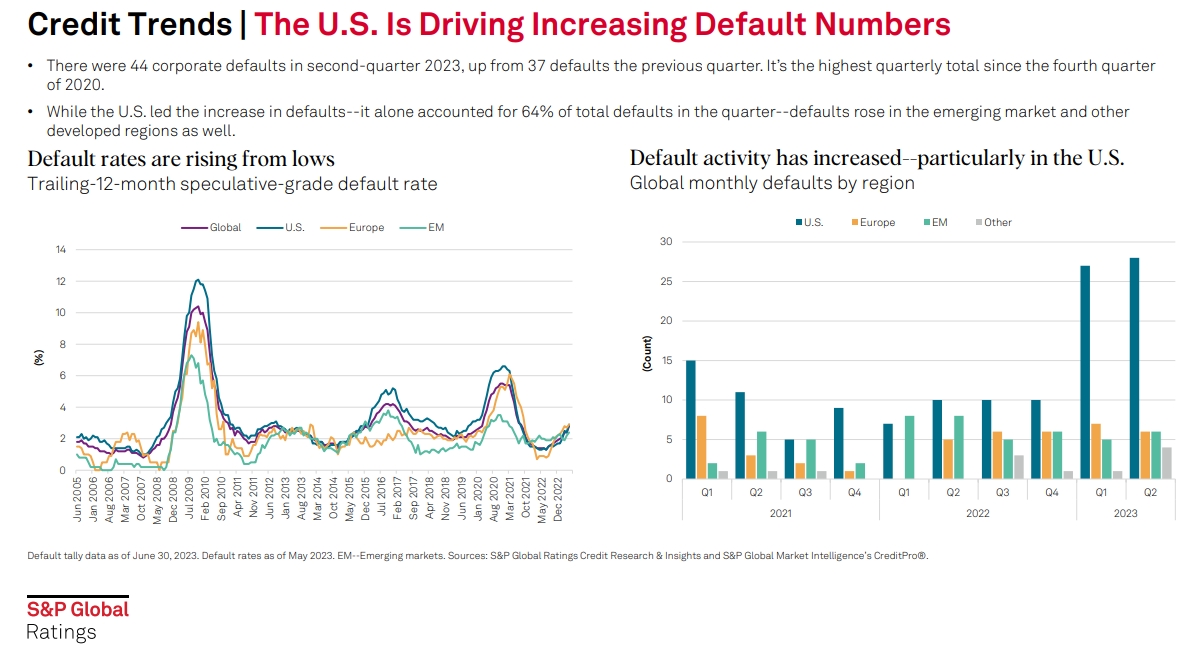 |  | |
DEFAULTS & BANKRUPTCIES
Defaults in Europe are rising, but overall level still low despite the recent spike in financial stress. (CHART RIGHT)
CHART BELOW
Bankruptcies are on the rise in the US.
| |
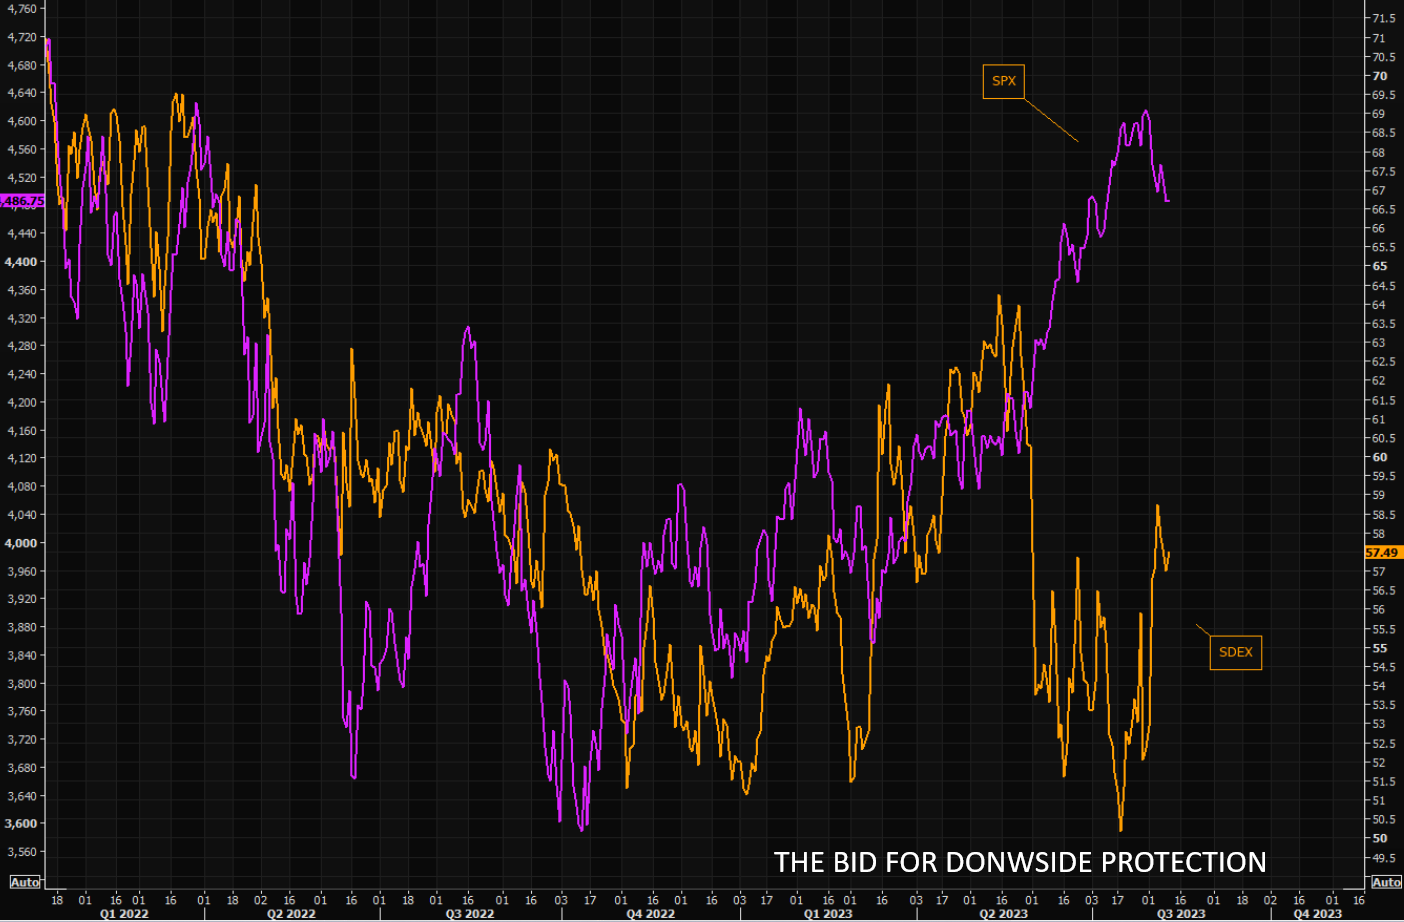
DOWNSIDE MARKET PROTECTION GETTING MORE ATTENTION - AGAIN
The bid in skew continues to be strong. The SDEX index is holding close to recent highs, despite the fact the SPX has sold off from the most recent highs (Chart Right).
The crowd is long, and "must" pay up for downside protection.
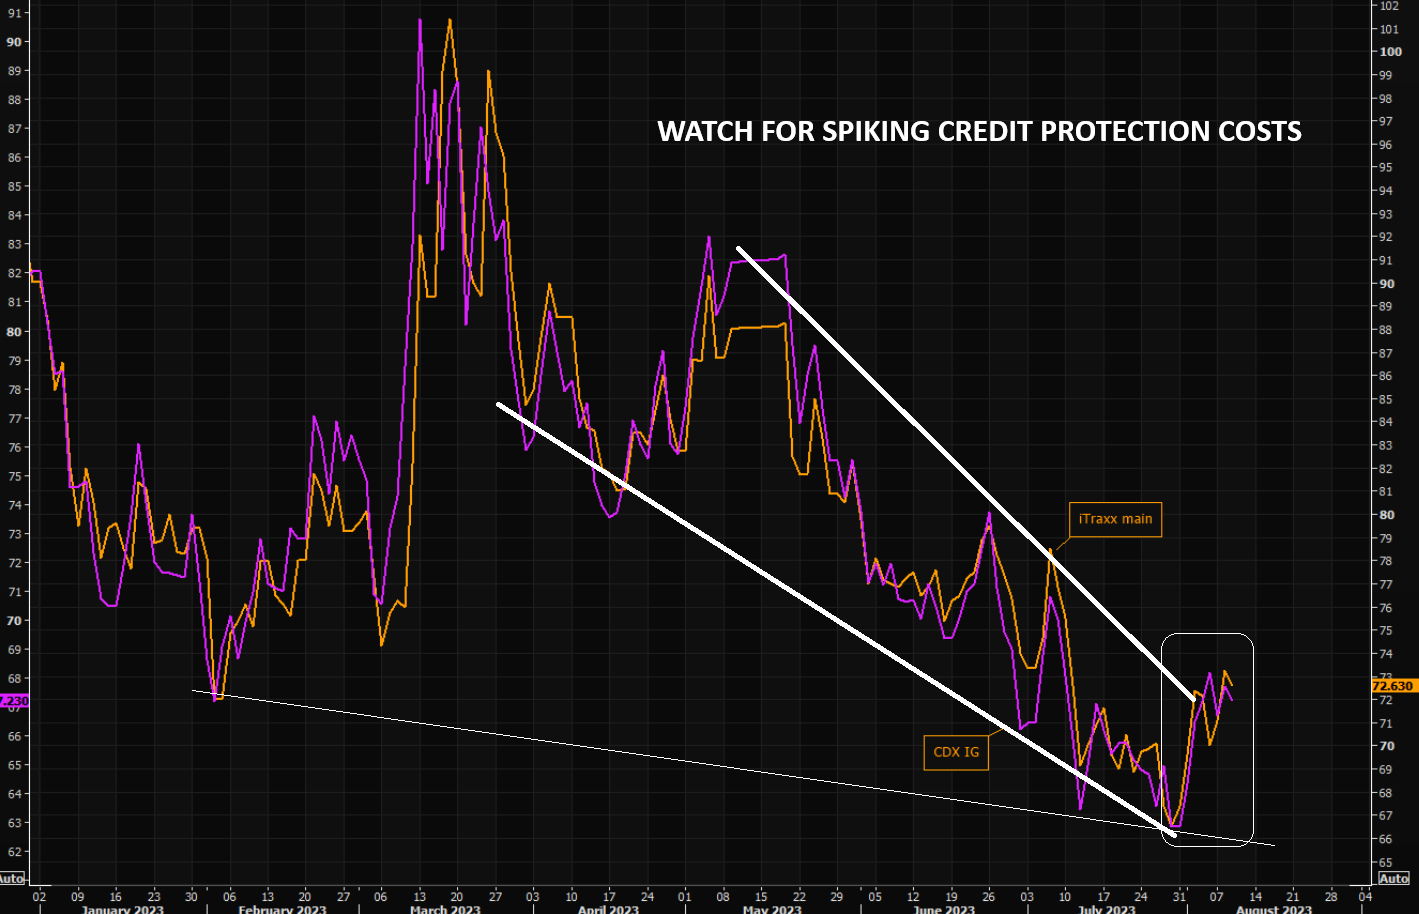
Nothing huge at the moment, but the move higher in credit protection so far in August has been rather big (Chart Below)!
| |
|
EARNINGS SEASON - Buy The rumor, Sell the News!
Beat rates YES. Earnings reactions NO
With 85% of the index having now reported results, the 78% beat rate is back well above trend and at its highest level in nearly 2Y.
That said, earnings reactions remain negative on average, no matter the surprise-type, a dynamic we haven’t seen since 2Q17.
| |
|
GLOBAL ECONOMIC REPORTING: What This Week's Key Global Economic Reports Tell Us
CHINA’s CPI
China's CPI printed negatively for the first time in two years which is likely to produce a deflationary impulse on core goods inflation.
US CPI
Both Goods and Services inflation (Y-o-Y) slowed in July - but Services remain extremely high at +6.1%.
The Fed will be watching its new favorite signal - Core Services CPI Ex-ShelterCore Services. CPI Ex-Shelter reaccelerated in July (+0.2% M-o-M, and from +3.9% to +4.0% Y-o-Y).
- Headline M/M rose by 0.2%, in line with expectations and the prior pace of 0.2%, while the Y/Y was cooler than expected at 3.2% (exp. 3.3%), but it did accelerate from the prior 3.0% pace.
- A similar story was seen in the core metrics, the M/M rose 0.2%, in line with the expected and prior 0.2% and the Y/Y rose by 4.7% vs the Refinitiv estimate of 4.8% but was cooler than the prior 4.8%.
- Looking into the release, the index for shelter was by far the largest contributor to the monthly all-items increase, accounting for over 90% of the increase, with the index for motor vehicle insurance also contributing.
- The food index increased 0.2% in July after increasing 0.1% in the previous month. The index for food at home increased 0.3% M/M while the index for food away from home rose 0.2%.
-
The energy index rose 0.1% in July as the major energy component indexes were mixed.
- Core services ex-rents rose 0.2% following an unchanged print in June, and warn of a "pop up" in the August metric. "The trend in core services CPI ex-rents has broadly tracked our re-adjusted version of the NFIB selling prices index, which clearly signals a further downshift".
US PPI
Sticky margins are thus one sign that inflation is becoming ingrained.
-
The PPI data was hotter than expected in July for the first time since the January report, at least for the headline M/M, which rose 0.3% (exp. 0.2%) and accelerated from the prior 0.0%, which was revised down from 0.1%.
- The Y/Y rose 0.8%, up from the prior 0.2% (revised up from 0.1%) and above the 0.7% forecast.
- The Core metrics, ex Food and Energy, rose 0.3% M/M from the prior -0.1% (revised from +0.1%) and above the 0.2% consensus. Core Y/Y saw a 2.4% gain, above the 2.3% forecast and unchanged from the prior 2.4%.
- Meanwhile, the super core metric, ex food, energy and trade, rose 0.2% above the expected and prior of 0.1%, while the Y/Y rose 2.7%, matching the prior month's pace, albeit it was revised up from 2.7%.
- Markets are pricing in rates at the terminal with a 35% chance of another 25bp hike in November, before being held until May where the first cut is being fully priced, although March is currently seen as a 50/50.
| |
|
CRITICAL TREASURY GENERAL ACCOUNT (TGA) AUCTION REFUNDING:
KEY TAKE AWAYS
- If the yield is good enough, buyers will emerge! With atractive Real Yields, US debt is priced to attract global investors.
- Attention focused on the 10yr and 30yr offerings which are parts of the curve where supply indigestion concerns weigh the largest.
-
The US has become completely dependent on Foreign buyers of its massive and growing US debt. Foreign buying is both larger in size and larger as a precentage of the overall sales. If real yields fall or the dollar begins to seriously weaken - watch out for a major global crisis event! It is coming .. the only question is when and what will be the catalyst?
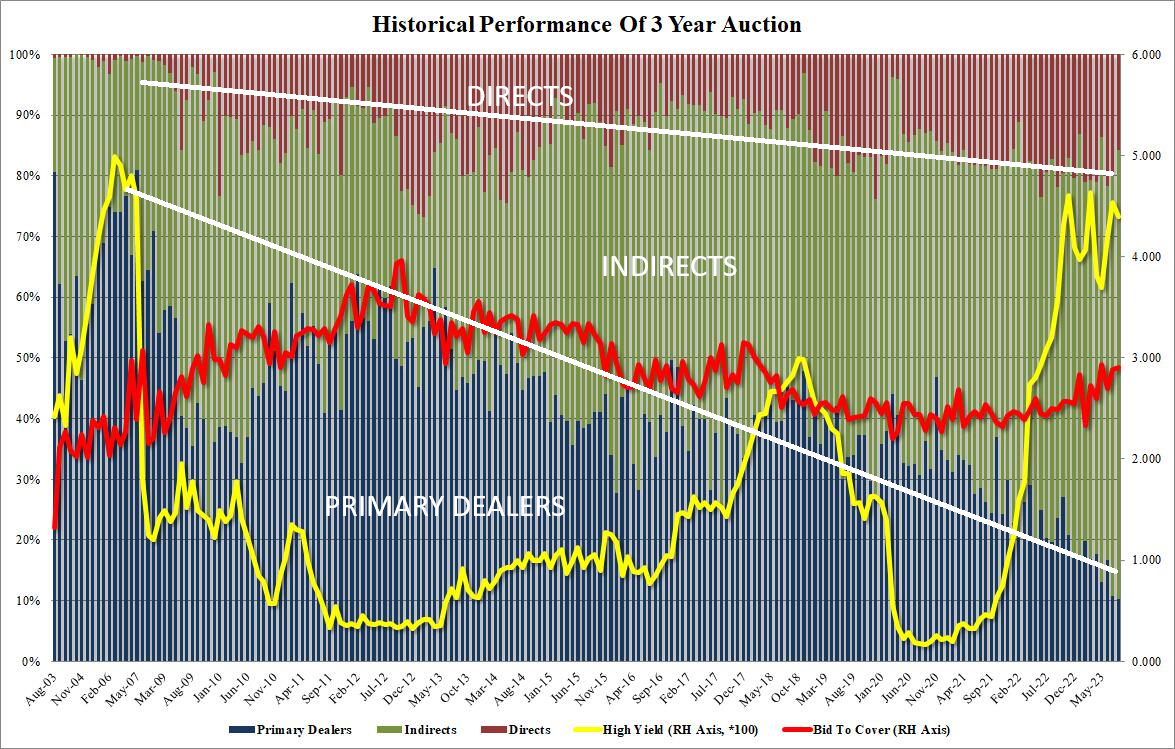
NOTE: "INDIRECTS" are primarily Foreign Buyers
| |
|
3YR AUCTION: USD 42bln of 3yr notes (prev. 40bln) on Aug 8th
Record high foreign buyers, record low dealers, a blowout, stopping through auction any way you look at it.
- A solid USD 42bln 3yr note auction from the Treasury, where the 4.398% high yield marked a chunky 1.8bp stop-through the WI, better than the prior 0.2bp stop-through and six-auction average 0.1bp tail.
- The 2.90x bid/cover ratio exceeded the prior (2.88x) and average (2.69x) too.
- The breakdown was equally as impressive with Dealers (forced surplus buyers) left with just 10.3% (prev. 10.8%; avg. 15.8%), thanks to a big step-up in Indirects participation to 74% from 69.4%, reflective of solid end-user demand, whilst Directs took a step back in participation.
| |
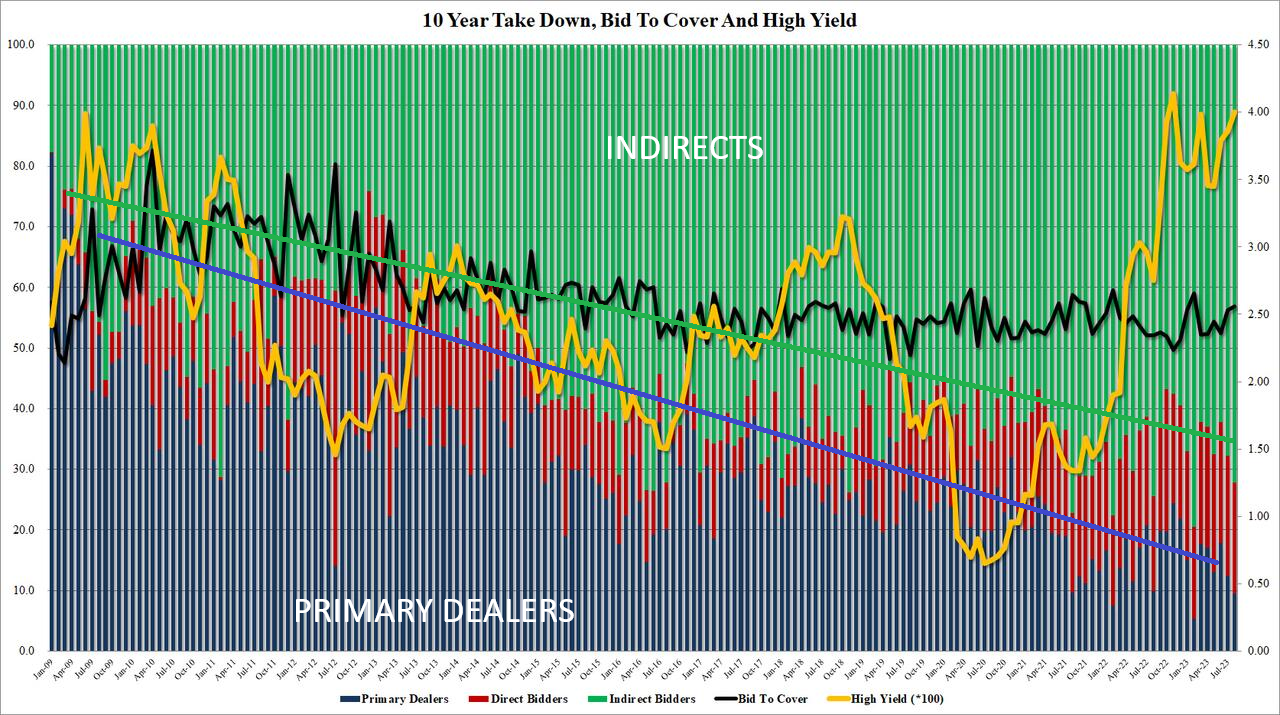
10YR AUCTION: USD 38bln of 10yr notes (prev. 35bln) on Aug 9th
Indirects awarded 72.2%, up sharply from the 67.7% last month, the most since February and well above the six-auction average of 67.0%.
- An impressive USD 38bln 10yr auction from the Treasury with a marginal 0.1bp tail for a stop of 3.999%, better than the prior tail of 1bp and six-auction avg. 0.8bp.
- The 2.56x bid/cover ratio was also better than the prior and average.
- The breakdown saw Dealers (forced surplus buyers) left with just 9.5% (prev. 12.4%; avg. 13.9%), and in a similar fashion to the 3yr auction on Tuesday, saw Indirects surge in demand (72.2% from 67.7%; avg. 67%) and a marginal decline in Directs (18.3% from 19.9%; avg. 19.1%).
- The strong demand reception comes despite being on the eve of the July CPI figures and should rest some.
| |
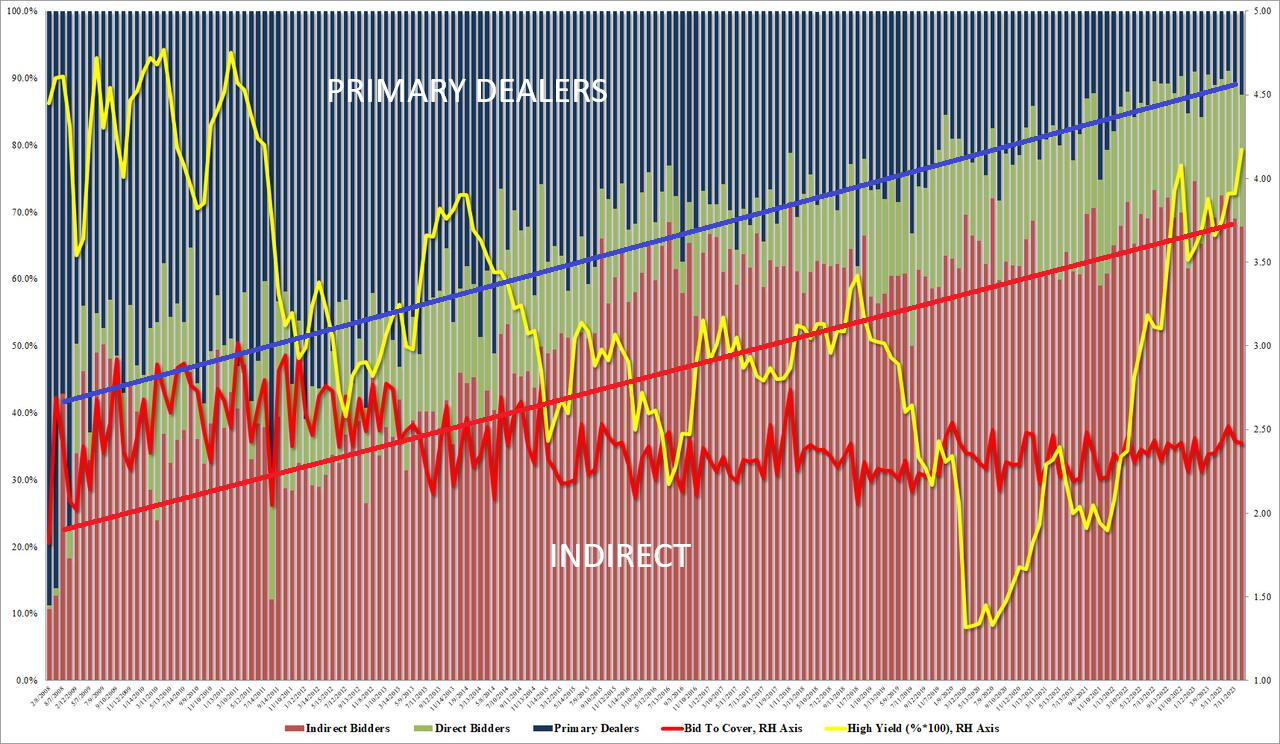
30YR AUCTION: USD 23bln of 30yr bonds (prev. 21bln) on Aug 10th
Not great, not terrible. With much trepidation ahead of refunding week following some dire forecasts about a deluge Treasury supply in the coming quarter, the Treasury sold the last coupon auction of the week when it placed $23BN in 30Y paper in willing hands and while the sky did not fall, the auction was clearly the ugliest of the lot.
Stopping at a high yield of 4.189%, the 30Y auction priced at the highest yield since July 2011, and was well above last month's 3.910%. It also tailed the 'When' Issued 4.175% by 1.4bps, the highest tail since February. The bid to cover was 2.42, the lowest since April and below the 6-auction average of 2.39.
The internals were also subpar, with Indirects awarded just 67.8%, the lowest since February. And with Directs awarded 19.6%, left Dealers holding 12.5%, the most since February. Overall, a subpar, ugly auction, if hardly catastrophic and certainly not only to send any shockwaves into he market where the 10Y has barely budged.
- A lacklustre USD 32bln, 30yr new issue auction from the Treasury, with the highest yielding stop of the cycle, 4.189%, still tailing 1.4bps, which is better than last month's 2bp tail but worse than the six-auction average 0.5bps for the largest 30yr auction since February 2022.
- Thus, the auction failed to buck the trend of 30yr refundings tailing, where BMO highlights 13 of the last 17, having done so by an average of 1.6bps.
- The bid/cover ratio of 2.42x was similar to the prior 2.43x and average 2.39x. The breakdown was disappointing.
- Dealers (forced surplus buyers) were left with a sizeable 12.5% (prev. 10.9%; avg. 11.1%), with both Directs and Indirects taking smaller shares than July's offering.
| |
|
GLOBAL MACRO
WHAT DOES YOUR SCAN OF THE DATA BELOW TELL YOU? - THE MEDIA AVOIDS BAD NEWS!
We present the data in a way you can quickly see what is happening.
THIS WEEK WE SAW
Exp=Expectations, Rev=Revision, Prev=Previous
| |
|
UNITED STATES
- US Consumer Credit (Jun) 17.85B vs. Exp. 13.0B (Prev. 7.24B)
- Manheim July used-vehicle price index fell 1.6% M/M (prev. -4.2%) and fell 11.6% Y/Y (prev. -10.3%).
- US Consumer Credit (Jun) 17.9B vs. Exp. 13.0B (Prev. 7.2B)
- US NFIB Business Optimism Index (Jul 2023) 91.9 (Prev. 91.0)
- US Wholesale Sales MM (Jun) -0.7% vs. Exp. 0.1% (Prev. -0.2%)
- US Wholesale Inventories MM (Jun) -0.5% vs. Exp. -0.3% (Prev. -0.3%)
- US International Trade (USD)(Jun) -65.5B vs. Exp. -65.0B (Prev. -69.0B)
- US CPI YY (Jul) 3.2% vs. Exp. 3.3% (Prev. 3.0%)
- US Core CPI YY (Jul) 4.7% vs. Exp. 4.8% (Prev. 4.8%)
- US Cleveland Fed CPI (Jul) 0.2% (Prev. 0.4%)
- US Initial Jobless Claims (W 05 Aug) 248k vs. Exp. 230k (Prev. 227k)
- US Continued Jobless Claims (W 29 Jul) 1.68M vs. Exp. 1.71M (Prev. 1.70M)
CHINA
- Composite PMI (Jul) 51.9 (Prev. 52.5)
- Chinese Trade Balance (USD)(Jul) 80.6B vs. Exp. 70.6B (Prev. 70.6B)
- Chinese Exports YY (Jul) -14.5% vs. Exp. -12.5% (Prev. -12.4%)
- Chinese Imports YY (Jul) -12.4% vs. Exp. -5.0% (Prev. -6.8%)
- Chinese Trade Balance (CNY)(Jul) 575.7B (Prev. 491.3B)
- Chinese Exports YY (CNY)(Jul) -9.2% (Prev. -8.3%)
- Chinese Imports YY (CNY)(Jul) -6.9% (Prev. -2.6%)
- Chinese Trade Balance (USD)(Jul) 80.6B vs. Exp. 70.6B (Prev. 70.6B)
- Chinese Exports YY (Jul) -14.5% vs. Exp. -12.5% (Prev. -12.4%); Imports YY (Jul) -12.4% vs. Exp. -5.0% (Prev. -6.8%)
- Chinese Trade Balance (CNY)(Jul) 575.7B (Prev. 491.3B)
- Chinese Exports YY (CNY)(Jul) -9.2% (Prev. -8.3%); Imports YY (CNY)(Jul) -6.9% (Prev. -2.6%)
- Chinese CPI MM (Jul) 0.2% vs. Exp. -0.1% (Prev. -0.2%)
- Chinese CPI YY (Jul) -0.3% vs. Exp. -0.4% (Prev. 0.0%)
- Chinese PPI YY (Jul) -4.4% vs. Exp. -4.1% (Prev. -5.4%)
JAPAN
- Japanese Overall Labour Cash Earnings (Jun) 2.3% vs. Exp. 3.0% (Prev. 2.5%)
- Japanese All Household Spending MM (Jun 2023) 0.9% vs. Exp. 0.3% (Prev. -1.1%)
- Japanese All Household Spending YY (Jun 2023) -4.2% vs. Exp. -4.1% (Prev. -4.0%)
- Japanese Overall Labour Cash Earnings (Jun) 2.3% vs. Exp. 3.0% (Prev. 2.5%)
- Japanese All Household Spending MM (Jun 2023) 0.9% vs. Exp. 0.3% (Prev. -1.1%); YY (Jun 2023) -4.2% vs. Exp. -4.1% (Prev. -4.0%)
- Japanese PPI MM (Jul) 0.1% vs. Exp. 0.2% (Prev. -0.2%)
- Japanese PPI YY (Jul) 3.6% vs. Exp. 3.5% (Prev. 4.1%)
| |  |
|
EU
- EU Sentix Index (Aug) -18.9 vs. Exp. -24.3 (Prev. -22.5)
- ECB Consumer Inflation Expectations survey (Jun) - 12-months ahead 3.4% (prev. 3.9%); 3-year ahead 2.3% (prev. 2.5%)
- ECB Consumer Inflation Expectations survey (Jun) showed the 12-month ahead view was at 3.4% (prev. 3.9%) and the 3-year ahead view was at 2.3% (prev. 2.5%).
GERMANY
- German HICP Final MM (Jul 0.5% vs. Exp. 0.5% (Prev. 0.5%)
- German HICP Final YY (Jul) 6.5% vs. Exp. 6.5% (Prev. 6.5%)
- German CPI Final MM (Jul 2023) 0.3% vs. Exp. 0.3% (Prev. 0.3%)
- German CPI Final YY (Jul 2023) 6.2% vs. Exp. 6.2% (Prev. 6.2%)
UK
- UK BRC Total Sales YY (Jul) 1.5% (Prev. 4.9%)
- UK BRC Retail Sales YY (Jul 2023) 1.8% (Prev. 4.2%)
- UK BRC Total Sales YY (Jul) 1.5% (Prev. 4.9%); Retail Sales YY (Jul 2023) 1.8% (Prev. 4.2%)
- UK BBA Mortgage Rate (Jul 2023) 7.68% (Prev. 7.54%)
- UK RICS Housing Survey (Jul) -53 vs. Exp. -50 (Prev. -46, Rev. -48)
NEW ZEALAND
- New Zealand 1yr Inflation Expectations (Q3) 4.2% (Prev. 4.3%)
- New Zealand 2yr Inflation Expectations (Q3) 2.83% (Prev. 2.79%)
- New Zealand Manufacturing PMI (Jul) 46.3 (Prev. 47.5)
- New Zealand Food Price Index MM (Jul) -0.5% (Prev. 1.6%)
AUSTRALIAN
- Australian Westpac Consumer Confidence Index (Aug) 81.0 (Prev. 81.3)
- Australian Consumer Sentiment (Aug 2023) -0.4% (Prev. 2.7%)
- Australian NAB Business Confidence (Jul) 2.0 (Prev. 0.0, Rev. -1.0)
- Australian NAB Business Conditions (Jul) 10.0 (Prev. 9.0, Rev. 11.0)
- Australian Westpac Consumer Confidence Index (Aug) 81.0 (Prev. 81.3); Sentiment (Aug 2023) -0.4% (Prev. 2.7%)
- Australian NAB Business Confidence (Jul) 2.0 (Prev. 0.0, Rev. -1.0); Conditions (Jul) 10.0 (Prev. 9.0, Rev. 11.0)
SINGAPORE
- Singapore GDP QQ (Q2 F) 0.1% vs Exp. 0.3% (Prev. -0.4%)
- Singapore GDP YY (Q2 F) 0.5% vs Exp. 0.7% (Prev. 0.4%)
| |
|
CONCLUSION
With Lending tightening and Bank Balance Sheets shrinking, this has historically meant Liquidity would be shrinking. However, today with massive Bidenonomic spending occurring, Covid Forbearance still underway for Student Loans, Covid Savings still not all spent, as well as Financial Institutions with capital avaiable for placement, the US economy has yet to feel the real pain of coordinated central bank balance sheet reduction actions.
However, central bank actions can be expected to prevail over time.
HEADLINES YOU MAY HAVE MISSED:
-
"Another Recession Signal: Plunge In Demand For Gold In The Electronics Sector" The big drop in demand for gold in the technology sector was driven by weak consumer spending on electronics.
-
"SoCal Warehouse Slump: A Potential Warning Sign For Broader Economy" SoCal is the canary in the coal mine for the US industrial market to some extent.
-
The Collapse Of The EV SPACs: Another One Goes Bankrupt, Others On The Verge The SPAC boom will surely go down in history as one of the biggest stock-market heists ever, made possible by Consensual Hallucination...
| |
CURRENT MARKET PERSPECTIVE | |
|
MARKET WEAKNESS - CONSOLIDATION OR CORRECTION?
TECHNOLOGY, BANKS & FINANCIALS ALL APPEAR TIRED
Click All Charts to Enlarge
1- SITUATIONAL ANALYSIS
| |
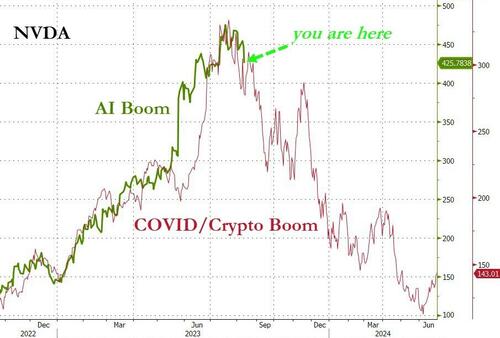
TECHNOLOGY, BANKING & FINANCIALS ALL WEAKENING
NVDA is back at one-month lows, down over 12% from the highs in mid-July. NVDA was the big loser, down over 8% on the week. This is its biggest weekly loss since September 2022... but right on schedule when compared against the Covid/Crypto Boom ... See chart right ->
For the first time since December, the NASDAQ is down for two straight weeks as the smell of fear wafts across the AI-bubble-buyers. The Dow managed gains on the week, but S&P and Small Caps joined big tech in the red for the week.
Most Shorted stocks tumbled for the 2nd straight week, as all squeeze attempts were foiled by selling pressure as the index shifted to negative gamma. In fact, the most-shorted basket is down for 8 of the last 9 days.
Treasury yields were up across the curve with the belly underperforming. However, extending that a little, we see that bonds have basically round tripped from before last Friday's payrolls. The dollar ended higher on the week, as CPI/PPI sparked USD-buying, erasing the post-payrolls drop. Gold and Silver were the week's biggest losers in commodity-land as NatGas soared. Crude was flat and copper slightly lower.
| |
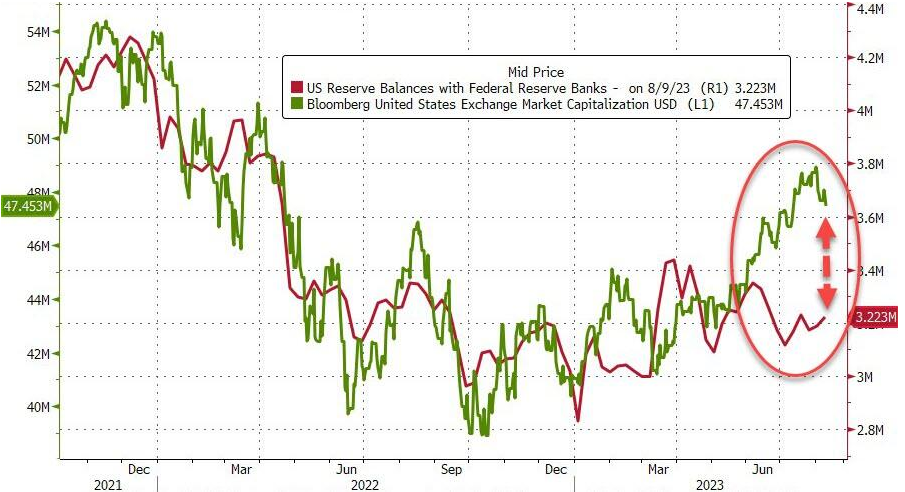
CHART RIGHT:
US equities continue to be divergent from Fed Bank Reserves.
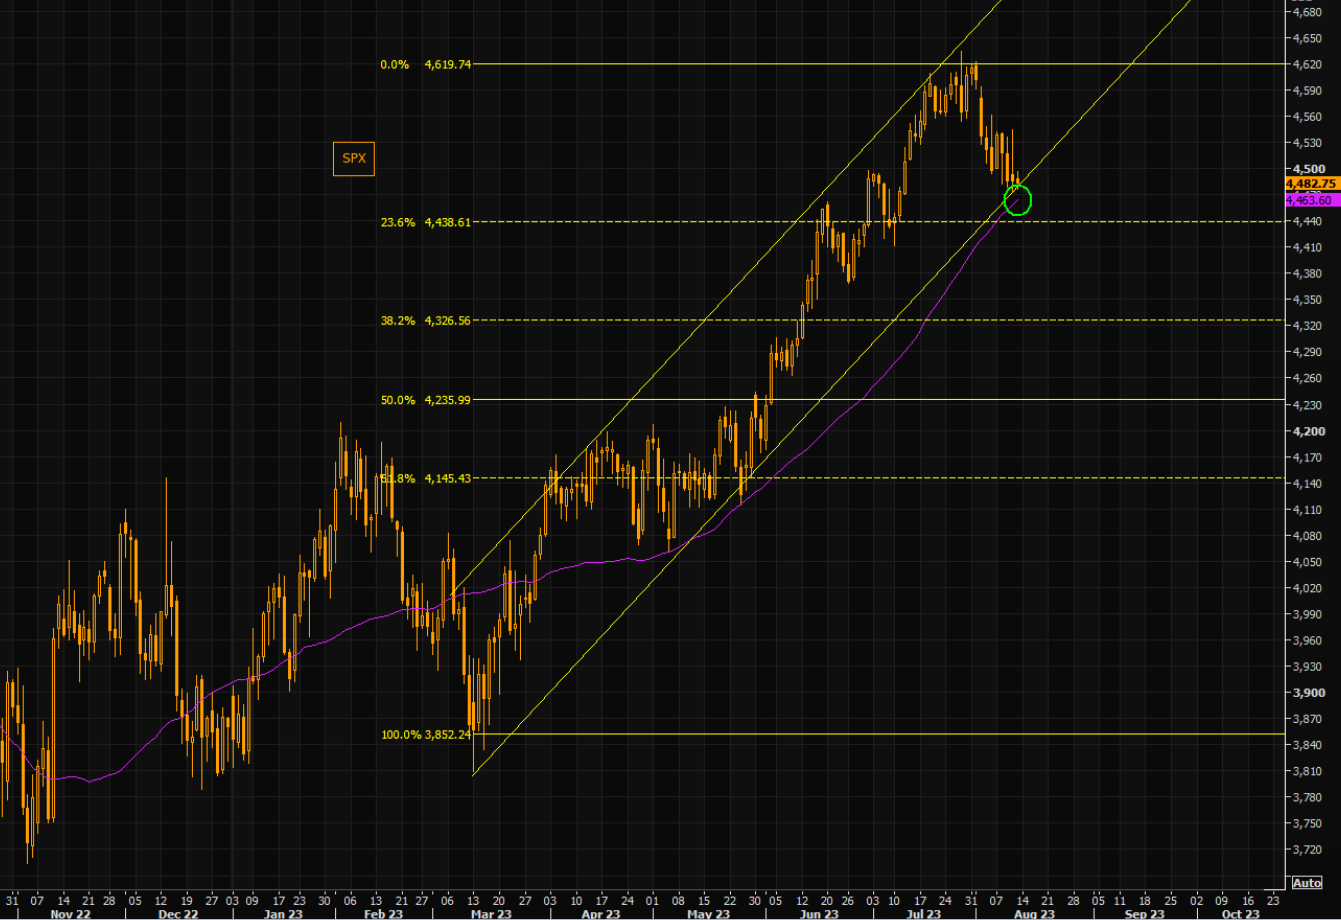
CHART BELOW:
The SPX is closing in on the big 4450 support area, the lower part of the channel and the 50 day moving average. Note the bigger Fibo levels as well.
|  | |
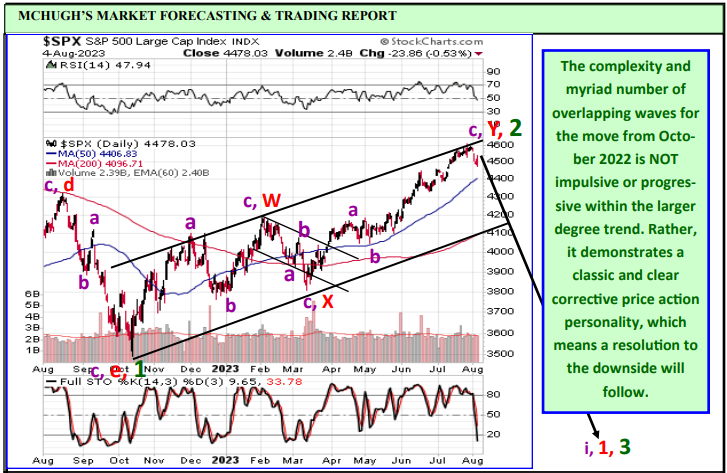
2- TECHNICAL ANALYSIS
Note: The Elliott Wave Count used below is that of MATASII.com for the WTIC CFD's, but those counts are labeled within the larger construct developed by the widely followed Dr. Robert McHugh's Technical Indicator Index (CHART RIGHT).
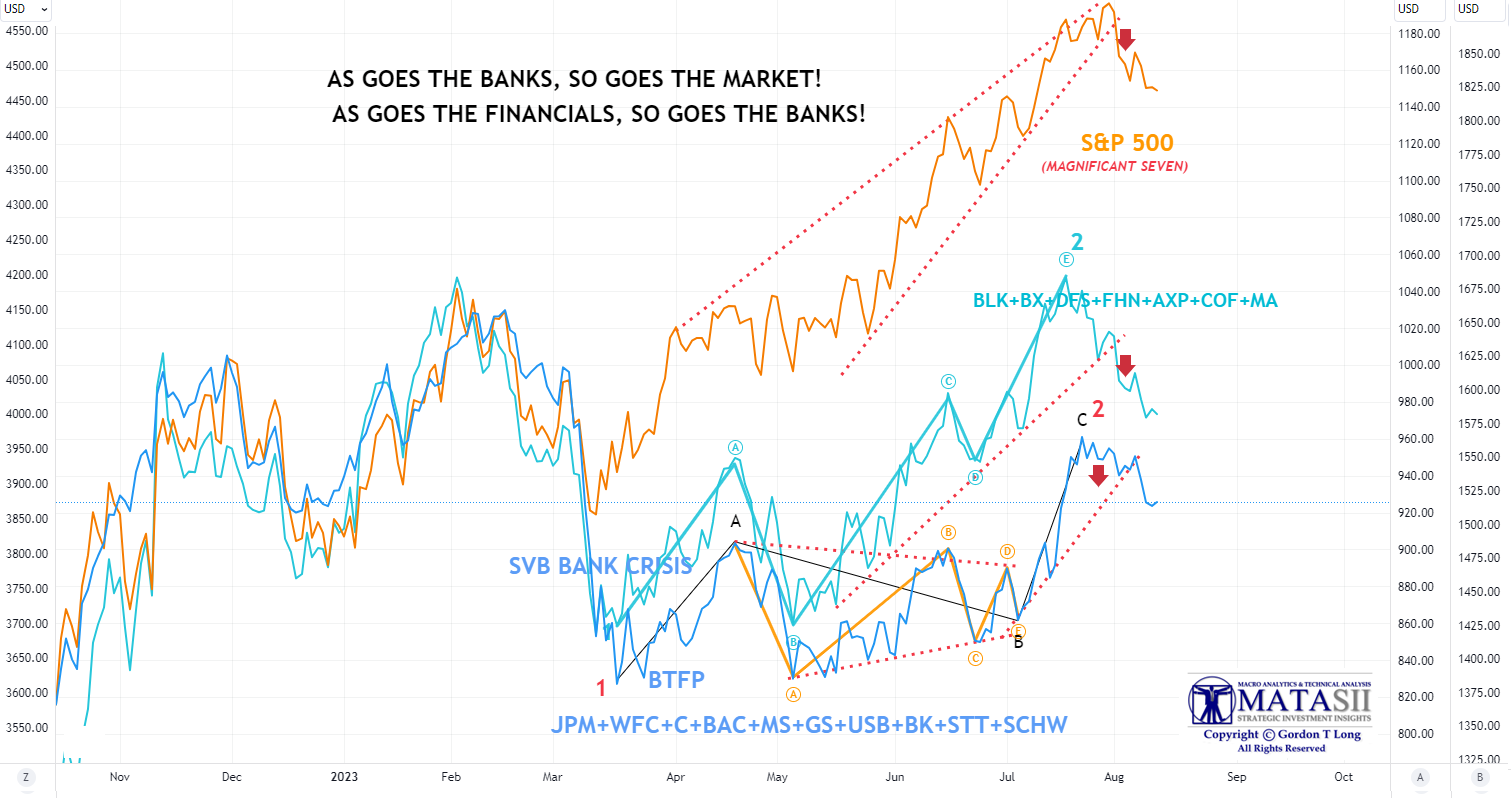
S&P 500 COUNT
The chart below has been updated since we highlighted it during the height of the Q2 earnings. It features the charts for the representative companies earnings of two sectors and the overall S&P 500 we featured. The three takeaways from the chart are:
- All stocks have headed lower since their earnings were announced, even though their earnings were all "beats" or inline with "expectations". It was a classic "Buy the Rumor, Sell the News" in earnings season we haven't seen for awhile.
- Once the dotted vertical lines were broken the downward momentum only accelerated.
- Though the EW counts are different for all three, they all point to lower consolidation levels (or worse).
| |
|
YOUR DESK TOP / TABLET / PHONE ANNOTATED CHART
Macro Analytics Chart Above: SUBSCRIBER LINK
| |
|
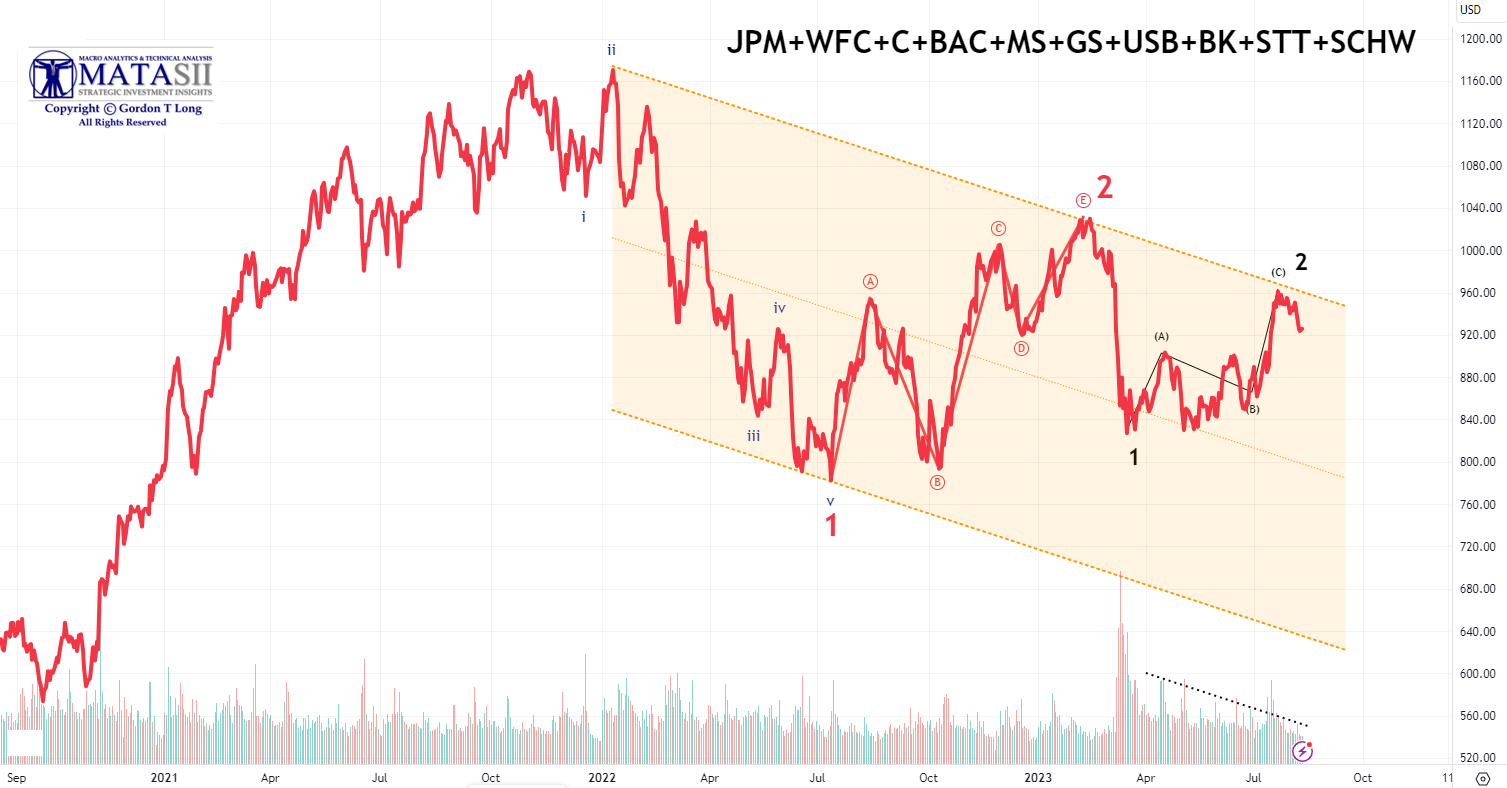
BANK STOCKS
We expanded the time frames for the above set of Banking Stocks to place the current activity into a larger perspective. The earnings season activity fits within a downward trend channel. The channel suggested that it was going
to be a "Sell on the News" event unless the earnings were shockingly major "beats". The market appears to have been waiting for the earnings season to take out the highs and inflict maximum pain to over exuberant market participants.
| |
|
YOUR DESK TOP / TABLET / PHONE ANNOTATED CHART
Macro Analytics Chart Above: SUBSCRIBER LINK
| |
|
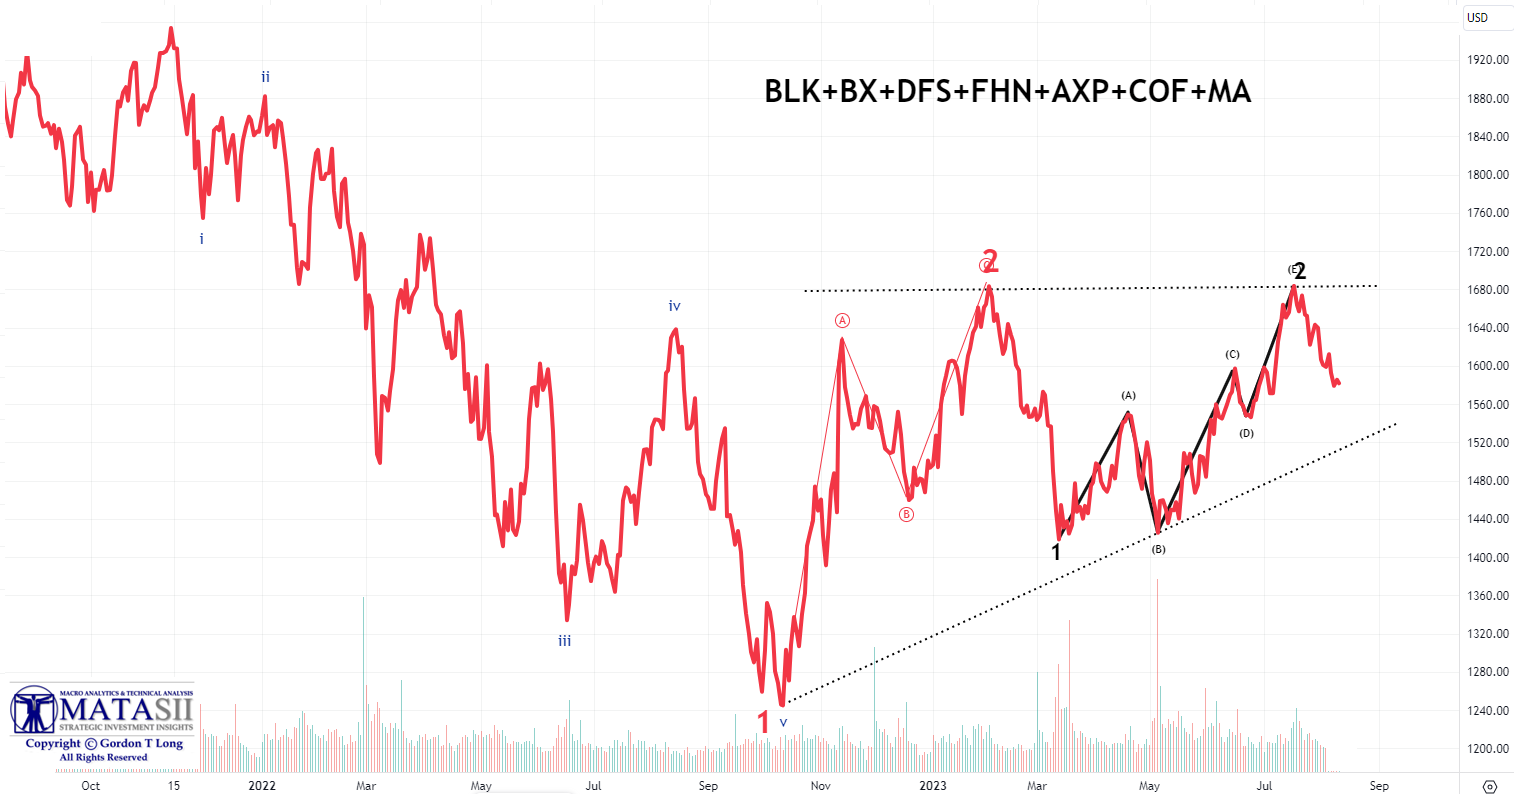
FINANCIAL STOCKS
We also expanded the time frames for the set of financial stocks highlighted during earnings season to place the current activity into a larger perspective. We see that the larger degree also shows a 1-2 EW count. The Financial Stocks appear to be "coiling", which normally leads to lower prices.
Watch this chart closely for a break of the lower dotted trend line. It will be a tell for the overall markets.
| |
|
YOUR DESK TOP / TABLET / PHONE ANNOTATED CHART
Macro Analytics Chart Above: SUBSCRIBER LINK
| |
|
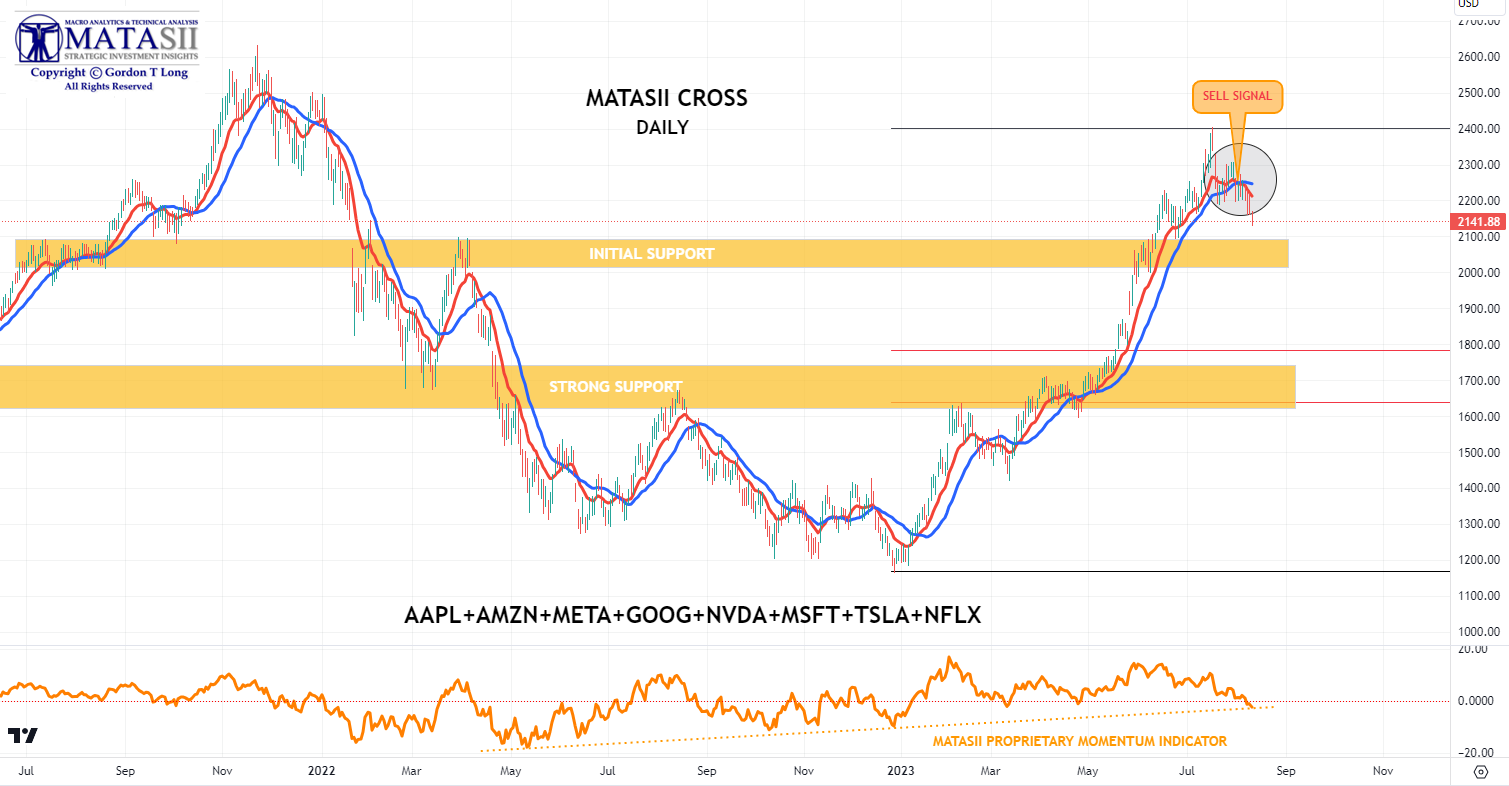
MATASII CROSS - DAILY
The Daily proprietary MATASII CROSS is now signaling a SELL. The weekly is still a BUY, so we need to see how well the lower support area holds to determine whether the Weekly signal confirms further lower prices.
| |
|
NOTICE Information on these pages contains forward-looking statements that involve risks and uncertainties. Markets and instruments profiled on this page are for informational purposes only and should not in any way come across as a recommendation to buy or sell in these assets. You should do your own thorough research before making any investment decisions. MATASII.com does not in any way guarantee that this information is free from mistakes, errors, or material misstatements. It also does not guarantee that this information is of a timely nature. Investing in Open Markets involves a great deal of risk, including the loss of all or a portion of your investment, as well as emotional distress. All risks, losses and costs associated with investing, including total loss of principal, are your responsibility.
FAIR USE NOTICE This site contains copyrighted material the use of which has not always been specifically authorized by the copyright owner. We are making such material available in our efforts to advance understanding of environmental, political, human rights, economic, democracy, scientific, and social justice issues, etc. We believe this constitutes a ‘fair use’ of any such copyrighted material as provided for in section 107 of the US Copyright Law. In accordance with Title 17 U.S.C. Section 107, the material on this site is distributed without profit to those who have expressed a prior interest in receiving the included information for research and educational purposes. If you wish to use copyrighted material from this site for purposes of your own that go beyond ‘fair use’, you must obtain permission from the copyright owner.
========
| |
MATASII'S STRATEGIC INVESTMENT INSIGHTS | |
2020 VIDEOS OUTLINING THE COMING RISE IN INFLATION & COMMODITY PRICES | |
|
RELEASED - 08-09-23
VIDEO: 17 Minutes with 43 supporting slides.
| |
IDENTIFICATION OF HIGH PROBABILITY TARGET ZONES | |
Learn the HPTZ Methodology!
Identify areas of High Probability for market movements
Set up your charts with accurate Market Road Maps
Available at Amazon.com
| |
The Most Insightful Macro Analytics On The Web | | | | |