|
Gordon T Long Research exclusively distributed at MATASII.com
Subscribe to Gordon T Long Research - $35 / Month - LINK
Complete MATASII.com Offerings - $55/Month - LINK
SEND YOUR INSIGHTFUL COMMENTS - WE READ THEM ALL - lcmgroupe2@comcast.net
| |
|
LONGWave - MARCH 2024
Technical Analysis - 03/25/24
| |
BIG WEEK FOR CENTRAL BANKS
OBSERVATIONS: PONZI & MADOFF WERE ONLY NIBBLING AT THE REALLY BIG GAME TO PLAY!
Through the hidden tax of inflation, your income and savings are silently being confiscated by Washington, D.C. That is because the Federal Reserve creates money for the government to spend, that siphons off some of the value of all the dollars already in existence and transfers the purchasing power to the newly created money, now in the hands of bureaucrats. The lost purchasing power is a real tax, and it has cost the public about 18% of all their savings and incomes in just the last three years.
IT IS ALL QUITE SIMPLE:
- He who spends it first gets the full value (government spending of taxes and debt borrowing) . He who receives it later as it flows through the economy (you) get less as inflation erodes its purchasing power. Think of it as the "float" which banks siphon out of the time value of money flows.
- The government by never paying off the Debt the debt it borrowed is effectively operating a Ponzi scheme where new money pays for the debt that is long gone and is effectively "indistinguishable".
- The hope for the operators of the scheme (government) is that the US debt will be eroded by Inflation (lenders lose from inflation since borrowers pay the money back in inflated dollars). However, the government receives future taxes in higher nominal terms.
- Like a Ponzi scheme it works until the lenders demand their money back (sell their US Treasuries). That is already beginning with major buyers (China) now reducing their US Treasury holdings and "De-Dollarization" (BRICS).
Like a Ponzi scheme, when #4 above occurs the solution is to find new buyers or in the case of governments print the money (Treasury issues more debt and the Fed buys it from the money center banks as QE).
All of this is why those wondering why they can’t afford to buy a home, need to look no further than today’s record-high home prices and a mortgage interest rate that is 2 1/2 times higher than it was three years ago. Both consequences stem from the government spending too much money, and they’ve combined to increase the cost of homeownership by almost 80%.
The cost to service the federal debt already consumes 40% of all personal income taxes, the largest source of revenue for the government.
It’s sobering to look at your pay stub and realize that 40 cents of every dollar you lose in federal income taxes is now needed just to pay interest. ====>
| |
|
VIDEO PREVIEW (click image)
Pay-Per-View Page Link
|  | |
THIS WEEK WE SAW
Exp=Expectations, Rev=Revision, Prev=Previous
US
US NAHB Housing Market Index (Mar) 51.0 vs. Exp. 48.0 (Prev. 48.0)
US Housing Starts Number (Feb) 1.521M vs. Exp. 1.425M (Prev. 1.331M, Rev. 1.374M)
US Building Permits Number (Feb) 1.518M vs. Exp. 1.495M (Prev. 1.489M)
US S&P Global Manufacturing PMI Flash (Mar) 52.5 vs. Exp. 51.7 (Prev. 52.2)
US S&P Global Services PMI Flash (Mar) 51.7 vs. Exp. 52.0 (Prev. 52.3)
US S&P Global Composite Flash PMI (Mar) 52.2 (Prev. 52.5)
US Leading Index Change MM (Feb) 0.1% vs. Exp. -0.2% (Prev. -0.4%)
US Philly Fed Business Index (Mar) 3.2 vs. Exp. -2.3 (Prev. 5.2)
US Existing Home Sales (Feb) 4.38M vs. Exp. 3.94M (Prev. 4.0M)
US Initial Jobless Claims 210k vs. Exp. 215k (Prev. 209k, Rev. 212k)
US Continued Jobless Claims 1.807M vs. Exp. 1.820M (Prev. 1.811M, Rev. 1.803M)
===> The Ponzi scheme will go on until the growth in the Fed's Balance sheet makes the US Dollar's purchasing power so low that few will be willing to hold assets denominated in it. That level of Balance sheet holding may be smaller than many yet appreciate!
| |
========================= | |
|
WHAT YOU NEED TO KNOW!
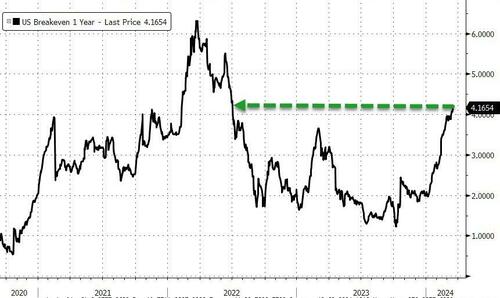
INFLATION BREAKEVENS HAVE BEGUN TO SOAR
The US is now running a 6.5% deficit with:
-
UNEMPLOYMENT: Near "historical lows" - a previously unheard of event.
-
GDP: Having increased by 2.5% and no where near contraction,
-
GOVERNMENT SPENDING: Calling for an increase to $7.2T in the 2025 proposed budget.
-
INFLATION: Being fought by the Fed with the Fed Funds Rate at 5.25-5.50%
-
FINANCIAL CONDITIONS :Being at 'easing' near levels seen before the Fed began raising rates.
We have a War Time Spending plan in Peace Time. Is it any wonder that Inflation Breakevens are rising while the Fed "claims" to be fighting inflation?
RESEARCH
WHAT WE CAN LEARN FROM PRIOR HISTORICAL MARKET SURGES
-
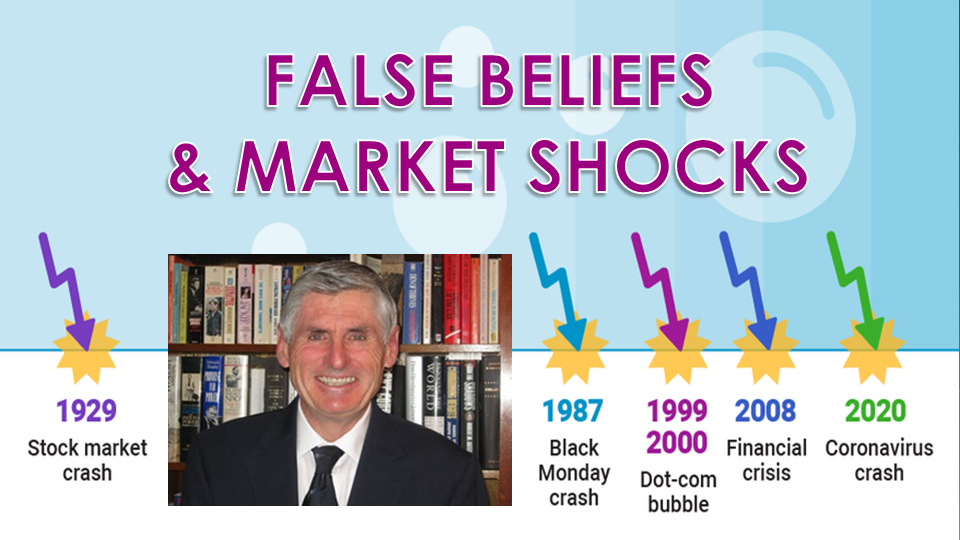
The ongoing "Irrational Exuberance" of the equity markets makes it worth further examining past instances of significant similar market rallies, such as those of 1928, 1987, and 1999.
- While recent market gains may be encouraging, it is crucial to remain cautious and consider the broader economic indicators.
-
The strength of the job market brings a sense of confidence, but warning signs from declining leading indicators warrant attention.
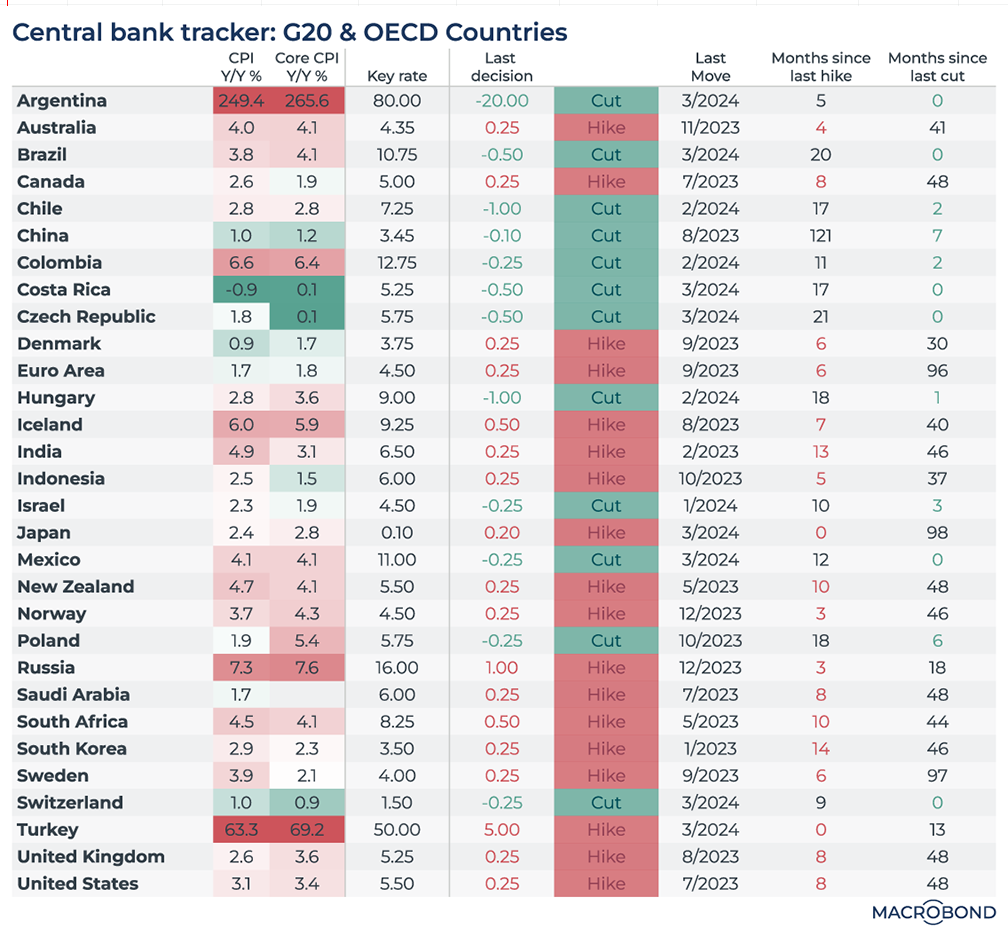
BIG WEEK FOR CENTRAL BANKS
- Markets reading of central bank meeting is they are settling on June as the month for central bank cuts.
- BOE: As expected, the MPC once again opted to stand pat on rates at 5.25%.
- The ECB seems to be in the most comfortable position – inflation is gradually falling and growth remains in stagnation territory. Markets are pricing in an 87% probability for a cut in June and around 90bp of cuts for the year.
| |
|
DEVELOPMENTS TO WATCH
BOJ - MAJOR MONETARY POLICY CHANGE:
- BoJ changed its monetary policy framework in which it ended negative interest rate policy and abandoned YCC, while it will guide the overnight call rate in the range of 0%-0.1% and apply 0.1% interest to all excess reserves parked at the central bank.
- BoJ also announced to end ETF and J-REIT purchases, as well as gradually reduce the amount of purchases of commercial paper and corporate bonds whereby it will discontinue purchases of CP and corporate bonds in about one year.
FOMC - MARCH 2024
- FOMC held rates at 5.25-5.50%, as expected, while the statement was little changed in which it noted that job gains have remained strong (prev. said job gains have moderated since early last year but remain strong).
- Repeated that recent indicators suggest that economic activity has been expanding at a solid pace.
- FOMC maintained the current pace of the balance sheet drawdown and it still sees three cuts this year but the 2025 projection was increased to 3.75-4.00% (prev. 3.50-3.75%) and 2026 was increased to 3.00-3.25% (prev. 2.75-3.00%), while the Neutral Rate estimate was raised to 2.6% (prev. 2.5%).
| |
|
GLOBAL ECONOMIC REPORTING
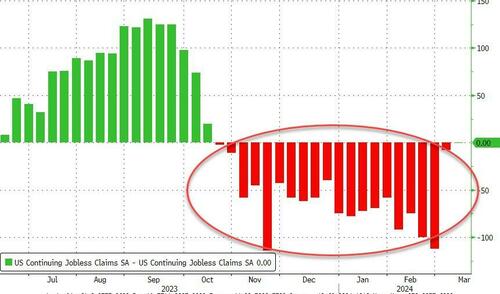
- CONTINUOUS JOBLESS CLAIMS
-
Continuing Claims saw another downward revision for last week. That is the 20th straight weekly downward revision of continuing claims.
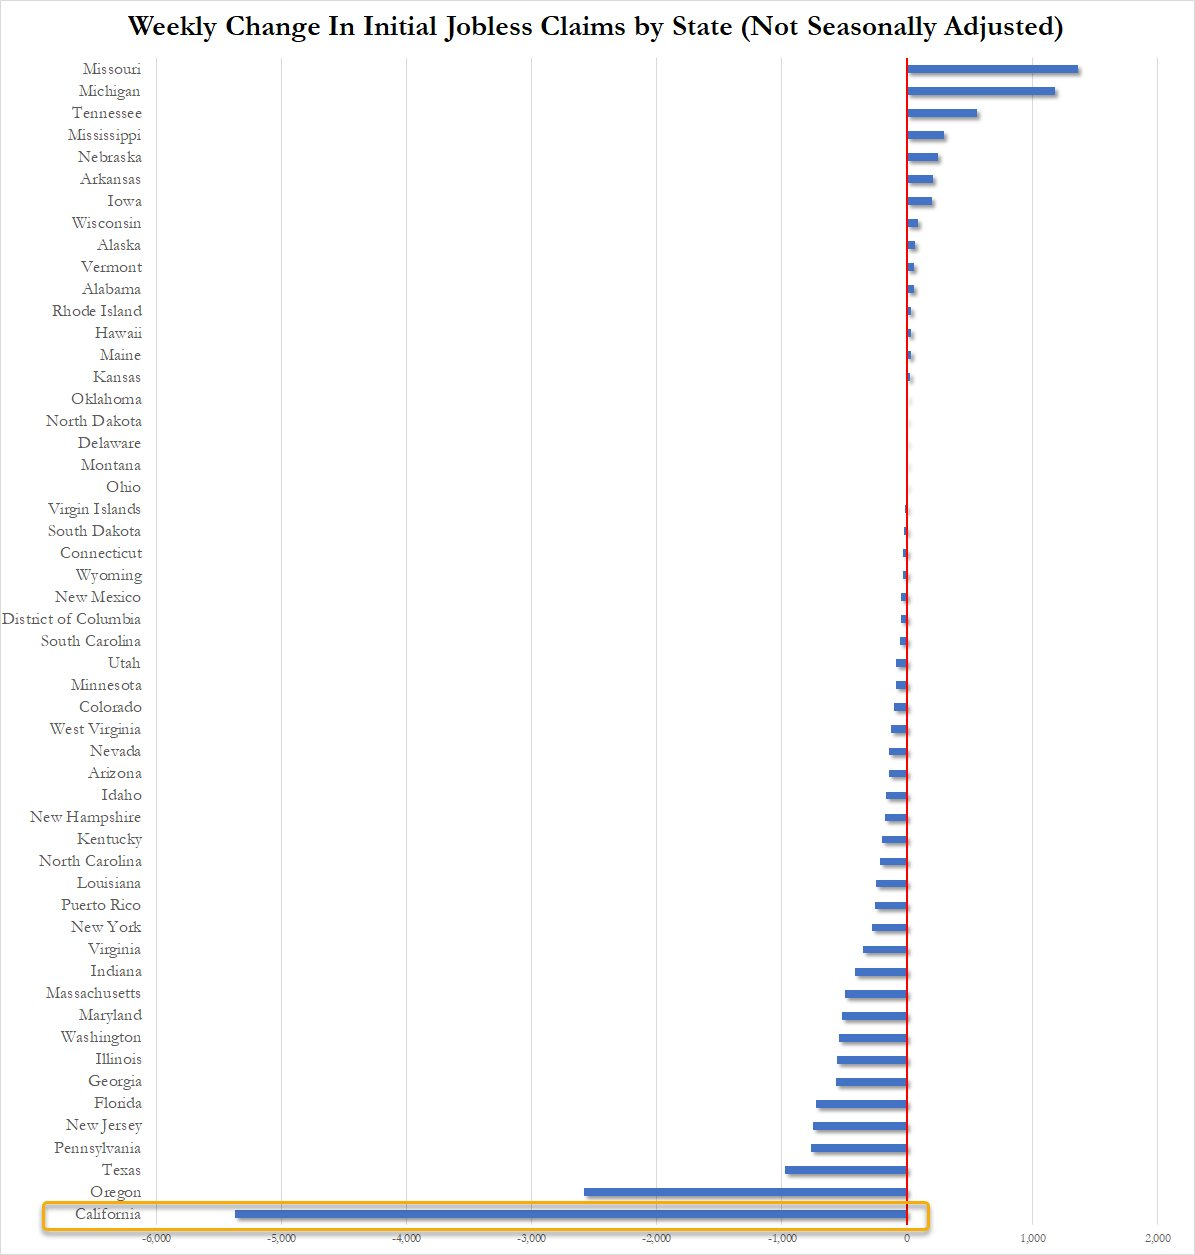
- Jobless claims continue to blow it out of the ballpark... until you realize that it's the most "credible" of states that are behind the blowout numbers: last week, NY, this week CA
- If you doubt the accuracy of the Biden admin's data, here's what the most recent FOMC Minutes said:
"While the recent trends prior to the meeting had been remarkably positive, Fed officials judged that some of the recent improvement “reflected idiosyncratic movements in a few series.”
- Even they aren't buying it, and neither should you!
| |
|
In this week's expanded "Current Market Perspectives", we focus on Corporate Buybacks and where the US Dollar is likely headed. What might that mean for US Equities in an election year?
=========
| |
|
WHAT WE CAN LEARN FROM PRIOR HISTORICAL MARKET SURGES
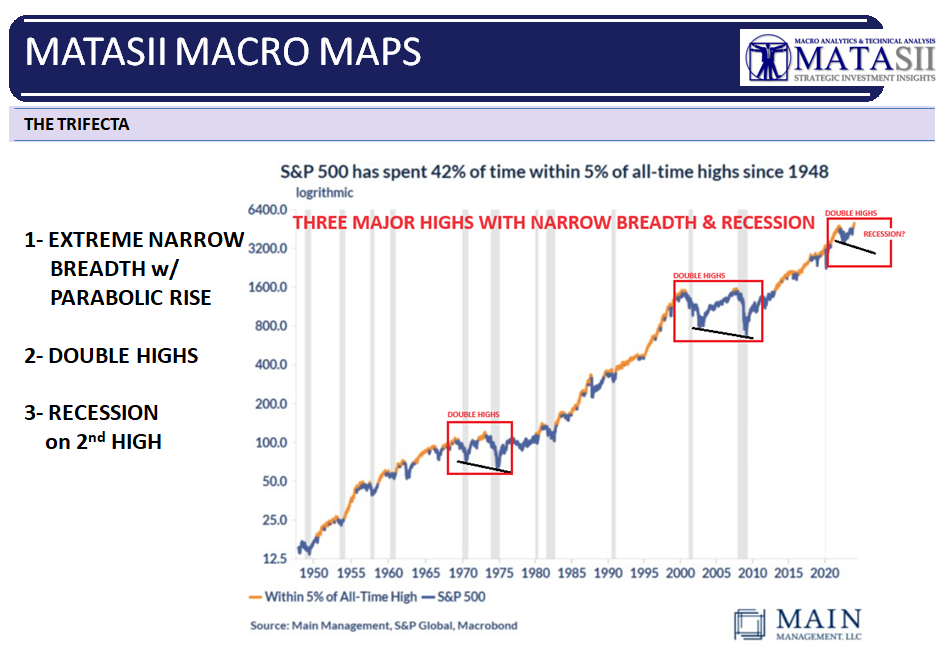
We recently discussed the "Trifecta" market situation in isolating why we are potentially in a "generational" cusp in the markets (see chart right).
The ongoing "Irrational Exuberance" of the equity markets makes it worth further examining past instances of significant similar market rallies, such as those of 1928, 1987, and 1999. Hopefully, we can gain additional valuable insights into the current market environment and its potential implications by exploring the historical context, the impact of the job market, and possible guidance for investors.
| |
|
The folks at Game of Trades did some interesting digging into the history books that is worth consideration.
Unveiling Historical Market Surges
1928, 1987 & 1999
- In November 1928, the stock market experienced a remarkable 18% surge within a mere four months, preceding the notorious peak of the Dow Jones in 1929 (chart right).
- Similarly, in July 1987, a rapid 18% rally occurred over four months, propelling the stock market to new highs. However, this surge was followed by the infamous Black Monday crash, resulting in a 40% drop from the peak.
- In April 1999, the Dow Jones surged 18%, reaching record highs. Unfortunately, this surge was a precursor to a severe three-year bear market.
| |
|
Over the past four months, the Dow Jones has once again surged by more than 18%, indicating a speculative market trend.
It is important to note that similar market moves were observed in 2019, 2017, 2012, and 2009, which were followed by more upside. These exceptional rallies often mark bear market bottoms.
However, it is crucial to recognize that the current difference is the market being at all-time highs, which adds a unique element of uncertainty.
Assessing the Current Market Strength
The occurrence of an 18% rally in just four months at all-time highs is a rare phenomenon. Historical analysis reveals that such a pattern was observed only in three periods: 1927-1929, 1986-1987, and 1997-1999.
At first glance, this level of market strength may raise concerns, as it led to significant corrections in all three cases.
However, it is important to note that between the initial reading and the market's peak, there were approximately two years of upside. In 1986-1987, the Dow Jones rallied 40% over 2 years, whereas, in 1997-1999, the market saw an additional 30%. These episodes presented challenges for rational investors due to an expensive yet strong market that sustained its strength for years.
|  | |
|
The 5-year return of the Dow Jones Industrial Average shows a 49% gain, which is lower than the returns before 1999, 1987, and 1929. In those cases, the market rose by 195% in the 5 years leading up to the tops. (chart right)
This suggests that the market may have more room to grow before reaching a similar euphoric state.
The Role of the Job Market in Market Dynamics
The strength or weakness of the job market has a significant impact on market trends. In past instances, it was observed that when the job market weakened, the market's strength turned into weakness. Presently, a strong job market is giving investors a sense of confidence that we may not be on the verge of a recession like in 2008 and 2001, where initial jobless claims were rising leading into the downturns. As long as the trend of a robust job market continues, we could see the stock market display bouts of strength, similar to what we have witnessed over the past few months.
| |
|
Warning Signs: Declining Leading Indicators
While the job market remains strong, investors should exercise because of the signs shown by leading indicators. The leading indicator index from the Conference Board has declined for twenty consecutive months. Historically, a recession has occurred if this index declined for more than eight consecutive months.
Despite the decline in leading indicators, coincident economic indicators show upward movement. This pattern has been observed throughout history, with such divergences eventually resolving as coincident indicators catch down. It is important to monitor both leading and coincident indicators to gain a comprehensive understanding of the overall economic landscape and its potential impact on the market.
| |
|
Conclusion
While recent market gains may be encouraging, it is crucial to remain cautious and consider the broader economic indicators. The strength of the job market brings a sense of confidence, but warning signs from declining leading indicators warrant attention. As investors, it is important to maintain a balanced and informed investment approach, considering both the historical context and the current market dynamics.
NOTE: See "Global Economic Indicators below for our concerns with the current Jobless Claims and the reporting by the BEA regarding the strength of the US Jobs Market
| |
|
BIG WEEK FOR CENTRAL BANKS
The Fed and BoE overall messages didn't change, though offered enough dovish hints for market expectations to converge on June as the kick-off date for the easing cycles. June is still some months away, and potentially hot US PCE data next week could show that there is still a way up for rates near term. Expectations for the ECB should have the best foundations
Markets are settling on June as the month for central bank cuts
This week was one for the doves, with market pricing converging to the idea that June will likely be the month that the ECB, Fed and BoE all make their first rate cut. With regards to the BoE markets took their cue from the two hawkish members of the monetary policy committee having finally dropped their vote for a rate hike, opting instead to join the consensus vote for no change. The Swiss National Bank was supposed to be among those central banks but surprised us on Thursday with an early cut, which did however add to the overall dovish backdrop.
June is still a couple of months away, however, and with US PCE data expected to come in hot next week, cuts are not set in stone everywhere. US yields have been surprised before by inflation numbers and can set the tone for the weeks thereafter. Combine that with a backdrop of high supply and US yields could test higher grounds. For the BoE our economist also still thinks there is a better chance that the first hike could be postponed to August, being wary not to overinterpret the change in the voting split.
The ECB seems to be in the most comfortable position – inflation is gradually falling and growth remains in stagnation territory. The disappointing manufacturing PMIs from Germany and the eurozone on Thursday were a reminder of the economy’s weakness. All the ECB wants to assure is that first quarter wage increases are contained, which will be known by the June meeting date and should not be a hurdle. Markets are pricing in an 87% probability for a cut in June and around 90bp of cuts for the year.
Now that June ECB cuts are anchored, markets will want to hear how many more cuts the ECB has in mind for the rest of this year and next year. On Friday morning the ECB’s Nagel may share his view on the way forward and later in the day we have Holzmann and Lane speaking, which can all influence market views. Having said that, implied volatility from swaptions came down significantly since the beginning of the month, suggesting that markets have started narrowing down on their idea where rates should be going, limiting potential moves on the short end of the curve.
|  | |
RECAP (See "Developments To Watch" for Coverage of FOMC & BOJ developmemts)
BOE REVIEW: As expected, the MPC once again opted to stand pat on rates at 5.25%. The slight surprise came via the vote split which saw Haskel and Mann move into the unchanged camp, leading to an 8-1 split with Dhingra the lone dissenter in opting for a cut.
- BoE kept rates unchanged at 5.25% in which 8 voted to keep rates unchanged and 1 voted to cut (prev. vote: 2 hike, 6 unchanged, 1 cut). BoE maintained guidance that policy needs to be restrictive for an extended period of time until the risk of inflation becoming embedded above the 2% target dissipates and the Committee will keep under review how long the Bank Rate should be maintained at its current level, while Governor Bailey said they are not yet at the point that they can cut rates, but things are moving in the right direction.
- BoE's Governor Bailey said it is reasonable that markets are pricing in rate cuts this year given the path of inflation and that a technical recession at end-2023 appears to be subsiding. Furthermore, Bailey said he is very hopeful and encouraged by good signs within the economy, while they need to see consistent progress towards hitting the inflation goal before cutting.
- UK PM Sunak is set to guarantee that the pension triple lock will remain in place under a future Conservative government, according to Sky News.
SNB REVIEW: A largely unexpected 25bp rate reduction from the SNB, which sparked marked
CHF depreciation and a modest broader dovish reaction.
NORGES REVIEW: A somewhat hawkish announcement from the Norges Bank. The Key Policy Rate was left unchanged at 4.50%; however, the policy path did not formalize a Q4-2024 rate reduction as some had been expecting given the recent moderation of inflation.
BCB REVIEW: The COPOM voted to cut the Selic rate by 50bps to 10.75%, in line with the consensus. But analysts noted that the central bank tweaked its forward guidance, which might suggest it will lower the rate of reductions in the meetings ahead.
CBRT REVIEW: CBRT surprised with a 500bps rate hike to 50%, although Goldman Sachs state this was a one off and they expect the CBRT to ease policy from Q3.
BANXICO REVIEW: Banxico cut rates as expected by 25bps to 11.00% while noting that future decisions will be based upon data. The decision was not unanimous, with Espinosa opting to keep rates unchanged in a hawkish dissent. It did note that the disinflation process is expected to continue but balance of risks to inflation remains biased to the upside.
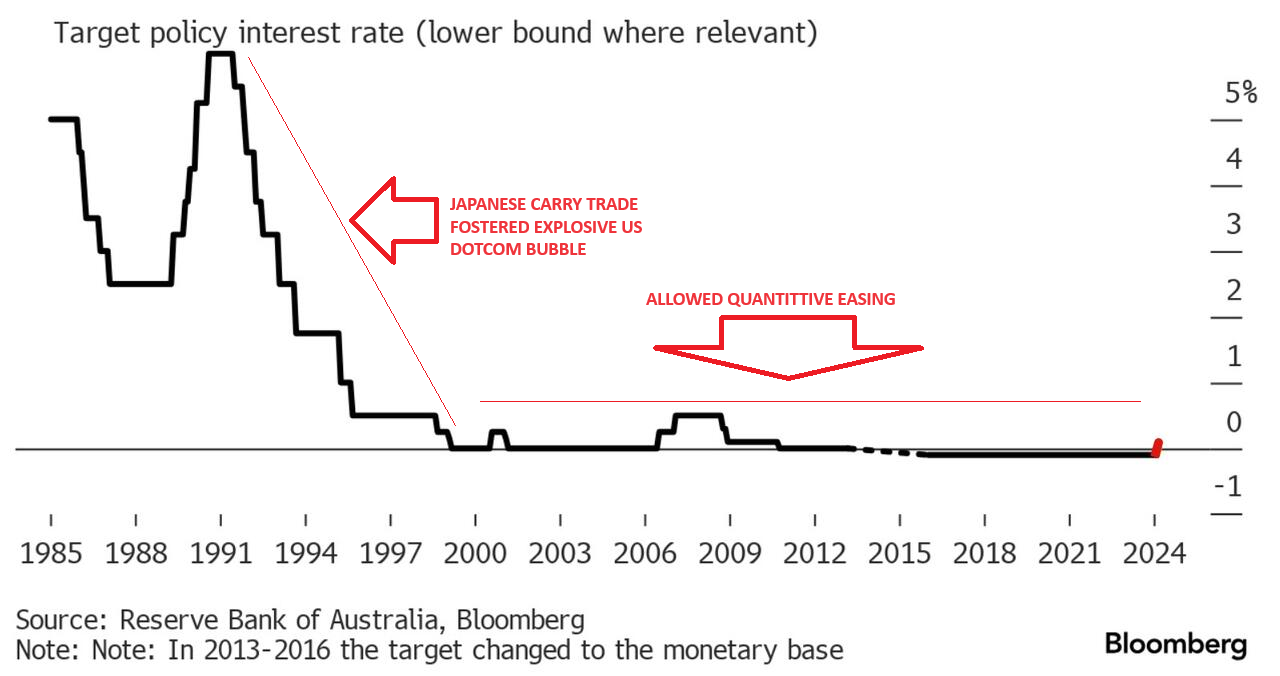
MAJOR CENTRAL HAVE NOT BEGUN CUTTING RATES
|  | |
|
DEVELOPMENTS TO WATCH
BOJ - MAJOR MONETARY POLICY CHANGE
HIGHLIGHTS:
- BoJ changed its monetary policy framework in which it ended negative interest rate policy and abandoned YCC, while it will guide the overnight call rate in the range of 0%-0.1% and apply 0.1% interest to all excess reserves parked at the central bank.
- BoJ also announced to end ETF and J-REIT purchases, as well as gradually reduce the amount of purchases of commercial paper and corporate bonds whereby it will discontinue purchases of CP and corporate bonds in about one year.
- However, it stated that it will continue roughly the current amount of JGB buying and it expects to maintain an accommodative monetary environment for the time being.
- Furthermore, the BoJ announced its planned bond purchases and stated that in case of a rapid rise in long-term rates, it will make nimble responses with JGB purchases and could increase the amount of JGB purchases or conduct fixed-rate purchase operations of JGBs, while it will provide loans under Fund Provisioning Measure to stimulate bank lending with an interest rate of 0.1% and a 1-year duration.
NOTES:
- The BoJ ended its era of negative interest rates, as had strongly been guided in recent sourced articles.
- It raised rates for the first time since 2007 and will keep guiding overnight rates in the range of 0-0.1%, and apply a 0.1% interest to all excess reserves parked at the BoJ.
- It also abandoned its policy of Yield Curve Control, but said it will continue its current amount of JGB purchases at broadly the same rate.
- The central bank will also end ETF and J-REIT purchases.
- Still, it expects to maintain an accommodative monetary environment for the time being, which analysts said was a signal it does not intend to raise rates again any time soon.
- Capital Economics said that "it seems likely that the BoJ will continue to shrink its JGB holdings, and it will also discontinue its ETF purchases, but that doesn’t mark a major policy change as the Bank has bought very little ETFs over the past year."
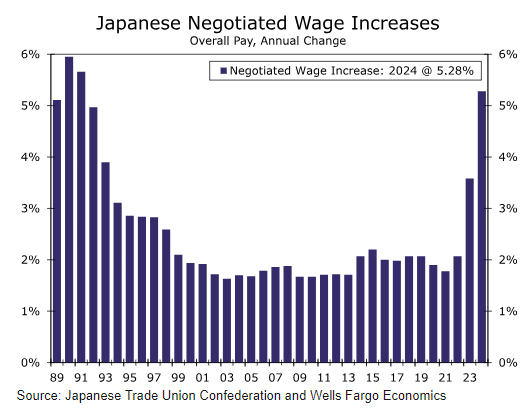
- Ahead, CapEco said that the strength of pay hikes in this year’s spring wage negotiations poses some upside risks to its inflation forecasts. "However, we suspect that wage growth among smaller firms won’t be quite as strong as among those firms participating in the Shunto, and with inflation coming off the boil now, it seems likely that trade unions will push for smaller pay hikes in next year’s talks."
- CapEco adds that "with wage growth peaking this year, we still expect inflation to fall below the BoJ’s target by the end of the year so the Bank won’t feel the need to lift its policy rate any further."
|  | |
A New Era For Bank of Japan Monetary Policy
In a historic—albeit well-anticipated—policy shift, the Bank of Japan (BoJ) formally ended its ultra-easy and nonconventional monetary policy stance at today's monetary policy announcement. The central bank said that its policy framework of Quantitative and Qualitative Monetary Easing (QQE) with Yield Curve Control and the negative interest rate policy to date have fulfilled their roles. Notably, today's announcement included the first policy interest rate increase from the Bank of Japan since 2007. While there were several aspects to the BoJ's announcement, the most significant of those were:
An End to Negative Interest Rate Policy
The BoJ said that guiding the short term interest rate would be a primary policy tool, and that it will “encourage the uncollateralized overnight call rate to remain at around 0 to 0.1 percent.” In order to achieve that guideline, the BoJ will apply an interest rate of +0.10% to current account balances held by financial institutions at the central bank (excluding required reserve balances), or in other words excess reserves, effective from March 21. Given the large amount of excess reserves, and the fact that not all financial institutions can deposit funds at the BoJ, the overnight call rate should in practice trade slightly below that 0.10% rate.
The new approach represents both a change in the targeted interest rate and a streamlining of the short-term interest rate system that had existed under the negative interest rate policy. That said, we view today's move as effectively similar to a 10 bps rate increase. The BoJ noted that the overnight call rate had traded in a range of -0.10% to 0.00% before today's announcement, whereas going forward it is now expected to trade in a range of 0.00% to 0.10%.
An End to Yield Curve Control
The Bank of Japan also formally ended its Yield Curve Control policy, although that arguably had little effect in practice. The upper bound for 10-year Japanese Government Bond (JGB) Yields had already evolved from a “hard cap” to a “reference point” in terms of the BoJ's bond buying operations, and in any case, current 10-year yields (currently 0.74%) have recently been well below that upper bound.
The Bank of Japan did say it will continue its JGB purchases at broadly the same pace as previously, which it noted is currently around 6 trillion yen per month. It said that in the case of a rapid rise in long-term interest rates it would respond nimbly by, for example, increasing the amount of JGB purchases, conducting fixed rate JGB purchase operations or utilizing other funds supplying operations.
A Cessation To Other Asset Purchases
The Bank of Japan said it will discontinue, with immediate effect, purchases of exchange-traded funds and Japan real estate investment trusts. The BoJ said it will gradually reduce its purchases of commercial paper and corporate bonds, and will discontinue the purchases in about one year.
In terms of market reaction, the yen weakened following the announcement, with the USD/JPY exchange rate trading beyond JPY150. Ten-year Japanese government bond yields were also modestly lower on the day, falling 3 bps to 0.74%.
LATEST UPDATE
BoJ Governor Ueda reiterated that the BoJ's JGB holdings will remain at current levels for the time being and they would like to eventually decrease their JGB buying but will take a wait-and-see stance for the time being. Ueda added that the latest decision is based on the understanding that they will leave it to markets to determine long-term rate moves.
-
Japanese RENGO 2nd Tally: 5.25% (vs 5.28% in the first tally). Japan RENGO 1st Wage Tally: 5.28% (exp. 4.1%; 2023 final figure 3.6%).
- Japan Government says BoJ will continue to work closely to conduct flexible policy and lead to an end of deflation.
| |
|
FOMC - MARCH 2024
Given the renewed signs of higher inflationary pressures in both the US and Europe, the
question naturally arises of whether we could risk facing a scenario of no rate cuts at all
this year.
That risk is real – perhaps especially so in the case of the US – but so far neither the ECB
nor the Fed have sown any doubts that an easing of policy is in the offing.
With a more
balanced economic risk picture, focus appears to be shifting to risk management and thus
addressing the threat that current monetary policy may prove unduly restrictive as the
impact feeds fully through to the economy in the next 1-2 years. Securing a soft landing
requires monetary policy to be eased in a timely manner. And based on the statements of
key central bank members in March, preparation for this process is well under way – even
though global data are on a more positive course than most had probably dared hope.
Our stance is essentially that the ECB is likely to deliver the first in a series of quarterly 25bp
rate cuts at its June meeting. In the US, we expect the same easing profile to begin unfolding
in July.
Fed funds target rate ceiling 1971-2024 (%) and period of time between last rate hike and first rate cut
(Last Hike was July. It has been 8 months!)
| |
| | |
HIGHLIGHTS
- ANNOUNCEMENT:
- FOMC held rates at 5.25-5.50%, as expected, while the statement was little changed in which it noted that job gains have remained strong (prev. said job gains have moderated since early last year but remain strong).
- Repeated that recent indicators suggest that economic activity has been expanding at a solid pace.
- FOMC maintained the current pace of the balance sheet drawdown and it still sees three cuts this year but the 2025 projection was increased to 3.75-4.00% (prev. 3.50-3.75%) and 2026 was increased to 3.00-3.25% (prev. 2.75-3.00%), while the Neutral Rate estimate was raised to 2.6% (prev. 2.5%).
- Fed Chair Powell said during the post-meeting statement that:
- The economy has made considerable progress and inflation has eased substantially but inflation is too high and ongoing progress is not assured.
- Powell reiterated the policy rate is likely at its peak and it will likely be appropriate to dial back rates sometime this year, while he noted they are prepared to keep rates higher for longer if needed and will assess incoming data when setting policy.
- Powell also stated that the Fed does not expect to reduce rates until it has greater confidence that inflation is sustainably moving back to the target and participants discussed the balance sheet at this meeting with the general sense to slow the pace of the runoff fairly soon.
- Fed Chair Powell said during the Q&A that:
- New projections do not mean a higher tolerance for inflation and inflation data came in a little higher than expected, but the Fed is still making good progress on bringing inflation down.
- Powell said risks are now two-sided and the first rate cut is therefore consequential, while the Fed wants to be careful and will let the data speak on that.
- Powell also noted that January/February CPI and PCE data was quite high, but there are reasons to believe there were seasonal factors at play and pointed out that inflation tends to be stronger in the first half of the year.
- Furthermore, he is unsure if the data was a bump on the inflation road or something more and noted recent inflation data has certainly not improved anyone's confidence.
- Powell has not altered the story that inflation is coming back down to 2% on a sometimes-bumpy path.
- Powell's main message to Congress on 'confidence' was that the FOMC needs to see more evidence that inflation is moving down sustainably to the target and does not anticipate rate cuts without this confidence.
| |
|
GLOBAL ECONOMIC INDICATORS: What This Week's Key Global Economic Releases Tell Us
JOBLESS CLAIMS
- US Initial Jobless Claims 210k vs. Exp. 215k (Prev. 209k, Rev. 212k)
- US Continued Jobless Claims 1.807M vs. Exp. 1.820M (Prev. 1.811M, Rev. 1.803M)
CHART RIGHT: Continuing Claims saw another downward revision for last week. That is the 20th straight weekly downward revision of continuing claims.
THE REPORT'S NARRATIVE:
- Initial claims data, for the week that coincides with the NFP survey window, eased slightly to 210k from an upwardly revised 212k, beneath expectations of 215k, a level that is seen consistent with a tight labor market.
- The 4wk average however rose to 211.25k from 208.75k.
- Looking at the unadjusted data, the total number of initial claims totaled 190k, 12k lower than the prior week; seasonal factors had expected a decrease of 11k.
- Continued claims, for the week prior, were largely unchanged at 1.807mln, beneath the 1.82mln forecast.
- Many do forecast an increase in claims ahead while the Fed Chair on Wednesday described initial claims as "very, very low", noting if anything, they have tracked down a bit and it is something the Fed is watching carefully.
THE REALITY OF WHAT IS HAPPENING (But Getting Little Coverage in an Election Year)
| |
|
As a reminder, in the real world labor market, 2024 has been an avalanche of layoffs:
1. Everybuddy: 100% of workforce
2. Wisense: 100% of workforce
3. CodeSee: 100% of workforce
4. Twig: 100% of workforce
5. Twitch: 35% of workforce
6. Roomba: 31% of workforce
7. Bumble: 30% of workforce
8. Farfetch: 25% of workforce
9. Away: 25% of workforce
10. Hasbro: 20% of workforce
11. LA Times: 20% of workforce
12. Wint Wealth: 20% of workforce
13. Finder: 17% of workforce
14. Spotify: 17% of workforce
15. Buzzfeed: 16% of workforce
16. Levi's: 15% of workforce
17. Xerox: 15% of workforce
18. Qualtrics: 14% of workforce
19. Wayfair: 13% of workforce
20. Duolingo: 10% of workforce
21. Rivian: 10% of workforce
22. Washington Post: 10% of workforce
23. Snap: 10% of workforce
24. eBay: 9% of workforce
25. Sony Interactive: 8% of workforce
| |  |
26. Expedia: 8% of workforce
27. Business Insider: 8% of workforce
28. Instacart: 7% of workforce
29. Paypal: 7% of workforce
30. Okta: 7% of workforce
31. Charles Schwab: 6% of workforce
32. Docusign: 6% of workforce
33. Riskified: 6% of workforce
34. EA: 5% of workforce
35. Motional: 5% of workforce
36. Mozilla: 5% of workforce
37. Vacasa: 5% of workforce
38. CISCO: 5% of workforce
39. UPS: 2% of workforce
40. Nike: 2% of workforce
41. Blackrock: 3% of workforce
42. Paramount: 3% of workforce
43. Citigroup: 20,000 employees
44. ThyssenKrupp: 5,000 employees
45. Best Buy: 3,500 employees
46. Barry Callebaut: 2,500 employees
47. Outback Steakhouse: 1,000
48. Northrop Grumman: 1,000 employees
49. Pixar: 1,300 employees
50. Perrigo: 500 employees
| |
Jobless claims continue to blow it out of the ballpark... until you realize that it's the most "credible" of states that are behind the blowout numbers: last week, NY, this week CA | |
|
As a reminder, if you doubt the accuracy of the Biden admin's data, here's what the most recent FOMC Minutes said:
"While the recent trends prior to the meeting had been remarkably positive, Fed officials judged that some of the recent improvement “reflected idiosyncratic movements in a few series.”
Even they aren't buying it, and neither should you!
| |
|
GLOBAL MACRO
WHAT DOES YOUR SCAN OF THE DATA BELOW TELL YOU? - THE MEDIA AVOIDS BAD NEWS!
We present the data in a way you can quickly see what is happening.
THIS WEEK WE SAW
Exp=Expectations, Rev=Revision, Prev=Previous
| |
|
UNITED STATES
- US NAHB Housing Market Index (Mar) 51.0 vs. Exp. 48.0 (Prev. 48.0)
- US Housing Starts Number (Feb) 1.521M vs. Exp. 1.425M (Prev. 1.331M, Rev. 1.374M)
- US Building Permits Number (Feb) 1.518M vs. Exp. 1.495M (Prev. 1.489M)
- US S&P Global Manufacturing PMI Flash (Mar) 52.5 vs. Exp. 51.7 (Prev. 52.2)
- US S&P Global Services PMI Flash (Mar) 51.7 vs. Exp. 52.0 (Prev. 52.3)
- US S&P Global Composite Flash PMI (Mar) 52.2 (Prev. 52.5)
- US Leading Index Change MM (Feb) 0.1% vs. Exp. -0.2% (Prev. -0.4%)
- US Philly Fed Business Index (Mar) 3.2 vs. Exp. -2.3 (Prev. 5.2)
- US Existing Home Sales (Feb) 4.38M vs. Exp. 3.94M (Prev. 4.0M)
- US Initial Jobless Claims 210k vs. Exp. 215k (Prev. 209k, Rev. 212k)
- US Continued Jobless Claims 1.807M vs. Exp. 1.820M (Prev. 1.811M, Rev. 1.803M)
CHINA
- Chinese Industrial Production YY (Feb) 7.0% vs. Exp. 5.0% (Prev. 6.8%)
- Chinese Retail Sales YY (Feb) 5.5% vs. Exp. 5.2% (Prev. 7.4%)
- Chinese Urban Investment (YTD)YY (Feb) 4.2% vs. Exp. 3.2% (Prev. 3.0%)
- Chinese Unemployment Rate Urban Area (Feb) 5.3% (Prev. 5.1%)
- Japanese Machinery Orders MM (Jan) -1.7% vs. Exp. -1.0% (Prev. 2.7%, Rev. 1.9%)
- Japanese Machinery Orders YY (Jan) -10.9% vs. Exp. -11.2% (Prev. -0.7%)
- Singapore Non-Oil Exports MM (Feb) -4.8% vs. Exp. -0.4% (Prev. 2.3%)
- Singapore Non-Oil Exports YY (Feb) -0.1% vs. Exp. 4.7% (Prev. 16.8%)
- Chinese Industrial Production YY (Feb) 7.0% vs. Exp. 5.0% (Prev. 6.8%); Retail Sales YY (Feb) 5.5% vs. Exp. 5.2% (Prev. 7.4%); Urban Investment (YTD)YY (Feb) 4.2% vs. Exp. 3.2% (Prev. 3.0%); Unemployment Rate Urban Area (Feb) 5.3% (Prev. 5.1%)
JAPAN
- Japanese Machinery Orders MM (Jan) -1.7% vs. Exp. -1.0% (Prev. 2.7%, Rev. 1.9%); Machinery Orders YY (Jan) -10.9% vs. Exp. -11.2% (Prev. -0.7%)
- Japanese Trade Balance (JPY)(Feb) -379.4B vs. Exp. -810.2B (Prev. -1760.3B)
- Japanese Exports YY (Feb) 7.8% vs. Exp. 5.3% (Prev. 11.9%)
- Japanese Imports YY (Feb) 0.5% vs. Exp. 2.2% (Prev. -9.6%, Rev. -9.8%)
- Japanese Manufacturing PMI Flash SA (Mar) 48.2 (Prev. 47.2)
- Japanese Services PMI Flash SA (Mar) 54.9 (Prev. 52.9)
- Japanese Composite Flash SA (Mar) 52.3 (Prev. 50.6)
- Japanese Trade Balance (JPY)(Feb) -379.4B vs. Exp. -810.2B (Prev. -1760.3B); Exports YY (Feb) 7.8% vs. Exp. 5.3% (Prev. 11.9%); Imports YY (Feb) 0.5% vs. Exp. 2.2% (Prev. -9.6%, Rev. -9.8%)
- Japanese Manufacturing PMI Flash SA (Mar) 48.2 (Prev. 47.2); Services PMI Flash SA (Mar) 54.9 (Prev. 52.9); Composite Flash SA (Mar) 52.3 (Prev. 50.6)
- Japanese National CPI YY (Feb) 2.8% vs. Exp. 2.9% (Prev. 2.2%)
- Japanese National CPI Ex. Fresh Food YY (Feb) 2.8% vs. Exp. 2.8% (Prev. 2.0%)
- Japanese National CPI Ex. Fresh Food & Energy YY (Feb) 3.2% vs. Exp. 3.3% (Prev. 3.5%)
UK
- UK Rightmove House Price Index MM (Mar) 1.5% (Prev. 0.9%)
- UK Rightmove House Price Index YY (Mar) 0.8% (Prev. 0.1%)
- UK Rightmove House Price Index MM (Mar) 1.5% (Prev. 0.9%); Rightmove House Price Index YY (Mar) 0.8% (Prev. 0.1%)
- UK CPI MM (Feb) 0.6% vs. Exp. 0.7% (Prev. -0.6%)
- UK CPI YY (Feb) 3.4% vs. Exp. 3.5% (Prev. 4.0%)
- UK Core CPI MM (Feb) 0.6% vs. Exp. 0.7% (Prev. -0.9%)
- UK Core CPI YY (Feb) 4.5% vs. Exp. 4.6% (Prev. 5.1%)
- UK Flash Composite PMI (Mar) 52.9 vs. Exp. 53.1 (Prev. 53); Flash Services PMI (Mar) 53.4 vs. Exp. 53.8 (Prev. 53.8); Flash Manufacturing PMI (Mar) 49.9 vs. Exp. 47.8 (Prev. 47.5); "The survey data are indicative of first quarter GDP rising 0.25% to thereby signal a reassuringly solid rebound from the technical recession seen in the second half of 2023".
- UK PSNB Ex Banks GBP (Feb) 8.401B GB vs. Exp. 5.95B GB (Prev. -16.691B GB, Rev. -16.114B GB); PSNB, GBP (Feb) 7.477B GB (Prev. -17.615B GB, Rev. -17.038B GB); PSNCR, GBP (Feb) 3.024B GB (Prev. -23.344B GB, Rev. -22.482B GB)
- UK Flash Manufacturing PMI (Mar) 49.9 vs. Exp. 47.8 (Prev. 47.5)
- UK Flash Services PMI (Mar) 53.4 vs. Exp. 53.8 (Prev. 53.8)
- UK Flash Composite PMI (Mar) 52.9 vs. Exp. 53.1 (Prev. 53)
- UK GfK Consumer Confidence (Mar) -21.0 vs. Exp. -19.0 (Prev. -21.0)
- UK Retail Sales MM (Feb) 0.0% vs. Exp. -0.3% (Prev. 3.4%, Rev. 3.6%); Retail Sales YY (Feb) -0.4% vs. Exp. -0.7% (Prev. 0.7%, Rev. 0.5%); Retail Sales Ex-Fuel YY (Feb) -0.5% vs. Exp. -0.9% (Prev. 0.7%, Rev. 0.5%); Retail Sales Ex-Fuel MM (Feb) 0.2% vs. Exp. -0.1% (Prev. 3.2%, Rev. 3.4%)
- UK GfK Consumer Confidence (Mar) -21.0 vs. Exp. -19.0 (Prev. -21.0)
| | |
|
EU
- EU HICP Final MM (Feb) 0.6% vs. Exp. 0.6% (Prev. -0.4%)
- EU HICP Final YY (Feb) 2.6% vs. Exp. 2.6% (Prev. 2.6%)
- HICP-X F&E Final YY (Feb) 3.3% vs. Exp. 3.3% (Prev. 3.3%); HICP-X F, E, A, T Final MM (Feb) 0.7% vs. Exp. 0.7% (Prev. 0.7%); HICP-X F,E,A&T Final YY (Feb) 3.1% vs. Exp. 3.1% (Prev. 3.1%);
-
Eurostat Trade NSA, Eur (Jan) 11.4B EU (Prev. 16.8B EU); HICP-X F&E MM (Feb) 0.6% (Prev. -0.6%) Unrevised
- EU ZEW Survey Expectations (Mar) 33.5 (Prev. 25.0)
- EU Consumer Confidence Flash (Mar) -14.9 vs. Exp. -15.0 (Prev. -15.5)
- EU HCOB Composite Flash PMI (Mar) 49.9 vs. Exp. 49.7 (Prev. 49.2); HCOB Manufacturing Flash PMI (Mar) 45.7 vs. Exp. 47 (Prev. 46.5); HCOB Services Flash PMI (Mar) 51.1 vs. Exp. 50.5 (Prev. 50.2).
- EU Current Account NSA, EUR (Jan) 24.87B (Prev. 42.66B); Current Account SA, EUR (Jan) 39.35B (Prev. 31.95B)
- EU Manufacturing Flash PMI (Mar) 45.7 vs. Exp. 47 (Prev. 46.5)
- EU Services Flash PMI (Mar) 51.1 vs. Exp. 50.5 (Prev. 50.2)
- EU Composite Flash PMI (Mar) 49.9 vs. Exp. 49.7 (Prev. 49.2)
GERMANY
- German ZEW Economic Sentiment (Mar) 31.7 vs. Exp. 20.5 (Prev. 19.9)
- German ZEW Current Conditions (Mar) -80.5 vs. Exp. -82.0 (Prev. -81.7)
- German Producer Prices MM (Feb) -0.4% vs. Exp. -0.1% (Prev. 0.2%)
- German Producer Prices YY (Feb) -4.1% vs. Exp. -3.8% (Prev. -4.4%)
- German HCOB Manufacturing Flash PMI (Mar) 41.6 vs. Exp. 43.1 (Prev. 42.5); HCOB Services Flash PMI (Mar) 49.8 vs. Exp. 48.8 (Prev. 48.3); HCOB Composite Flash PMI (Mar) 47.4 vs. Exp. 47 (Prev. 46.3); "Germany is not getting back on track; Overall, Germany now teeters on the edge of a technical recession; our GDP nowcast is at -0.3%. This corresponds to the rate of contraction in the fourth quarter of 2023."; downbeat commentary & dovish SNB continued the post-German Manufacturing Flash PMI (Mar) 41.6 vs. Exp. 43.1 (Prev. 42.5)
- German Services Flash PMI (Mar) 49.8 vs. Exp. 48.8 (Prev. 48.3)
- German Composite Flash PMI (Mar) 47.4 vs. Exp. 47 (Prev. 46.3)
- German Ifo Current Conditions New (Mar) 88.1 vs. Exp. 86.8 (Prev. 86.9); Ifo Expectations New (Mar) 87.5 vs. Exp. 84.7 (Prev. 84.1, Rev. 84.4); Ifo Business Climate New (Mar) 87.8 vs. Exp. 86 (Prev. 85.5, 85.7).
- German Import Prices MM (Jan) 0.0% vs. Exp. -0.3% (Prev. -1.1%); German Import Prices YY (Jan) -5.9% vs. Exp. -7.4% (Prev. -8.5%)
FRANCE
- French HCOB Services Flash PMI (Mar) 47.8 vs. Exp. 48.7 (Prev. 48.4); HCOB Manufacturing Flash PMI (Mar) 45.8 vs. Exp. 47.5 (Prev. 47.1); HCOB Composite Flash PMI (Mar) 47.7 vs. Exp. 48.6 (Prev. 48.1); Softer across the board sparking a fleeting dovish reaction.
- French Business Climate Mfg (Mar) 102.0 vs. Exp. 100.0 (Prev. 100.0, Rev. 101)
SINGAPORE
- Singapore Non-Oil Exports MM (Feb) -4.8% vs. Exp. -0.4% (Prev. 2.3%); Non-Oil Exports YY (Feb) -0.1% vs. Exp. 4.7% (Prev. 16.8%)
NORWAY
- Norwegian GDP Month Mainland (Jan) 0.4% (Prev. -0.1%); GDP Month (Jan) 0.0% (Prev. 0.5%)
AUSTRALIA
- Australian Employment (Feb) 116.5k vs. Exp. 40.0k (Prev. 0.5k)
- Australian Unemployment Rate (Feb) 3.7% vs. Exp. 4.0% (Prev. 4.1%)
- Australian Participation Rate (Feb) 66.7% vs. Exp. 66.8% (Prev. 66.8%)
- Australian Manufacturing PMI Flash (Mar) 46.8 (Prev. 47.8)
- Australian Services PMI Flash (Mar) 53.5 (Prev. 53.1)
- Australian Composite PMI Flash (Mar) 52.4 (Prev. 52.1)
- Australian Employment (Feb) 116.5k vs. Exp. 40.0k (Prev. 0.5k); Unemployment Rate (Feb) 3.7% vs. Exp. 4.0% (Prev. 4.1%); Participation Rate (Feb) 66.7% vs. Exp. 66.8% (Prev. 66.8%)
- Australian Manufacturing PMI Flash (Mar) 46.8 (Prev. 47.8); Services PMI Flash (Mar) 53.5 (Prev. 53.1); Composite PMI Flash (Mar) 52.4 (Prev. 52.1); GDP QQ (Q4) -0.1% vs. Exp. 0.1% (Prev. -0.3%)
NEW ZEALAND
- New Zealand GDP QQ (Q4) -0.1% vs. Exp. 0.1% (Prev. -0.3%)
- New Zealand GDP YY (Q4) -0.3% vs. Exp. 0.1% (Prev. -0.6%)
- New Zealand GDP YY (Q4) -0.3% vs. Exp. 0.1% (Prev. -0.6%)
| |
CURRENT MARKET PERSPECTIVE | |
|
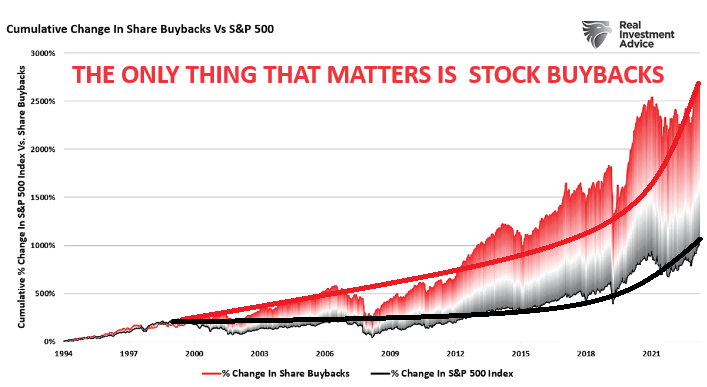
IT IS ALL ABOUT STOCK BUYBACKS!
WORKING AGAINST AN EVER SHRINKING STOCK POOL!?!
Click All Charts to Enlarge
| |
MATASII: "Sustained Corporate Buybacks have been driving stock prices for over a decade and half. Resulting reduced floats and stock pools are resulting in increasing buyback volumes having an inordinate impact of equity market price distortions". Gordon T Long | |
|
1 - SITUATIONAL ANALYSIS
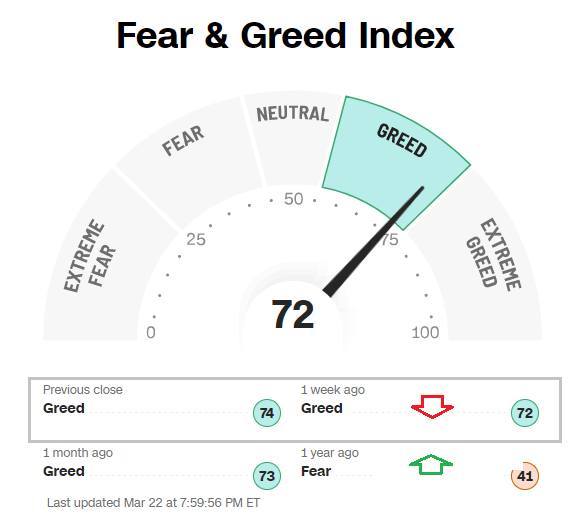
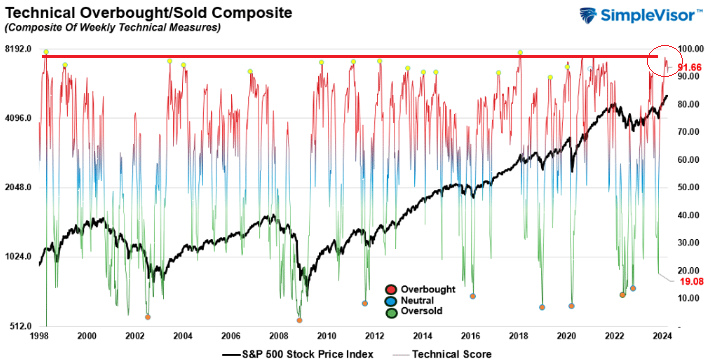
NERVOUS BUT STILL BULLISH
Though the Fear-Greed Index has slid slightly from 74 to 72, it is still at the high end of the Greed Scale (chart right top). From a longer term Overbought perspective it is at a major high (chart right bottom).
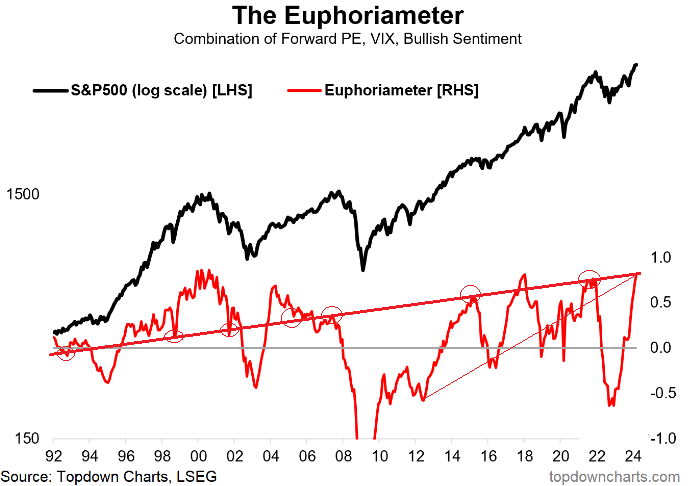
The combination of PE and VIX continues to signal a bullish outlook though we are clearly over-due for a near term corrective consolidation (chart directly below).
| |
ONLY AN EVENT SHOCK WILL STOP EQUITIES FROM CONTINUING HIGHER IN THE INTERMEDIATE TERM!
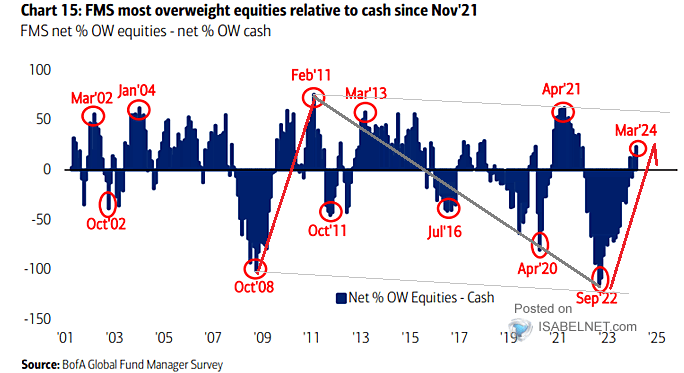
FUND MANAGERS SURVEY
Fund Managers continue to overweight equities relative to staying on the sidelines in cash.
| |
|
|
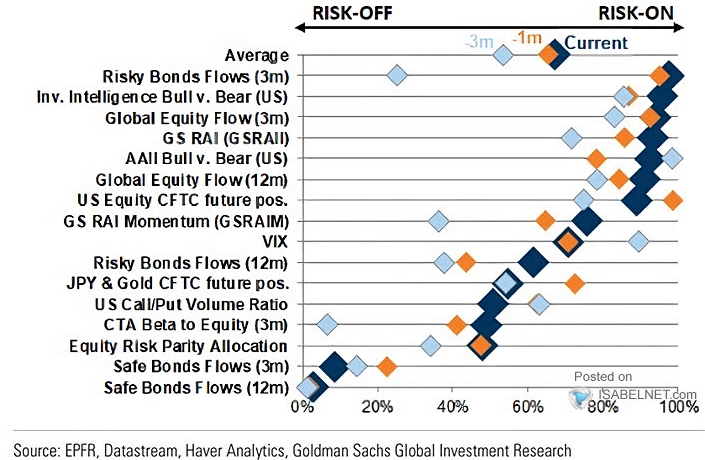
MARKET CONFIDENCE BUILT ON EARNINGS GROWTH , FED PIVOT & NO RECESSION
Rising earnings outlooks is assisting in supporting a strong "Risk-On" sentiment (chart right).
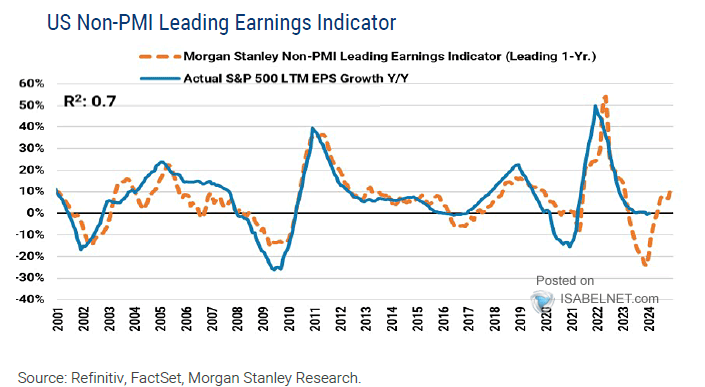
Earnings is supported by increasing GDP growth outlooks and improving Leading Earnings Indicators (below left).
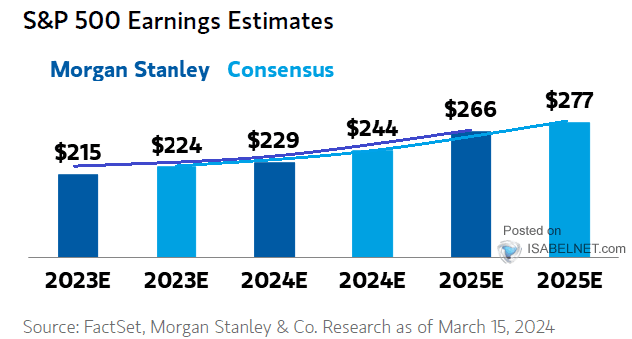
Morgan Stanley analysts (below right) are fairly representative of the Sell Side consensus.
| |
|
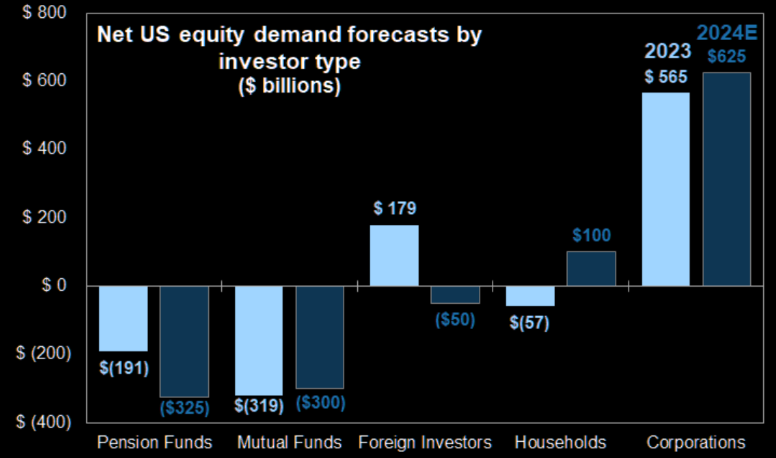
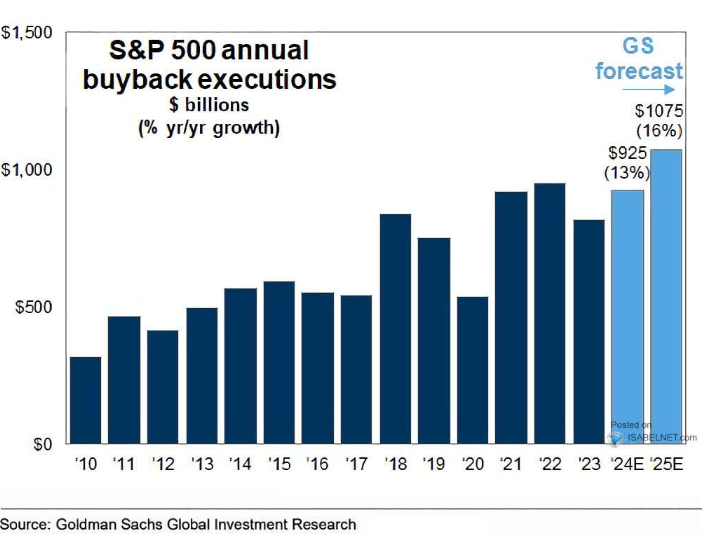
CORPORATE STOCK BUYBACKS
As the chart at the top of this "Current Market Perspective" section illustrates, it is Corporate Buybacks that have been playing a dominate role in rising equity prices over the last decade.
It is our view, as a result of a shrinking stock pool, corporate buybacks are having an even more pronounced impact. Increasingly, fewer stocks are available for Corporate Buyback thereby increasing upward pressure on prices.
See our warning video on the "Disappearing Equity & Float Pools".
CHART RIGHT - TOP
Corporations will continue to be the largest source of US equity demand in 2024. A surge in share buybacks and continued growth in cash M&A will be the primary drivers of corporate equity demand.
CHART RIGHT - BOTTOM
Though the available stock pool continues to shrink, the buyback volumes are only increasing!
The Mag-7 stocks have been major buyers of their stocks (notably AAPL).
| |
|
|
2 - FUNDAMENTAL ANALYSIS
US DOLLAR WEAKNESS IS NORMALLY GOOD FOR STOCKS!
The market is focused on the "Golden Cross" (50 DMA crossing upward through the 2000 DMA) that recent upward movement in the US Dollar has potentially triggered. A rising dollar is typically not good for stocks.
We are not in that camp since all three major moving averages (50,100 & 200 DMA) are all tightly banded. Instead we we are focused on the the fact that the 100 DMA has triggered a Death Cross with it recently crossing the 200 DMA to the downside.
| |
|
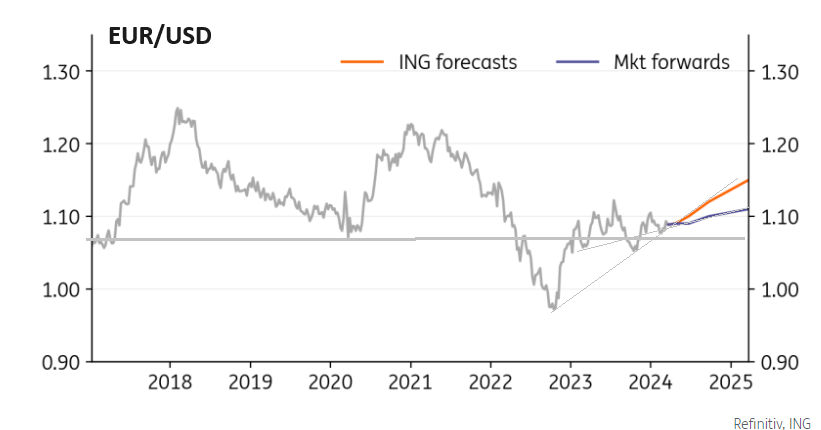
We suspect the Golden Cross will cause some consternation in the equity market before reversing downward. A weak US dollar will add support to equities during this election year.
Better activity data and sticky prices have provided support to US rates and the dollar through the early months of the year. However, the Fed has now told us it is not impressed by strong employment and that it thinks high early-year inflation may be down due to faulty seasonals.
A Fed signaling a commitment to cutting rates typically initiates a Dollar Bear Trend
- Having been held up through the first quarter on better growth and particularly higher inflation numbers, dollar support should soon start to fade.
- At its most recent press conference, Federal Reserve Chair, Jay Powell, made clear that the Fed is minded to cut rates. The Fed expects three cuts in 2024, some analysts expect five starting in June as the decaying employment situation becomes more evident.
- We look for the soft landing narrative to gain traction over coming months and expect a bullish steepening of the US yield curve and rate differentials moving against the dollar to see EUR/USD gently climb above the end-year consensus of 1.10.
- At the same time, we think a little too much is priced in for the European Central Bank cycle this year. We suspect just three cuts starting in June.
| |
|
YOUR DESKTOP / TABLET / PHONE ANNOTATED CHART
Macro Analytics Chart Above: SUBSCRIBER LINK
| |
3 - TECHNICAL ANALYSIS
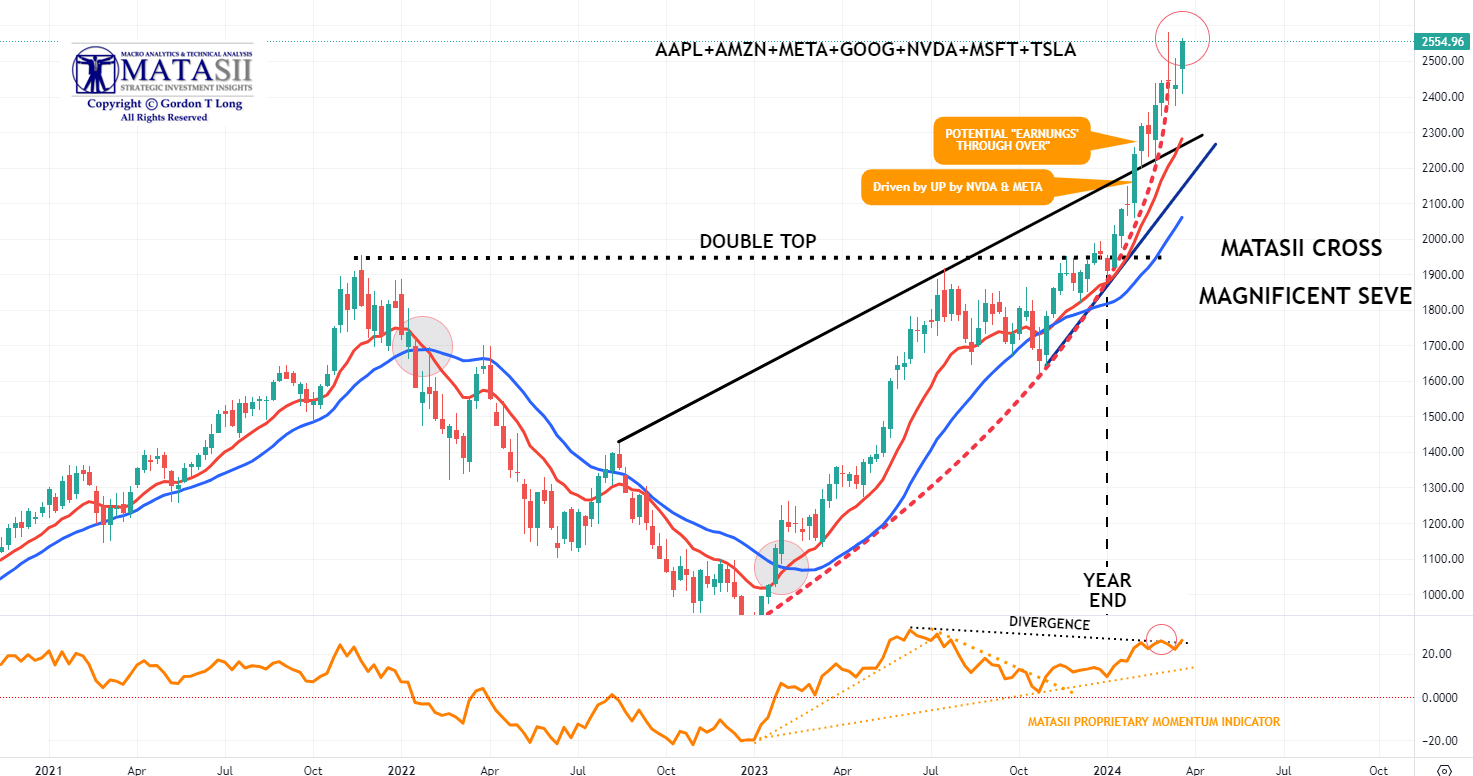
US EQUITY MARKETS
MAGNIFICENT SEVEN -- Surging Again!
| |
YOUR DESKTOP / TABLET / PHONE ANNOTATED CHART
Macro Analytics Chart Above: SUBSCRIBER LINK
| |
|
CONTROL PACKAGE
There are FIVE charts we have outlined in prior chart packages that we will continue to watch closely as a "control set".
- The S&P 500 (CHART LINK)
- The DJIA (CHART LINK)
- The Russell 2000 through the IWM ETF (CHART LINK),
- The MAGNIFICENT SEVEN (CHART ABOVE WITH MATASII CROSS - LINK)
- Nvidia (NVDA) (CHART LINK)
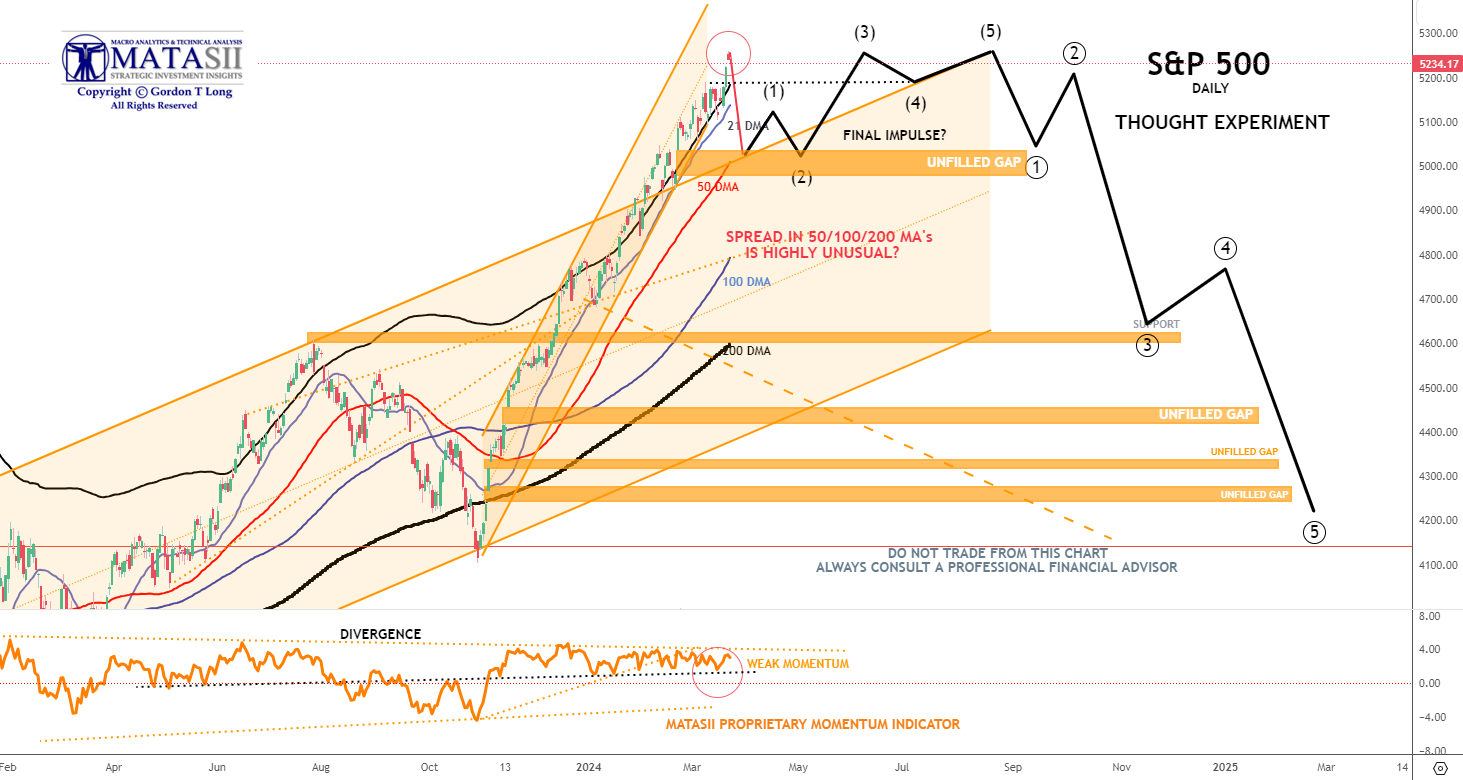
S&P 500 - Daily - Our Though Experiment
Our Though Experiment, which we continue to update, suggests we have put in a short term top (or very close to it) and will now consolidate before possibly completing one final small impulse higher OR put in a 1-2 Wave of a one higher degree. If the later occurs we could see the S&P north of 5500.
NOTE: To reiterate what I previously wrote - "the black labeled activity shown below, between now and July, looks like a "Killing Field", where the algos take Day Traders, "Dip Buyers", "Gamma Guys" and FOMO's all out on stretchers!" We are presently inclined to wait until late Q3 / early Q4 to potentially SHORT US equities.
|  | |
YOUR DESKTOP / TABLET / PHONE ANNOTATED CHART
Macro Analytics Chart Above: SUBSCRIBER LINK
| |
STOCK MONITOR: What We Spotted
| | | |
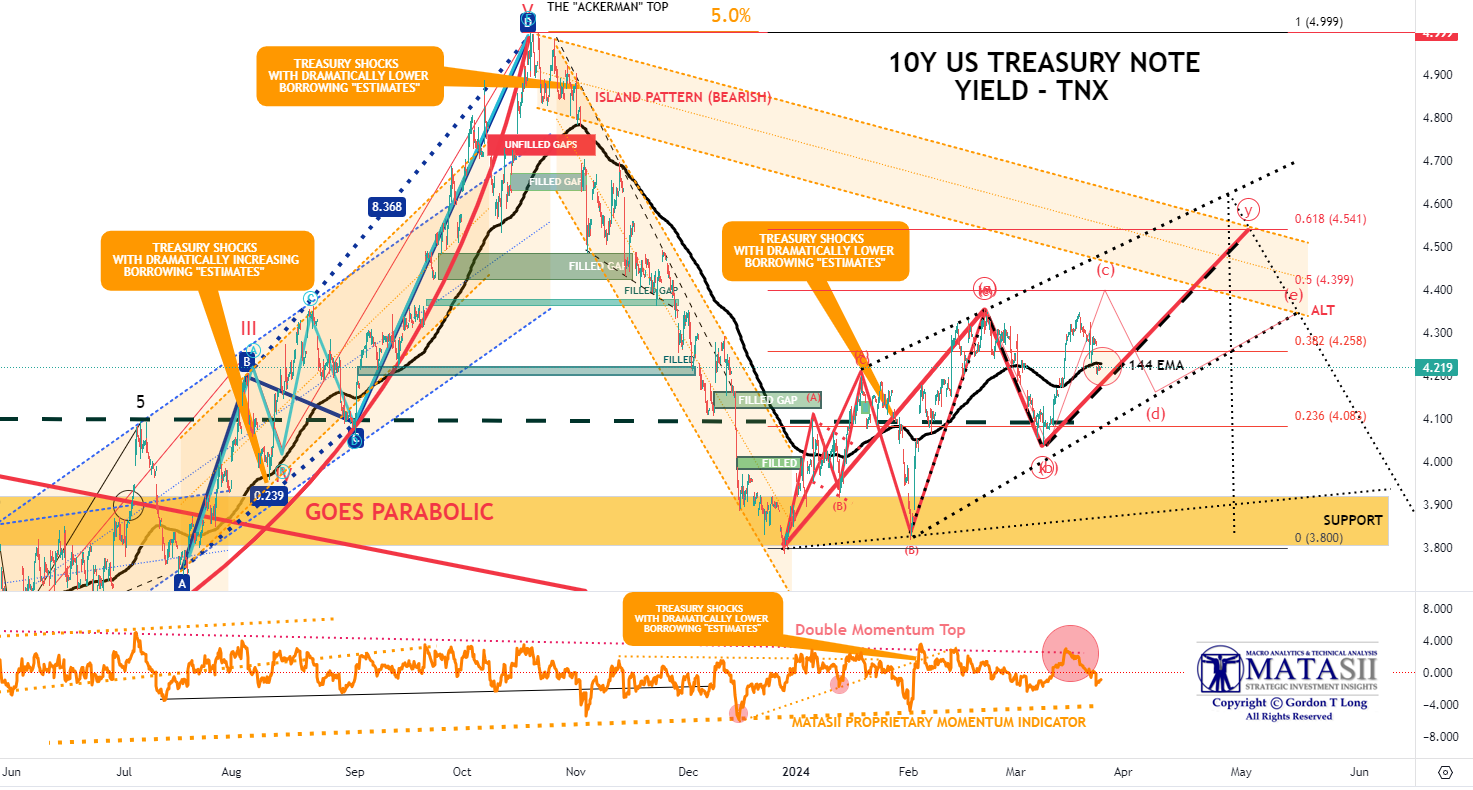
BOND MARKET
CONTROL PACKAGE
There are FIVE charts we have outlined in prior chart packages that we will continue to watch closely as a "control set".
- The 10Y TREASURY NOTE YIELD - TNX - HOURLY (CHART LINK)
- The 10Y TREASURY NOTE YIELD - TNX - DAILY (CHART LINK)
- The 10Y TREASURY NOTE YIELD - TNX - WEEKLY (CHART LINK)
- The 30Y TREASURY BOND YIELD - TNX - WEEKLY (CHART LINK)
- REAL RATES (CHART LINK)
FISHER'S EQUATION = 10Y Yield = 10Y INFLATION BE% +REAL % = 2.326% + 1.991% = 4.317%
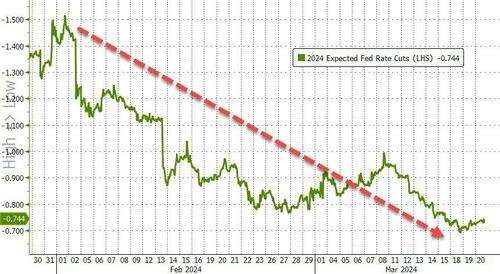
As rate-cut expectations fell from 6 this year to 3, Treasury yields rose... non-stop... all week with the belly of the curve underperforming (5Y yields up 28bps on the week). Yields all ended back up, below but near their year-to-date highs.
Wholesale Gasoline prices are rising and will soon be seen at the pumps. Service Inflation is sticky with upward pressure as are food prices. With Inflation Break-Evens rising and Y-o-Y inflation comparisons becoming harder we see potentially slightly higher bond yields before Year-End,
|  | |
YOUR DESKTOP / TABLET / PHONE ANNOTATED CHART
Macro Analytics Chart Above: SUBSCRIBER LINK
| |
NOTICE Information on these pages contains forward-looking statements that involve risks and uncertainties. Markets and instruments profiled on this page are for informational purposes only and should not in any way come across as a recommendation to buy or sell in these assets. You should do your own thorough research before making any investment decisions. MATASII.com does not in any way guarantee that this information is free from mistakes, errors, or material misstatements. It also does not guarantee that this information is of a timely nature. Investing in Open Markets involves a great deal of risk, including the loss of all or a portion of your investment, as well as emotional distress. All risks, losses and costs associated with investing, including total loss of principal, are your responsibility.
FAIR USE NOTICE This site contains copyrighted material the use of which has not always been specifically authorized by the copyright owner. We are making such material available in our efforts to advance understanding of environmental, political, human rights, economic, democracy, scientific, and social justice issues, etc. We believe this constitutes a ‘fair use’ of any such copyrighted material as provided for in section 107 of the US Copyright Law. In accordance with Title 17 U.S.C. Section 107, the material on this site is distributed without profit to those who have expressed a prior interest in receiving the included information for research and educational purposes. If you wish to use copyrighted material from this site for purposes of your own that go beyond ‘fair use’, you must obtain permission from the copyright owner.
========
| |
MATASII'S STRATEGIC INVESTMENT INSIGHTS | |
2020 VIDEOS OUTLINING THE COMING RISE IN INFLATION, STAGLFLATION & COMMODITY PRICES | |
IDENTIFICATION OF HIGH PROBABILITY TARGET ZONES | |
Learn the HPTZ Methodology!
Identify areas of High Probability for market movements
Set up your charts with accurate Market Road Maps
Available at Amazon.com
| |
The Most Insightful Macro Analytics On The Web | | | | |