|
LONGWave - APRIL 2024
Technical Analysis - 04/15/24
| |
CHINA IS A SEPTIC PROBLEM FOR THE BIDEN ADMINSTRATION
OBSERVATIONS: GET READY IN 2025 FOR TARIFFS AND TRADE WARS
PURELY OPTICS - Doomed-to-Failure
The rushed trip by Janet Yellen to meet with her Chinese counter-parts was billed to improve Sino-America relations. Festering, unresolved issues has been steadily deteriorating on multiple fronts, but her trip was billed to be focused on Trade Relations.
The Chinese have been pointedly clear that the US is the problem and there is little reason for wasted talks. A meeting seeking China to change its trade policies was simply not going to happen. (see below: RESEARCH - China Is Killing the Golden Goose).
The political optics therefore was to demonstrate to the US electorate that the Biden Administration was doing everything it could to achieve a working Trade relationship with China, before the inevitable collision resulting in much broadening Tariffs on Chinese consumer goods, not just the current tiffs on industrial and technology product and components.
PUBLIC PREPARATION FOR TARIFFS & RISING GOODS INFLATION
Tariffs and and heightened possibilities of escalating Chinese "Trade Wars" are now a real possibility. The result will be rising Consumer Goods prices in the US since China is a dominant supplier of almost everything in the average American home or apartment.
This will all be part of Wave 2 of US Inflation. - something that the US Consumer must be prepared for, or at least for the government to have demonstrated it did everything possible before bringing the "hammer down" on Tariffs after the election is over.
EVENTUALLY A FAILED US INDUSTRIAL POLICY WILL HIDE BEHIND CURRENCY MANIPULATION
Continued Inflation in the US, especially as it impacts the consumer, is a major problem in a 70% based economy. There is a strong likelihood that the US dollar will deteriorate as trade deficits increase, compounding the problem. Expect China to be accused of currency manipulation when the battle heats up. ===>
| |
|
THIS WEEK WE SAW
Exp=Expectations, Rev=Revision, Prev=Previous
US
US CPI rose a hotter than expected 0.4% MoM (equal highest since August 2023) and pushing it up 3.5% YoY. Energy and Services dominated the rise on a YoY basis (with the former flipping from YoY deflation).
Core CPI also rose more than expected (+0.4% MoM) pushing the YoY move up 3.8% (hotter than the 3.7% exp).
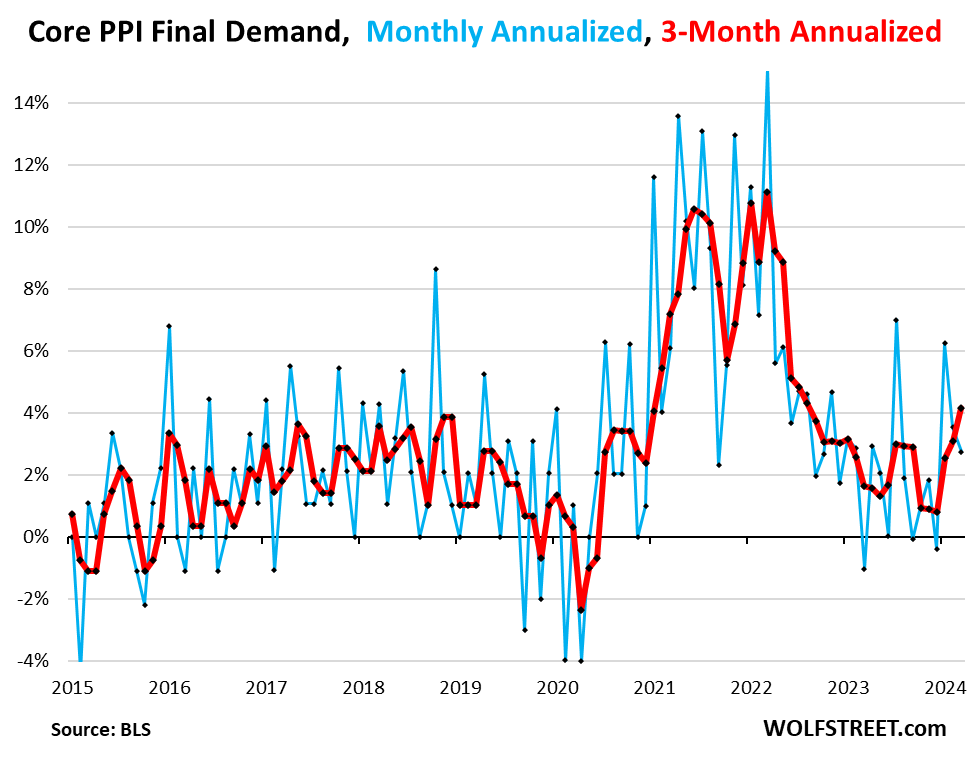
US PPI Final Demand YY (Mar) 2.1% vs. Exp. 2.2% (Prev. 1.6%)
US PPI ex-Food/Energy YY (Mar) 2.4% vs. Exp. 2.3% (Prev. 2.0%)
===> THE HIDDEN BEHIND THE SCENES OBJECTIVE
The hidden reason for the trip is to attempt to re-establish China as a Buyer of US Treasury Bonds or minimally to stop the unwinding of its Treasury holdings and reduce De-Dollarization efforts by the ever expanding BRICS-11 trading bloc. (see below: DEVELOPMENTS TO WATCH - Yellen's Rush Trip to China)
That was going to be a tough sell even for a political operative and manipulator of the proven stature of a Janet Yellen!
| |
========================= | |
|
WHAT YOU NEED TO KNOW!
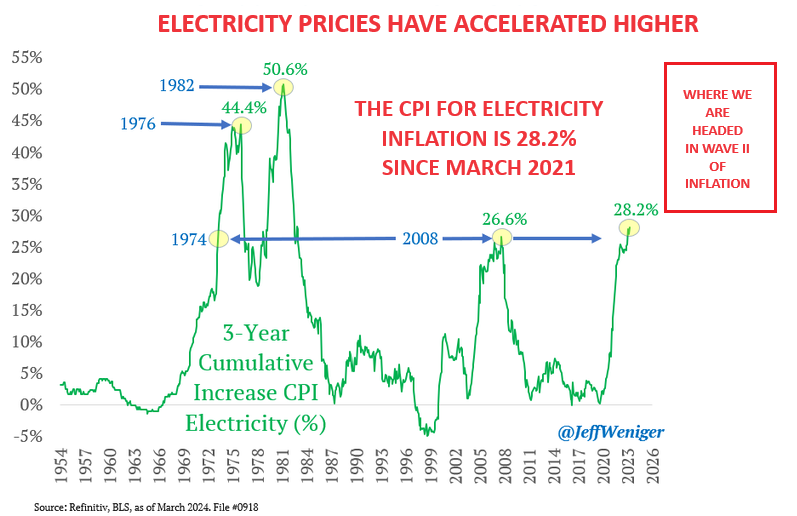
28.2% ELECTRICITY INFLATION
We all know that Food Inflation has totaled 20.1% during the Biden Presidency. What few (other than Home Owners) fully appreciate is that Bidenomics and its war of Energy has resulted in Electricity increasing by a cumulative total of 28.2%. Everything we do requires electricity, which means this increase, like a cancer, has metastasized throughout consumer pricing on almost everything!
Looking at Biden's record on hourly wages, cumulative hourly wage increases trail his Presidential Inflation Rate (PIR) by 2.8 percent. For Trump, hourly wages exceeded his PIR by 3.3 percent. The ability to pay your bills is the real pain threshold or what should be called the Misery Index!!
RESEARCH
CHINA IS KILLING THE GOLDEN GOOSE
- According to Janet Yellen: "China is now simply too large for the rest of the world to absorb this enormous capacity." -- "Actions taken by the PRC today can shift world prices. And when the global market is flooded by artificially cheap Chinese products, the viability of American and other foreign firms is put into question."
- The fact is when the Chinese Manufacturing Juggernaut reaches a point where it begins slowing the rate of economic growth of those countries buying its products, something happens. Job growth and wage growth slows in the consuming countries and with it Consumer demand growth slows as jobs are lost and competition disappears. This is effectively the slow starvation of the Chinese Golden Goose.
- The Chinese Strategy is currently to increase Production and go "up-scale" or to increase the production of higher value-add products. Until recently this has been the protected domain of the developed countries that allowed high paying jobs and consumption. Xi Jinping is very clear that is where they are going and will not be deterred.
- The US Strategy has increasingly become solely one of Tariffs and protective regulations.
- The strategy of both will only result in the mutual killing of the Golden Goose of global economic prosperity.
- We are on a collision course and is doomed to only result in heightened Global Conflict.
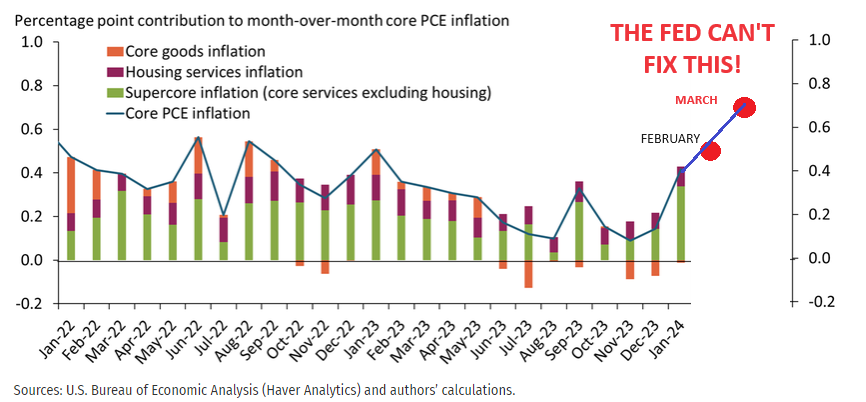
... BUT ... THE FED CAN'T CONTROL "SUPER CORE" INFLATION!
-
WHAT IS IT EXACTLY? - includes some of the most stubborn components of Services Inflation which are household necessities that are not taken out with the removal of housing, like: Car Insurance, Housing Insurance and Property Taxes.
-
HOW BAD IS IT: The Super Core Inflation has been roaring higher since January: Up 4.8% year-over-year in March; Up more than 8% on a 3-month annualized pace; Up 0.7% in March to push the yearly increase up to 4.8% from 4.4%; Highest level in 11 months.
-
WHY IS IT IMPORTANT: It Is seen as a proxy for labor costs. You’re not going to get to a sustained 2% Fed goal if you don’t get a key cooling in services prices. At this point it is simply not happening.
-
WHY CAN'T THE FED FIX IT?: It is like Taxation rising. The Fed simply has no direct control or short term influence over it.
| |
|
DEVELOPMENTS TO WATCH
YELLEN: A RUSH TRIP TO CHINA?
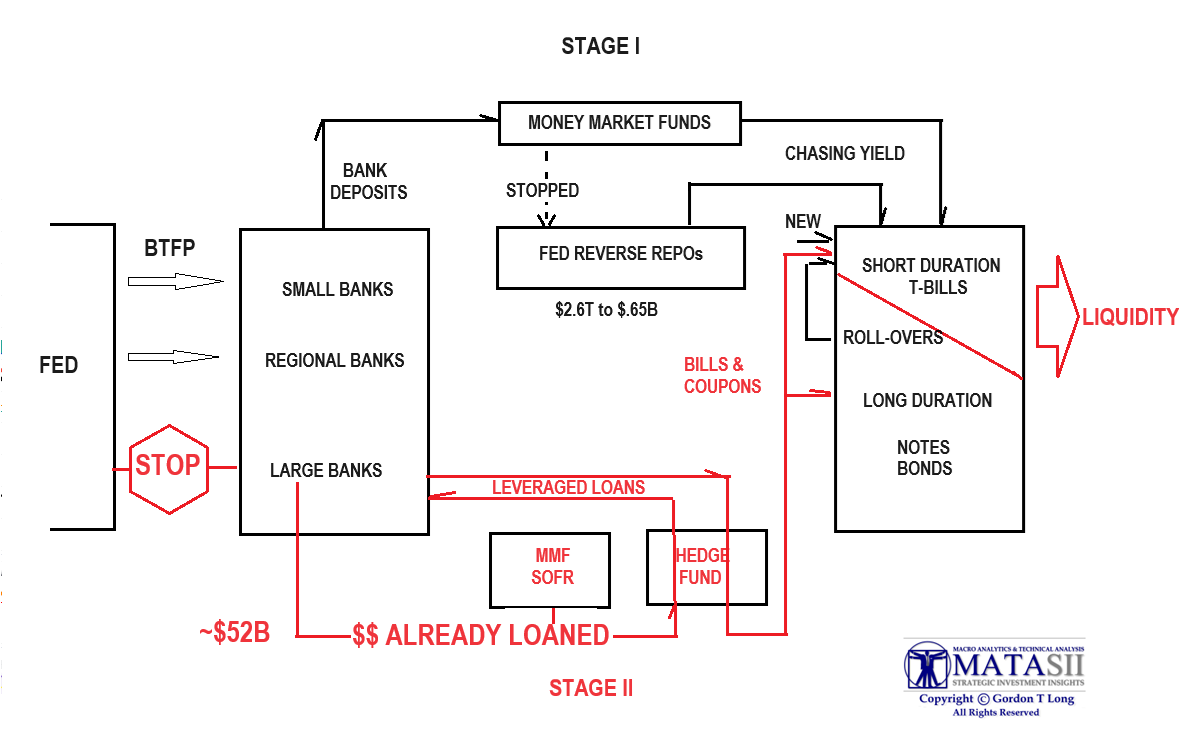
- Treasury Secretary Janet Yellen needs buyers of this debt and the vast amount of the existing $34T coming due and being rolled over. Though she has implemented Stage I and Stage II of her stealth Liquidity Gambit (chart below), the Reverse Repo balances are depleted and the BTLF arb is not going to keep flowing unless those Hedge Funds and Banks know that rates can be brought down or they will be potentially left holding massive unrealized capital losses.
- Ideally, Yellen needs China to buy US debt with its currency reserves, BUT minimally she needs to convince China to stop selling US Treasury holdings.
THE TELL: BANK'S SLR TO ELIMINATE US TREASURIES
- The new SLR rule change could allow banks to be an endless buyer of treasury debt.
- How convenient for the banks -- to be able to buy treasuries, take no haircut, and not have to worry about mark-to-market losses. All just in time, as issuances are taking on a life of their own!
- The Great Taking which we outlined in our Annual Thesis Paper: "The Regulatory Sate", revealed that the bond market is also fractionalized (not enough to go around with some bonds held on the books by more than one owner).
| |
|
GLOBAL ECONOMIC REPORTING
- MARCH CPI
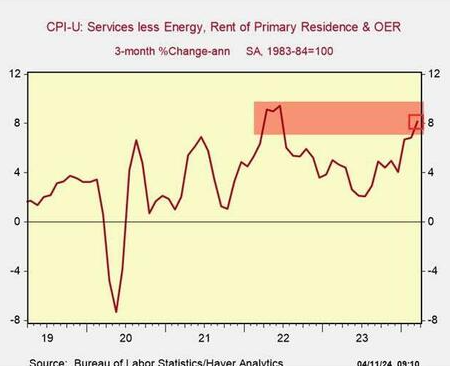
- Core CPI Services Ex-Shelter index - soared 0.7% MoM up to 5.0% YoY - the hottest since April 2023.
- The “SuperCore services CPI — “Core Services” without housing — jumped by 7.5% annualized in March from February, same red-hot increase as in the prior month, on top of the 11.6% spike in January. So it’s not just housing that drives services inflation.
- The six-month reading – six months to iron out the very volatile month-to-month readings – jumped by 6.4%, the highest since October 2022. This is really ugly.
- Core services price level - since March 2020, the core services CPI has increased by 19.4%.
- MARCH PPI
- The PPI, not absurdly seasonally adjusted, jumped by 6.2% annualized in March from February, though smaller spike than the 9.2% in February it was still a major disappointment
- The three-month rate, which irons out the month-to-month squiggles, jumped 7.8% annualized, the highest since June 2022.
| |
|
In this week's "Current Market Perspectives", we focus on the dramatic rise in Treasury Yields, gold & silver while overall equity markets weakened with a rising dollar and falling rates
========
| |
|
CHINA IS KILLING THE GOLDEN GOOSE
The US as a nearly 70% consumption economy and the Euro Zone as ~ 55% consumption economy are critical demand drivers of the Chinese manufacturing juggernaut.
However, when that juggernaut reaches a point where it begins slowing the rate of economic growth of those countries buying its products, something happens. Job growth and wage growth slows in the consuming countries and with it Consumer demand growth slows as jobs are lost and competition disappears. This is the slow starvation of the Golden Goose.
Has China potentially now reached such a point? Is this at the core root of China's current dilemma? Let's examine the possibility more closely.
The U.S. and partners—especially the European Union and also Japan—are concerned about China's manufacturing "overcapacity." President Joe Biden, Yellen said (in China) , would not allow another "China shock." After China's accession to the World Trade Organization in late 2001, the country flooded the U.S. and others with goods. The "shock" then resulted in the loss of 2 million American factory jobs.
"China is now simply too large for the rest of the world to absorb this enormous capacity," Yellen said on Monday. "Actions taken by the PRC today can shift world prices. And when the global market is flooded by artificially cheap Chinese products, the viability of American and other foreign firms is put into question."
Supply (China) v Demand (US)
First it is important to understand the reality that China is "Supply" drive. There was no shortage for its cheaper products and as such it is about increasing & broadening production and thereby supply. This reflects itself in the fact that Chinese economic growth is ~ 43% Gross Capital Formation built on Foreign Direct Investment (FDI). The margins on its products are razor thin and under continuous pressure due to increasing wage pressures resulting on rapid economic development. Its exports are huge, but so are its imports of supporting raw materials resulting in net export / imports being a small contributor to economic growth. The real value to China is in the employment of the 100s of millions of its workers in a country of 1.4B people.
The US on the other hand has become a country built on "Demand" or consumption. At nearly 70%, this is the primary driver of the US economy. A country where high wages and easy, affordable financing allows this consumption.
Supply = Production v Demand = Consumption
The ever expanding US Trade Deficit means the US consumes more than it produces. This difference must be financed. Until recently this hasn't been a problem, but with a staggering debt to GDP of 130% the financing of the debt is shrinking the available domestic capital stock, making it more dependent on foreign investment.
Production = Investment Capital -- Consumption = Financing, Jobs & Workers (Immigration)
The US needs foreign investment to allow the financing of consumption (Demand), while China needs foreign investment to finance Production (Supply).
Unbalanced due to Chinese Over-Production ("Over Capacity")
China's overcapacity is not the product of a mistake. It is the inevitable result of the Communist Party's economic system. There is a shortage of domestic demand due to Beijing's policies designed to depress consumption. Therefore, the country exports its excess industrial supply. Chinese goods depress prices in foreign markets, which results in foreign businesses failing.
"China creates overcapacity because giving money to bureaucrats and state-owned companies is what the system knows how to do," Anne Stevenson-Yang of J Capital Research USA said this week. "Building new factories makes it look like China is growing, even when demand is falling."
Both China and the US have enabled each other since China entered the World Trade Organization (WTO) in 2001. China adopted the proven export Mercantile strategy that Japan did. China took its rapidly expanding currency reserves and bought US Treasury Bonds to hold those reserves in. This made consumer financing rates in the US smaller (taking yields down), while also strengthening the dollar (making Chinese goods cheaper for Americans to buy). The strategy worked as it initially did for Japan.
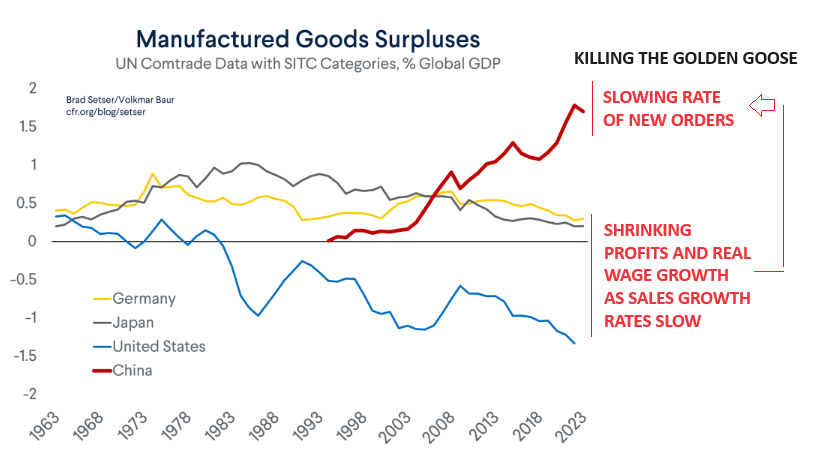
As the chart (above right) shows however, China's Supply has taken on such a commanding position in the world (the Manufacturer to the World) that it is now steadily stripping jobs from its export countries. The buyers of Chinese products are seeing their consumption being weakened as jobs and economic growth comes under pressure.
The Chinese Strategy
The Chinese Strategy to increase Production is to go "up-scale" or to increase the production of higher value-add products. Until recently this has been the protected domain of the developed countries that allowed high paying jobs and consumption. Xi Jinping is very clear that is where they are going and will not be deterred.
Xi Jinping is reluctant to reverse policies that depress consumption because that would offend key constituencies in the Communist Party as well as undermine the solvency of the banks, which underpin the Chinese economic system. Moreover, Xi does not want to empower consumers. Finally, he is intent on putting China on a wartime footing, which means he's determined to build even more industrial capacity.
The US Strategy has increasingly therefore become one of Tariffs and protective regulations.
The U.S. and partners—especially the European Union and also Japan—are concerned about China's manufacturing "overcapacity." President Joe Biden, Yellen said, would not allow another "China shock." After China's accession to the World Trade Organization in late 2001, the country flooded the U.S. and others with goods. The "shock" then resulted in the loss of 2 million American factory jobs.
"China is now simply too large for the rest of the world to absorb this enormous capacity," Yellen said on Monday. "Actions taken by the PRC today can shift world prices. And when the global market is flooded by artificially cheap Chinese products, the viability of American and other foreign firms is put into question."
The strategy of both will only result in the mutual killing of the Golden Goose of global economic prosperity.
We are on a collision course and is doomed to only result in heightened Global Conflict.
| |
|
... BUT ...THE FED CAN'T CONTROL "SUPER CORE" INFLATION!
WHAT IS IT EXACTLY?
- The gauge measures Services inflation excluding
- Food
- Energy
- Housing
- But Core includes some of the most stubborn components of Services Inflation which are household necessities that are not taken out with the removal of housing, like:
- Car Insurance
- Housing Insurance
- Property Taxes
| |
|
HOW BAD IS IT
- The Super Core Inflation has been roaring higher since January:
- Up 4.8% year-over-year in March
- Up more than 8% on a 3-month annualized pace
- Up 0.7% in March to push the yearly increase up to 4.8% from 4.4%
- Highest level in 11 months
WHY IS IT IMPORTANT?
- Economists look at the core CPI, which excludes volatile food and energy prices, to find the true trend. The super core gauge, which also excludes shelter and rent costs from its services reading, takes it even a step further. Fed officials say it is useful in the current climate as they see elevated housing inflation as a temporary problem and not as good a measure of underlying prices.
- It Is seen as a proxy for labor costs,
- It is the single largest expense for service companies such as hotels, hospitals, banks, retailers and the like.
- It gives another view into the relationship between the price of goods and services and the level of consumer income. If prices for goods and services increase over time, but consumer income doesn't change, consumers will have less purchasing power.
- It is the most labor intensive and therefore especially sensitive to nominal wage increases. Although nominal wage increases moderated during 2023, they remain above their pre-pandemic levels, continuing to put upward pressure on super core inflation.
- You’re not going to get to a sustained 2% Fed goal if you don’t get a key cooling in services prices. At this point it is simply not happening.
WHY CAN'T THE FED FIX IT?
- It is like Taxation rising. The Fed simply has no direct control or short term influence over it.
- The problem for the Fed lies in the differing macroeconomic backdrop of demand-driven inflation and robust stimulus payments that equipped consumers to beef up discretionary spending in 2021 and 2022 while also stoking record inflation levels.
- Today the picture is more complicated because some of the most stubborn components of services inflation are household necessities like car and housing insurance as well as property taxes.
- They are so scared by what happened in 2021 and 2022 that we’re not starting from the same point as we have on other occasions. The problem is, if you look at all of this together, these are not discretionary spending items and it puts them between a rock and a hard place.
- Further complicating the backdrop is a dwindling consumer savings rate and higher borrowing costs, which make the central bank more likely to keep monetary policy restrictive until something breaks.
- The Fed will have a hard time bringing down inflation with more rate hikes because the current drivers are stickier and not as sensitive to tighter monetary policy, The recent upward moves in inflation are more closely analogous to tax increases.
- Though the Fed is still far removed from hiking interest rates further, doing so will remain a possibility so long as inflation remains elevated above the 2% target.
- The question could become are we looking at something that’s becoming entrenched here? At some point, the possibility of rate hikes comes back into focus.
| |
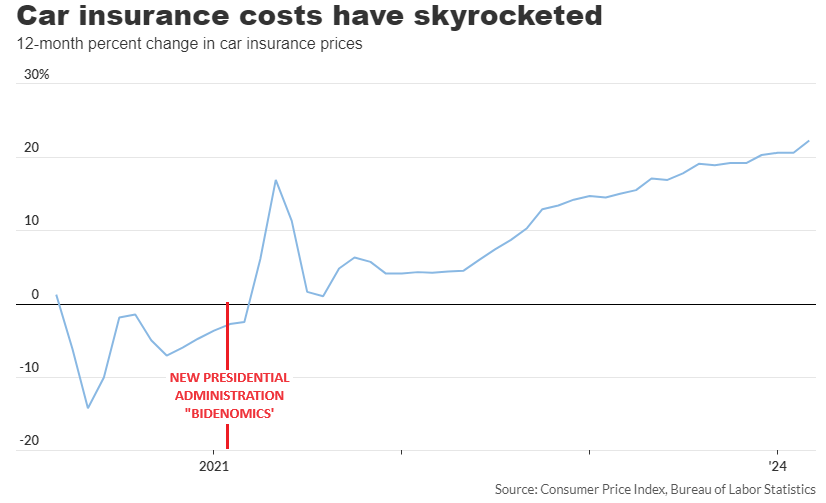
EXAMPLE: CAR INSURANCE
- INSURANCE: Skyrocketing auto insurance costs helped contribute to inflation accelerating at a faster-than-expected pace in March.
- On a monthly basis, car insurance prices as part of the consumer price index rose by an unadjusted 2.7%, while the year-over-year increased by 22.2%, according to data released Wednesday.
- However, the increase is 24%, an all-time record high according to the independent Insurify, as reported at CarEdge.com .
- The rising price of car parts, a shortage of body-shop workers and an increase in claims due to extreme weather have all played a role in driving up insurance rates for consumers.
- The average cost of full-coverage car insurance rose to more than $2,500 this year, according to Bankrate. That’s an increase of 26% over last year.
- The rise in insurance costs is in addition to:
- VEHICLE PRICES: Historically high prices for new and used vehicles since the coronavirus pandemic
- REPAIRS: Rising costs to repair vehicles. Prices for motor-vehicle maintenance and repairs in March were up 8.2% from last year, according to the CPI report.
Instead of having to replace a plastic or steel bumper on many vehicles, a simple fender bender can now damage cameras, proximity sensors and varying other technologies used for newer safety features and tools such as cruise control, parking and emergency braking.
Repair costs were increasing at an annual rate of about 3.5% to 5% prior to the coronavirus pandemic. As of 2022, the increases have been at 10% or above, with the average repairable estimate for a vehicle at $4,721 in 2023.
Premiums have been on the rise because the cost of what goes into auto insurance has also been rising, All of the technology that we’ve come to rely on makes makes the replacement or repair of these vehicles really, really costly.
Auto insurers lost an average of 12 cents on every dollar of premium they collected in 2022 — the worst performance in more than 20 years — leading them to raise rates at the expense of customer satisfaction.
NOTE: State regulatory filings have to be based on actuarial loss trends in Insurance rate applications in each state, since vehicle insurance is mandatory in almost every state.
| |
|
DEVELOPMENTS TO WATCH
YELLEN: A RUSH TRIP TO CHINA!
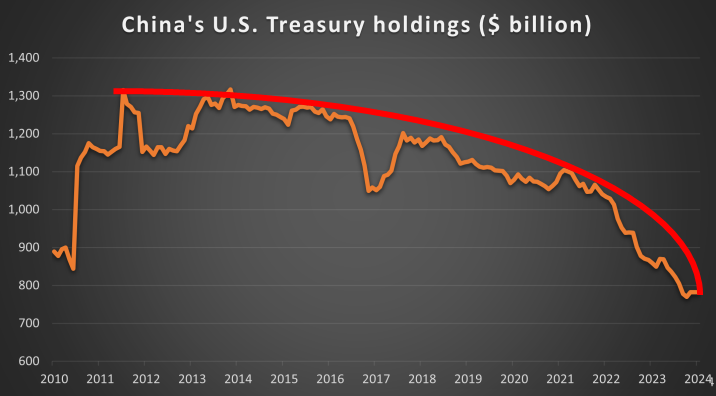
As of January 2024, China owned $797.7 billion in U.S. Treasuries, which is roughly 10% of the U.S. national debt. This is the lowest share of outstanding Treasuries in 22 years, and down from the record 14% in 2011. As the chart to the right illustrates, the problem is only getting worse and at a faster rate.
This couldn't come at a worse time with the US Treasury needing to finance unprecedented spending deficits. The US deficit estimates only mid-year into the current fiscal year are presently estimated to be between $1.5 - $2.1 TRILLION.
Treasury Secretary Janet Yellen needs buyers of this debt and the vast amount of the existing $34T coming due and being rolled over. Though she has implemented Stage I and Stage II of her stealth Liquidity Gambit (chart below), the Reverse Repo balances are depleted and the BTLF arb is not going to keep flowing unless those Hedge Funds and Banks know that rates can be brought down or they will be potentially left holding massive unrealized capital losses.
| |
MINIMALLY YELLEN NEEDS TO STOP CHINA FROM SELLING US TREASURY BOND DEBT!
Ideally, Yellen needs China to buy US debt with its currency reserves, BUT minimally she needs to convince China to stop selling US Treasury holdings.
If she can't do that, she needs to convince China to assist in slowing the rapidly expanding and powerful BRICS-11 trade consortium to reduce its De-Dollarization strategies in the near term. She needs to convince everyone it is in their best interest.
Yellen is also acutely aware that, when the Fed does finally pivot and starts reducing rates, it will place downward pressure on the dollar making US imported goods more expensive and basically importing inflation. She needs an agreement that China, which maintains its currency against the US, reacts constructively when the US begins placing fully expected Tariffs on Chinese imports.
Not an easy sell!!!
AN URGENT MEETING REQUIRED
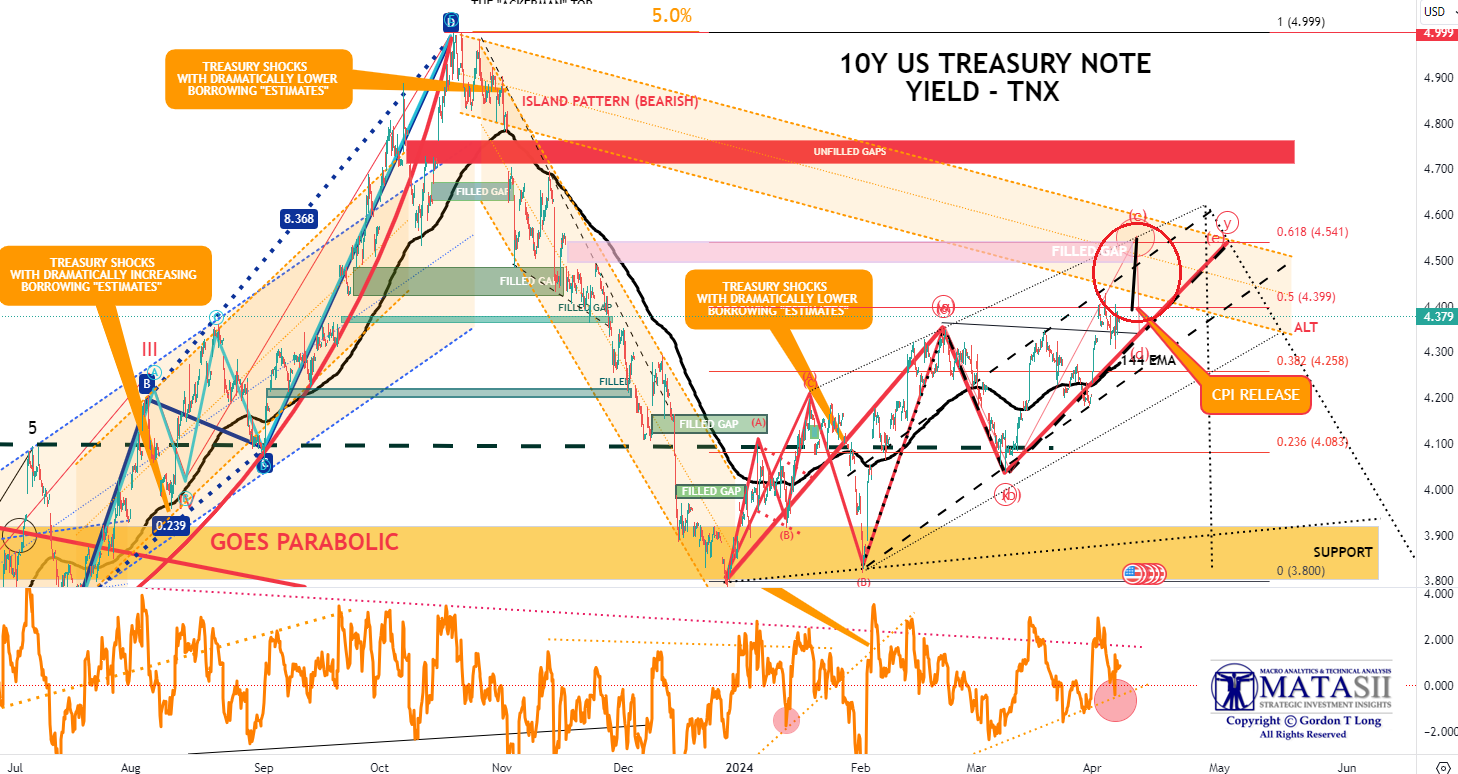
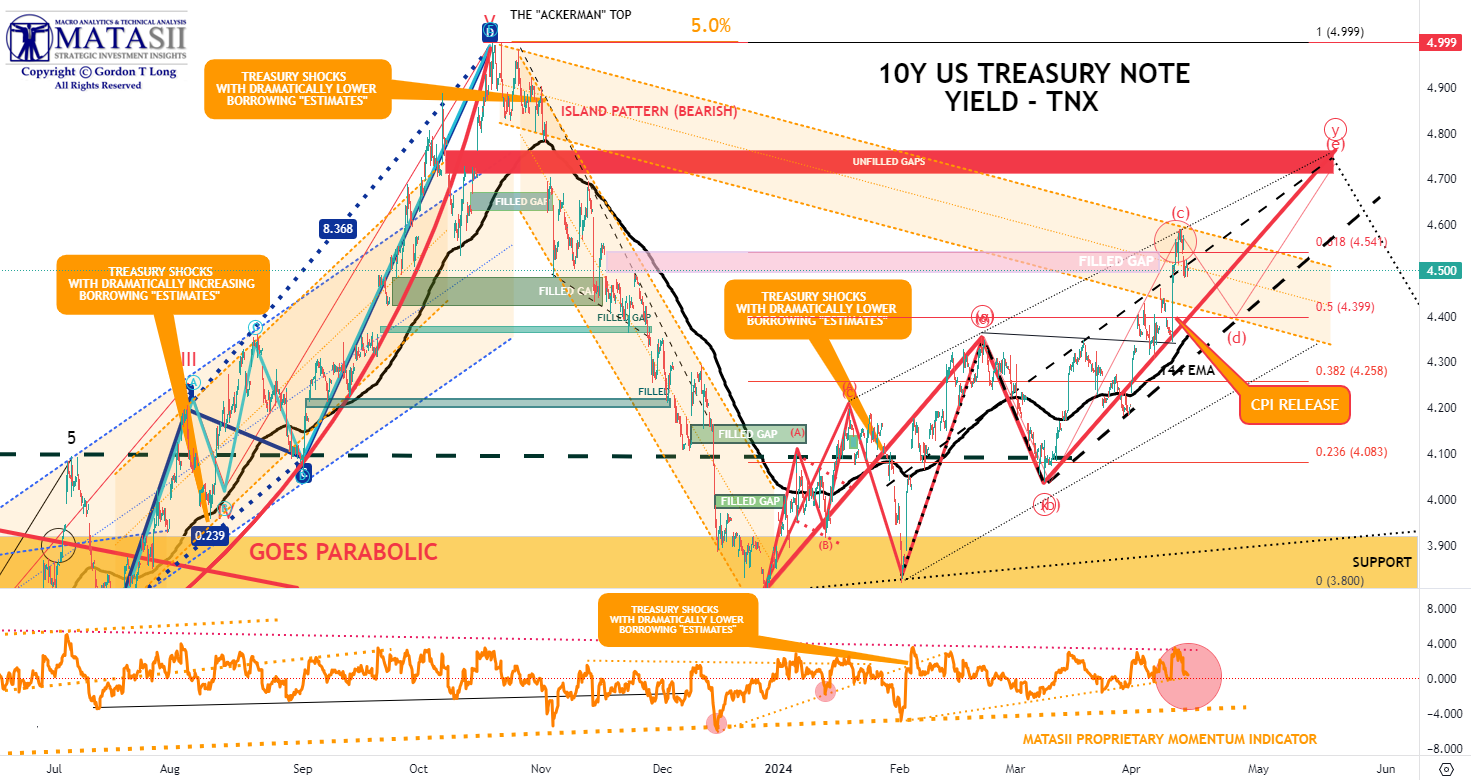
Every 4 months or three times a year Yellen must release the expected treasury offerings that will be available during the next cycle of Treasury Auctions. As the 10Y US Treasury Yield chart below illustrates, every time this document is issued, (see the three orange bubbles on the left), it instigated a sustained trend direction. Yellen needs the next release due soon to initiate a downward trend to take the load off debt interest payments and insure the auctions deliver the buyers needed.
The real reason for the "CAP-IN-HAND" urgent trip to China, is that inflation is only soon to work against
lower rates and she needs China's help!
| |
We wish her all the best in her charm offensive but we expect it to only end badly. The best she is likely to extract is to buy a little time until after the upcoming Presidential election. | |
|
THE TELL: BANK'S SLR TO ELIMINATE US TREASURIES
The latest game of trickery being "trailed" is to eliminate treasury holdings from the SLR (Supplemental Liquidity Ratio) calculation, which is used to determine how much banks need to set-aside to help “manage risk”.
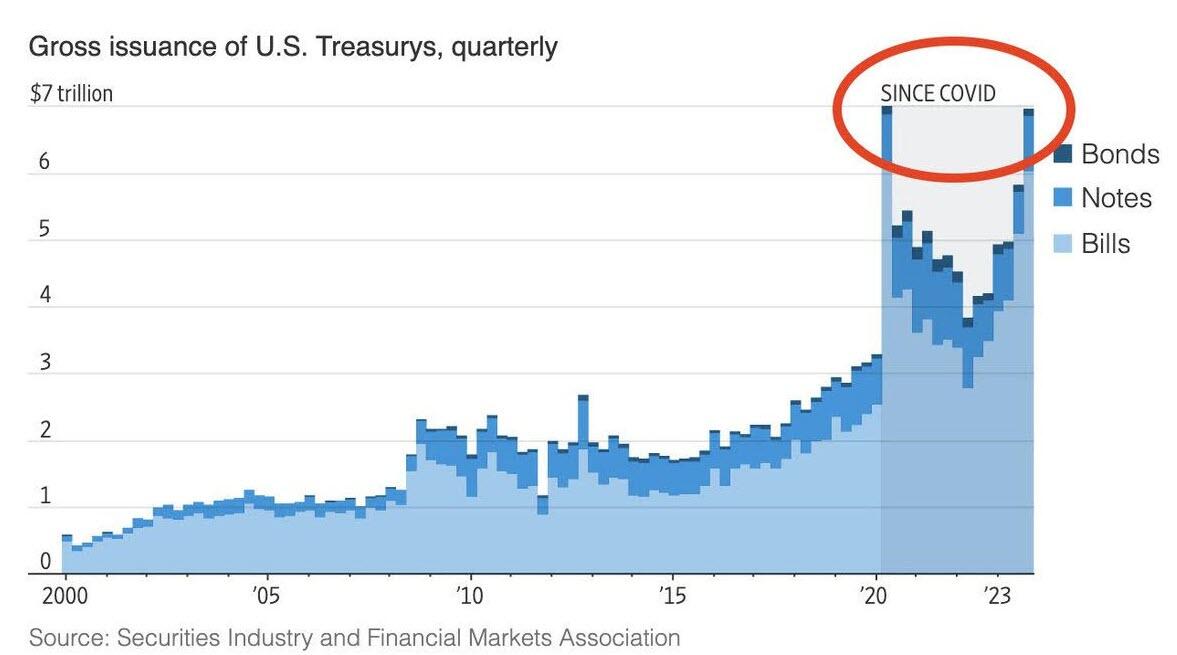
Though we supposedly have a strong economy, the Treasury is selling/issuing bonds at a rate last seen during the Covid crisis.
The new SLR rule change could allow banks to be an endless buyer of treasury debt.
How convenient for the banks -- to be able to buy treasuries, take no haircut, and not have to worry about mark-to-market losses. All just in time, as issuances are taking on a life of their own! The Great Taking which we outlined in our Annual Thesis Paper: "The Regulatory Sate", revealed that the bond market is also fractionalized (not enough to go around/some bonds held on the books by more than one owner).
It is increasingly sounding like a risky proposition to keep calling our government bonds “pristine collateral” or “risk-free”, or a “safe-haven assets”. Maybe we should call them what they are - not Bonds - but rather "Bombs"!
| |
|
GLOBAL ECONOMIC INDICATORS: What This Week's Key Global Economic Releases Tell Us
MARCH CPI
Headline CPI was expected to slow modestly in March (from +0.4% MoM to +0.3% MoM), but obviously still rising. However, it did not, rising a hotter than expected 0.4% MoM (equal highest since August 2023) and pushing it up 3.5% YoY.
- Energy and Services dominated the rise on a YoY basis (with the former flipping from YoY deflation).
- Core CPI also rose more than expected (+0.4% MoM), pushing the YoY move up 3.8% (hotter than the 3.7% exp).
- Within the core index, goods costs continue to deflate on a YoY basis, but services are re-accelerating.
- The surge was led by Energy & Shelter costs.
- The index for shelter rose in March, as did the index for gasoline. Combined, these two indexes contributed over half of the monthly increase in the index for all items.
- The shelter index increased 5.7 percent over the last year, accounting for over sixty percent of the total 12-month increase in the all items less food and energy index.
Consumer prices have not fallen in a single month since President Biden's term began, (July 2022 was the closest with 'unchanged'), which leaves overall prices up over 19% since Bidenomics was unleashed. And prices have never been more expensive. That is an average of 5.6% per annum (more than triple the 1.9% average per annum rise in price during President Trump's term).
So, about that shrinkflation - did companies only 'get greedy' when Biden took office?
SUPERCORE CPI IS RED HOT!
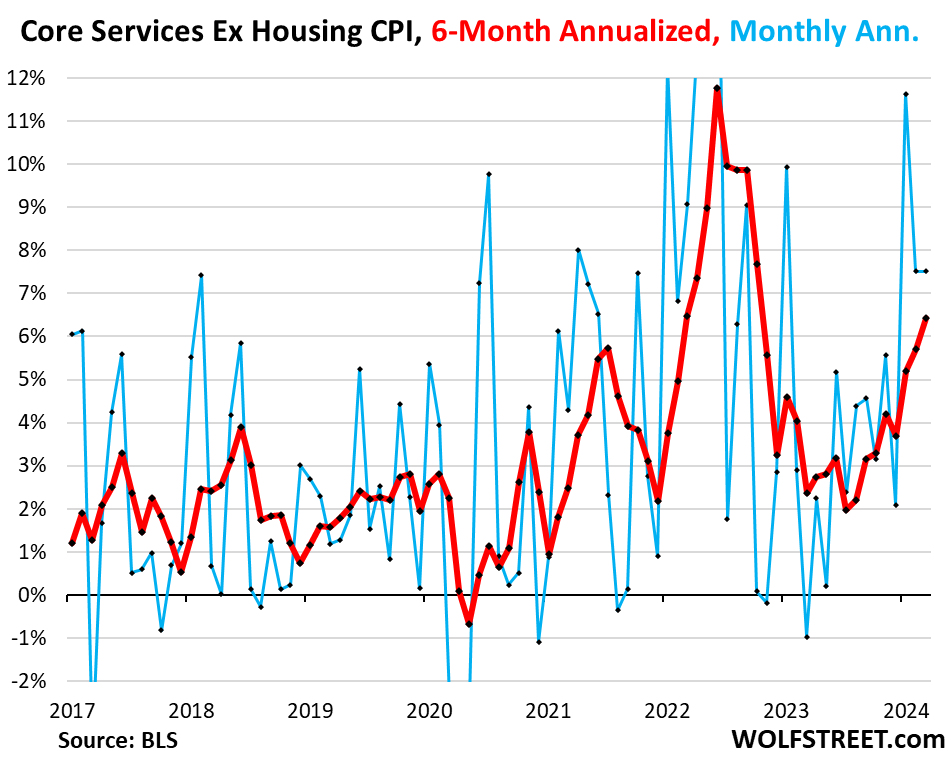
SuperCore: Core CPI Services Ex-Shelter index - soared 0.7% MoM up to 5.0% YoY - the hottest since April 2023. The “SuperCore services CPI — “Core Services” without housing — jumped by 7.5% annualized in March from February, same red-hot increase as in the prior month, on top of the 11.6% spike in January. So it’s not just housing that drives services inflation.
(Chart Right Above) The six-month reading – six months to iron out the very volatile month-to-month readings – jumped by 6.4%, the highest since October 2022. This is really ugly.
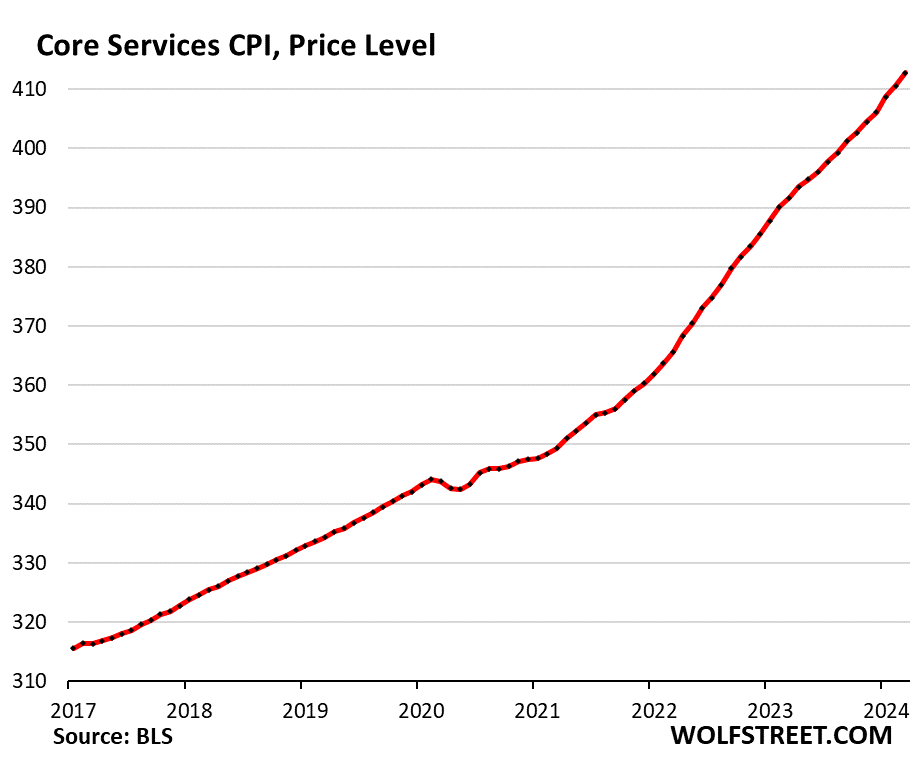
(Chart Below) Core services price level - since March 2020, the core services CPI has increased by 19.4%. This chart shows the core services CPI as index value, not as percentage-change of that index value. Note how the curve of price levels has become steeper in recent months.
| |
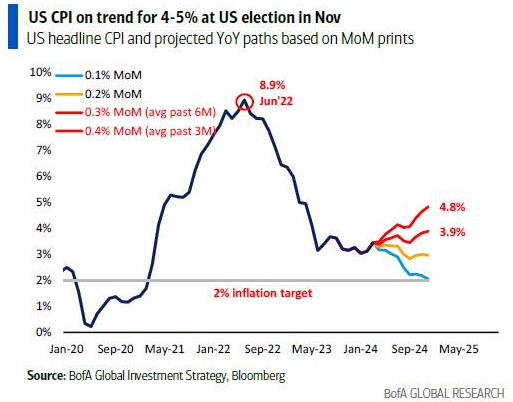
Are we going to see a replay on the '70s? | 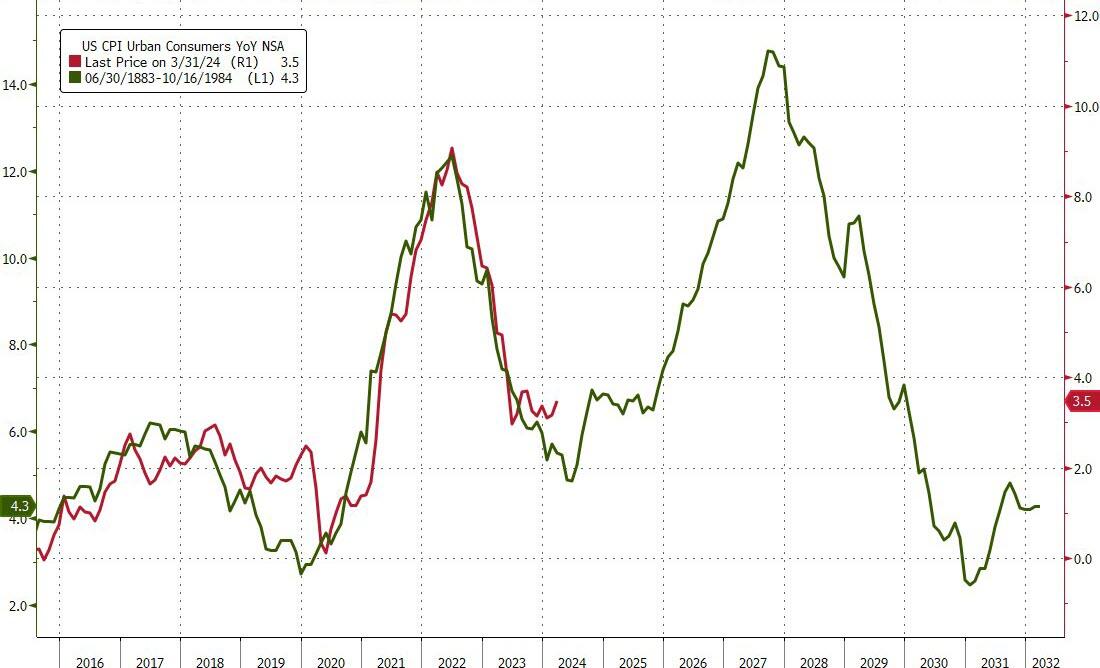 | |
MARCH PPI
- US PPI Final Demand YY (Mar) 2.1% vs. Exp. 2.2% (Prev. 1.6%)
- US PPI ex Food/Energy YY (Mar) 2.4% vs. Exp. 2.3% (Prev. 2.0%)
The PPI data overall was cooler than expected with the headline Y/Y rising 2.1% (exp. 2.2%) but accelerating from the 1.6% prior, with the M/M rising 0.2%, beneath the 0.3% forecast but down from the 0.6% in February.
- Core PPI however was above forecast Y/Y at 2.4% (exp. 2.3%), while the M/M was in line at 0.2%.
- The super core, ex-food, energy and trade, matched the prior pace Y/Y while M/M eased to 0.2% from 0.4%.
- The data was a sigh of relief after the fiery CPI report on Wednesday, while analysts are now starting to compile their PCE forecasts based on the now available data.
- Core PCE, the Fed's preferred gauge of inflation, is currently expected to come in between 0.2-0.3% M/M in March, vs the 0.3% in February - perhaps something not too worrisome despite the initial post-CPI fears.
- Nonetheless, it is clear that inflation progress is slowing, putting the onus on the Fed to push back rate cuts, as money markets have already done.
| |
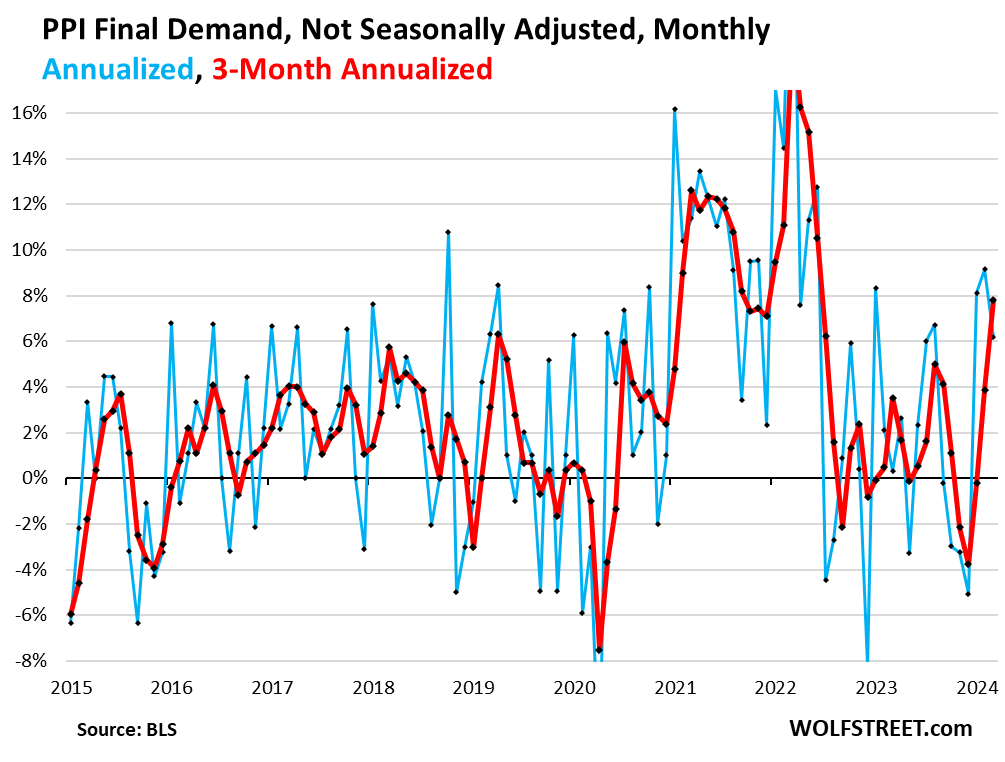
SEASONAL ADJUSTMENTS IN MARCH WERE HUGE!
Those seasonal adjustments in March were far larger than in the Marches during the years before the pandemic. So we will look at the seasonally adjusted PPI and at the not-seasonally adjusted PPI. And we will see that the seasonal adjustments this March were much bigger than in the five years before the pandemic, likely skewed by the distortions during the pandemic that then became part of the base for current seasonal adjustments.
The PPI, not seasonally adjusted, jumped by 6.2% annualized in March from February, which was a smaller spike than the 9.2% in February.
The three-month rate, which irons out the month-to-month squiggles, jumped 7.8% annualized, the highest since June 2022. You can see from the blue line how crazy volatile the non-seasonally adjusted data is. The three-month rate irons out only some of that volatility (red).
| |
|
NOTE: We would be amiss not to mention Tyler Durden's scathing attack of the BLS' "gaslighting" of the PPI (but yet another example of the manipulation going on with government economic statistics reporting).
Biden's Bureau of Gaslighting Services writes that "leading the March decline in the index for final demand goods, prices for gasoline decreased 3.6 percent."
Hold on a second, didn't we just show that gas prices - actual, real gas prices, which everyone across the country has to pay - rose by 6% in March? Yes we did, but what we didn't anticipate is the amount of BS Biden's henchmen are willing to shove down our throats. And indeed, to understand how gasoline could possibly drop by 3.6% in a month where it rose over 6%, we have to look at the category description, where we find the little trick beloved by propaganda ministries everywhere: "seasonally adjusted."
That's right, as shown in the chart below, according to the BLS, the seasonally-adjusted gas price in March magically dropped by 3.6% even though the unadjusted, as in real, gas price rose by 6.3%, exactly what the AAA also reported in its daily summary of what gas prices across the US truly are.
Now, for those wondering "did I pay 3.6% less or 6.3% more for gas in March?", we have the answer and unfortunately it is the one that leaves less money in your pocket (it always is). But for the BLS, the seasonal adjustment in this one category which actually soared, meant all the difference in the world because - you see - if Biden's propaganda ministers had used the real gas price, PPI would have been 0.4% higher and risen 2.4% YoY, both blowing away estimates, sending stocks tumbling, and making it impossible to manipulate the OER and shelter inflation data in next month's CPI to come up with a big miss (the current plan).
And that, ladies and gentlemen, is literally "gas-lighting."
Finally, for those asking if you can pay seasonally adjusted taxes (lower of course) using your seasonally adjusted checking account balance (higher of course), we suggest you try it. Just make sure you first have a good plan how to survive Bubba's nightly foreplay for all the years you will spend in prison right after.
| |
|
GLOBAL MACRO
WHAT DOES YOUR SCAN OF THE DATA BELOW TELL YOU? - THE MEDIA AVOIDS BAD NEWS!
We present the data in a way you can quickly see what is happening.
THIS WEEK WE SAW
Exp=Expectations, Rev=Revision, Prev=Previous
| |
|
UNITED STATES
- US Non-Farm Payrolls (Mar) 303k vs. Exp. 200k (Prev. 275k, Rev. 270k)
- US Unemployment Rate (Mar) 3.8% vs. Exp. 3.9% (Prev. 3.9%)
- US Average Earnings YY (Mar) 4.1% vs. Exp. 4.1% (Prev. 4.3%)
- US PPI Final Demand YY (Mar) 2.1% vs. Exp. 2.2% (Prev. 1.6%)
- US PPI ex-Food/Energy YY (Mar) 2.4% vs. Exp. 2.3% (Prev. 2.0%)
- US Initial Jobless Claims w/e 211k vs. Exp. 215k (Prev. 221k, Rev. 222k)
- US Continued Jobless Claims w/e 1.817M vs. Exp. 1.800M (Prev. 1.791M, Rev. 1.789M)
CHINA
- Chinese FX Reserves (USD)(Mar) 3.25T vs Exp. 3.21T (Prev. 3.23T).
- Chinese CPI MM (Mar) -1.0% vs. Exp. -0.5% (Prev. 1.0%)
- Chinese CPI YY (Mar) 0.1% vs. Exp. 0.4% (Prev. 0.7%)
- Chinese PPI YY (Mar) -2.8% vs. Exp. -2.8% (Prev. -2.7%)
- China March Trade (USD): Balance 58.55bln (exp. 70.2bln); Exports -7.5% Y/Y (exp. -2.3%); Imports -1.9% Y/Y (exp. -2.3%)
JAPAN
- Japanese Labor Cash Earnings YY (Feb) 1.8% vs Exp. 1.8% (Prev. 2.0%)
- Japanese Corp Goods Price MM (Mar) 0.2% vs. Exp. 0.3% (Prev. 0.2%)
- Japanese Corp Goods Price YY (Mar) 0.8% vs. Exp. 0.8% (Prev. 0.6%, Rev. 0.7%)
UK
- UK BRC Retail Sales YY (Mar) 3.2% (Prev. 1.0%)
- UK BRC Total Sales Y/Y (Mar) 3.5% (Prev. 1.1%)
- US NFIB Business Optimism Index (Mar) 88.5 (Prev. 89.4)
- UK RICS House Price Balance (Mar) -4 vs. Exp. -6 (Prev. -10); RICS Housing Survey (Mar) -4.0 vs. Exp. -6.0 (Prev. -10.0, Rev. -10)
AUSTRALIA
- Australian Westpac Consumer Sentiment Index (Apr) 82.4 (Prev. 84.4)
- Australian Westpac Consumer Sentiment M/M (Apr) -2.4% (Prev. -1.8%)
- Australian NAB Business Confidence (Mar) 1.0 (Prev. 0.0)
- Australian NAB Business Conditions (Mar) 9.0 (Prev. 10.0)
- Australian NAB Business Confidence (Mar) 1.0 (Prev. 0.0); Conditions (Mar) 9.0 (Prev. 10.0)
| |  |
|
EU
- EU Sentix Index (Apr) -5.9 vs. Exp. -8.5 (Prev. -10.5)
GERMANY
- German Industrial Output MM (Feb) 2.1% vs. Exp. 0.3% (Prev. 1.0%)
- German Trade Balance, EUR, SA (Feb) 21.4B vs. Exp. 25.5B (Prev. 27.5B); Imports MM SA 3.2% vs. Exp. -1.0% (Prev. 3.6%, Rev. 3.3%); Exports MM SA -2.0% vs. Exp. -0.5% (Prev. 6.3%)
- German Trade Balance SA (EUR)(Feb) 21.4B vs. Exp. 25.5B (Prev. 27.5B, Rev. 21.4B)
- German Exports MM SA (Feb) -2.0% vs. Exp. -0.5% (Prev. 6.3%)
- German Imports MM SA (Feb) 3.2% vs. Exp. -1.0% (Prev. 3.6%, Rev. 3.3%)
- German Industrial Output MM (Feb) 2.1% vs. Exp. 0.3% (Prev. 1.0%, Rev. 1.3%)
ITALY
- Italian Retail Sales SA MM (Feb) 0.1% (Prev. -0.1%); NSA YY (Feb) 2.4% (Prev. 1.0%)
- Italian Industrial Output YY WDA (Feb) -3.1% (Prev. -3.4%); Industrial Output MM SA (Feb) 0.1% vs. Exp. 0.5% (Prev. -1.2%)
SWITZERLAND
- Swiss Unemployment Rate Adjusted (Mar) 2.3% vs. Exp. 2.2% (Prev. 2.2%); Unadjusted (Mar) 2.4% (Prev. 2.4%)
NORWAY
- Norwegian Core Inflation YY (Mar) 4.5% vs. Exp. 4.7% (Prev. 4.9%); MM (Mar) 0.2% vs. Exp. 0.4% (Prev. 0.4%)
- Norwegian CPI YY (Mar) 3.9% vs. Exp. 4.2% (Prev. 4.5%); MM (Mar) 0.2% vs. Exp. 0.5% (Prev. 0.2%)
- Norwegian GDP Month Mainland (Feb) -0.2% vs. Exp. 0.1% (Prev. 0.4%)
SWEDEN
- Swedish Reg Unemployment Rate (Mar) 6.7% (Prev. 6.8%); Money Market CPIF Inflation 1-Year (Apr) 2.0% (Prev. 2.0%); Money Mkt CPIF Inflation 5-Years (Apr) 2.0% (Prev. 2.0%)
HUNGARY
- Hungarian CPI YY 3.6% vs. Exp. 3.6% (Prev. 3.7%)
SINGAPORE
- Singapore GDP QQ (Q1 P) 0.1% vs Exp. 0.6% (prev. 1.2%)
- Singapore GDP YY (Q1 P) 2.7% vs Exp. 2.9% (prev. 2.2%)
| |
CURRENT MARKET PERSPECTIVE | |
|
INFLATION WORRY RE-IGNITED
YIELDS FOLLOW GOLD, SILVER, OIL AND BITCOIN (MUCH) HIGHER!
Click All Charts to Enlarge
| |
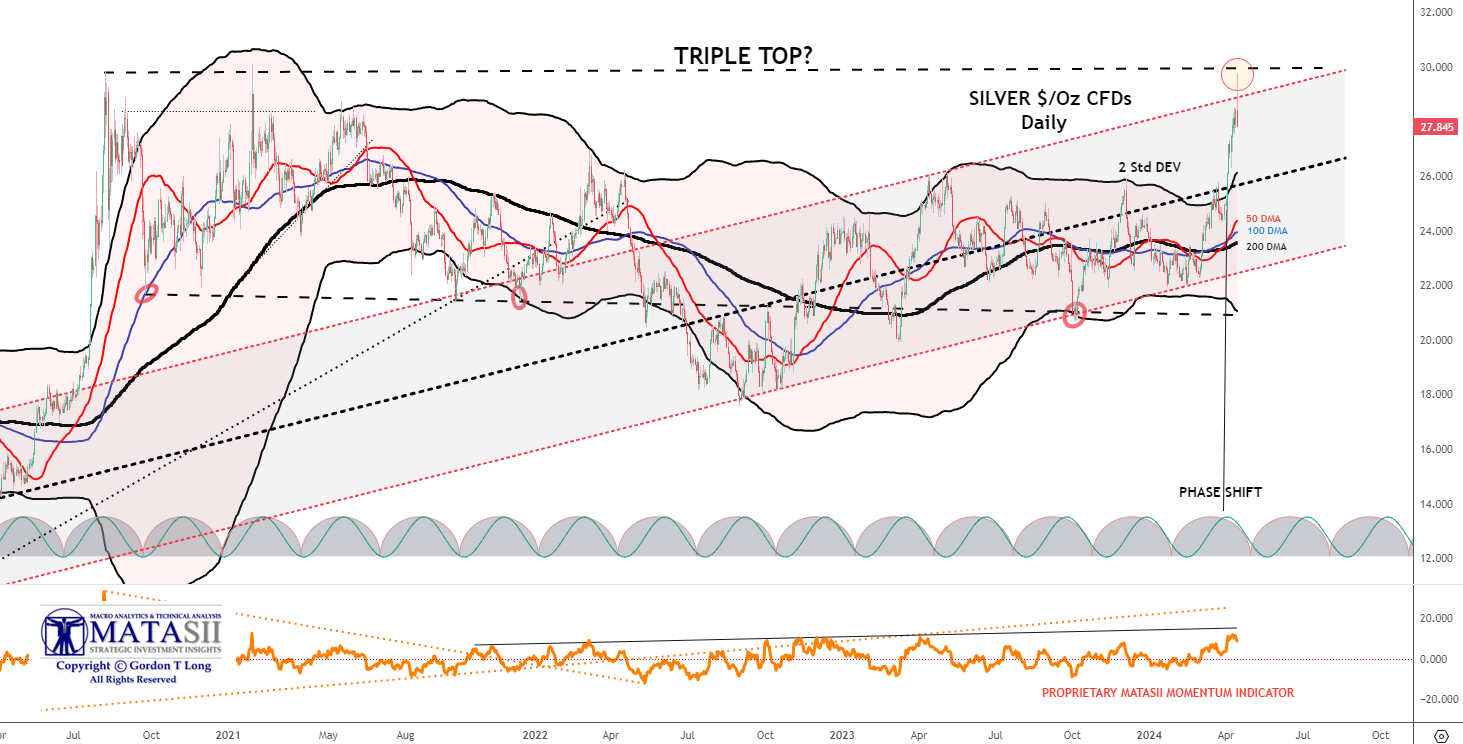
SILVER: Silver following Gold higher (and other Inflation hedges) to new highs! | |
|
1 - SITUATIONAL ANALYSIS
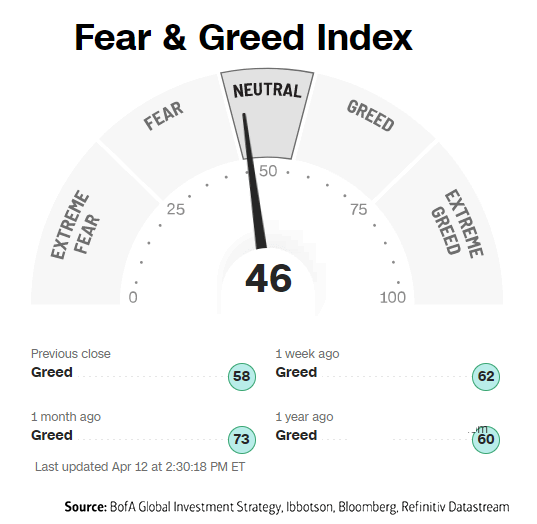
SENTIMENT "ADJUSTING"!
Last week with the Fear & Greed Index down to a reading of 61 we said: "We have seen some degree of market weakness over the last week as the S&P 500 tested the 21 DMA for support. It appears that increasing numbers of investors are nervous about some degree of pullback after a historic run-up without any real corrective consolidation.
The Fear & Greed Index reflects this as it has lowered quite noticeably though registering a Greed reading."
This week we see the Fear & Greed index down to 46, a neutral reading and the S&P 500 lower at its 50 DMA level.
As we pointed out in Wednesday's subscriber's mid-week charts update, the CPI, PPI and Bond Auctions (historic "tails") shock the markets with a reignited worry about Inflation. The long expected June Rate cuts have been abruptly taken off the table and the markets are adjusting to it.
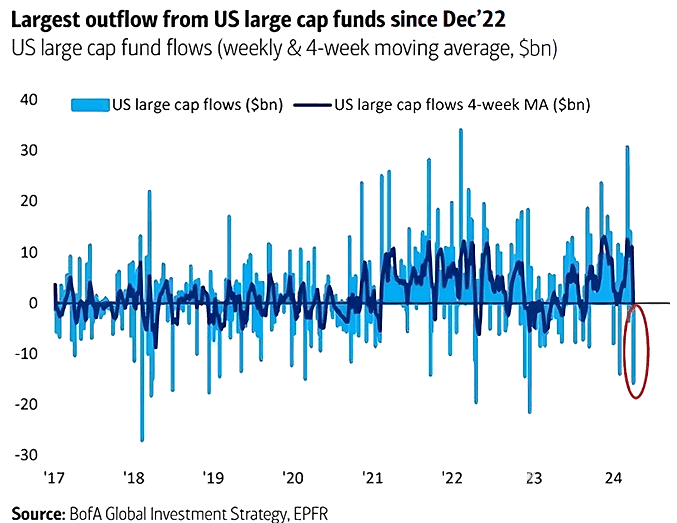
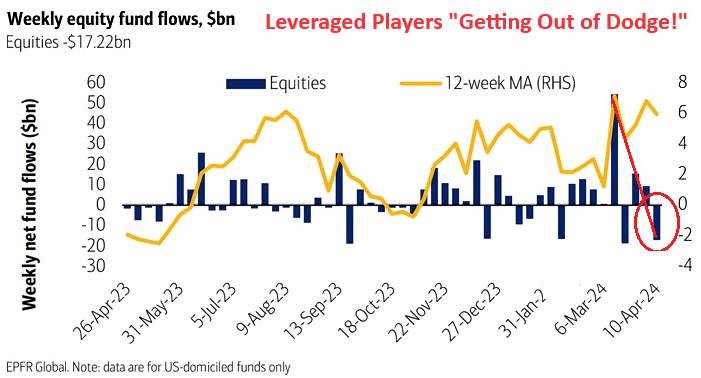
EQUITY FUND OUTFLOWS PICK-UP STEAM
The chart below shows that weekly Equity Funds Flows turned negative following steady weakness over the past couple of weeks. The chart to the right shows that even the US Large Cap funds saw impressive outflows. This is what initially has taken the S&P 500 to the 50 DMA.
|  | |
|
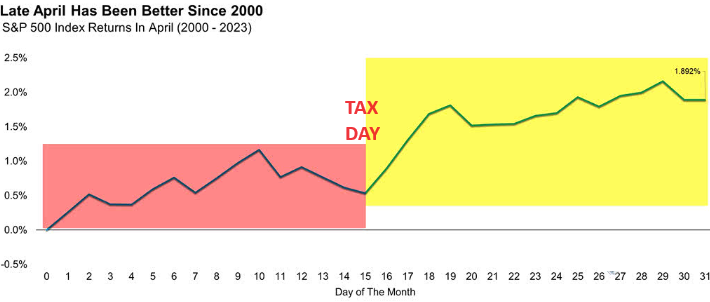
APRIL SEASONALITY (POST TAX DAY) HAS BEEN HISTORICALLY STRONG | |
|
2 - FUNDAMENTAL ANALYSIS
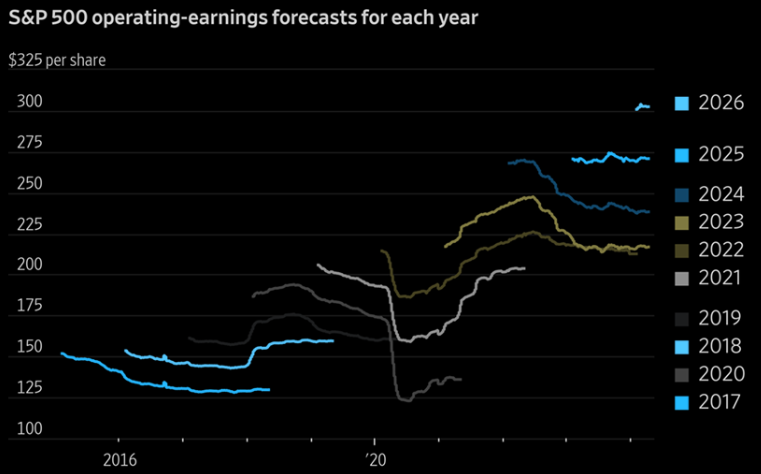
Wall Street expects a lot of profit this year, next year and, in early forecasts, 2026. The future is bright, investors and analysts think, even though it’s extremely rare for reality to come in better than originally hoped! (chart right)
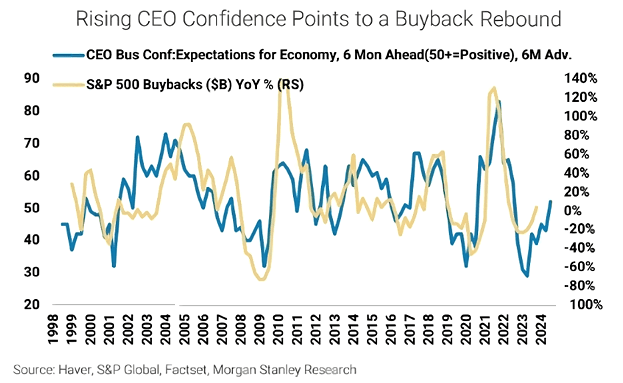
CEO'S INCREASINGLY MORE CONFIDENT!
Any potential corrective / consolidation is to likely be short lived since CEOs are becoming increasingly more confident with earnings outlooks looking strong. Typically this has led to increased buyback levels (see chart below).
NOTE: Corporate Buybacks are in a closed window due to their pending Q1 earnings releases. As they release their earnings it is expected they will again begin their planned buybacks.
| |
|
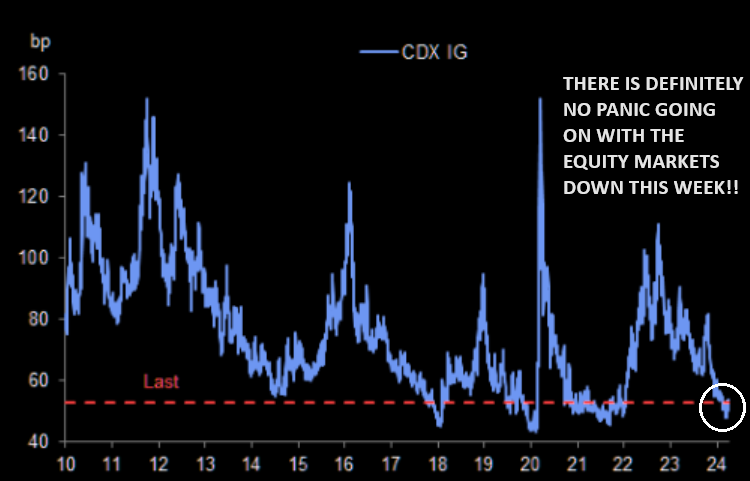
CREDIT MARKETS
Since Credit always leads markets, we are watching it closely. This includes:
- Inverted yield curves
- Negative swap spreads
- Collateral shortages
- Tightening of credit standards by banks and
- Reduced commercial lending
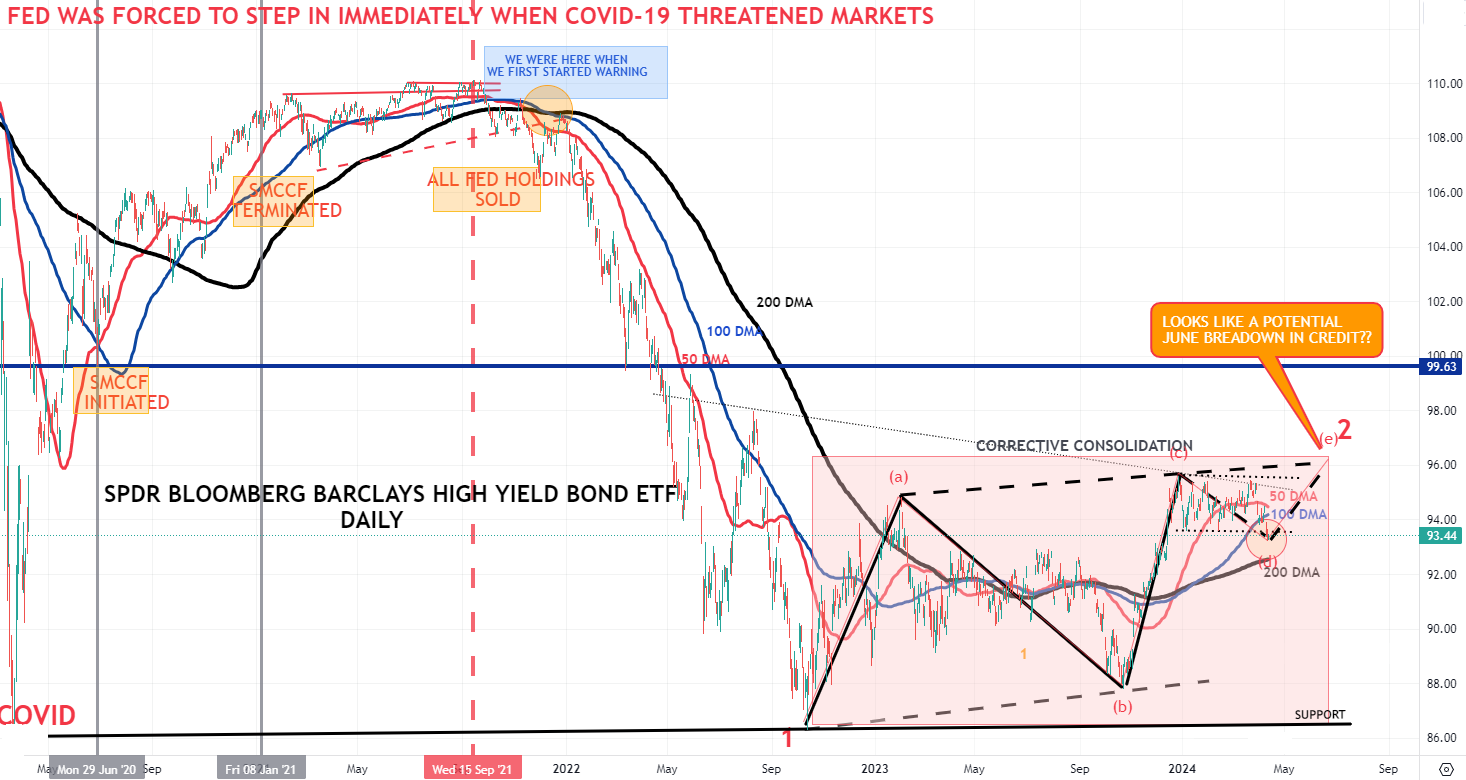
- The High Yield Corporate "JNK" Market. (BELOW)
CHART RIGHT ABOVE
Goldman Sachs: "We continue to advocate adding hedges to portfolios given rock-bottom levels of implied volatility".
| |
YOUR DESKTOP / TABLET / PHONE ANNOTATED CHART
Macro Analytics Chart Above: SUBSCRIBER LINK
| |
3 - TECHNICAL ANALYSIS
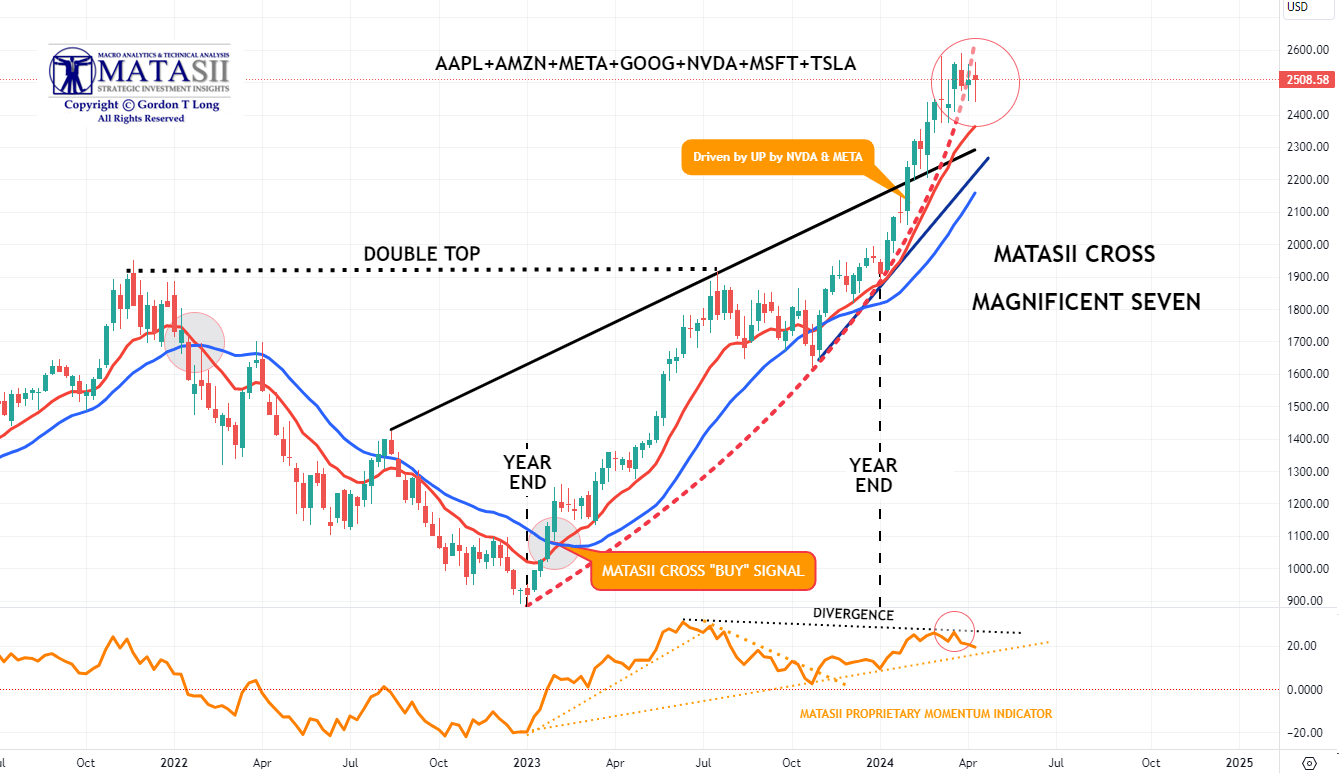
THE HEADLINE MARKET: MAGNIFICENT 7
- We are reaching the vertical lift part of the parabolic (geometric) lift shown by the dashed red line.
- We have intermediate term Divergence with momentum (bottom pane).
- In the short term Momentum appears to be rolling over (bottom pane).
| |
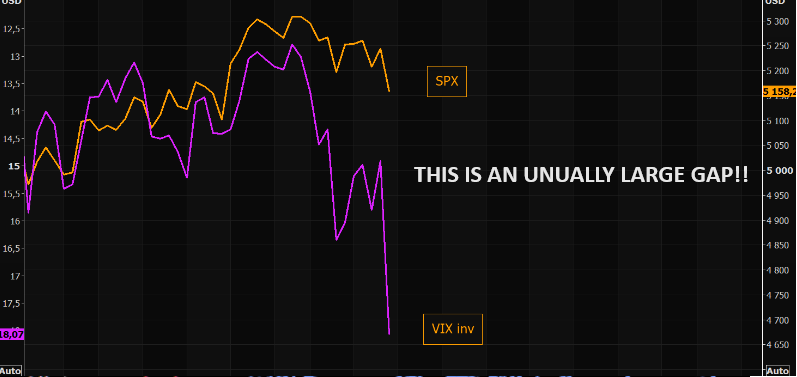
CHART RIGHT ABOVE: The stress in VIX is huge and the gap between SPX and VIX is widening big time. The crowd is ending the week on an extremely nervous note. Chart shows SPX vs VIX inv since Feb.
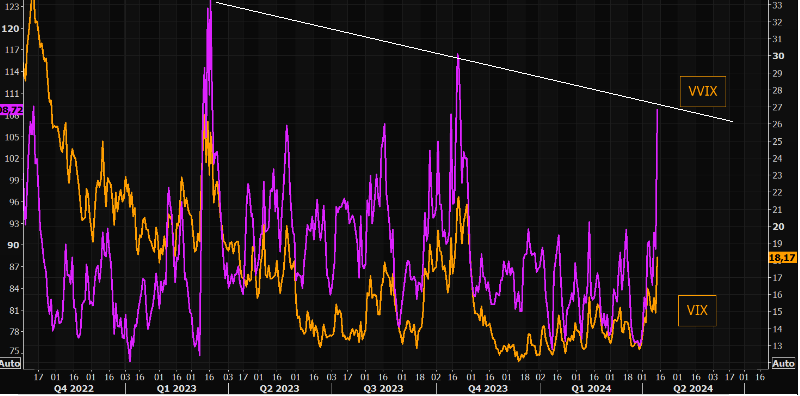
CHART RIGHT: It appears that the VIX and VVIX are in full panic mode?
MATASII CROSS: WEEKLY - CONTINUES TO SIGNAL A MAG-7 BUY
| |
YOUR DESKTOP / TABLET / PHONE ANNOTATED CHART
Macro Analytics Chart Above: SUBSCRIBER LINK
| |
|
"CURRENCY" MARKET (Currency, Gold, Black Gold (Oil) & Bitcoin)
CONTROL PACKAGE
There are EIGHT charts we have outlined in prior chart packages which we will continue to watch closely as a CURRENT "control set".
-
US DOLLAR -DXY - MONTHLY (CHART LINK)
-
US DOLLAR - DXY - DAILY (CHART LINK)
-
GOLD - DAILY (CHART LINK)
-
GOLD cfd's - DAILY (CHART LINK)
-
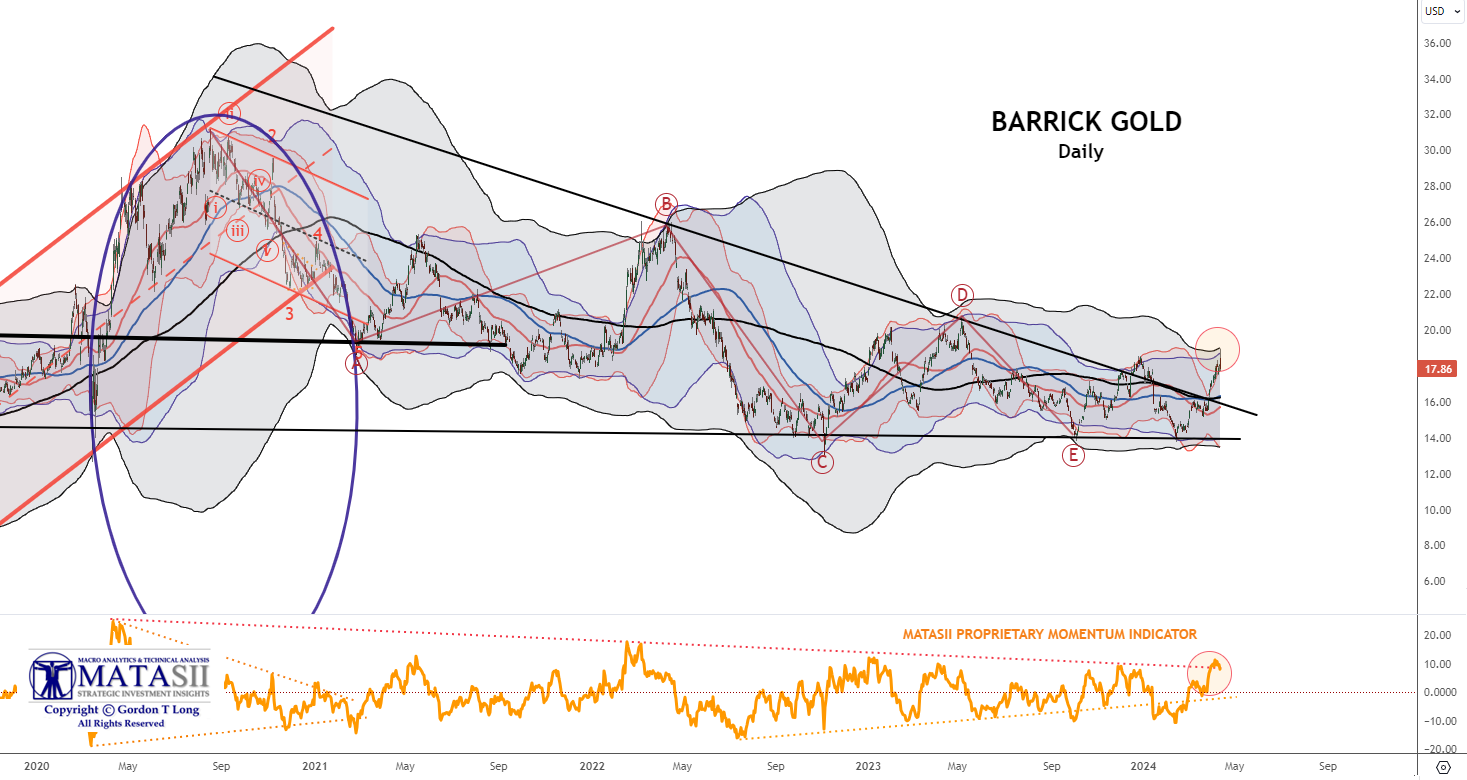
GOLD - Integrated - Barrick Gold (CHART LINK)
-
OIL - XLE - MONTHLY (CHART LINK)
-
OIL - WTIC - MONTHLY - (CHART LINK)
-
BITCOIN - BTCUSD -WEEKLY (CHART LINK)
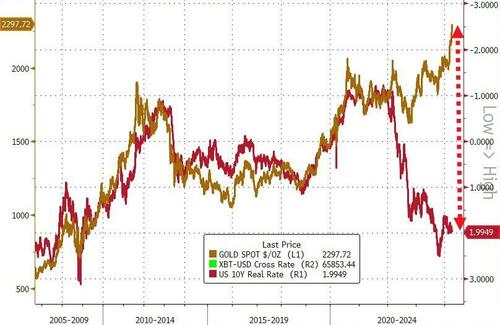
CHART ABOVE RIGHT
As gold pushes to higher & higher record highs (in USD terms), Real yields refuse to play along?? I side with BoAML's Michael Hartnett and believe that what we are seeing is Gold aggressively discounting a coming collapse in Real Rates.
GOLD cfd's - DAILY
The 3 Std Deviation band for Gold has gone almost vertical with Gold prices tracking it!! Frankly, in over 40 years I don't believe I have seen this technically occur with a 3 Std Dev in Gold? Something is either broken, panic has set in somewhere or there is an "elephant(s)" now playing the market?
| 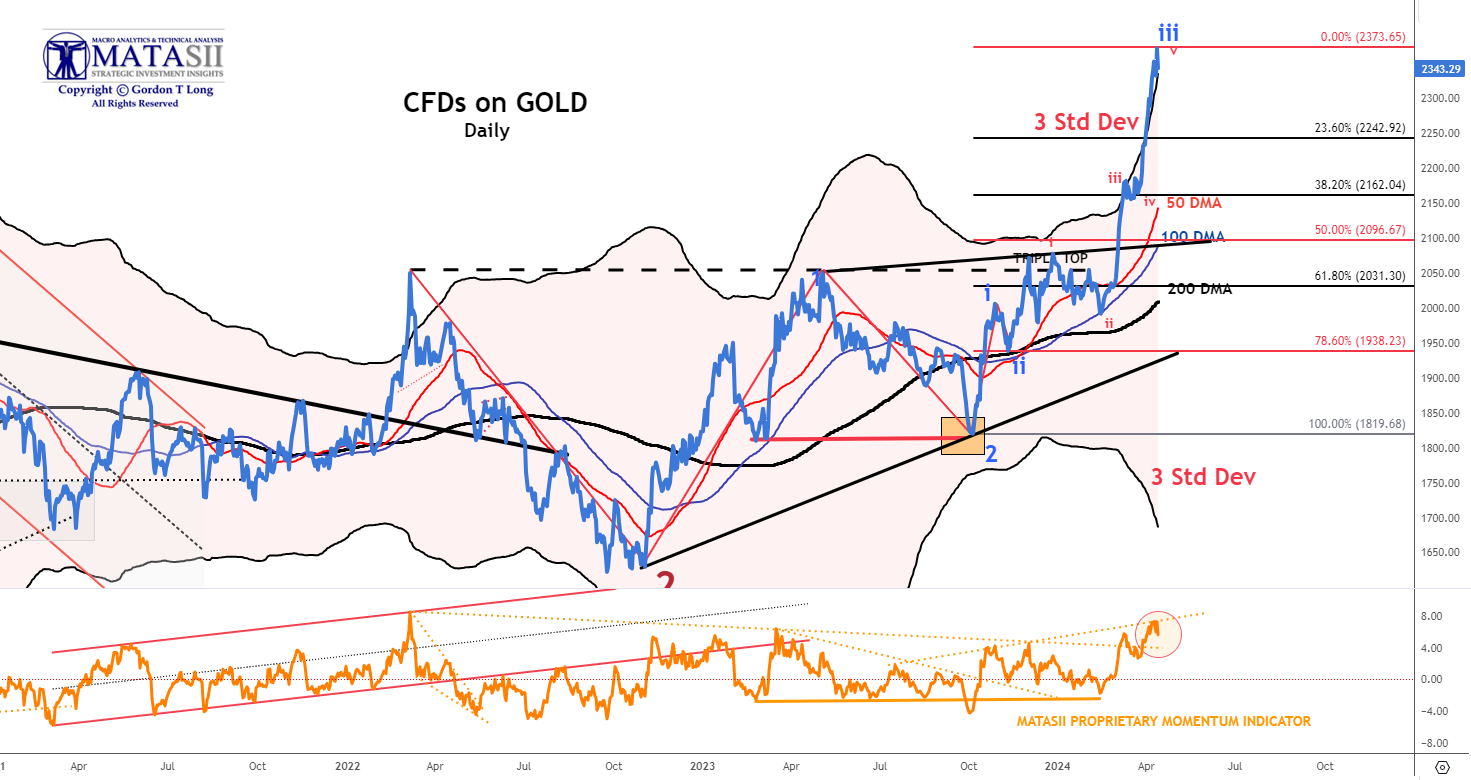 | |
YOUR DESKTOP / TABLET / PHONE ANNOTATED CHART
Macro Analytics Chart Above: SUBSCRIBER LINK
| |
INTEGRATED GOLD MINERS
We have a close eye on Gold and the INTEGRATED GOLD MINERS as represented by Barrick Gold. Barrick It has broken out of its long term declining overhead resistance trend. It is likely time to be adding to your Gold and Silver positions on any pullback opportunities.
| |
|
YOUR DESKTOP / TABLET / PHONE ANNOTATED CHART
Macro Analytics Chart Above: SUBSCRIBER LINK
| |
|
US EQUITY MARKETS
CONTROL PACKAGE
There have FIVE charts we have outlined in prior chart packages that we will continue to watch closely as a CURRENT "control set".
-
The S&P 500 (CHART LINK)
-
The DJIA (CHART LINK)
-
The Russell 2000 through the IWM ETF (CHART LINK),
-
The MAGNIFICENT SEVEN (CHART ABOVE WITH MATASII CROSS - LINK)
-
Nvidia (NVDA) (CHART LINK)
| |
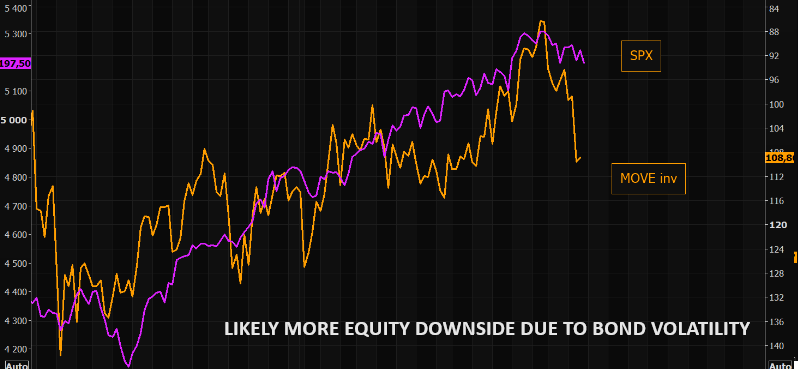
CHART RIGHT: What if SPX starts paying attention to bond volatility again? Chart shows SPX vs MOVE inv.
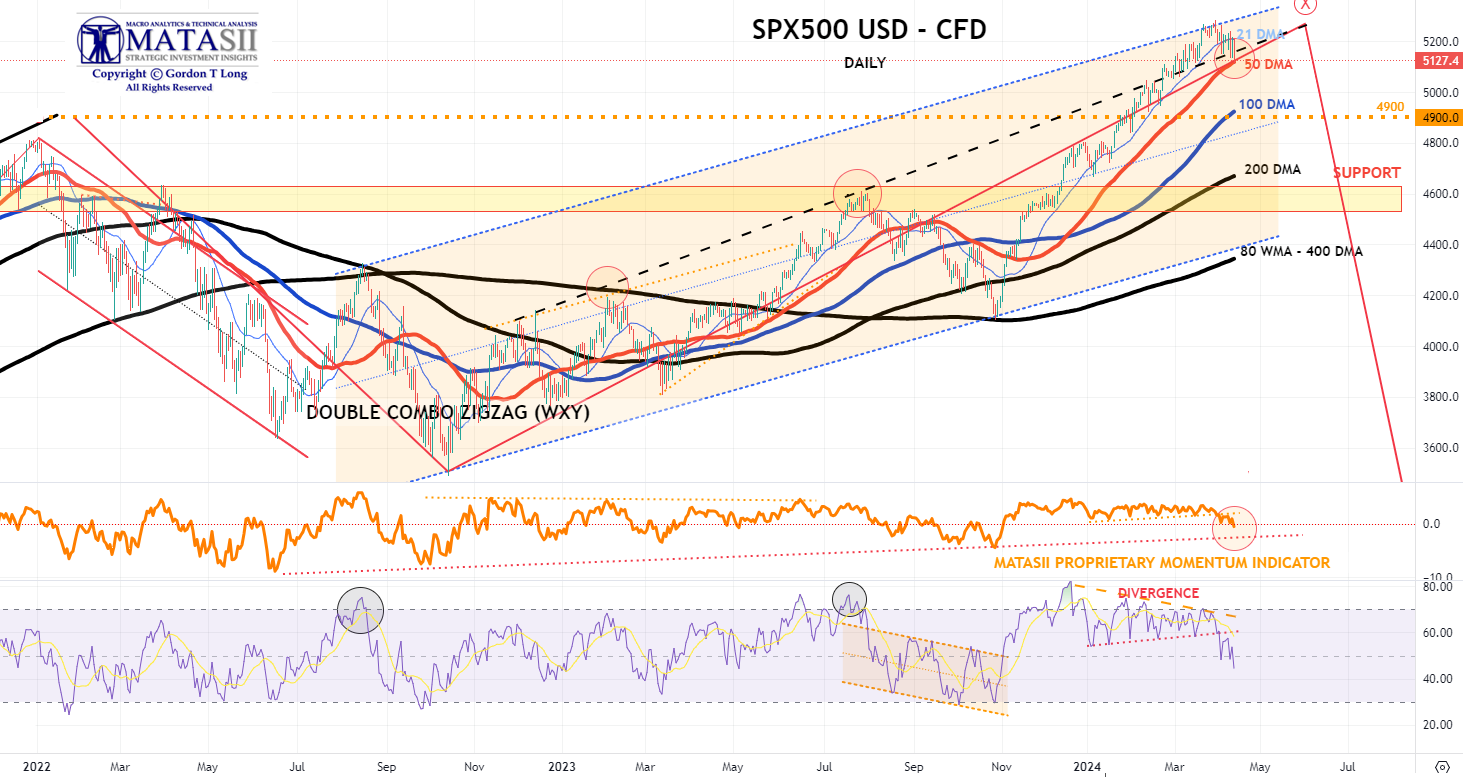
S&P 500 CFD
The S&P 500 cfd has put in a near term high and retraced to very close to the 50 DMA.
It is a testament to the strength of the equity market that with both yields moving so much higher and the dollar surging, that the equity market didn't sell off much further?
| |
YOUR DESKTOP / TABLET / PHONE ANNOTATED CHART
Macro Analytics Chart Above: SUBSCRIBER LINK
| |
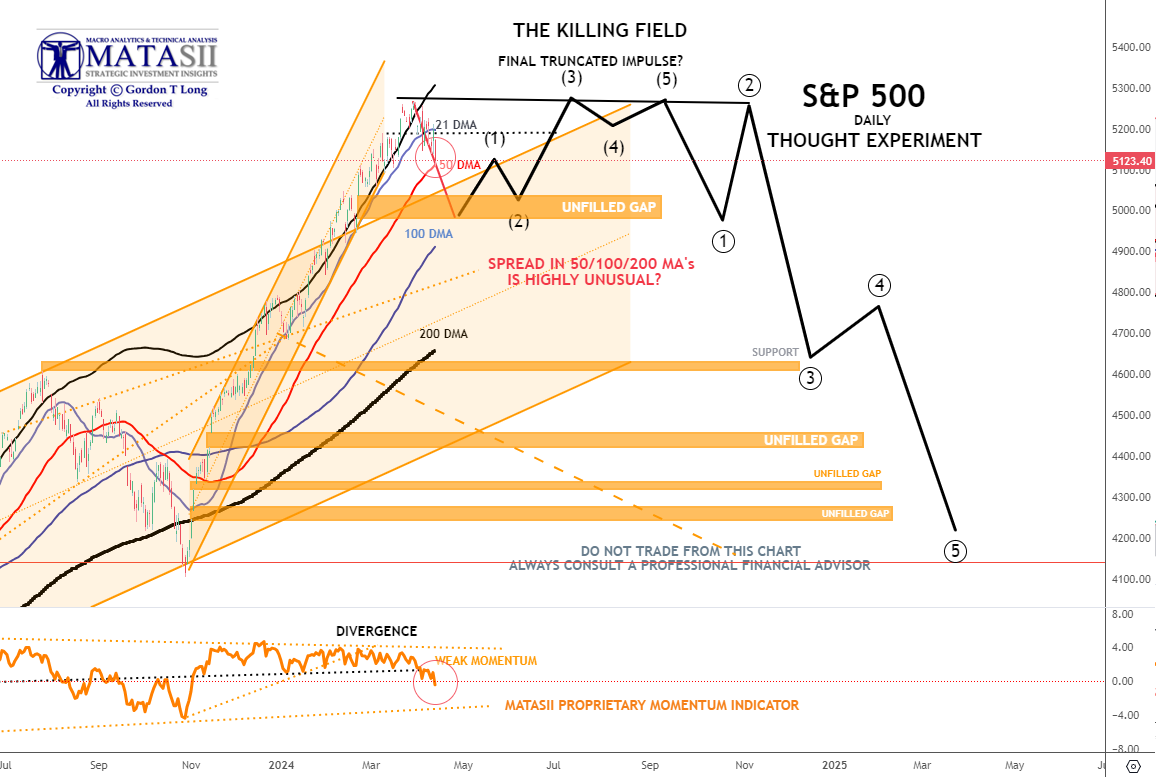
S&P 500 - Daily - Our Though Experiment
Our Though Experiment, which we have discussed previously, suggests we have put in a near term top and will now consolidate before possibly completing one final small impulse higher or put in a 1-2 Wave of a much higher degree.
NOTE: To reiterate what I previously wrote - "the black labeled activity shown below, between now and July, looks like a "Killing Field" where the algos take Day Traders, "Dip Buyers", "Gamma Guys" and FOMO's all out on stretchers!"
| |
YOUR DESKTOP / TABLET / PHONE ANNOTATED CHART
Macro Analytics Chart Above: SUBSCRIBER LINK
| |
STOCK MONITOR: What We Spotted
MONDAY
- It was calm before the storm on Monday as participants await key risk events, namely US CPI on Wednesday, but also several Central Bank decisions, including from the ECB, BoC and RBNZ, while the FOMC Minutes will also be released post-CPI.
- Earnings season also starts at the tail end of this week.
- Stocks finished little changed but the Russell 2000 outperformed. In FX, the Dollar was sold and the Euro bid, but Antipodes outperformed and Swissy lagged.
- JPY was ultimately little changed, but it did test 152.00 to the upside with traders cognizant of any intervention on a move above this level, particularly with CPI on Wednesday which could have a large sway in the pair.
- Crude prices saw choppy price action on mixed geopolitics report regarding a ceasefire which was ultimately rejected by Hamas while Iran was punchy on retaliatory language against Israel following the attack on its consulate. It also was pointing responsibility towards the US.
- Elsewhere, modest pressure was seen in oil on the Reuters report that Iraq has completed the first stage of repairing oil export pipeline to Turkey.
- Treasuries were firmer across the curve ahead of supply and the aforementioned risk events.
INFLATION BREAKEVENS: 5yr BEI +1.0bps at 2.442%, 10yr BEI +1.3bps at 2.396%, 30yr BEI +0.9bps at 2.333%
REAL RATES: 10Y -- 2.0139%
STOCK SPECIFIC
- Alibaba (BABA) flat: Alibaba Cloud announces price cuts.
- United Airlines (UAL) +0.5%: Postponed its investor day planned for next month due to a US FAA review following safety incidents.
- Tesla (TSLA) +5%: CEO Musk said the EV-maker would unveil its "Robotaxi" on August 8th.
- TSMC (TSM) +1%: Has agreed to a USD 6.6bln subsidy for TSMC Arizona chip production; and up to USD 5bln in low-cost government loans.
- Perion Network (PERI) -41%: Cuts FY24 revenue and adj. EBITDA outlook citing Microsoft Bing modifications.
- Boeing (BA) -1%: FAA to investigate the loss of engine cover on Southwest Boeing 737-800.
- Apartment Income REIT (AIRC) +22.5%: Agreed to be acquired by Blackstone (BX) for about USD 10bln or USD 39.12/shr. Note, AIRC closed Friday at USD 31.35/shr.
- Model N (MODN) +10%: To be acquired by Vista Equity Partners for USD 1.25bln or USD 30/shr. Note, MODN closed Friday at USD 27.09/shr.
- Micron (MU) -0.5%: Intends to sequentially increase its DRAM module and SSD prices by more than 25% during Q2, according to DigiTimes citing sources.
- Global Foundries (GFS) -0.5%: Downgraded at Cantor amid 2024 fundamentals.
TUESDAY
- Stocks ultimately saw slight gains despite a choppy session.
- Strength in the futures was seen pre-market after reports Google (GOOGL) is expanding its in-house chip efforts and a slew of cloud deals amid the start of the Google Cloud event.
- Nonetheless, a sharp-sell off in Nvidia (NVDA) hit sentiment after the open through to the European close before a late trade reversal in stocks was observed.
- The upside was supported by commentary from Fed's Bostic who suggested it would be good news for the Fed if US CPI is in line with expectations on Wednesday, noting if the disinflation progress continues, the Fed could bring forward rate cuts.
- Elsewhere, Treasuries were bid across the curve in a lack of catalysts ahead of CPI on Wednesday while the weak 3yr auction did little to prevent the upside.
- Crude prices slid on a lack of geopolitical escalation while Israel Defense Minister appeared to contradict PM Netanyahu noting there is still no date for the Rafah operation.
- FX was largely flat ahead of key risk events but the NZD outperformed ahead of the RBNZ rate decision tonight. All eyes on US CPI on Wednesday.
INFLATION BREAKEVENS: 5yr BEI -2.9bps at 2.418%, 10yr BEI -2.0bps at 2.380%, 30yr BEI -1.7bps at 2.320%.
REAL RATES: 10Y -- 2.0006%
STOCK SPECIFIC
- Google (GOOGL) +1%: Expands in-house chip efforts and is to roll out new hardware in costly AI battle. In addition, with Google’s Cloud event over the coming days, there has been a slew of deals announced. One of the highlights, Broadcom (AVGO) is to migrate VMware workloads to Google Cloud.
- NetEase (NTES) +4%: Reportedly to revive partnership with Microsoft’s Blizzard.
- Netflix (NFLX) -1.5%: Initiated a significant restructure in its film department.
- General Motors (GM) +1%: Self-driving car unit, Cruise, plans to resume testing robotaxis.
- Microsoft (MSFT) +0.5%: To reportedly invest USD 2.9bln in Japanese data centers amid AI boom.
- Pfizer (PFE) +0.5%: Abrysvo meets primary Phase 3 endpoint in RSV disease.
- InMode (INMD) -7%: Lowers Q1 and FY24 revenue outlook.
- BP ADR (BP) +1%: Sees higher oil and gas production.
- Freeport-McMoRan (FCX) +2.5%: Upgraded at BofA saying it has “blue chip copper exposure.”
- Nvidia (NVDA) -2%: UBS analyst note was doing the rounds, and it had some cautious comments on Nvidia's (NVDA) October/Q3 report, also saying sentiment on semis is as optimistic as "I can ever remember".
- Intel (INTC) +1%: Reveals details of new AI chip to fight Nvidia (NVDA) dominance.
- Boeing (BA) -2%: FAA investigates claims by Boeing (BA) whistle-blower about flaws in the 787 Dreamliner, according to New York Times.
THURSDAY
- Stocks rallied on Thursday with Big Tech/NDX leading the charge as participants gear up for earnings.
- A dovish ECB, soft PPI, and dismissive Fed Speak (of CPI) saw the front end of the Treasury pare some recent losses, although the back end continued to trade lower, with a lack luster 30yr auction - albeit not as bad as Wednesday's 10yr - keeping duration offered.
- It was noteworthy that stocks accelerated their gains once the auction was in the rearview, in a seeming "relief rally".
- Apple (AAPL) accelerated gains on Bloomberg reports about its new M4 chip products being in the works, while Nvidia (NVDA) also saw massive gains on no fresh catalysts.
- There appears to be an appetite to get long stocks for this earnings seasons, where analysts flag the bar for beats is relatively low.
- Big banks kick things off on Friday.
- In commodities, oil trundled lower, with concerns around an Iran response somewhat softened by reports that any attack would be "controlled and non-escalatory".
- However, that didn't stop Gold, with the yellow metal going on to print new record highs above USD 2,375 at time of writing, perhaps benefitting from the Fed Speak, where Williams, an influential voter, indicated little change in his outlook that cuts will "eventually" be needed despite inflation bumps.
- In FX, the DXY was ultimately flat, with activity currencies outperforming, while the Euro was flat to slightly lower despite Lagarde's mentioning there were some calls for a cut at today's meeting.
INFLATION BREAKEVENS: 5yr BEI -1.6bps at 2.456%, 10yr BEI -0.1bps at 2.414%, 30yr BEI +0.1bps at 2.345%.
REAL RATES: 10Y -- 2.184%
STOCK SPECIFIC
- Apple (AAPL) +4%: Plans to revamp entire Mac line with AI-focused M4 chips, according to Bloomberg; M4 Macs designed to bring AI capabilities and boost memory. First wave of M4 Macs to debut in late 2024, early 2025.Separately, it warned users of a spyware attack.
- Amazon (AMZN) +1.7%: Ordered to pay USD 525mln patent violation fine. Elsewhere, as they look towards 2024 (and beyond), they are not done lowering cost to serve.
- Costco (COST) +1.4%: Boosts quarterly dividend to USD 1.16/shr (prev. 1.02).
- US Steel (X) -0.9%: DoJ is probing Nippon Steel's acquisition of X amid national security concerns.
- CarMax (KMX) -9%: EPS and revenue missed accompanied by downbeat comms.
- Constellation Brands (STZ) +1.2%: Top and bottom line beat, raised quarterly dividend and FY25 EPS outlook surpassed expectations.
- Fastenal (FAST) -6.5%: Earnings disappointed which were affected by adverse weather.
- Alpine Immune Sciences (ALPN) +37%: To be acquired by Vertex (VRTX) for USD 4.9bln in cash or USD 65/shr. ALPN closed Wednesday at 47.04.
- Nike (NKE) +3.4%: Upgraded at BofA with expectations rebased.
- Robinhood (HOOD) +3.6%: Downgraded at Citi.
- Globe Life (GL) -53%: Fuzzy Panda short on the name.
- Ford (F) flat: Cuts prices of electric F-150 pickup by up to USD 5,500 to boost sales.
- Blackbaud (BLKB) +4.2%: Clearlake said to renew pursuit of software firm Blackbaud, according Bloomberg sources.
- Marvell (MRVL) +0.2%: Gave an AI update at its event; Recorded over USD 550mln in AI related revenue in 2023. Looking ahead, sees AI contributing close to 30% of total revenue in 2024 and tripling to over USD 1.5bln, and sees USD 2.5bln for 2025 as a "solid base".
FRIDAY
- Stocks were sold on Friday with Iran fears and poor bank earnings weighing into the weekend, with small caps suffering the most.
- Treasuries saw strong gains, paring some of the week's losses amid the Iran concerns and risk aversion.
- JPM saw heavy selling after investors were let down by the lack of guidance increase to its NII, while WFC and C performed relatively better.
- Chip names saw particular pressure amid WSJ reports China had told telecom carriers to phase out foreign chips.
- Bitcoin and crypto saw heavy losses amid the risk aversion. It was a rollercoaster session for oil and gold, with the pair of them having made fresh peaks on a slew of reporting in the NY morning of an imminent Iran response (which we still await), only to reverse lower into the close with many traders expecting a response that does not threat an escalation.
- The Dollar saw strong gains with the Iran fears underscoring the policy divergence of the Fed vs other central banks, particularly in Europe, who are seemingly much closer to beginning rate cuts.
- In data, the highlight was the University of Michigan survey's consumer inflation expectations, which both saw an unwelcome rise, albeit to levels that are consistent with post-COVID ranges, but that saw little price reaction.
- We also had a slew of Fed Speak from Collins, Schmid, Daly, and Bostic, who are all expressing caution in rushing into rate cuts, something which money markets have already adjusted to.
INFLATION BREAKEVENS: 5yr BEI -0.4bps at 2.454%, 10yr BEI -0.9bps at 2.402%, 30yr BEI -0.7bps at 2.337%.
REAL RATES: 10Y -- 2.122%
STOCK SPECIFIC
- Globe Life (GL) +20%: After declining 53% yesterday on a Fuzzy Panda short report, it issued a statement where it refuted the allegations.
- Intel (INTC) -5%, AMD (AMD) -4%: China has reportedly told telecom carriers to phase out foreign chips.
- Morgan Stanley (MS) -1%: Following a 5% decline on Thursday, after news its wealth management unit probed ahead of its earnings next week.
- Arista Networks (ANET) -8.5%: Double downgraded at Rosenblatt on AI boost skepticism.
- Southwest Airlines (LUV) -3.5%: Anticipates receiving only about half of the expected Boeing jet deliveries for 2024, significantly impacting its growth plans.
- Coupang (CPNG) +11.5%: Raising 'Wow' membership fee by 58%.
- Paramount (PARA) -3%: Asked by Barington Capital to engage Apollo (APO) on offer, according to Bloomberg.
EARNINGS:
- JPMorgan Chase & Co (JPM) -6.5%: NII was light and CEO Dimon said it fell on deposit margin compression and lower deposit balances. Looking ahead, GS remain alert to a number of significant uncertain forces. Reaffirmed FY NII view but was short of expectations for a raise.
- Wells Fargo & Co (WFC) -0.5%: Have been very choppy post-earnings: Top and bottom line beat, but net interest income and net interest margin missed. Looking ahead, affirmed it sees FY24 net interest income down between 7% and 9%.
- Citigroup (C) -1.5%: EPS and revenue beat, with the breakdown also strong, although net interest income did miss.
- Progressive (PGR) +1%: Profit, net premiums earned and written topped.
- BlackRock (BLK) -3%: EPS and revenue beat alongside AUM hitting a record USD 10.5tln.
- State Steet (STT) +2.5%: Revenue, EPS, NII, and AUM all topped street expectations.
| |
BOND MARKET
CONTROL PACKAGE
There have FIVE charts we have outlined in prior chart packages that we will continue to watch closely as a CURRENT "control set".
- The 10Y TREASURY NOTE YIELD - TNX - HOURLY (CHART LINK)
- The 10Y TREASURY NOTE YIELD - TNX - DAILY (CHART LINK)
- The 10Y TREASURY NOTE YIELD - TNX - WEEKLY (CHART LINK)
- The 30Y TREASURY BOND YIELD - TNX - WEEKLY (CHART LINK)
- REAL RATES (CHART LINK)
- FISHER'S EQUATION = 10Y Yield = 10Y INFLATION BE% +REAL % = 2.402% + 2.122% = 4.524%
| |
As rate-cut expectations fell from 6 this year to 3, Treasury yields rose... non-stop... all week with the belly of the curve underperforming (5Y yields up 28bps on the week). Yields all ended back up near their year-to-date highs.
Expectations changed over the week regarding the inflation outlook moving higher, which is reflected to the right.
As the chart below of the 10T Treasury Yield reflects, with the release of the CPI (orange text bubble) it was a straight lift of 25 bps to 4.6%, before retreating slightly.
The narrative has shifted to the 10Y Treasury Yield now trading to 5.0%. We currently see 4.8% with real yield of 2.5% being the upper limit before the equity markets crack from rates and the Fed is forced to react because of the political pressure of an election year.
| |
YOUR DESKTOP / TABLET / PHONE ANNOTATED CHART
Macro Analytics Chart Above: SUBSCRIBER LINK
| |
NOTICE Information on these pages contains forward-looking statements that involve risks and uncertainties. Markets and instruments profiled on this page are for informational purposes only and should not in any way come across as a recommendation to buy or sell in these assets. You should do your own thorough research before making any investment decisions. MATASII.com does not in any way guarantee that this information is free from mistakes, errors, or material misstatements. It also does not guarantee that this information is of a timely nature. Investing in Open Markets involves a great deal of risk, including the loss of all or a portion of your investment, as well as emotional distress. All risks, losses and costs associated with investing, including total loss of principal, are your responsibility.
FAIR USE NOTICE This site contains copyrighted material the use of which has not always been specifically authorized by the copyright owner. We are making such material available in our efforts to advance understanding of environmental, political, human rights, economic, democracy, scientific, and social justice issues, etc. We believe this constitutes a ‘fair use’ of any such copyrighted material as provided for in section 107 of the US Copyright Law. In accordance with Title 17 U.S.C. Section 107, the material on this site is distributed without profit to those who have expressed a prior interest in receiving the included information for research and educational purposes. If you wish to use copyrighted material from this site for purposes of your own that go beyond ‘fair use’, you must obtain permission from the copyright owner.
========
| |
MATASII'S STRATEGIC INVESTMENT INSIGHTS | |
2020 VIDEOS OUTLINING THE COMING RISE IN INFLATION, STAGLFLATION & COMMODITY PRICES | |
|
THE REGULATORY STATE
RELEASED - 01-17-24 --- 212 Page Paper
FULL 212 PAGE PDF DOWNLOAD
| |
IDENTIFICATION OF HIGH PROBABILITY TARGET ZONES | |
Learn the HPTZ Methodology!
Identify areas of High Probability for market movements
Set up your charts with accurate Market Road Maps
Available at Amazon.com
| |
The Most Insightful Macro Analytics On The Web | | | | |