|
UnderTheLens - FEBRUARY 2024
Macro Analytics - 02/05/24
| |
TREASURY REFUNDING DURING AN ELECTION YEAR'S DEFERRED DEBT CEILING WINDOW
OBSERVATIONS: THE TWO AMERICAS WE LIVE IN - PART II
Last week I shared with you some facts on the "Disconnected Elite" that originated from statistics produced by the polling firm Rasmussen Research. It appears I was not the only person intrigued by the research as former US House Speaker Newt Gingrich, having delved into the research, also interviewed Scott Rasmussen. This is important research as it makes it clear what is propelling the US into what many sense is an era of confusion and seeming chaos and social disconnect.
We now have a tiny group of elitists who control what Vladimir Lenin called “the Commanding Heights,” where the elements of power control the rest of us. Rasmussen is now calling, what I previously referred to as the "Disconnected Elite", THE ELITE 1 (for Top 1%). These are people who can be defined as:
-
Have Graduate Degrees (not just graduate studies)
- Family incomes above $150,000 a year
-
Lived in large cities (more than 10,000 people per zip code)
- The most radical of the Elite 1 percent were educated at what Rasmussen calls the “Dirty Dozen: ” Harvard, Yale, University of Pennsylvania, Northwestern, John Hopkins, Columbia, Stanford, Berkeley, Princeton, Cornell, MIT and the University of Chicago.
Here are some more statistics on this group, which further polling research has brought to light:
- The Elite 1 percent are surprisingly young - 67% are between 35 and 54 years old.
- They are 86% white.
- It is the Elite 1 who dominate the universities, news media, judiciary, intelligence agencies, giant foundations and most major corporations.
- Although they are relatively few, they marry each other, their children go to the same schools, and they hire and promote each other.
- Graduates from “Dirty Dozen” universities work and play in the same zip codes. They are an isolated set and create a “power aristocracy” that has no knowledge of the rest of us – and contempt for most of us. (This perfectly explains Hillary Clinton’s “basket of deplorables” line).
Elite 1's political views further supports this year's MATASII Thesis Paper outlining the emerging "Regulatory State":
- When all other voters gave President Joe Biden a 41% job approval, the Elite 1 rated him at 82% approval.
- Almost half of them (47%) favor “Sanders-like policies.”
- They are overwhelmingly Democrats (73%).
- While 57% of all voters say there is not enough individual freedom in America, 47% of the Elite 1 say there is too much freedom.
- If you ask the sub-group that is politically obsessed (people who talk politics every day), 69% say there is too much individual freedom in America.
- The Elite 1 have great faith in government. Some 70% trust government to do the right thing most of the time.
- 35% of the Elite 1 (and 69% of the politically obsessed Elite 1) said they would rather cheat than lose a close election.
- Among average Americans, 93% reject cheating and accept defeat in an honest election. 7% of Elite 1 reported they would cheat.
-
While only 6% of most voters have a very favorable opinion of members of Congress, 69% of the Elite 1 have a very favorable view (this to me is almost unimaginable!).
- While 10% of all voters have a favorable view of journalists, the Elite 1 percent really like them (71% favorable). ===>
| |
|
VIDEO PREVIEW (click image)
Pay-Per-View Page Link
| |
THIS WEEK WE SAW
Exp=Expectations, Rev=Revision, Prev=Previous
US
US JOLTS Job Openings (Dec) 9.03M vs. Exp. 8.75M (Prev. 8.79M, Rev. 8.923M)
US CaseShiller 20 MM SA (Nov) 0.1% vs. Exp. 0.5% (Prev. 0.6%)
EU
EU Industrial Sentiment (Jan) -9.4 vs. Exp. -9.0 (Prev. -9.2)
EU Business Climate (Jan) -0.4 vs. Exp. -0.27 (Prev. -0.45, Rev. -0.50)
EU Consumer Confidence Final (Jan) -16.1 vs. Exp. -16.1 (Prev. -16.1)
German GDP Flash YY SA (Q4) -0.2% vs Exp. -0.2% (prev. -0.4%); YY NSA(Q4) -0.4% vs. Exp. -0.4% (Prev. -0.8%); Flash QQ SA (Q4) -0.3% vs. Exp. -0.3% (Prev. -0.1%, Rev. 0.0%)
French GDP Preliminary QQ (Q4) 0.0% vs Exp. 0.0% (Prev. -0.1%)
ASIA
Chinese Industrial Profits YTD YY (Dec) -2.3% (Prev. -4.4%)
Japanese Industrial Production (Dec P) 1.8% vs. Exp. 2.4% (Prev. -0.9%)
Japanese Retail Sales YY (Dec) 2.1% vs. Exp. 4.7% (Prev. 5.3%, Rev. 5.4%)
===>
-
While 17% of all voters have a favorable view of college professors, the Elite 1 just love them (76%). (This tracks, because many of the Elite 1 may be college professors).
- The Elite 1 who graduated from the "Dirty Dozen" deeply believe in government.
- 55% believe there is too much individual freedom in America and that Americans should obey government and follow government leadership.
To illustrate the scale of the gap between the Elite 1 and the rest of the country, consider the Elite 1's views on climate issues (and understand that these ideas are opposed by 63% to 83% of most Americans).
- 77% of the Elite 1 would like to impose strict restrictions and rationing on the private use of gas, meat, and electricity.
- 72% favor banning gas powered vehicles.
- 69% favor banning gas stoves.
- 58% favor of banning sport utility vehicles.
- 55% favor banning non-essential air travel.
- 53% favor banning private air conditioning.
As Rasmussen noted, the degree to which the Elite 1 think their views represent those of the average American is astonishing.
| |
========================= | |
|
WHAT YOU NEED TO KNOW!
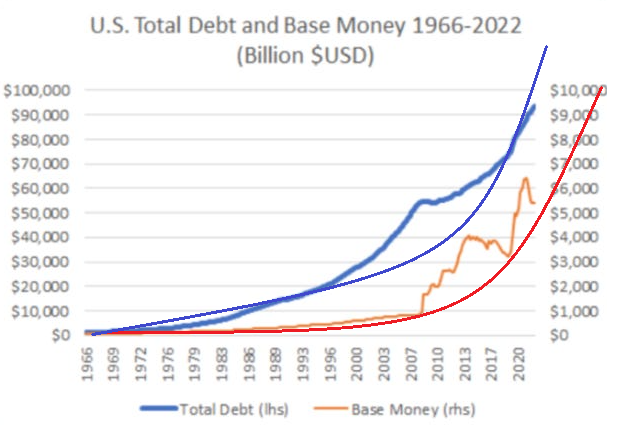
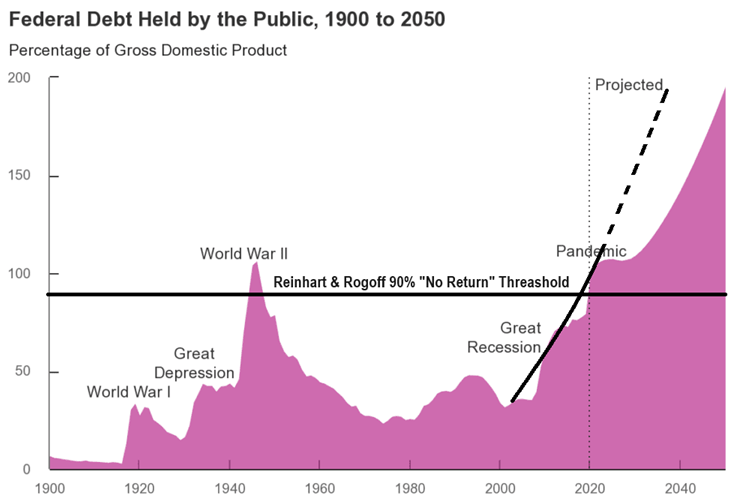
US MONEY SUPPLY MUST SOON GROW
In a heavily indebted US system, the supply of money needs to continually grow or the debt becomes unserviceable. Therefore it is only a matter of time before the Fed will be forced to grow its balance sheet again (i.e. print significantly more money).
The only other option is for Foreigners to buy increasing amounts of US debt. However, that trend is actually trending down with China reducing, Japan buying being flat and other countries experiencing shrinking FX reserves to use to buy US Treasuries with. Therefore the US Money supply may be forced to DRAMATICALLY increase! This would not portend well for the US Dollar in Intermediate to Longer Term!
RESEARCH
TREASURY SECRETARY JANET YELLEN'S ELECTION YEAR SET-UP
- It is now clear that a very carefully crafted plan has been executed to give the Administration maximum control over the financial markets during the 2024 election year.
- The "BTFP "arb" has given the Primary Dealers the funding to finance any need the US Treasury may require during the 2024 election year, while at the same time protecting them from the risk of absorbing failed auctions.
- Treasury Secretary Yellen neither took the TBAC advice (normal procedure) nor consulted with the Primary Dealers (standard practice so Dealers are prepared for possible auction failures) in issuing the recent quarterly QRA. This is highly unusual?
- The QRA intentionally falsely set expectations low enough to keep rates lower than they might otherwise be.
- The newly announced use of Treasury controlled Buyback and TIPS procedures (buried in the QRA) will allow the Treasury to more effectively manage election year yield expectations:
-
TIPS ISSUANCES can be expected to be used to drive Real Rates higher, assisting in making US debt rates more attractive to foreign carry trade and FX investors.
-
BUYBACKS will give the Treasury effectively "QE" like powers while additionally being better able to manage the Yield Curve (with "YCC" like powers).
- Working closely with the BLS (US Economic Reporting), the PPT and the Federal Reserve (BLTP, RRP, Fed Funds Rate) has effectively given Yellen & the administration election year financial leverage.
Q4 2023 EARNINGS SEASON:
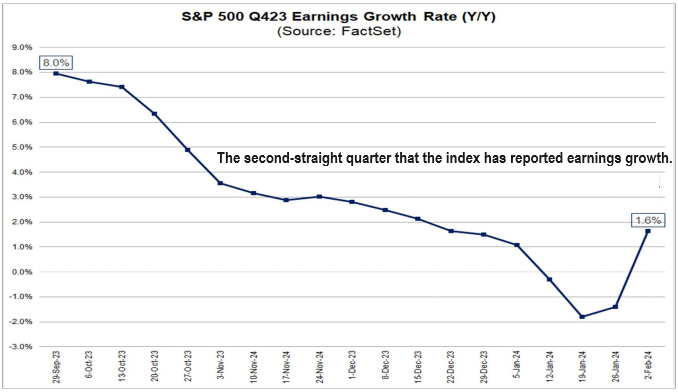
- If 1.6% is the actual growth rate for the quarter, it will mark the second-straight quarter that the index has reported earnings growth.
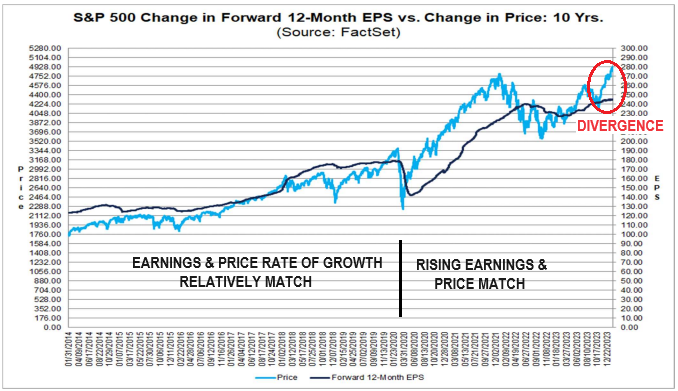
- We have a major divergence between the rate of growth of earnings and the rate of increase in stock prices. It is unusual for PE's to expand when the LEI is signaling a high probability recession lies ahead.
| |
|
DEVELOPMENTS TO WATCH
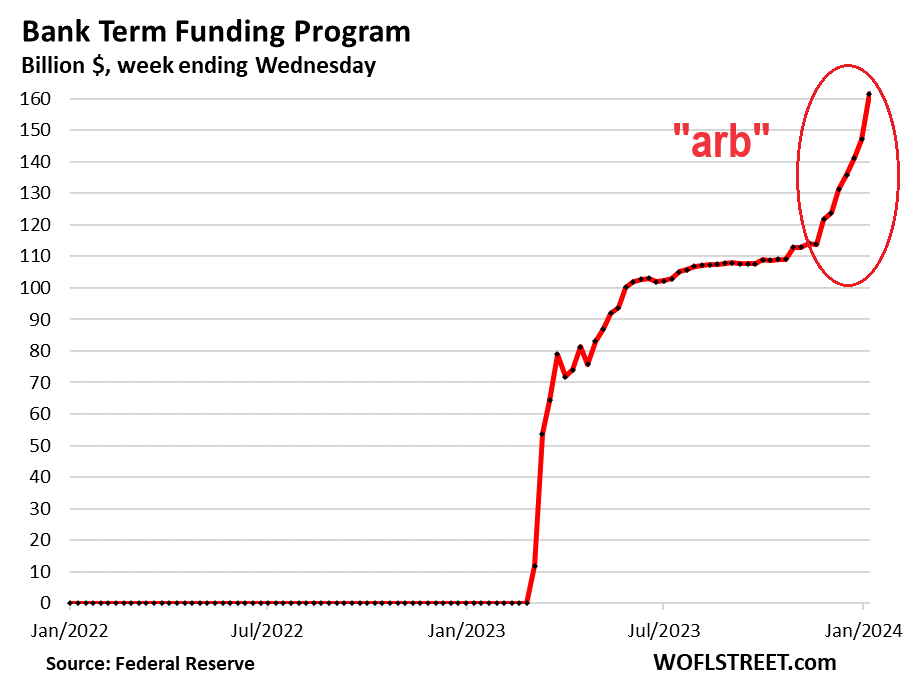
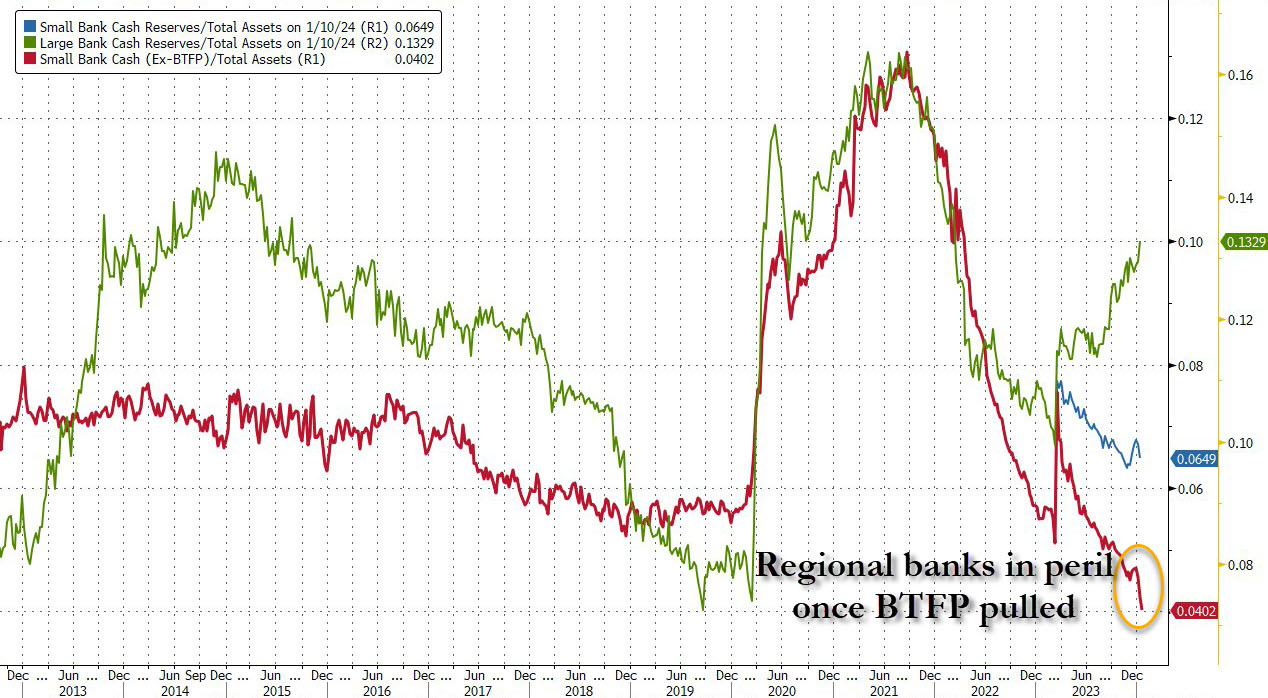
BTFP "ARB" STOPPAGE: "Immediate Halt!"
The Fed confirmed in a press release 01-24-24 that its infamous tool to deal with the March 2023 bank-panic and bank-liquidity crisis, the Bank Term Funding Program (BTFP), will cease making new loans to banks, as scheduled, on March 11.
Existing loans can continue for their term of up to
one year.
- The Fed also said that, “Effective Immediately,” it would shut down the arbitrage with which large Money Center banks had been "gaming" the BTFP.
This "ARB" we believe has been highly leveraged
to fund Stealth Liquidity - Stage II.
CONNECTING THE CRE CRISIS <=> BANKING CRISIS: A Global Surprise
THIS WEEK WE WITNESSED:
- New York Community Bancorp (NYCB) extended losses well below SVB lows.
- The US Commercial Real Estate (CRE) went global with massive US CRE write downs by Japan's Aozora Bank.
- Western Alliance Bancorp's stock got "clubbed" badly.
- Shares of Zions Bancorp, Comerica and Webster Financial tumbled along with Citizens Financial, Regions Financial, SouthState, Prosperity Bancshares, Schwab, PacWest, and Huntington Bancshares.
The goal here is to re-arm the Federal Reserve’s policy arsenal. While the projections of Fed officials for rate cuts in 2024 have been packaged as reflecting the growing strength of the US economy, the reality is that
the Fed wants the option to lower rates as a strategic response to looming financial distress.
| |
|
GLOBAL ECONOMIC REPORTING
-
JANUARY LABOR REPORT (NFP): The NFP (Establishment Survey) report is now unusable from the distortions being created by new and revised "Seasonal Adjustments". The Household Survey appears to be the only viable data source.
| |
|
In this week's expanded "Current Market Perspectives", we focus on the Magnificent Seven earnings and forward guidance.
=========
| |
|
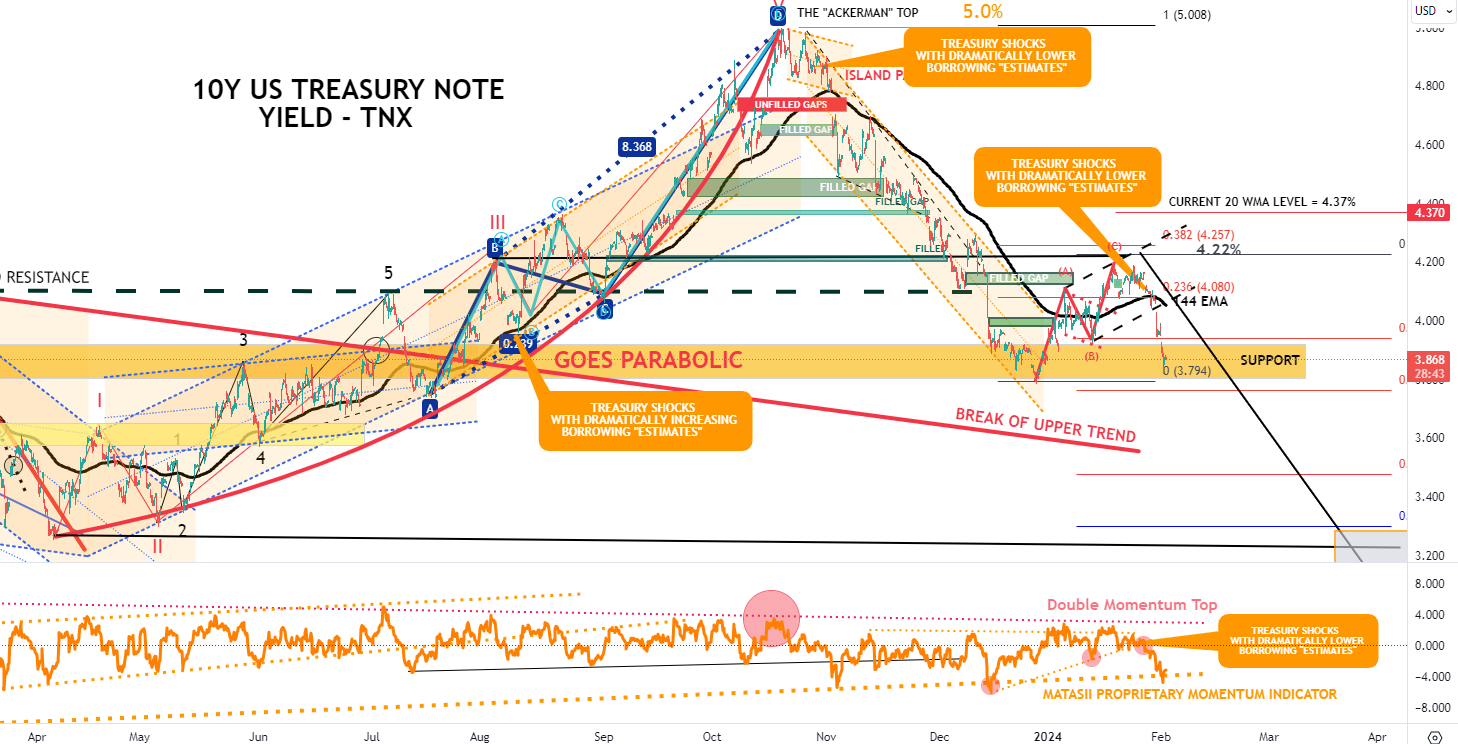
TREASURY REFUNDING DURING AN ELECTION YEAR'S DEFERRED DEBT CEILING WINDOW
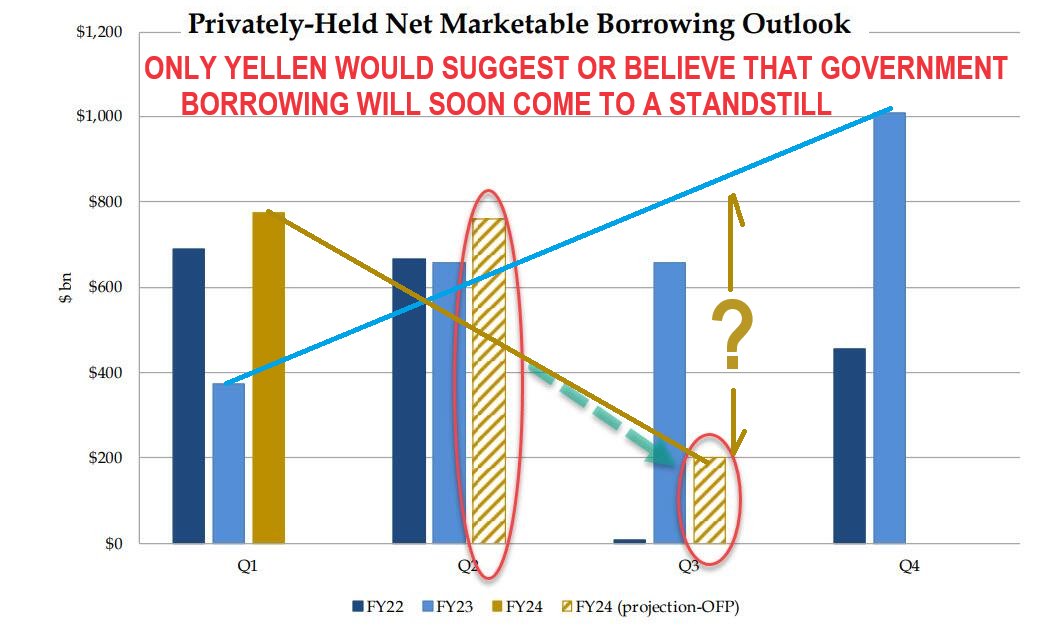
What was the thinking last June during the Debt Ceiling congressional wrangling when it was increased but with the caveat that the Debt Ceiling would be uncapped until after the President election? What possible reason would there realistically be other than expectations were that a lot of "candy" was going to be required to win an election??
Whatever "the pork" being divided up for tax payers, House and Senate politicians trying to get re-elected as well as tricks needed to keep the economy from stalling during the election cycle, it would take money - lots and lots of money. That was money that the US Treasury had to get its hands on, especially with Stealth Liquidity I was quickly coming to an end.
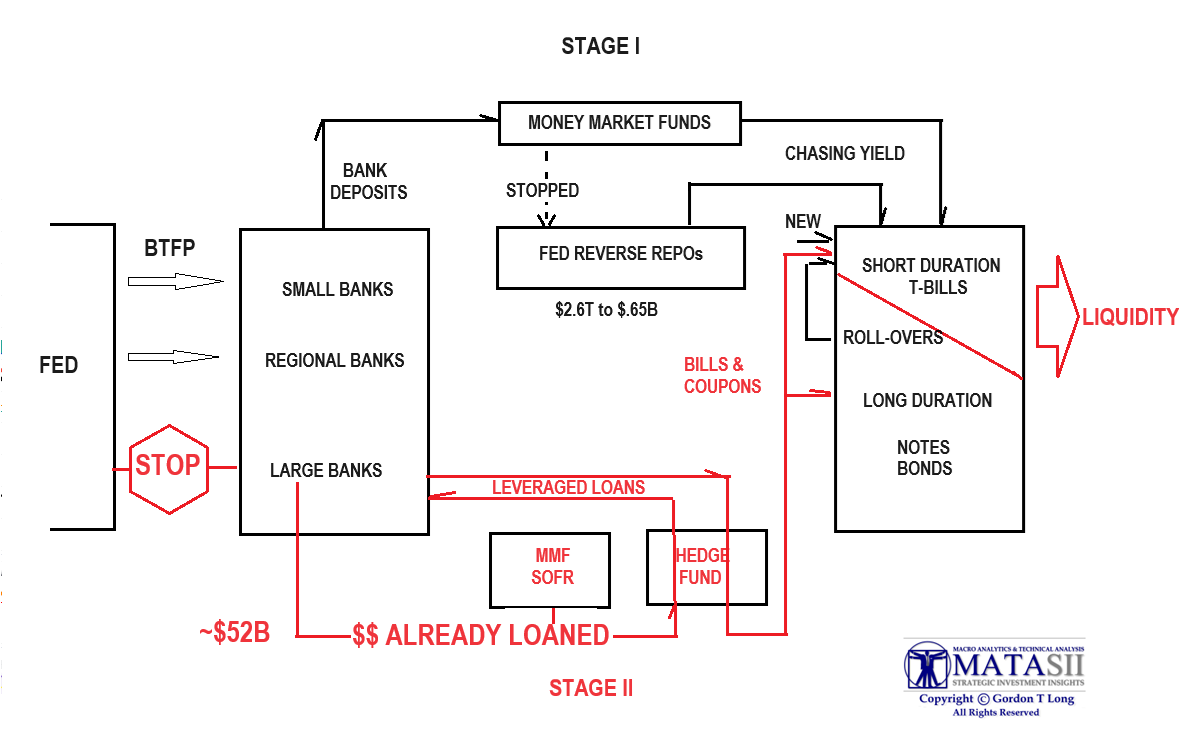
STEALTH LIQUIDITY I
Stage I (as shown below) allowed the US Treasury to use the nearly $2.7T in the Fed's Reverse Repo Account to fund Treasury needs and keep the economy from stalling as the success of Bidenomics was touted widely to the public. Bidenomics was nothing more than Biden's version of MMT (Modern Monetary Theory), which pumped massive fiscal deficit spending into the economy, effectively funding a "War Time" economy during peace time full employment. A recipe for inflation and potentially "kicking the can down the road". But the can is not yet over the finish line, so new methods were needed.
|  | |
|
STEALTH LIQUIDITY II
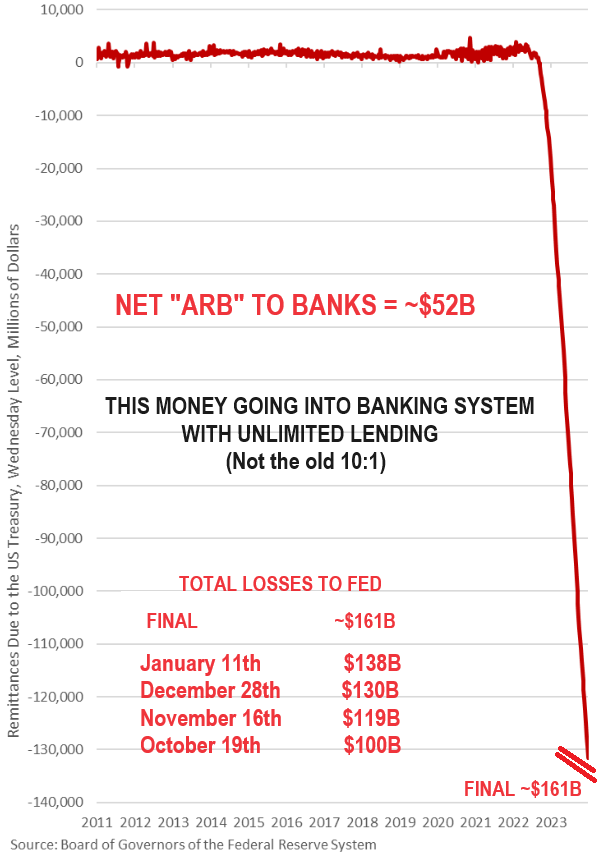
Stealth Liquidity Part II was initiated in November by allowing the Large Banks to "Arb" loans under the BTFP. This resulted in the banks gaining ~$52B in "Arb" potential which cost the Fed ~ $161B in losses. (See the Developments section in this newsletter for details on the Fed recently stopping the "arb").
The "arb" was lent by the banks immediately to MMF (at 10:1) which was then lent to Hedge Funds to use as Collateral for leveraged loans (15:1) to buy US Treasury bills, thereby pocketing major profits along with the banks. NOTE: The Money center banks are the US Treasury's.
This process was effectively using Fed / Treasury intermediaries to fund the US Treasury.
$52B X 10 X 15 = $7.8T in potential Treasury Auction Buying Power Put In Place
THE TREASURY TRICK
With the funding available and no debt ceiling limitations the hard part was now in place. The easier part was to ensure a Treasury Refunding process which would facilitate the soon to arrive congressional bills full of "pork" needing that financing.
| |
|
|
The "Treasury Trick" was now to keep rates low enough to maintain the economy humming, the electorate happy with a rising iRA/401Ks and falling financing rates - yet attract lenders with competitive global rates.
This is where the slight of hand comes in and Yellen's manipulative use of the Quarterly Treasury Refunding Announcement.
NOTE: The July, November and January Quarterly Treasury Refunding Announcement (orange "bubble" comments) all triggered major directional changes in Treasury Yield trend directions. None of Yellen's announced refunding targets were even modestly accurate. The latest defied even the most basic analysis. Yellen knows her role is to give the "narrative" to the Wall Street "SELL" side to create enough momentum that the "BUY" is forced to react to match performance "benchmarks". It's an old game!
| |
|
QUARTERLY TREASURY REFUNDING ANNOUNCMENT
MONDAY'S REFUNDING -SIZE / TBAC
HEADLINE NUMBER
Q1 ESTIMATE: 760 (expectations 797)
Q2 ESTIMATE: 202* (expectations 472)
*This is a completely made up number to avoid creating a yield spike as occurred with the August QRA (see orange bubble comments in TNX chart above).
The Treasury announced plans to increase the auction sizes of the 2- and 5-year by $3 billion per month, the 3-year by $2 billion per month, and the 7-year by $1 billion per month. As a result, the auction sizes of the 2-, 3-, 5-, and 7-year will increase by $9 billion, $6 billion, $9 billion, and $3 billion, respectively by the end of April 2024. Treasury plans to also increase both the new issue and the reopening auction size of the 10-year note by $2 billion and the 30-year bond by $1 billion. Treasury plans to maintain the 20-year bond new issue and reopening auction size.
| |
|
BURIED IN DETAIL AS 'AN ASIDE'
EXPECTATIONS
1- TREASURY BUYBACKS
- The Treasury will implement buybacks in either February or May. Look for $10bn per month in liquidity-support buybacks across the nominal coupon curve and in TIPS to start.
- A Treasury buyback announcement should add to the tailwinds for swap spreads to widen from their current levels. Intuitively, having a large counterparty that stands ready to buy Treasuries at regular intervals should have a measurable impact on swap spreads, which is empirically evident from the Fed’s past QE operations. To be sure, there are several key differences: the Treasury buyback program is more modest in size, at least initially it does not change the level of reserves, and it is designed to be uninfluenced by monetary policy and distinct from QE (that's what the purists and Fed sycophants will claim).
- However, operationally the buyback will "look and feel similar to market participants, and it will achieve some of the same objectives as QE, mainly in supporting market functioning and improving market liquidity." Importantly, wider swap spreads across the Treasury curve and smaller dispersions in ASW for off-the-runs would likely be used as a measure of the program’s effectiveness, since they directly relate to the cost of Treasury financing. The risk is that the swap spread market has already priced some probability of this announcement and the Treasury delays it until a future QRA date. However, with easier monetary policy ahead and the Fed sounding more cautious around QT risks, spreads should find a relatively high floor.
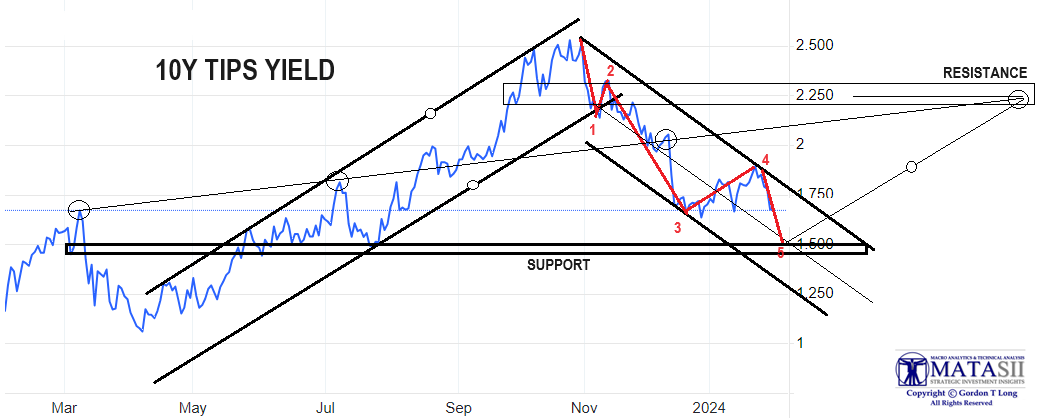
2- TIPS
- In TIPS, there is intentional uncertainty about size increases which could cause potential volatility to the 5-year and 30-year maturities.
WHY ARE TIPS (TRADING MEASURE FOR REAL RATE) IMPORTANT?
FISHER'S EQUATION
- Real Rates and Inflation Break Evens (BE) control nominal bond rates.
- 6-month core PCE is presently already annualizing 1.86%.
- The trick will be to maintain Real Rates < 2.5% (The Level of Prior Market Crashes).
| |
|
3.5% (Nominal 10Y Yield) = 1.25% (Inflation BE) + 2.25% (Real Rate)
| |
 | |
KEY POINTS
- It is now clear that a very carefully crafted plan has been executed to give the Administration maximum control over the financial markets during the 2024 election year.
- The "BTFP "arb" has given the Primary Dealers the funding to finance any need the US Treasury may require during the 2024 election year while at the same time protecting them from the risk of absorbing failed auctions.
- Treasury Secretary Yellen neither took the TBAC advice (normal procedure) nor consulted with the Primary Dealers, (standard practice so Dealers are prepared for possible auction failures), in issuing the the recent quarterly QRA. This is highly unusual?
- The QRA intentionally falsely set expectations low enough to keep rates lower than they might otherwise be.
- The newly announced use of Treasury controlled Buyback and TIPS procedures (buried in the QRA) will allow the Treasury to more effectively manage election year yield expectations:
- TIPS issuances will be used to drive Real Rates higher, assisting in making US debt rates more attractive to foreign carry trade and FX investors.
- BUYBACKS will give the Treasury effectively "QE" like powers while additionally being better able to manage the Yield Curve (with "YCC" like powers).
- Working closely with the BLS (US Economic Reporting), the PPT and the Federal Reserve (BLTP, RRP, Fed Funds Rate) has effectively given Yellen & the administration election year control.
| |
|
Q4 2023 EARNINGS:
KEY METRICS
-
Earnings Scorecard: For Q4 2023 (with 46% of S&P 500 companies reporting actual results), 72% of S&P 500 companies have reported a positive EPS surprise and 65% of S&P 500 companies have reported a positive revenue surprise.
-
Earnings Growth: For Q4 2023, the blended (year-over-year) earnings growth rate for the S&P 500 is 1.6%. If 1.6% is the actual growth rate for the quarter, it will mark the second-straight quarter that the index has reported earnings growth.
-
Earnings Revisions: On December 31, the estimated (year-over-year) earnings growth rate for the S&P 500 for Q4 2023 was 1.5%. Seven sectors are reporting higher earnings today compared to December 31 due to positive EPS surprises.
-
Earnings Guidance: For Q1 2024, 31 S&P 500 companies have issued negative EPS guidance and 17 S&P 500 companies have issued positive EPS guidance.
-
Valuation: The forward 12-month P/E ratio for the S&P 500 is 20.0. This P/E ratio is above the 5-year average (18.9) and above the 10-year average (17.6).
Positive earnings surprises reported by companies in multiple sectors (led by the Information Technology, Consumer Discretionary, and Health Care sectors), mostly offset by negative earnings surprises reported by companies in the Financials sector, have been the largest contributors to the increase in overall earnings for the index since the end of the quarter.
IS THE MARKET OVER-REACTING TO THE SECOND STRAIGHT QUARTER OF
RISING EARNINGS GROWTH??
| |
SEE DETAILS OF MAGNIFICENT 7 EARNINGS IN 'CURRENT MARKET PERSPECTIVE' BELOW | |
|
DEVELOPMENTS TO WATCH
The following are worrying developments.
BTFP "ARB" STOPPAGE: An" Immediate Halt!"
The Fed confirmed in a press release 01-24-24 that its infamous tool to deal with the March 2023 bank-panic and bank-liquidity crisis, the Bank Term Funding Program (BTFP), will cease making new loans to banks, as scheduled, on March 11.
Existing loans can continue for their term of up to
one year.
The Fed also said that, “effective immediately,” it would shut down the arbitrage with which large Money Center banks had been "gaming" the BTFP.
| |
|
|
The BTFP "arb" was fostering, such that under certain conditions, the interest rate that the Fed charged on loans at the BTFP (the rate is market-based) could fall substantially below the interest rate the Fed pays on its reserve balances (the Fed sets this rate). And that’s exactly what happened starting early November during rate-cut mania fostered by Yellen's Quarterly Treasury Refunding announcement (see TNX chart reaction) . It opened up a risk-free arbitrage opportunity that banks were incented to take full advantage of.
From July through October, the BTFP balance was around $110 billion. But at the beginning of November, it began to surge. Since November 1, it has jumped by nearly 50%, or by $52 billion, to $161 billion.
As we point out above in "TREASURY REFUNDING DURING AN ELECTION YEAR'S DEFERRED DEBT CEILING WINDOW", we believe this "arb" was lent by the banks immediately to MMF (at 10:1) which was then lent to Hedge Funds to be used as Collateral for leveraged loans (15:1) to buy US Treasury bills and thereby pocketing major profits. This process was effectively acting as an intermediary to fund the US Treasury.
$52B X 10 X 15 = $7.8T in potential Treasury Auction Buying Power Put In Place
| |
|
CONNECTING CRE CRISIS <=> BANKING CRISIS: A Global Surprise
While we are being told how strong the economy is, the actions being taken behind the scenes by the Fed and Financial Regulators is telling a very different story.
THE POST BTFP USE OF THE DISCOUNT WINDOW
Federal regulators are preparing a proposal to force US banks to utilize the Federal Reserve’s Discount Window in preparation for future bank crises. The aim appears to be to remove the stigma around tapping into this financial lifeline, part of the continuing fallout from the failures of several significant regional banks last year.
- This new policy is reminiscent of the Fed’s actions during the 2007 financial crisis, where financial authorities encouraged large banks to tap into the discount window, taking loans directly from the Federal Reserve to make it easier for distressed banks to do the same.
- The hesitancy from financial institutions to tap into this source of liquidity is justified. If the public believes a bank needs support from the Fed, it is rational for depositors to flee the bank.
- The Fed’s explicit aim is to provide cover from at-risk banks, trying to hold off bank runs.
- By strong-arming healthy banks to comply, the Fed is escalating moral hazard and leaving customers more vulnerable.
- The Fed is deliberately front running the removal of a signal of institutional risk.
CRE CONTINUES TO DETERIORATE
The state of Commercial Real Estate (CRE) is a further stress for regional banks, which are responsible for 80 percent of such mortgages.
- In the previous low-interest rate environment, investors viewed commercial real estate as “a haven for investors in need of reliable returns.” Unfortunately, this same period experienced major changes in consumer behavior.
- Online shopping, remote work, and shared office space increased at the expense of traditional brick-and-mortar locations. Covid lockdowns only further amplified these trends.
-
Commercial real estate debt is now viewed as one of the most dangerous financial assets out there, sitting right on the balance sheets of regional banks across the country.
- The Bank Term Funding Program (BTFP), allowed banks and credit unions to borrow using US Treasuries and other assets as collateral. This emergency measure reflected fears of many banks being at risk.
- The actions of the Fed and financial regulators illustrate real concerns about the health of US banks. Meanwhile, these same institutions have projected bullish optimism about the state of the economy in public.
THIS WEEK WE WITNESSED:
- New York Community Bancorp (NYCB) extending losses well below SVB lows
- The US CRE went global with massive US CRE write downs by the Japan's Aozora Bank.
- Western Alliance Bancorp's stock got "clubbed" badly.
- Shares of Zions Bancorp, Comerica and Webster Financial tumbled along with Citizens Financial, Regions Financial, SouthState, Prosperity Bancshares, Schwab, PacWest, and Huntington Bancshares.
The goal here is to re-arm the Federal Reserve’s policy arsenal. While the projections of Fed officials for rate cuts in 2024 have been packaged as reflecting the growing strength of the US economy, the reality is that
the Fed desires the option to lower rates as a strategic response to looming financial distress.
Billionaire Barry Sternlicht warned: He sees more than $1 trillion of losses for office real estate, calling the properties “one asset class that never recovered” from the pandemic.
“The office market has an existential crisis right now,” which is largely a US phenomenon because workers haven’t gone back to their desks, Sternlicht said Tuesday at the iConnections Global Alts conference in Miami Beach.
Once a $3 trillion asset class, offices now are “probably worth $1.8 trillion,” said Sternlicht, chief executive officer of Starwood Capital Group.
“There’s $1.2 trillion of losses spread somewhere, and nobody knows exactly where it all is.”
Which acronym will replace BTFP and how many trillions will it inject?
- The Fed removed the following sentence from the FOMC statement: "The US banking system is sound and resilient."
- Cynics asked why the Fed no longer sees "the US banking system is sound and resilient" - is it a signal of rumblings in the economy near-term, or was it just a lie before and now that bank dominoes are again falling?
| |
|
GLOBAL ECONOMIC INDICATORS: What This Week's Key Global Economic Releases Tell Us
JANUARY LABOR REPORT (NFP)
As you would expect of any self respecting analyst, we refuse to report the absolute garbage (propaganda for media dissemination) now coming out of the US administration's BLS! I take no interest in bashing any administration, but this has become atrocious and simply what a "banana republic" would distribute!
The new and revised BLS "Seasonal Adjustments" effectively make the NFP report unusable for any sort of realistic analysis.
| |
Here is all you can realistically glean from the report::
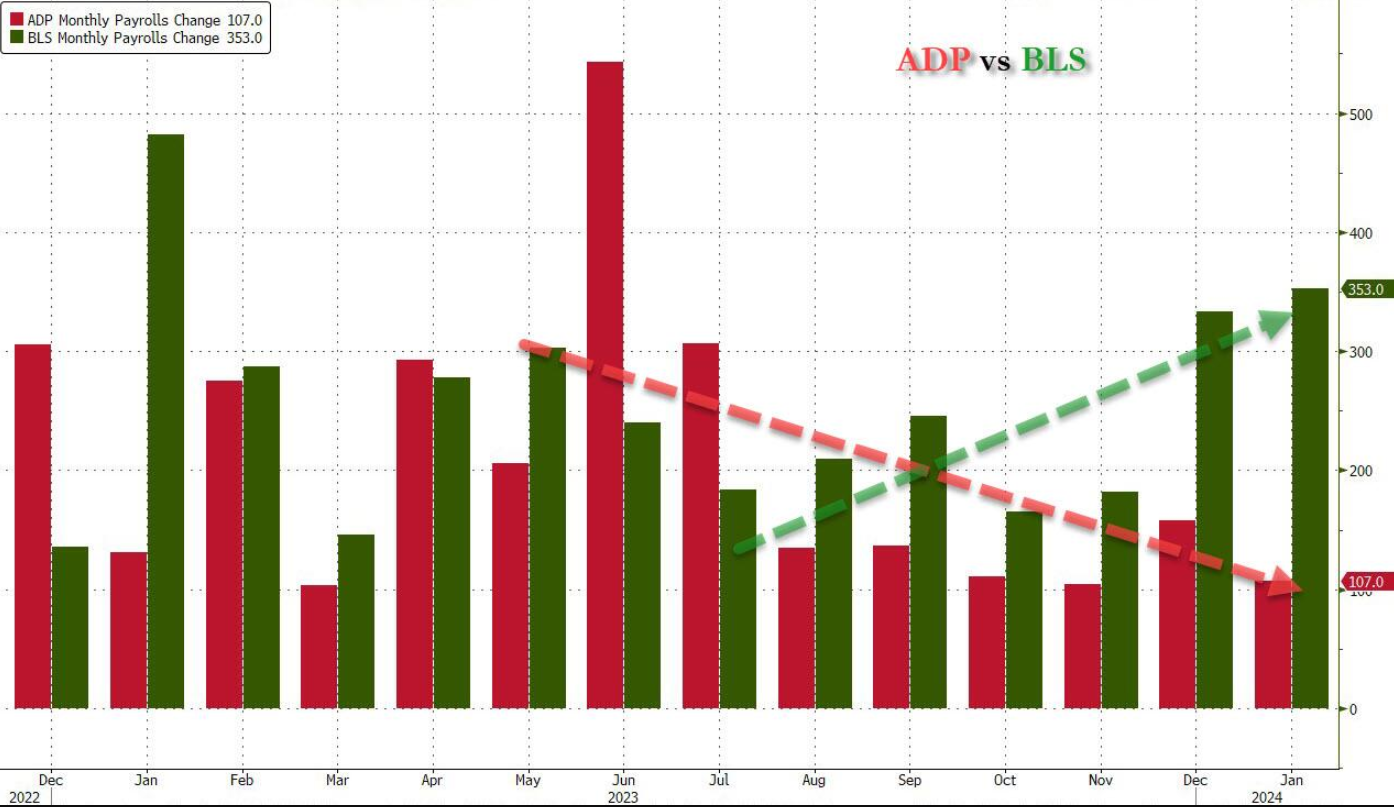
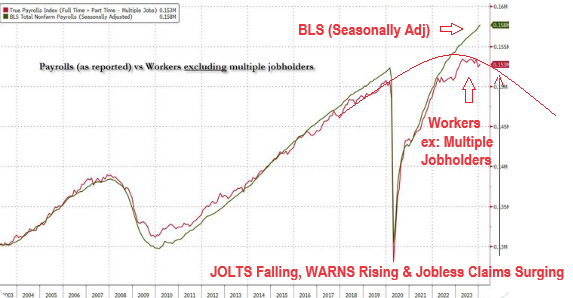
- The revised BLS Payrolls number and the ADP payrolls show: the trend is clear: the Biden admin numbers are now clearly rising, even as the impartial ADP (which directly logs employment numbers at the company level and is actually far more accurate), shows an accelerating slowdown (chart above).
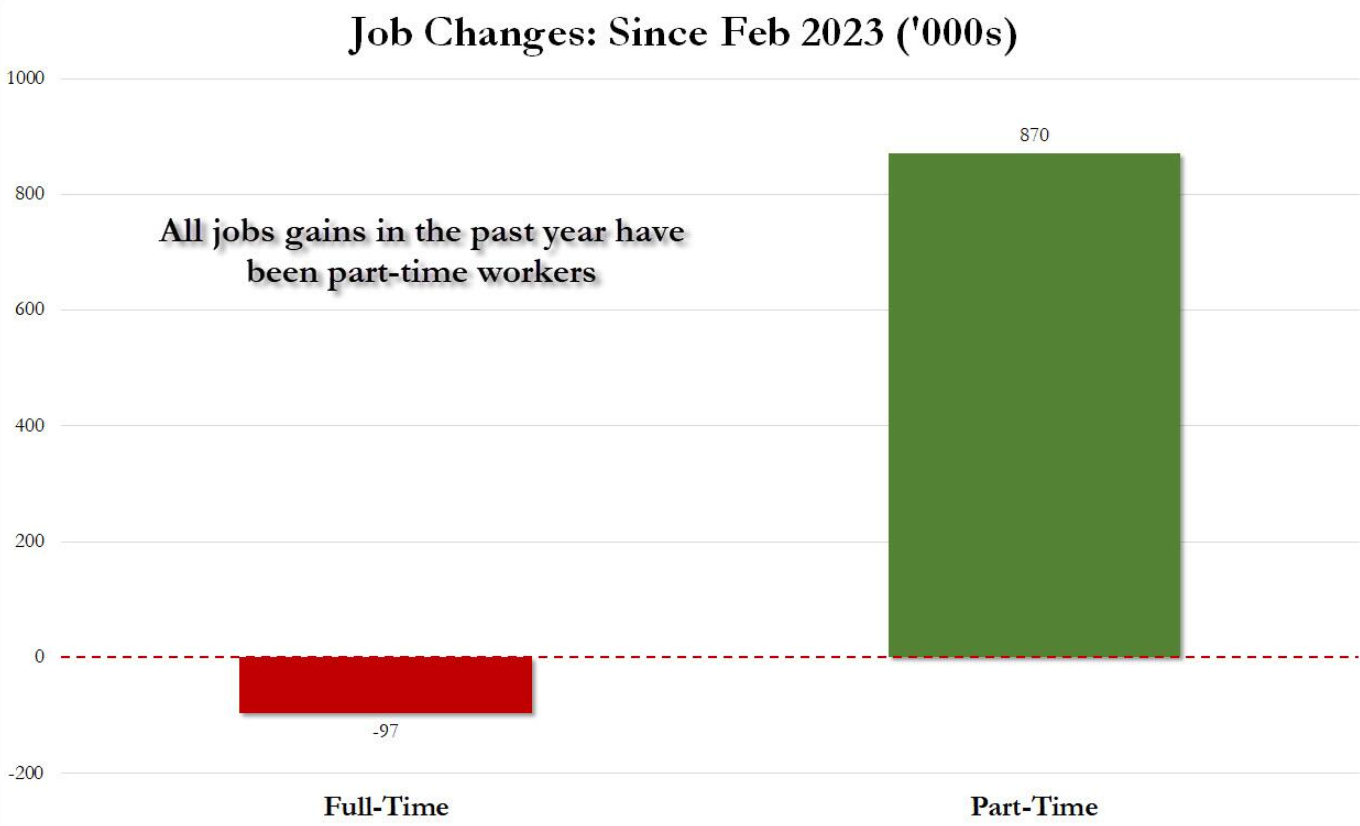
- The labor composition in the past year for all job gains has been part-time jobs! (chart below) In February 2023, the US had 133.2 million full-time jobs, or more than it does one year later! And yes, all the job growth since then has been in part-time jobs, which have increased by 870K since February 2023 (from 27.020 million to 27.890 million).
- In January, the number of native-born worker tumbled again, sliding by a massive 560K to just 129.807 million. Add to this the December data, and we get a near-record 1.9 million plunge in native-born workers in just the past 2 months! Not only has all job creation in the past 4 years been exclusively for foreign-born workers, but there has been zero job-creation for native born workers since July 2018!
- With the latest revisions, the average month in '23 was overestimated by 105k jobs.
- Depending on which methodology you prefer, you can calculate a more realistic unemployment rate that accounts for all of the missing workers: somewhere between 6.3% and 7.4% - that's not horrific, but significantly higher than "official" 3.7%.
- The economy is still adding jobs, but they're overwhelmingly lower pay, fewer hours, and either directly or indirectly paid by government.
- REMINDER: The BLS told us last month that data from Jan '24 and later months are NOT directly comparable to prior months because of methodology changes.
| |
 | |
NOW READ REPORTS FROM OTHER SOUCES THAN THE ADMINISTRATION'S BLS:
RECENT LAYOFFS ANNOUNCEMENTS:
1. Twitch: 35% of workforce
2. Hasbro: 20% of workforce
3. Spotify: 17% of workforce
4. Levi's: 15% of workforce
5. Zerox: 15% of workforce
6. Qualtrics: 14% of workforce
7. Wayfair: 13% of workforce
8. Duolingo: 10% of workforce
9. Washington Post: 10% of workforce
10. eBay: 9% of workforce
11. Business Insider: 8% of workforce
12. Paypal: 7% of workforce
13. Charles Schwab: 6% of workforce
14. UPS: 2% of workforce
15. Blackrock: 3% of workforce
16. Citigroup: 20,000 employees
17. Pixar: 1,300 employees
ADP
The January ADP report, although not the best gauge for NFP, saw 107k jobs added in January, beneath the 145k forecast and prior 158k.
- Pantheon Macroeconomics do however highlight that the ADP measure has been close to the official estimate in the past three months.
- Meanwhile, within the report the wages metrics for job stayers eased to 5.2% from 5.4%, while for job changers it eased to 7.2% from 8.0%.
- ADP's Richardson noted that "Progress on inflation has brightened the economic picture despite a slowdown in hiring and pay," and that "Wages adjusted for inflation have improved over the past six months, and the economy looks like it's headed toward a soft landing in the U.S. and globally."
JOBLESS CLAIMS
Initial jobless claims (w/e 27th Jan) rose to 224k (prev. 215k), the highest level since early November and above the expected 212k and the upper end of the forecast range, 220k, meaning the 4-wk average lifted to 207.75k from 202.50k.
-
Continued claims (w/e 20th Jan) lifted to 1.898mln (prev. 1.828mln) surpassing consensus of 1.840mln. Note, the seasonal factors had expected no change in the unadjusted data from the previous week.
- On the dataset, Pantheon Macroeconomics says, “WARN notices and Challenger layoff announcements signal that claims will move higher over the next few months, to around 250.”
- Although, as Pantheon quips, it would still leave claims at an extremely low level by past standards, but the increase would be clearly visible after months of readings at 200-to-220k, raising fears of a meaningful shift in labor market conditions.
| |
|
GLOBAL MACRO
WHAT DOES YOUR SCAN OF THE DATA BELOW TELL YOU? - THE MEDIA AVOIDS BAD NEWS!
We present the data in a way you can quickly see what is happening.
THIS WEEK WE SAW
Exp=Expectations, Rev=Revision, Prev=Previous
| |
|
UNITED STATES
- US Consumer Confidence (Jan) 114.8 vs. Exp. 115.0 (Prev. 110.7, Rev. 108.0)
-
US JOLTS Job Openings (Dec) 9.03M vs. Exp. 8.75M (Prev. 8.79M, Rev. 8.923M)
-
US CaseShiller 20 MM SA (Nov) 0.1% vs. Exp. 0.5% (Prev. 0.6%)
-
US CaseShiller 20 YY NSA (Nov) 5.4% vs. Exp. 5.8% (Prev. 4.9%)
- US Monthly Home Price MM (Nov) 0.3% (Prev. 0.3%)
- US Monthly Home Price YY (Nov) 6.6% (Prev. 6.3%)
-
US Chicago PMI (Jan) 46.0 vs. Exp. 48.0 (Prev. 46.9, Rev. 47.2)
-
US Employment Costs (Q4) 0.9% vs. Exp. 1.0% (Prev. 1.1%)
-
US ADP National Employment (Jan) 107.0k vs. Exp. 145.0k (Prev. 164.0k, Rev. 158k)
- US S&P Global Manufacturing PMI Final (Jan) 50.7 (Prev. 50.3)
- US ISM Manufacturing PMI (Jan) 49.1 vs. Exp. 47.0 (Prev. 47.4, Rev. 47.1)
- US ISM Manufacturing New Orders Idx (Jan) 52.5 (Prev. 47.1, Rev. 47.0)
- US ISM Manufacturing Prices Paid (Jan) 52.9 vs. Exp. 46.9 (Prev. 45.2)
-
US ISM Manufacturing Employment Index (Jan) 47.1 (Prev. 48.1, Rev. 47.5)
- US Construction Spending MM (Dec) 0.9% vs. Exp. 0.5% (Prev. 0.4%, Rev. 0.9%)
- US Unit Labor Costs (Q4 P) 0.5% vs. Exp. 1.6% (Prev. -1.2%, Rev. -1.1%)
-
US Initial Jobless Claims 224.0k vs. Exp. 212.0k (Prev. 214.0k, Rev. 215k)
-
US Continued Jobless Claims 1.898M vs. Exp. 1.84M (Prev. 1.833M, Rev. 1.828M)
-
US Challenger Layoffs (Jan) 82.307k (Prev. 34.817k)
CHINA
- Chinese Industrial Profits YY (Dec) 16.8% (Prev. 29.5%)
-
Chinese Industrial Profits YTD YY (Dec) -2.3% (Prev. -4.4%)
- Chinese NBS Manufacturing PMI (Jan) 49.2 vs. Exp. 49.2 (Prev. 49.0)
- Chinese NBS Non-Manufacturing PMI (Jan) 50.7 vs. Exp. 50.6 (Prev. 50.4)
- Chinese Composite PMI (Jan) 50.9 (Prev. 50.3)
- Chinese Caixin Manufacturing PMI Final (Jan) 50.8 vs. Exp. 50.6 (Prev. 50.8)
JAPAN
- Japanese Unemployment Rate (Dec) 2.4% vs. Exp. 2.5% (Prev. 2.5%)
- Japanese Jobs/Applicants Ratio (Dec) 1.27 vs. Exp. 1.28 (Prev. 1.28)
-
Japanese Industrial Production (Dec P) 1.8% vs. Exp. 2.4% (Prev. -0.9%)
-
Japanese Retail Sales YY (Dec) 2.1% vs. Exp. 4.7% (Prev. 5.3%, Rev. 5.4%)
SOUTH KOREA
- South Korean Trade Balance (USD)(Jan P) 0.3B vs. Exp. 0.8B (Prev. 4.46B)
- South Korean Exports YY (Jan P) 18.0% vs. Exp. 17.8% (Prev. 5.0%)
- South Korean Imports YY (Jan P) -7.8% vs. Exp. -7.6% (Prev. -10.8%)
- South Korean CPI MM (Jan) 0.4% vs. Exp. 0.4% (Prev. 0.0%)
- South Korean CPI YY (Jan) 2.8% vs. Exp. 2.9% (Prev. 3.2%)
UK
- UK BRC Retail Shop Price Index YY (Jan) 2.9% (Prev. 4.3%)
- UK Mortgage Approvals (Dec) 50.459k vs. Exp. 52.5k (Prev. 50.067k, Rev. 49.313k); Mortgage Lending (Dec) -0.83B GB vs. Exp. 0.25B GB (Prev. -0.039B GB, Rev. 0.006B GB); BOE Consumer Credit (Dec) 1.197B GB vs. Exp. 1.35B GB (Prev. 2.005B GB, Rev. 2.058B GB)
- UK BRC Retail Shop Price Index YY (Jan) 2.9% (Prev. 4.3%)
- UK Lloyds Business Barometer (Jan) 44 (Prev. 35)
- UK Lloyds Business Barometer (Jan) 44 (Prev. 35)
- UK Nationwide house price yy (Jan) -0.2% vs. Exp. -0.9% (Prev. -1.8%); UK Nationwide house price mm (Jan) 0.7% vs. Exp. 0.1%; "While a rapid rebound in activity or house prices in 2024 appears unlikely, the outlook is looking a little more positive."
- UK S&P Global Manufacturing PMI (Jan) 47.0 vs. Exp. 47.3 (Prev. 47.3)
AUSTRALIA
- Australian Retail Sales MM (Dec F) -2.7% vs. Exp. -1.0% (Prev. 2.0%, Rev. 1.6%)
- Australian CPI QQ (Q4) 0.6% vs. Exp. 0.8% (Prev. 1.2%)
- Australian CPI YY (Q4) 4.1% vs. Exp. 4.3% (Prev. 5.4%)
- Australian Weighted CPI YY (Dec) 3.4% vs. Exp. 3.7% (Prev. 4.3%)
-
Australian Building Approvals (Dec) -9.5% vs. Exp. 1.1% (Prev. 1.6%, Rev. 0.3%)
- Australian Home Loans MM (Dec) -4.1% vs Exp. 1.0% (Prev. 1.0%)
- Australian PPI QQ (Q4) 0.9% (Prev. 1.8%)
-
Australian PPI YY (Q4) 4.1% (Prev. 3.8%)
NEW ZEALND
-
New Zealand Trade Balance (Dec) -0.32B (Prev. -1.23B, Rev. -1.25B)
- New Zealand Exports (Dec) 5.94B (Prev. 5.99B, Rev. 5.95B)
- New Zealand Imports (Dec) 6.26B (Prev. 7.23B, Rev. 7.20B)
- New Zealand ANZ Business Confidence (Jan) 36.6 (Prev. 33.2)
- New Zealand ANZ Activity Outlook (Jan) 25.6 (Prev. 29.3)
| |  |
|
EU
- EU GDP Flash Prelim QQ (Q4) 0.0% vs. Exp. -0.1% (Prev. -0.1%); Prelim YY (Q4) 0.1% vs. Exp. 0.0% (Prev. 0.0%)
- EU GDP Flash Prelim YY (Q4) 0.1% vs. Exp. 0.0% (Prev. 0.0%)
- EU Cons Infl Expec (Jan) 11.9 (Prev. 10.5); EU Selling Price Expec (Jan) 4.6 (Prev. 3.2); EU Business Climate (Jan) -0.4 vs. Exp. -0.27 (Prev. -0.45, Rev. -0.50)
- EU Economic Sentiment (Jan) 96.2 vs. Exp. 96.2 (Prev. 96.4); Industrial Sentiment (Jan) -9.4 vs. Exp. -9.0 (Prev. -9.2); Services Sentiment (Jan) 8.8 vs. Exp. 8.0 (Prev. 8.4); Consumer Confid. Final (Jan) -16.1 vs. Exp. -16.1(Prev. -16.1)
- EU Economic Sentiment (Jan) 96.2 vs. Exp. 96.2 (Prev. 96.4)
-
EU Industrial Sentiment (Jan) -9.4 vs. Exp. -9.0 (Prev. -9.2)
- EU Services Sentiment (Jan) 8.8 vs. Exp. 8.0 (Prev. 8.4)
-
EU Business Climate (Jan) -0.4 vs. Exp. -0.27 (Prev. -0.45, Rev. -0.50)
-
EU Consumer Confidence Final (Jan) -16.1 vs. Exp. -16.1 (Prev. -16.1)
-
EU HCOB Manufacturing Final PMI (Jan) 46.6 vs. Exp. 46.6 (Prev. 46.6)
- EU HICP Flash YY (Jan) 2.8% vs. Exp. 2.8% (Prev. 2.9%)
- EU HICP-X F, E, A&T Flash YY (Jan) 3.3% vs. Exp. 3.2% (Prev. 3.4%)
- EU Unemployment Rate (Dec) 6.4% vs. Exp. 6.4% (Prev. 6.4%)
GERMANY
-
German GDP Flash YY SA (Q4) -0.2% vs Exp. -0.2% (prev. -0.4%); YY NSA(Q4) -0.4% vs. Exp. -0.4% (Prev. -0.8%); Flash QQ SA (Q4) -0.3% vs. Exp. -0.3% (Prev. -0.1%, Rev. 0.0%)
-
German GDP Flash QQ SA (Q4) -0.3% vs. Exp. -0.3% (Prev. -0.1%, Rev. 0.0%)
- German North Rhine-Westphalia State CPI MM (Jan) 0.3% (Prev. -0.1%); North Rhine-Westphalia State CPI YY (Jan) 3.0% (Prev. 3.5%); Overall, the state CPIs provide a slight hawkish bias to expectations for the 13:00GMT mainland Y/Y release, while the M/M is broadly in-line.
- German Retail Sales MM Real (Dec) -1.6% vs. Exp. 0.7% (Prev. -2.5%)
-
German Import Prices YY (Dec) -8.5% vs. Exp. -8.2% (Prev. -9.0%); Import Prices MM (Dec) -1.1% vs. Exp. -0.5% (Prev. -0.1%); Retail Sales YY Real (Dec) -1.7% (Prev. -2.4%)
-
German Unemployment Chg SA (Jan) -2.0k vs. Exp. 11.0k (Prev. 5.0k); Unemployment Rate SA (Jan) 5.8% vs. Exp. 5.9% (Prev. 5.9%); Unemployment Total SA (Jan) 2.694M (Prev. 2.703M); Unemployment Total NSA (Jan) 2.805M (Prev. 2.637M)
- German CPI Prelim MM (Jan) 0.2% vs. Exp. 0.2% (Prev. 0.1%)
- German CPI Prelim YY (Jan) 2.9% vs. Exp. 3.0% (Prev. 3.7%)
- German HICP Prelim MM (Jan) -0.2% vs. Exp. -0.1% (Prev. 0.2%)
- German HICP Prelim YY (Jan) 3.1% vs. Exp. 3.2% (Prev. 3.8%)
- German Unemployment Change SA (Jan) -2.0k vs. Exp. 11.0k (Prev. 5.0k)
- German Unemployment Rate SA (Jan) 5.8% vs. Exp. 5.9% (Prev. 5.9%)
-
German HCOB Manufacturing PMI (Jan) 45.5 vs. Exp. 45.4 (Prev. 45.4)
FRANCE
-
French GDP Preliminary QQ (Q4) 0.0% vs Exp. 0.0% (Prev. -0.1%)
- French CPI Prelim YY NSA (Jan) 3.10% (Prev. 3.70%); CPI Prelim MM NSA (Jan) -0.2% (Prev. 0.10%); CPI (EU Norm) Prelim YY (Jan) 3.4% vs. Exp. 3.3% (Prev. 4.1%)
- French Producer Prices MM (Dec) 0.1% (Prev. 2.4%, Rev. 2.3%); Producer Prices YY (Dec) -0.90% (Prev. 0.30%)
- s YY (Dec) -0.8% (Prev. 0.7%, Rev. -1.5%)
SPAIN
- Spanish CPI YY Flash NSA (Jan) 3.4% (Prev. 3.10%); Core 3.6% (prev. 3.8%); CPI MM Flash NSA (Jan) 0.1% (Prev. 0.00%)
- Spanish HICP Flash MM (Jan) -0.2% vs. Exp. -0.40% (Prev. 0.00%); HICP Flash YY (Jan) 3.5% vs. Exp. 3.1% (Prev. 3.3%)
- Spanish Estimated GDP YY (Q4) 2.0% vs. Exp. 1.50% (Prev. 1.80%, Rev. 1.0%); QQ 0.6% vs Exp. 0.2% (Prev. 0.3%, Rev. 0.4%); QQ (Q4) 0.6% vs. Exp. 0.2% (Prev. 0.3%, Rev. 0.4%)
- Spanish HICP Flash YY (Jan) 3.5% vs. Exp. 3.1% (Prev. 3.3%)
- Spanish Retail Sales YY (Dec) 3.1% (Prev. 5.2%)
ITALY
- Italian GDP Prelim QQ (Q4) 0.2% (Prev. 0.Italian Unemployment Rate (Dec) 7.2% vs. Exp. 7.6% (Prev. 7.5%, Rev. 7.4%)
- 1%); YY (Q4) 0.5% vs. Exp. 0.3% (Prev. 0.1%)
SWITZERLAND
- Swiss KOF Indicator (Jan) 101.5 vs. Exp. 98.2 (Prev. 97.8, Rev. 98.0)
- Swiss Trade (Dec) 1248.0M CH (Prev. 3707.0M CH, Rev. 3833M CH); Watch Exports +5.5% Y/Y (prev. +3.1%)
- Swedish Overall Sentiment (Jan) 90.5 (Prev. 84.3); Manufacturing Confidence (Jan) 99.3 (Prev. 95.1); Consumer Confidence SA (Jan) 82.3 (Prev. 74.5); Total Industry Sentiment (Jan) 91.7 (Prev. 86.6)
| |
CURRENT MARKET PERSPECTIVE | |
|
A BIG WEEK FOR THE MAGNIFICENT SEVEN
MAG-7 SHIFTING TOWARDS "FAB 4" v "MEH 3'
Click All Charts to Enlarge
| |
|
1 - SITUATIONAL ANALYSIS
NEAR TERM 'TAIL WINDS' STILL STRONG!
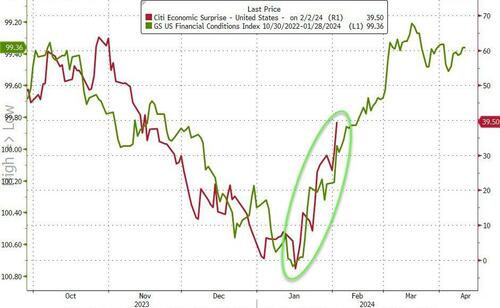
The lagged effect of the massive loosening of financial conditions is now hitting.
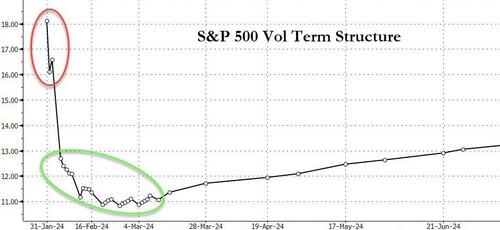
CHART RIGHT: The vol market is pricing some 'uncertainty' in the next few days, then a return to the usual. The largest technical in the equity market is corporate stock repurchase, and we’re just entering the open season for the biggest buybacks to resume (early February).
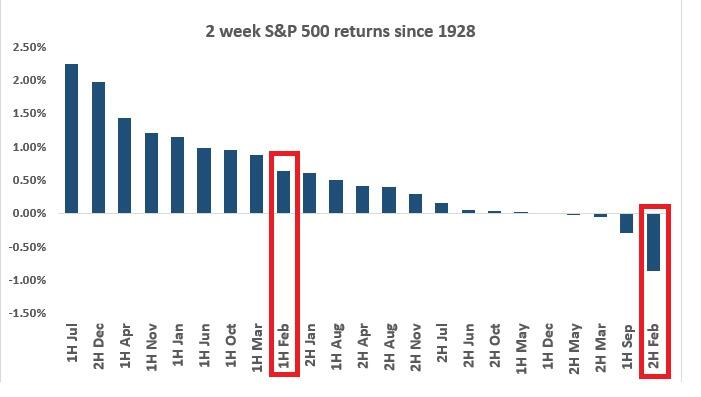
CHART BELOW
Strength in first half of February and weakness in second half. February is typically a tricky month, with the notably bad performance in the last two weeks. February also brings a heavy slate of UST supply (rising rates).
| |
|
|
MAGNIFICENT SEVEN - WEEKLY
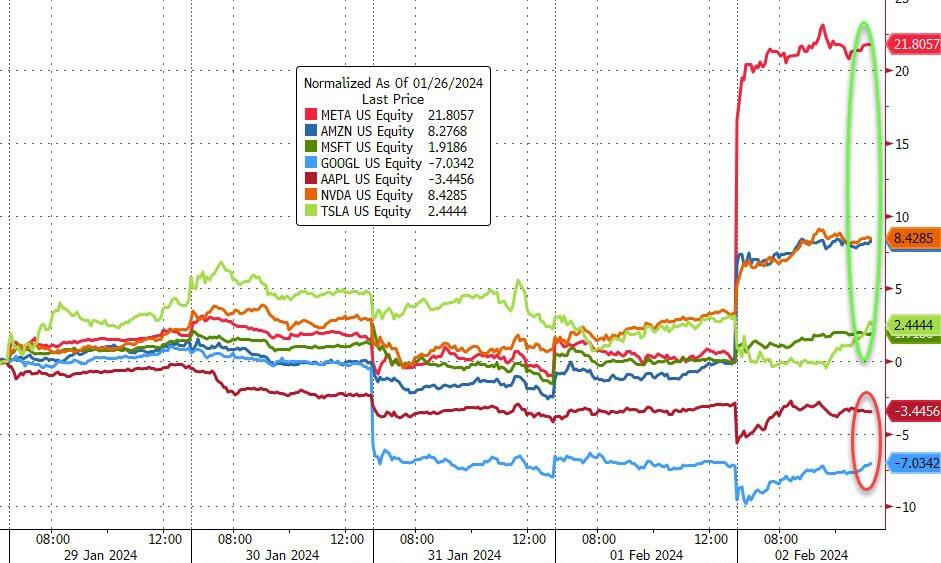
The Magnificent 7 basket of 7 stocks soared to new highs this week. However, the 7 is now only 4!
META, NVDA, MSFT & TSLA are hot, AMZN flat with GOOG & AAPL quite weak! Suddenly, MSFT is now bigger than AAPL, and AMZN is bigger than GOOGL!
Friday's gain for META was the biggest single-session market value addition, eclipsing the $190 billion gains made by AAPL and AMZN in 2022.
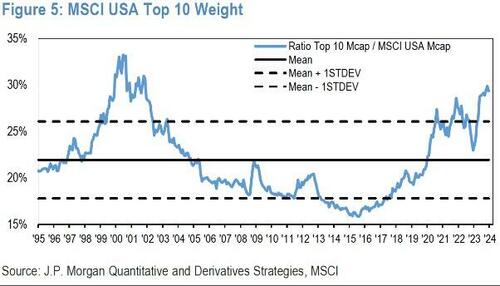
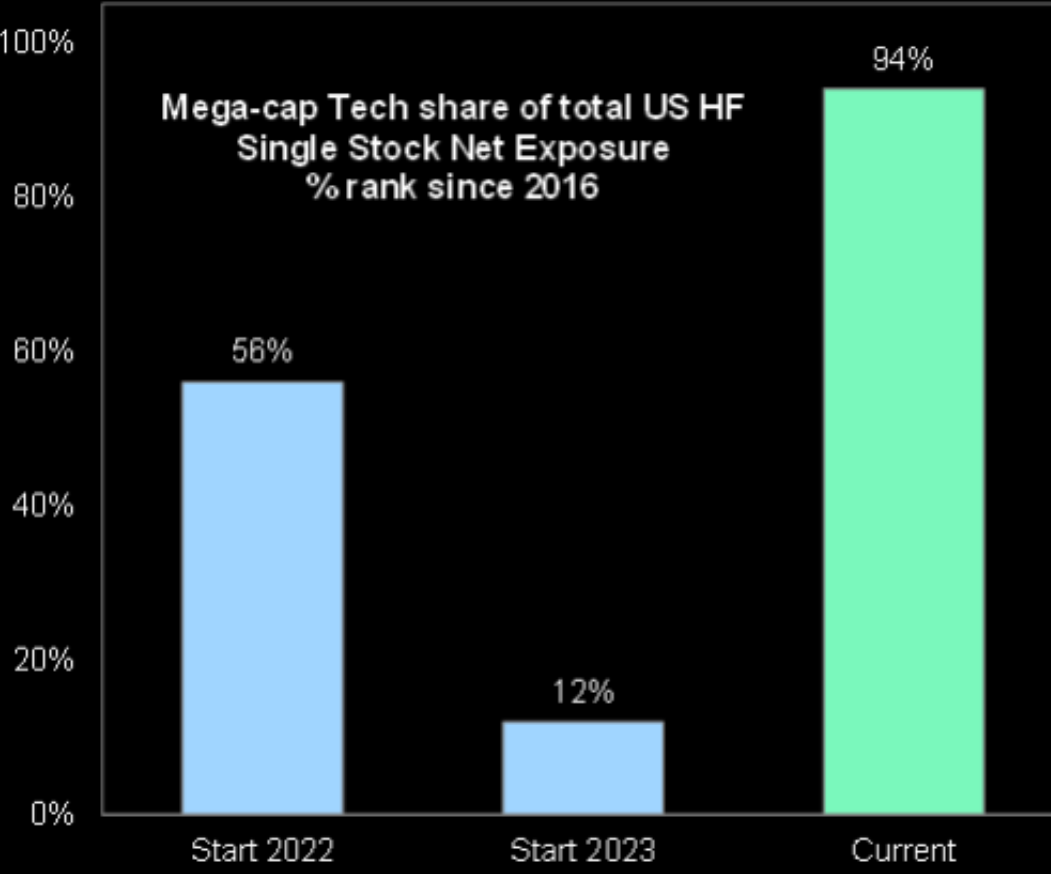
Meanwhile technology overall soared for the 13th week of the last 14 weeks as the Nasdaq rallied 1.5% this week. Extreme concentration in the S&P 500 is being driven by a continuously growing AI bubble.
- The AI sector minted 22 new unicorns (startups valued at $1B+) in 2023, marking a 39% decline YoY.
- However, it fared far better than other sectors, like fintech (-78% drop), digital health (-79%), and retail tech (-88%).
- Within AI, generative AI companies are reaching unicorn status at hyper speed.
-
GenAI unicorns hit the $1B valuation mark in just over 3 years — 50% less than the average time for all other unicorns.
| |
- The Market is soaring because AI hasn't displaced any jobs YET.
- The Market is soaring because every tech company is betting AI will displace millions of jobs SOON.
And so, 'you are CURRENTLY here'.
| | |
Market concentration is eerily similar to the the run-up to the Dotcom Bubble bursting! | | |
Magnificent Earnings Growth
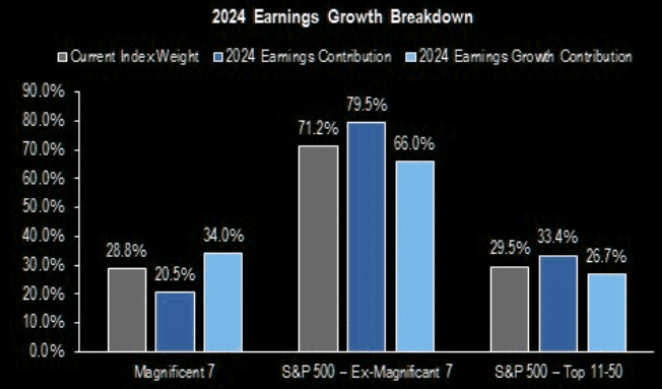
Magnificent 7 represents 21% of 2024 earnings, but 34% of 2024 consensus earnings growth.
| |
Magnificent Sales Growth
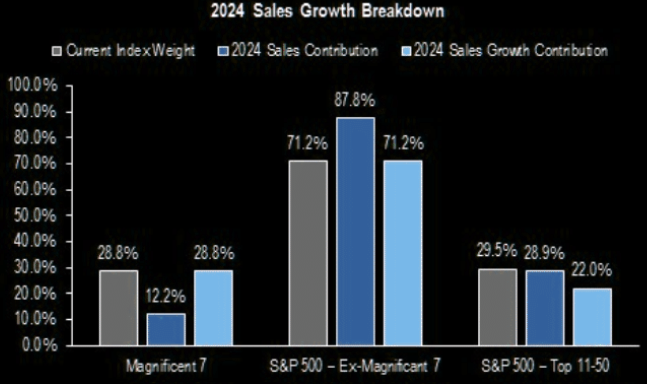
Magnificent 7 represents 12% of 2024 sales, but 29% of 2024 consensus sales growth.
| |
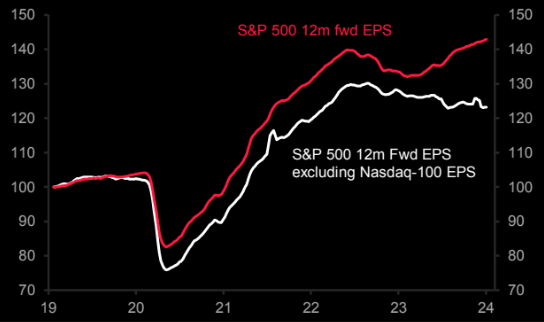
The world is flat without the Magnificent 7 (or here actually NASDAQ 100). Excluding the Nasdaq - 100 EPS cycle, US and global equities’ EPS would be flat to down over the past two years. | | |
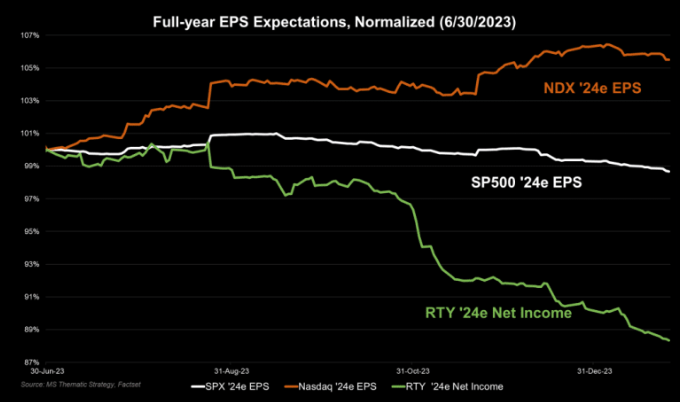
The positive tech earnings revision does not look that extreme. Can we actually get a scenario where tech EPS goes parabolic and the other sectors try to some catch-up? | | |
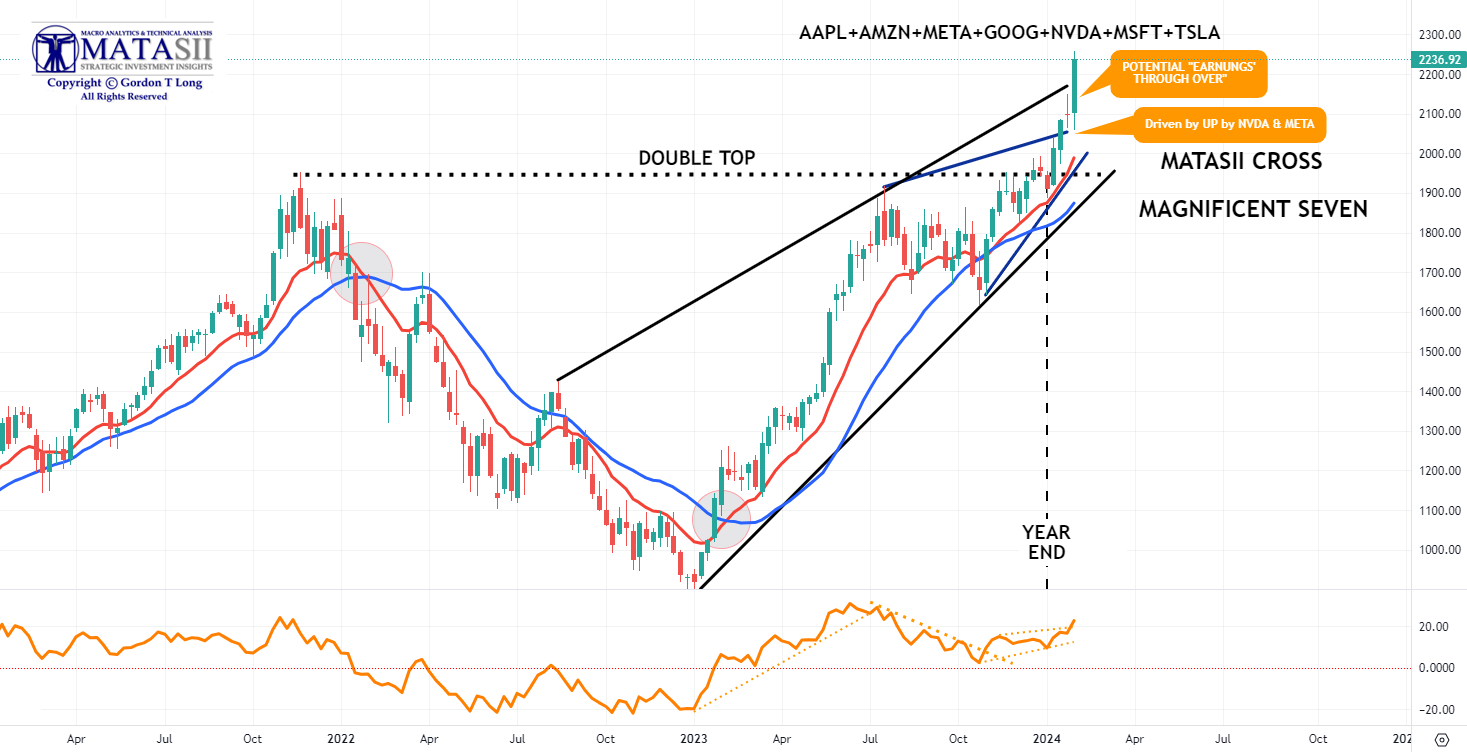
MATASII CROSS: SIGNALLING A MAG-7 BUY | |
YOUR DESKTOP / TABLET / PHONE ANNOTATED CHART
Macro Analytics Chart Above: SUBSCRIBER LINK
| |
|
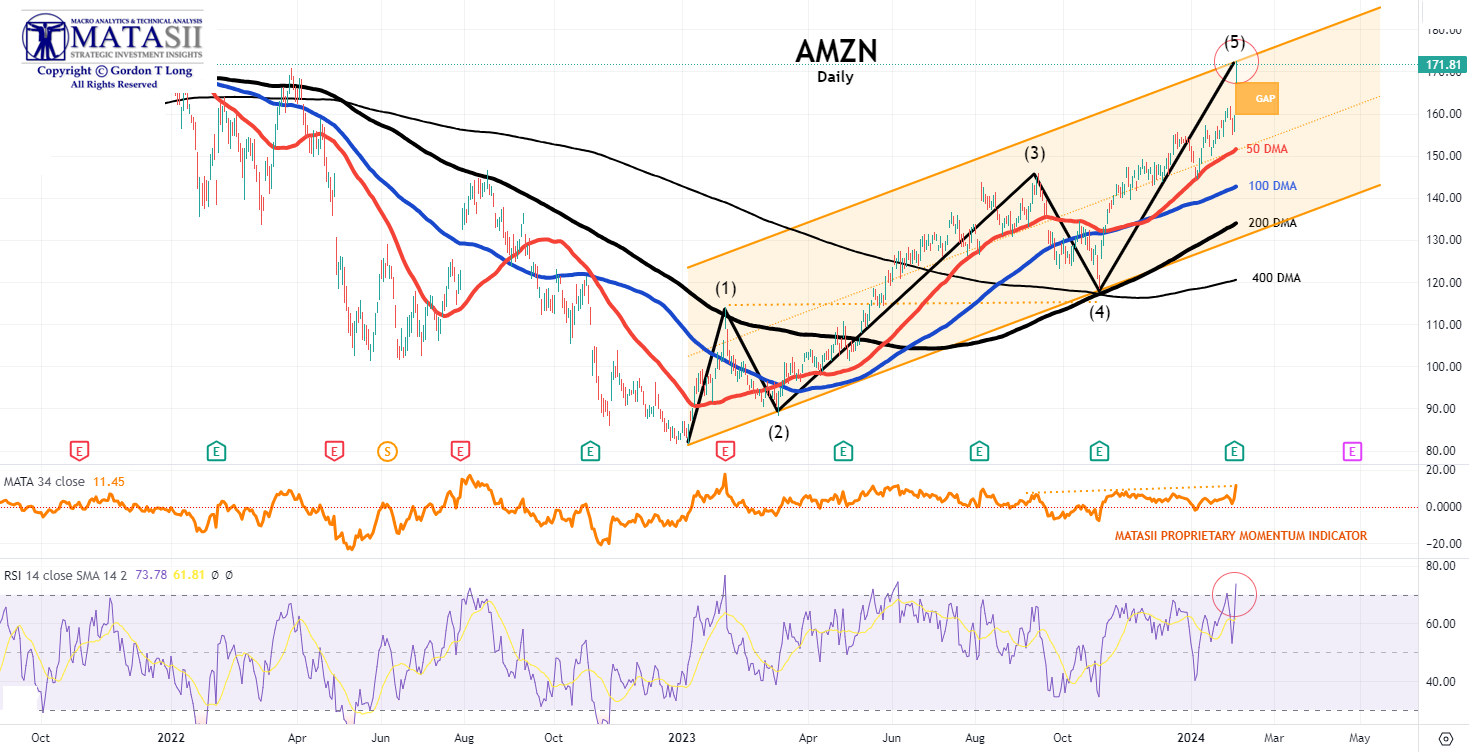
AMAZON
Amazon (AMZN) +7.9%: Was also very impressive – EPS and revenue topped expectations and it lowered its cost-to-serve on a per-unit basis globally for the first time since 2018.
Amazon.com Inc (AMZN) Q4 2023 (USD): EPS 1.00 (exp. 0.80), Revenue 169.96bln (exp. 166.21bln)
- SALES BREAKDOWN:
- Online stores 70.54bln (exp. 68.91bln)
- Physical Stores 5.15bln (exp. 5.23bln)
- Third-Party Seller Services 43.56bln (exp. 41.96bln)
- AWS 24.20bln (exp. 24.22bln)
- GEOGRAPHICAL REGIONS:
- North America 105.51bln (exp. 102.88bln)
- International 40.24bln (exp. 38.96bln)
- KEY METRICS:
- Third-party seller services net sales excluding F/X +19% (exp. +15.9%)
- AWS net sales excluding F/X +13% (exp. +11.8%)
- Operating income 13.21bln (exp. 10.49bln)
- Operating margin 7.8% (exp. 6.17%)
- North America operating margin +6.1% (exp. +4.12%)
- International operating margin -1% (exp. -1.27%)
- Fulfillment expense 26.10bln (exp. 25.2bln)
- GUIDANCE:
- Q1 net sales view 138.0-143.5bln (exp. 142.01bln)
- Q1 operating income view 8-12bln (exp. 9.1bln)
- CFO said improved delivery speeds have led to increased purchase frequency by customers across major geographies, and there are no immediate plans for dividend.
- Shares rose 7.1% after-market. Index weightings: SPX (3.5%), NDX (4.9%).
| |
|
YOUR DESKTOP / TABLET / PHONE ANNOTATED CHART
Macro Analytics Chart Above: SUBSCRIBER LINK
| |
|
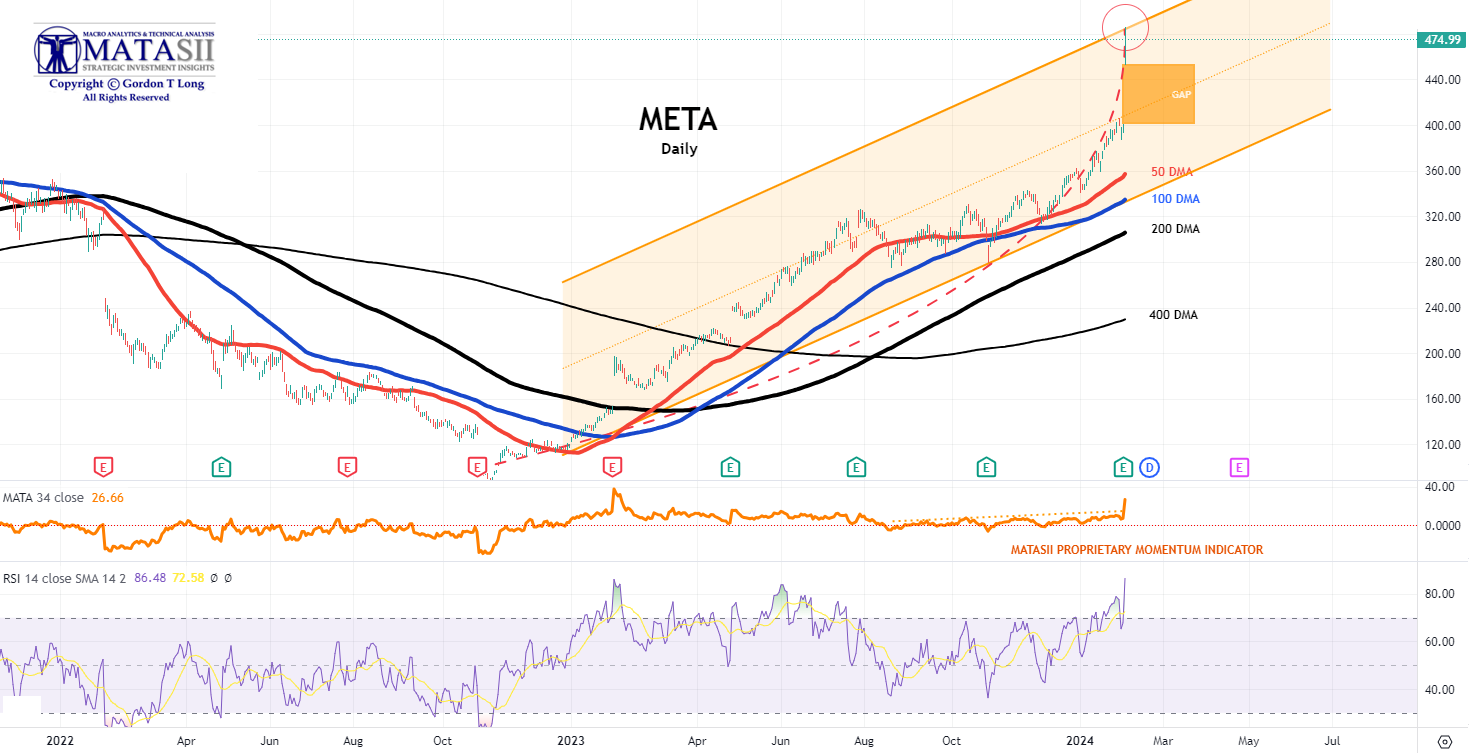
META
Meta (META) +20.3%: Stellar report; top- and bottom-line beats, boosted share buyback, declared its first ever dividend, and Q1 revenue guidance was better-than-expected.
Meta Platforms Inc (META) Q4 2023 (USD): EPS 5.33 (exp. 4.96), Revenue 40.11bln (exp. 39.17bln); authorized 50bln increase to share buyback program and declared cash quarterly dividend of 0.50/shr.(META +15%, AMZN +7%, AAPL -3%).
- KEY METRICS:
- Advertising revenue 38.71bln (exp. 38.12bln)
- Facebook DAUs 2.11bln (exp. 2.07bln)
- Facebook MAUs 3.07bbln (exp. 3.06bln)
- Ad impressions +21% (exp. +24.6%)
- Average Family service users per day 3.19bln (exp. 3.11bln)
- Average Family service users per month 3.98bln (exp. 3.93bln)
- GUIDANCE:
- Q1 revenue view 34.5-37bln (exp. 33.34bln)
- Meta (META) noted the FTC is seeking to substantially modify consent order on Meta and if contesting is unsuccessful, this could impose additional restrictions on its ability to operate and would adversely impact its business.
- CEO said the Co. is getting ready to roll out AI services more widely in coming months. Threads now has more people using it daily than initial launch and Metaverse focus this year is going to be growing mobile version of Horizon.
- CFO said Co. will discontinue reporting of Facebook monthly and daily active users. Co. expects to maintain an active share repurchase program.
- Shares rose 15.2% after-market. Index weightings: SPX (2.2%), NDX (4.2%).
| |
|
YOUR DESKTOP / TABLET / PHONE ANNOTATED CHART
Macro Analytics Chart Above: SUBSCRIBER LINK
| |
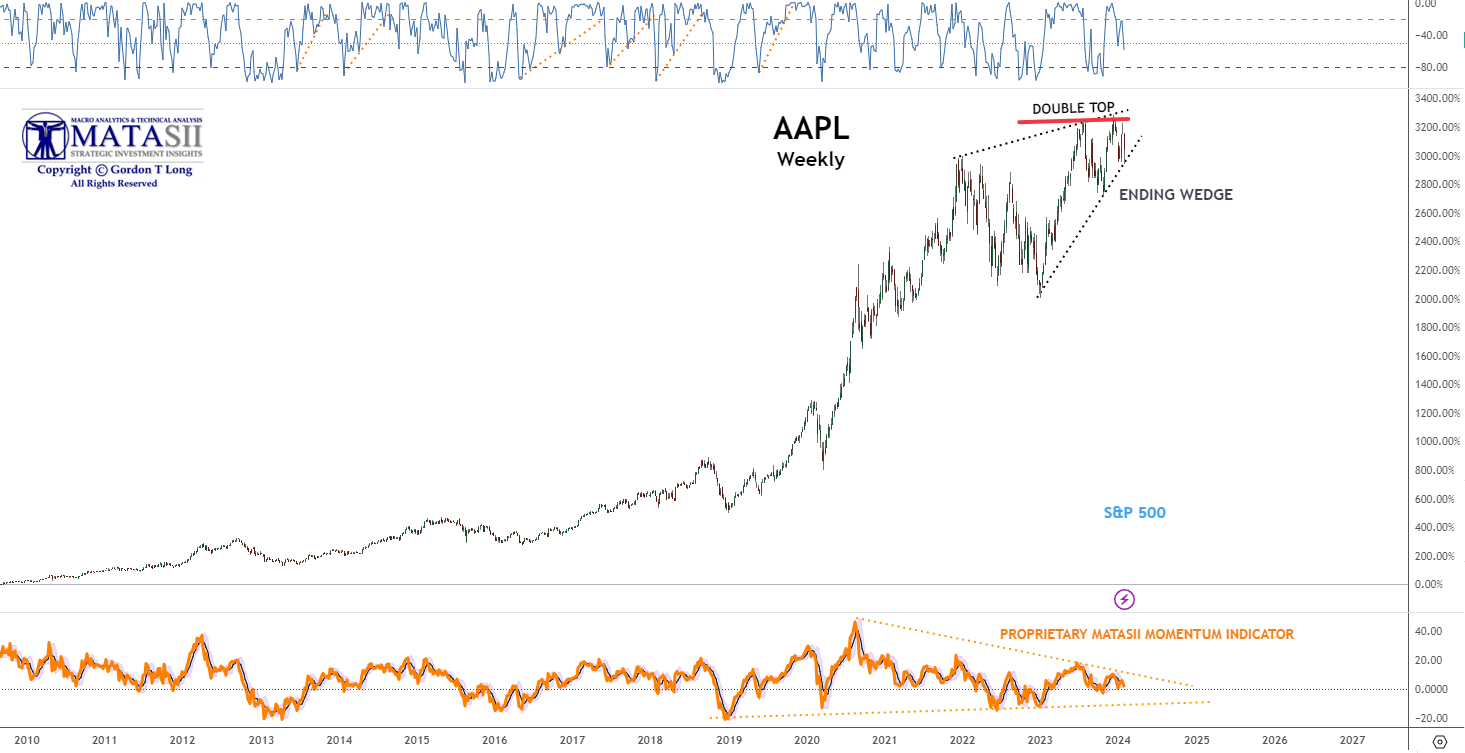
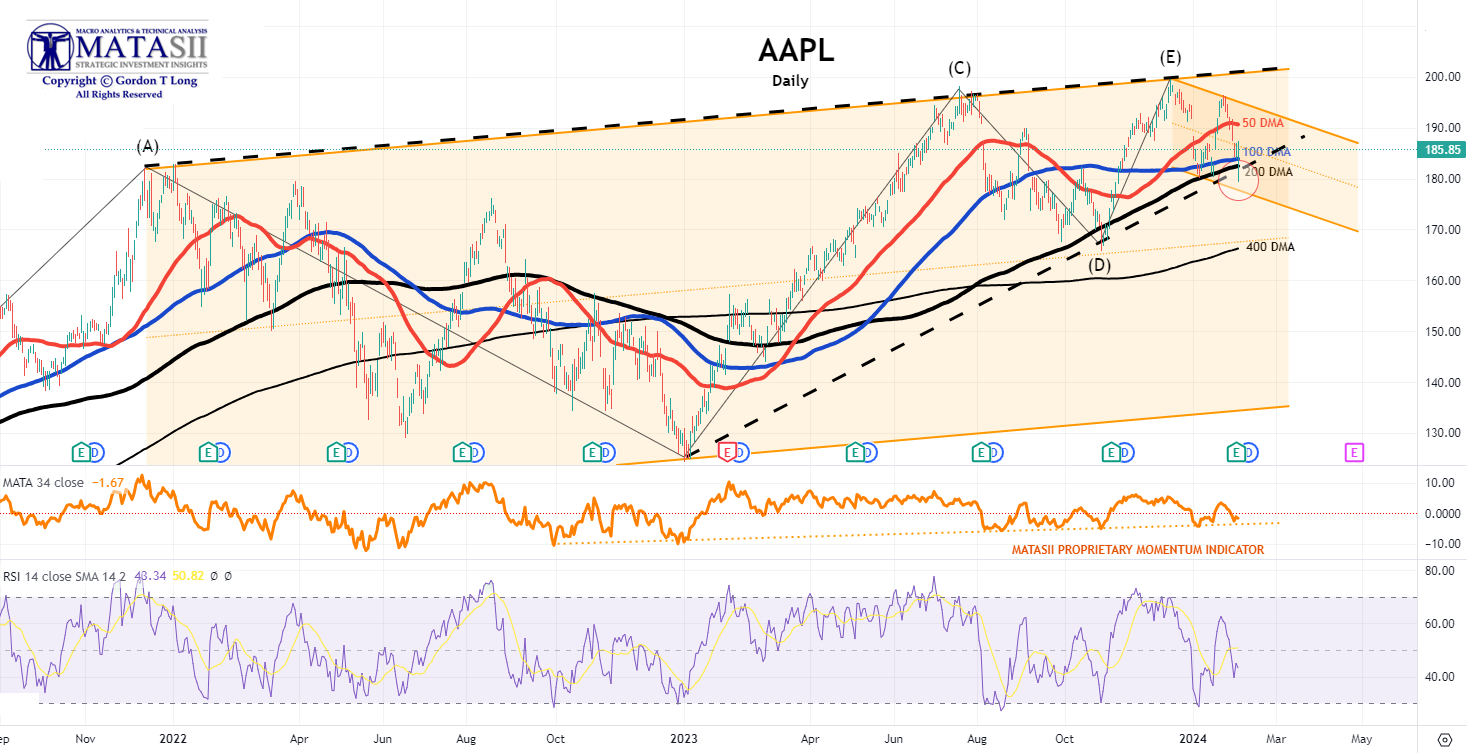
APPLE
Apple (AAPL) -0.5%: Underwhelming – Greater China revenues, Mac, iPad, Wearables, and Services revenues all missed, although headline metrics beat.
Apple Inc (AAPL) - Q1 2024 (USD): EPS 2.18 (exp. 2.10), Revenue 119.58bln (exp. 117.91bln). Greater China revenue 20.82bln (exp. 23.5bln).
-
REVENUE BREAKDOWN: Products 96.46bln (exp. 95.14bln).iPhone 69.70bln (exp. 68.55bln). Mac 7.78bln (exp. 7.9bln). iPad 7.02bln (exp. 7.06bln). Wearables, home and accessories 11.95bln (exp. 12.02bln). Service 23.12bln (exp. 23.37bln).
-
KEY METRICS: Total operating expenses 14.48bln (exp. 14.62bln). Gross margin 54.86bln (exp. 53.56bln). Cash and cash equivalents 40.76bln (exp. 38.81bln).
- EXPECTATIONS
- Expects March quarter total revenue and iPhone revenue to be similar to the previous year after accounting for inventory replenishment.
- Expects gross margins between 46%-47% for fiscal Q2.
- Expects operating expenses of USD 14.3bln-14.5bln in fiscal Q2.
- Expects services business to show double-digit growth similar to the December quarter in fiscal Q2. CEO Cook said the Co. will make announcements this year on new AI features.
- CEO Cook added that FX was a headwind for China sales, and the decline in China sales was in part on a stronger USD.
- Shares fell 2.9% after-market. Index weightings: SPX (6.6%), NDX (8.7%), DJIA (3.2%)
CHART BELOW
APPL i-Phone sales & inventories along with new Chinese policies have been pressuring Apple performance. The Monthly chart is suggestive of Apple may be starting to lose some of the "luster" that it has long held!
| |
|
YOUR DESKTOP / TABLET / PHONE ANNOTATED CHART
Macro Analytics Chart Above: SUBSCRIBER LINK
| |
|
YOUR DESKTOP / TABLET / PHONE ANNOTATED CHART
Macro Analytics Chart Above: SUBSCRIBER LINK
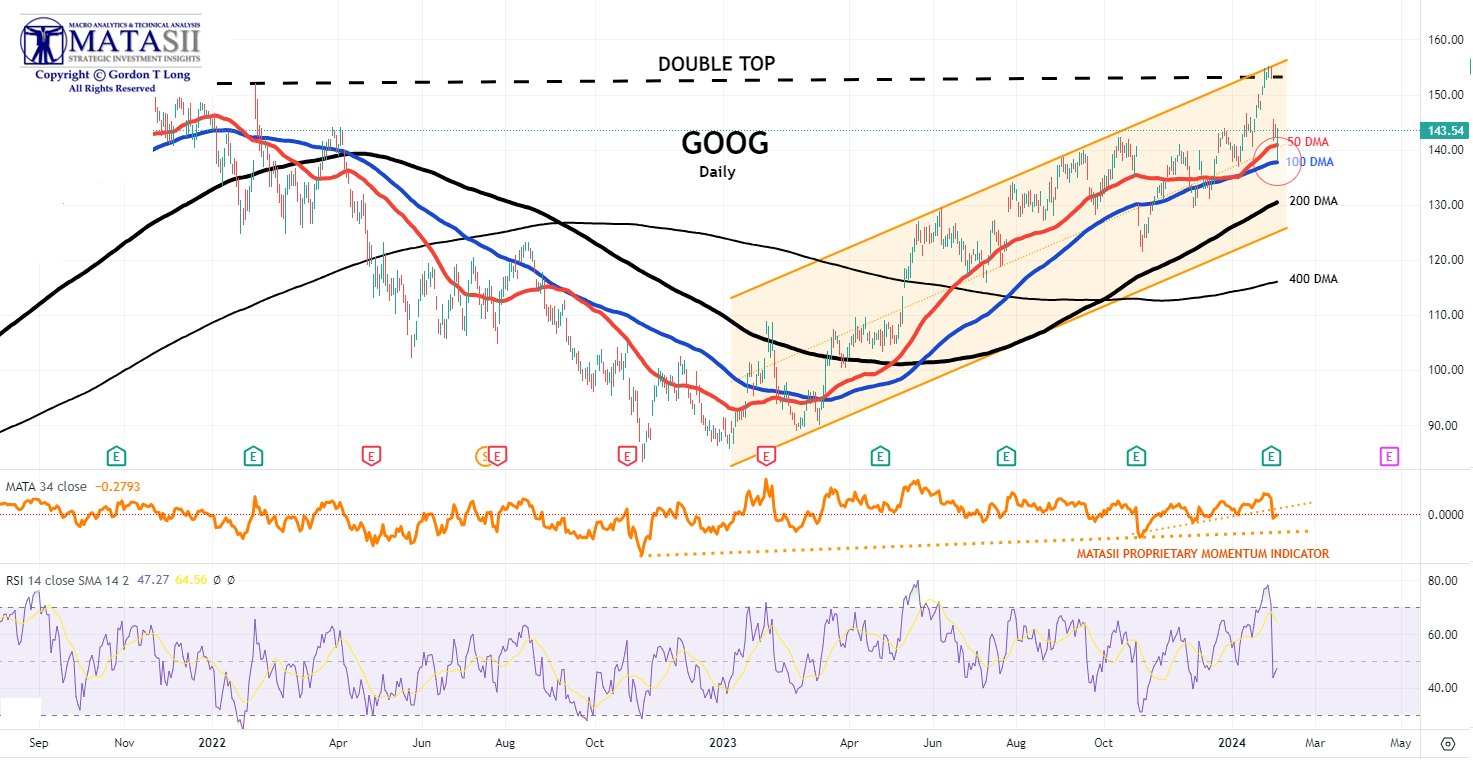
| NOTE: Alphabet (GOOG) and Microsoft (MSFT) both fell after the earnings (see below). This was before Powell "poured" water during the FOMC "presser" Wednesday when he indicated Rate cuts in March are not going to happen! "Higher Rates For Longer" are not positive for Mag-7 stocks dependent on market leverage for their stock multiples. | |
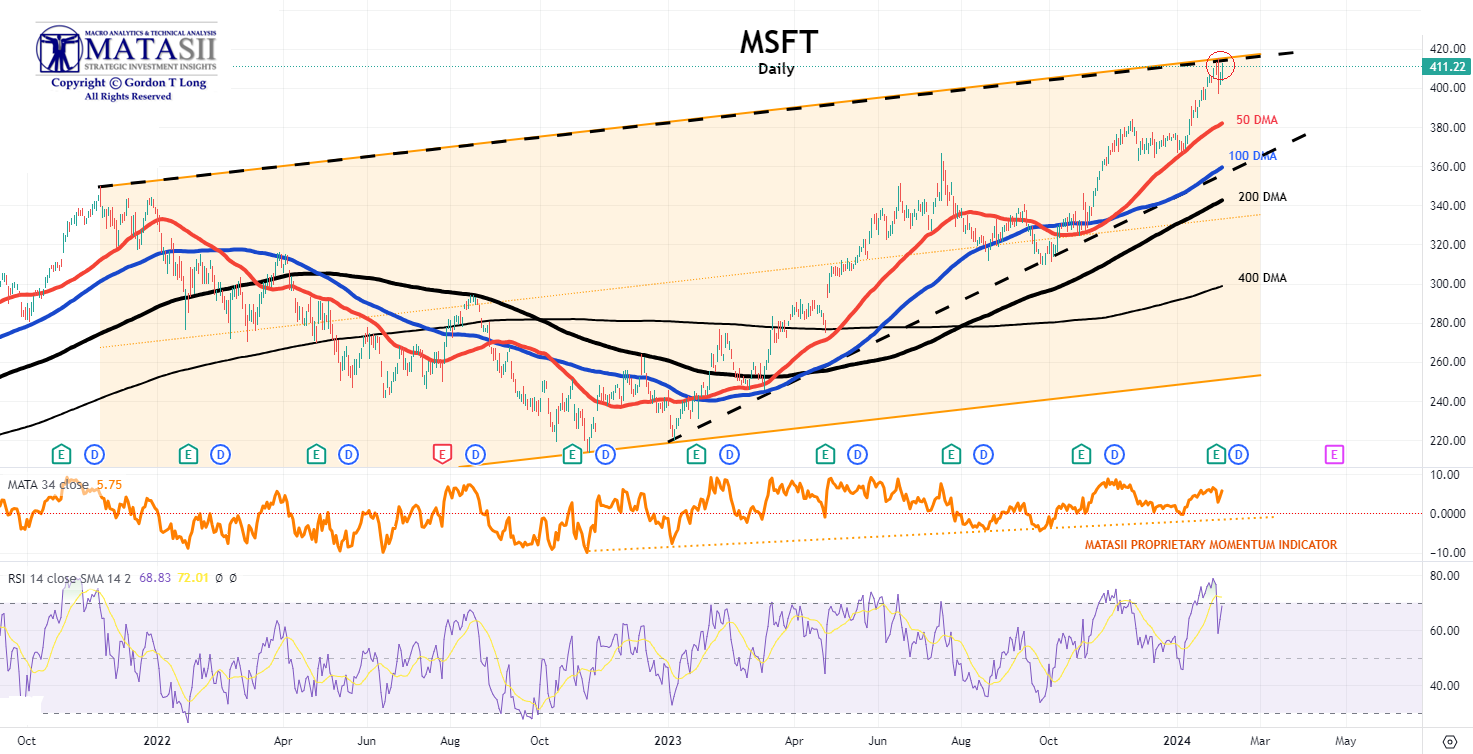
MICROSOFT
Microsoft (MSFT) fell by 0.3% after Q3 More Personal Computing was guided below forecasts.
- Microsoft Corp (MSFT) Q2 2024 (USD):
- EPS 2.93 (exp. 2.78)
- Revenue 62.02bln (exp. 61.1bln)
- Cloud revenue 33.7bln (exp. 32.31bln)
- Sees Q3 Revenue between USD 60bln-61bln (exp. 60.86bln) and
- Intelligent Cloud rev. 26.0bln-26.3bln (exp. 25.9bln)
- More Personal Computing rev. 14.7bln-15.1bln (exp. 15.4bln)
- Shares fell 0.3% aftermarket.
| |
|
YOUR DESKTOP / TABLET / PHONE ANNOTATED CHART
Macro Analytics Chart Above: SUBSCRIBER LINK
| |
|
ALPHABET (GOOG)
Alphabet (GOOG) slumped 5.8% after advertising revenue missed,
- Alphabet Inc (GOOGL) Q4 2023 (USD):
- EPS 1.64 (exp. 1.59),
- Revenue 86.31bln (exp. 85.33bln)
- Google advertising revenue USD 65.52bln (exp. 65.8bln)
- YouTube ads revenue USD 9.20bln (exp. 9.16bln)
- Google Services revenue USD 76.31bln (exp. 75.97bln)
- Google Cloud revenue USD 9.19bln (exp. 8.95bln)
- Shares fell 5.8% aftermarket after advertising revenue missed expectations.
| |
|
YOUR DESKTOP / TABLET / PHONE ANNOTATED CHART
Macro Analytics Chart Above: SUBSCRIBER LINK
| |
|
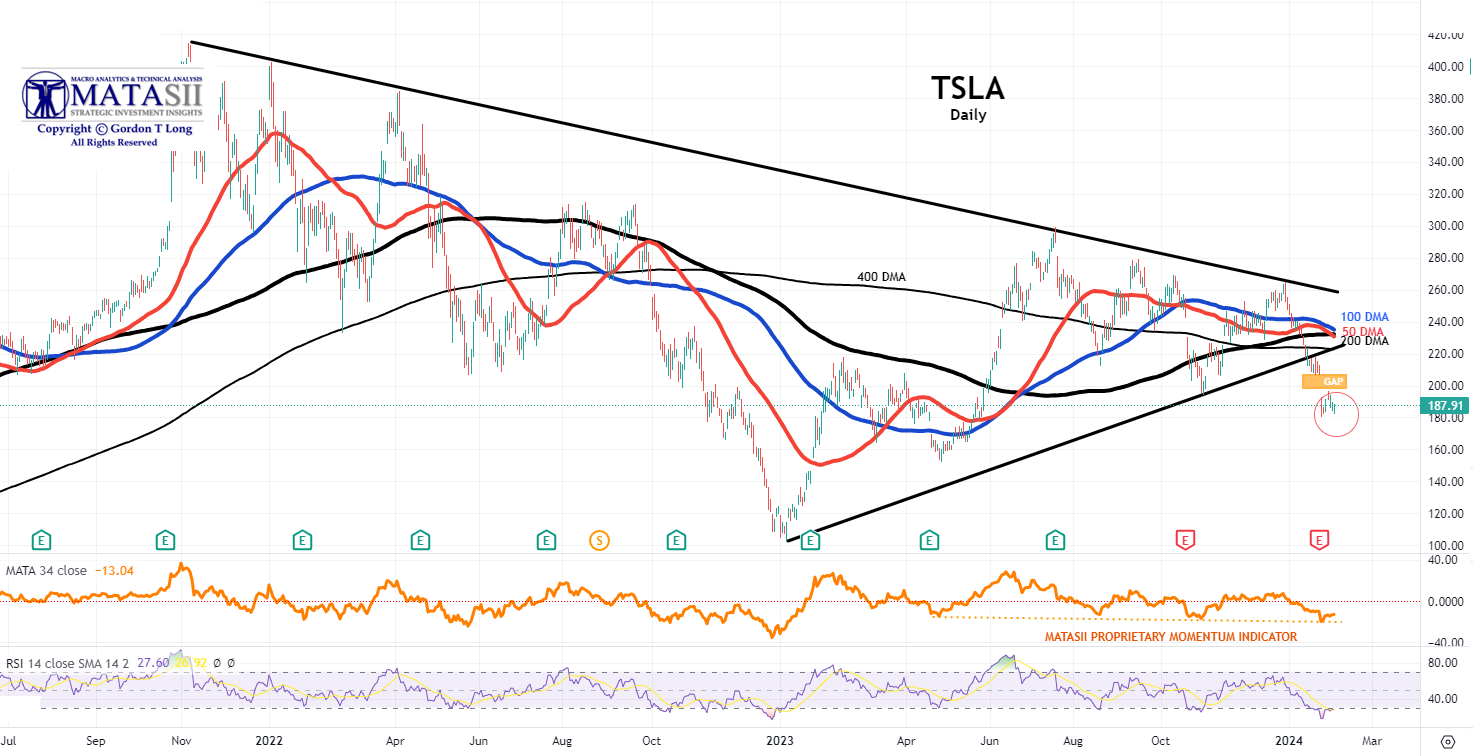
TESLA (TSLA)
Tesla (TSLA)
Even with major positive news like below, TSLA has gapped down.
- Plans to buy chips from AMD as part of its AI computing hardware spending.
- Separately, Tesla expects CapEx to eclipse USD 10bln in 2024.
- Expects CapEx to be between USD 8-10bln (prev. 7-9bln) in 2025 & 2026.
| |
|
YOUR DESKTOP / TABLET / PHONE ANNOTATED CHART
Macro Analytics Chart Above: SUBSCRIBER LINK
| |
3 - TECHNICAL ANALYSIS
US EQUITY MARKETS
CONTROL PACKAGE
There are FIVE charts we have outlined in prior chart packages that we will continue to watch closely as a "control set".
-
The S&P 500 (CHART LINK)
-
The DJIA (CHART LINK)
-
The Russell 2000 through the IWM ETF (CHART LINK),
-
The MAGNIFICENT SEVEN (CHART ABOVE WITH MATASII CROSS - LINK)
-
Nvidia (NVDA) (CHART LINK)
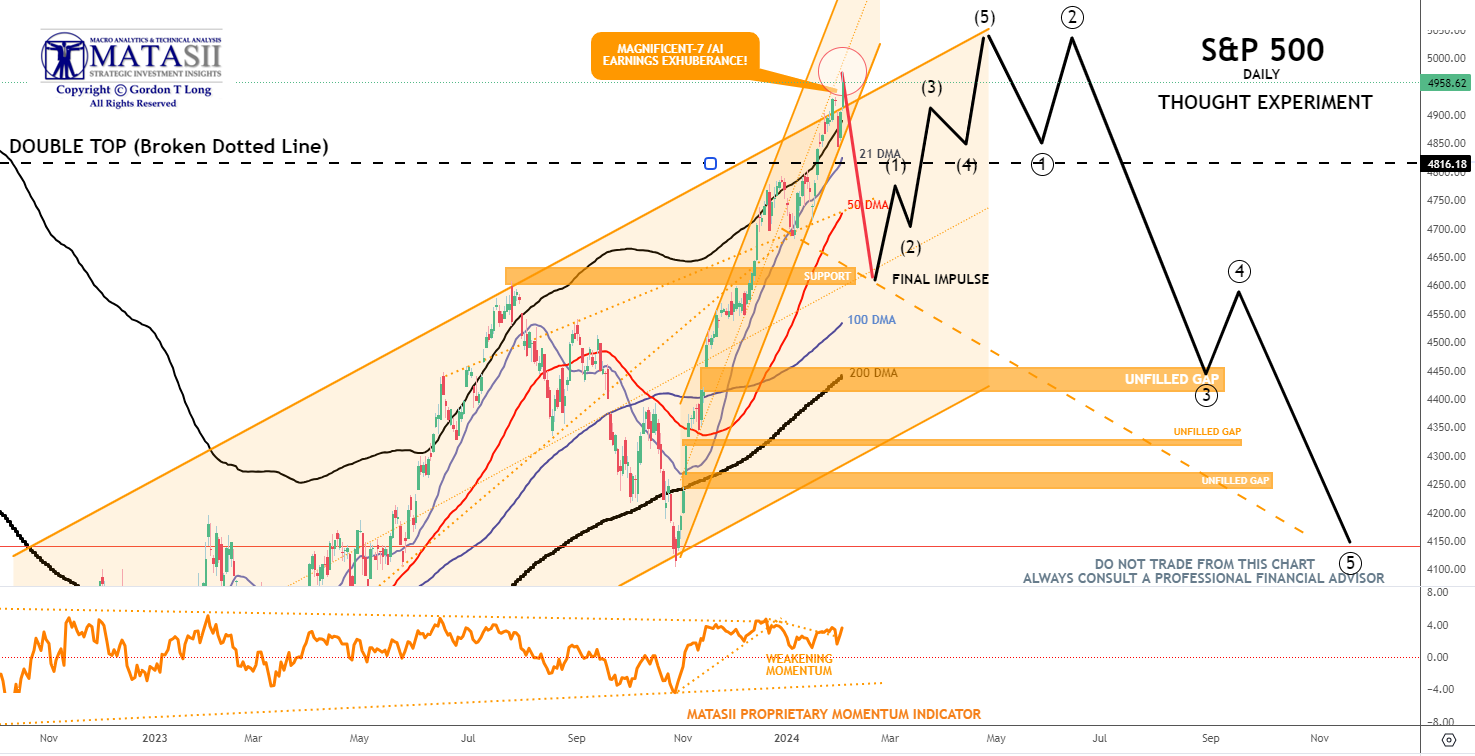
S&P 500 - Daily - Our Though Experiment
Our Though Experiment which we have discussed previously suggests we have or are near completing the (B) wave of an Expanded Flat corrective structure and are now in an Impulse (C) wave lower.
| |
YOUR DESKTOP / TABLET / PHONE ANNOTATED CHART
Macro Analytics Chart Above: SUBSCRIBER LINK
| |
NOTICE Information on these pages contains forward-looking statements that involve risks and uncertainties. Markets and instruments profiled on this page are for informational purposes only and should not in any way come across as a recommendation to buy or sell in these assets. You should do your own thorough research before making any investment decisions. MATASII.com does not in any way guarantee that this information is free from mistakes, errors, or material misstatements. It also does not guarantee that this information is of a timely nature. Investing in Open Markets involves a great deal of risk, including the loss of all or a portion of your investment, as well as emotional distress. All risks, losses and costs associated with investing, including total loss of principal, are your responsibility.
FAIR USE NOTICE This site contains copyrighted material the use of which has not always been specifically authorized by the copyright owner. We are making such material available in our efforts to advance understanding of environmental, political, human rights, economic, democracy, scientific, and social justice issues, etc. We believe this constitutes a ‘fair use’ of any such copyrighted material as provided for in section 107 of the US Copyright Law. In accordance with Title 17 U.S.C. Section 107, the material on this site is distributed without profit to those who have expressed a prior interest in receiving the included information for research and educational purposes. If you wish to use copyrighted material from this site for purposes of your own that go beyond ‘fair use’, you must obtain permission from the copyright owner.
========
| |
MATASII'S STRATEGIC INVESTMENT INSIGHTS | |
2020 VIDEOS OUTLINING THE COMING RISE IN INFLATION & COMMODITY PRICES | |
IDENTIFICATION OF HIGH PROBABILITY TARGET ZONES | |
Learn the HPTZ Methodology!
Identify areas of High Probability for market movements
Set up your charts with accurate Market Road Maps
Available at Amazon.com
| |
The Most Insightful Macro Analytics On The Web | | | | |