|
LONGWave - JUNE 2023
Technical Analysis
| |
THE BULLWHIP EFFECT COMETH!
The Bullwhip Effect has become well understood by the post Covid-19 Global Supply Chain. It has resulted in a heightened appreciation of the distortions, costs incurred and margin impact from a lack of clear and reliable demand projections. As a result the global supply chain is already reacting to the expected US Thanksgiving / Christmas consumer season which foreign producers are now in the midst of. The reality, which we will lay out in this newsletter, is stark and impacts all levels of the supply process.
The US may technically not be in a Recession yet, but the Global Supply Chain is already reacting as if it is and sees a "hard landing" ahead for the US Consumer!.
Meanwhile Inflation is still a very real problem! Don't be fooled by the latest US CPI and PPI announcments. These touted releases are built on the sole fact from political driven falling gasoline prices, stemming from the accelerated depletion of the Strategic Petroleum Reserves (SPR). We show the proof of exactly how this was done below.
The central banks are not fooled and still have major concerns,which showed in their meeting this week.
Though the Federal Reserve "paused" on rate hikes, its voting members increased the Fed "Dot-Plot" to reflect two more hikes before year end. The ECB's president Christine Lagarde was extremely clear, after raising rates 0.25 bps, that more increases are still to come. The Bank of Canada and other central banks likewise followed the ECB without "pausing" their rate increases.
The global econmic indicators, which we continue to focus on in the weekly newsletter, highlighted the continuing global slowdown. US Jobless Claims have now established a clear upward trend, which is the "tell" we have been warning of.
| |
|
THIS WEEK WE SAW
Exp=Expectations, Rev=Revision, Prev=Previous
RED = Deterioration, Green = Improvement
CONSUMPTION
US RETAIL SALES: Headline retail sales
rose 0.3% MoM (-0.2% exp): Core (ex-Autos and Gas) rose 0.4% MoM (vs +0.2% MoM)
EMPLOYMENT
JOBLESS CLAIMS: The number of Americans filing for unemployment benefits were at 262,000 on the week ending June 10th, sharply above market expectations of 249,000 to match the prior week’s upwardly revised value.The highest since October 2021.
SENTIMENT & CONFIDENCE
U of MICHIGAN SENTIMENT 1-year inflation expectations IMPROVED from 4.2% to 3.3% (exp 4.1%).
| |
|
WHAT YOU NEED TO KNOW
ANOTHER TROUGH / EBB BEFORE A BIG HYPERINFLATIONARY LIFT! - Inflation & Deflation Comes in Waves!
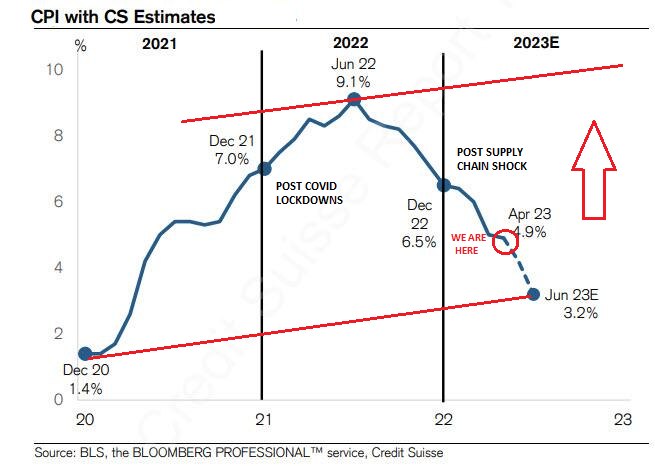
According to calculations by Credit Suisse chief strategist Jonathan Golub, it is next month's CPI Inflation number that will be the shocker. According to Golub, the June number (which will be released on July 12) will print at 3.2%.
Should this play out as expected, Golub writes, "this would represent one of the greatest drops experienced in a 2-month period over the past 70 years. Historically, similar declines have only occurred during periods of economic upheaval, such as the onset of COVID, the Great Recession, and in 1975 during the Great Inflation."
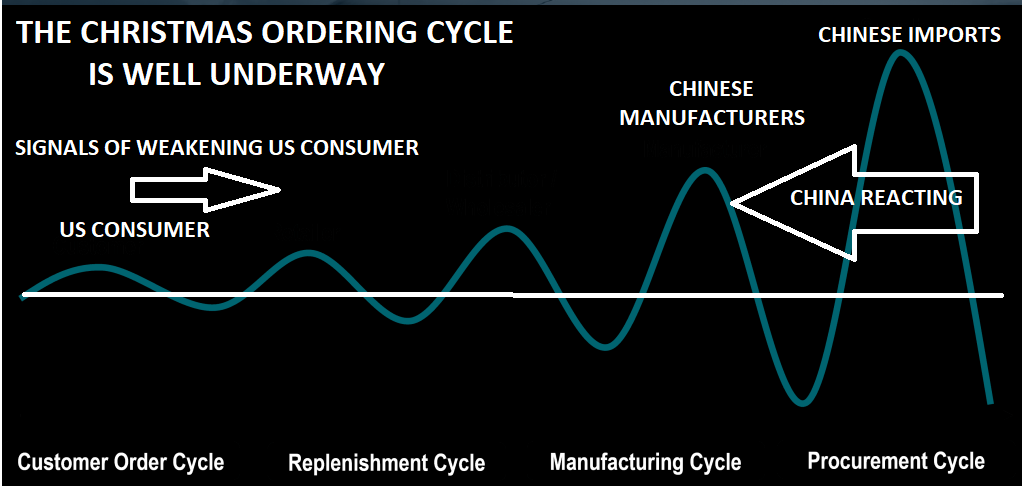
THE BULLWHIP EFFECT - US Consumer Strength, Inventories, Christmas Orders, Chinese Imports & US Import Shipments
- The Global Supply Chain learned a major lesson in the aftermath of Covid-19. They are well aware of the Bullwhip problem and can ill aford to be caught on the wrong side of it, with credit tightening and overall global demand & economic conditions clearly weakening.
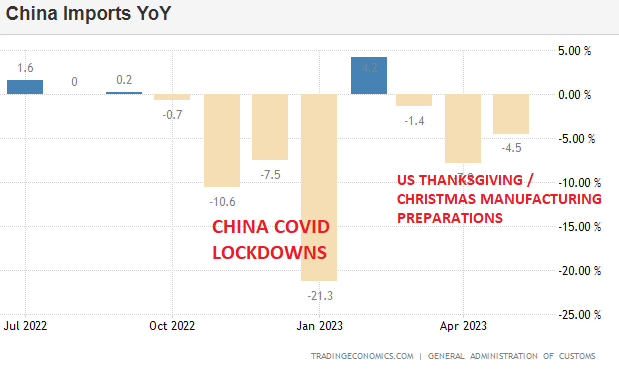
- As China witnesses global demand along with the state of the US Consumer (Christmas build season), inbound Imports to China declined by 4.5% Y-o-Y to USD 217.69 billion in May 2023, compared with market expectations of an 8% drop and following a 7.9% decrease a month earlier.
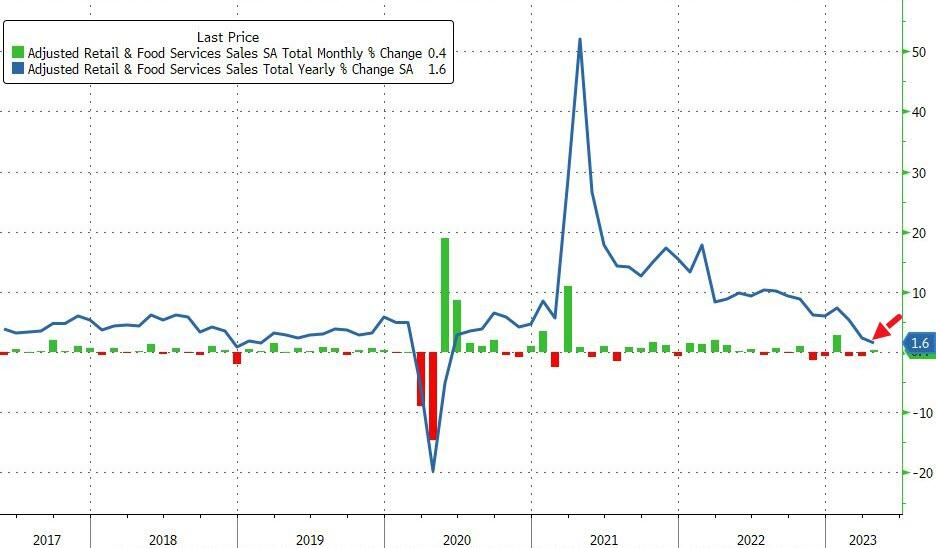
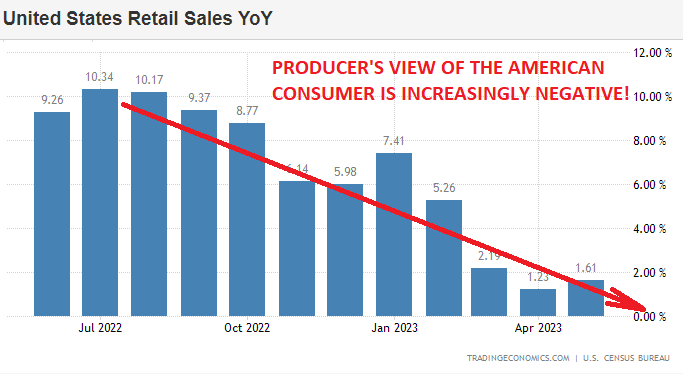
- This week's release of US Retail Sales showed nominal retail sales rose just 1.6% YoY (well below inflation) - the slowest since May 2020 - suggesting the consumer is feeling the pinch in a big way.
- Global container shipping experts FreightWaves have issued one of their strongest worded warnngs for the Christmas season in years (must read report)!
CPI / PPI FOLLOWING THE BULLWHIP - Inflation is Down Primarily on Gas Prices Due to SPR Releases
- The Biden Administration has clearly used the SPR in an attempt to lessen consumer anxiey and keep market elevated to give the Fed more time to maintain elevated rates.
- Elevated Inflation for longer helps Borrowers and penalizes Lenders. The US Government is the largest borrower in the world! Biden is couning on Financial Repression, which is the primary tool used to counter massive growth in Debt presently underway in the US.
CENTRAL BANK ANNOUNCEMENTS - Inflation Is Not Yet Anywhere Near Under Control
-
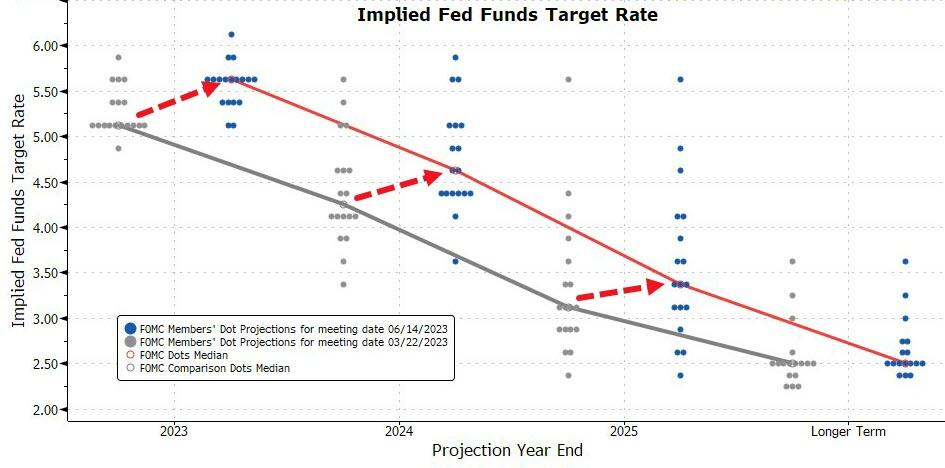
FOMC MEETING - Fed left rates unchanged at 5.00-5.25%, as expected, through a unanimous vote and raised the 2023 Fed Funds Rate dot plot forecast to 5.6% from 5.1% in March.
-
ECB COUNCIL MEETING - Raised interest rates on the main refinancing operations to 4% from 3.75%, matching the consensus estimate. On the deposit facility and marginal lending facility the ECB raised rates to 3.5% and 4.25% respectively. The ECB signalled more rate increases to come.
-
BOJ POLICY SETTING - BoJ kept its policy settings unchanged, as expected, with rates at -0.10% and the parameters of QQE with YCC maintained, in which the decision on YCC was made through a unanimous vote.
US & GLOBAL ECONOMIC REPORTING - We Continue Our "Deep Dive" of Key Economic Reports
- We now have an established upward trend in our currently all important US Initial Jobless Claims (our Recession trigger).
- The number of Americans filing for unemployment benefits were at 262,000 on the week ending June 10th, sharply above market expectations of 249,000 to match the prior week’s upwardly revised value - he highest since October 2021.
| |
|
CONCLUSION
Three subjects to pay attention to that would have meanful economic impact:
A MAJOR POTENTIAL CHINA STIMULUS??
- According to the WSJ, Beijing is planning major steps to revive the country’s flagging economy, including the possibility of billions of dollars in new infrastructure spending and looser rules to encourage property investors to buy more homes.
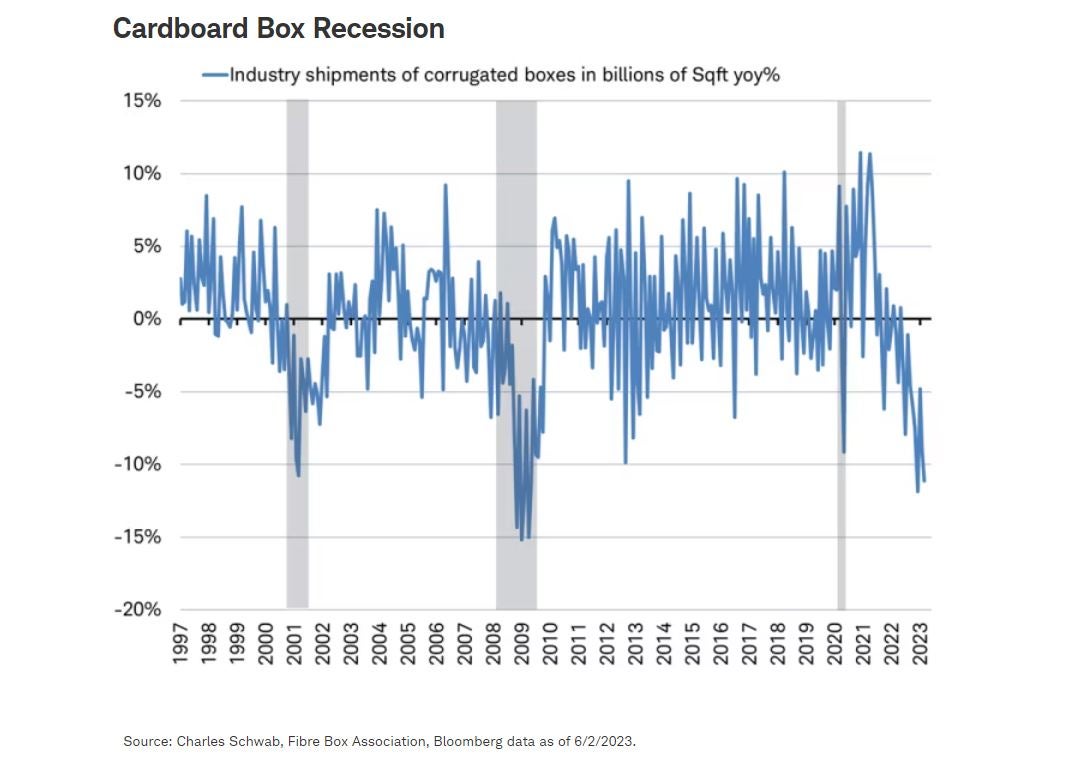
A CARDBOARD BOX RECESSION
-
In a recent article from Charles Schwab’s chief global investment strategist, Jeffrey Kleintop, he proclaimed that the United States is currently experiencing a "cardboard box recession". This refers to a situation in which manufacturing and trade experience a global recession while services industries continue to grow.
A STUDENT LOAN PAYMENT RESTART
- The end of the student loan deferment program, which allowed consumers to save an average of over $15,000 since March 2020, will have a significant impact on consumer spending. With 64% of the $1.7 trillion student loan debt remaining in forbearance, the resumption of payments will create a cash flow shock for many households, particularly among the 25 million Americans ages 18-44 who have deferred their payments. This demographic plays a crucial role in driving consumer spending, and the sudden increase of approximately $393 per month in loan payments will likely lead to reduced discretionary income and a potential decrease in spending capacity.
=========
In this week's expanded "Current Market Perspectives", we focus on the dominance of Cross Market Reversal Signals.
=========
| |
|
THE BULLWHIP EFFECT - US Consumer Strength, Inventories, Christmas Orders, Chinese Imports & US Import Shipments
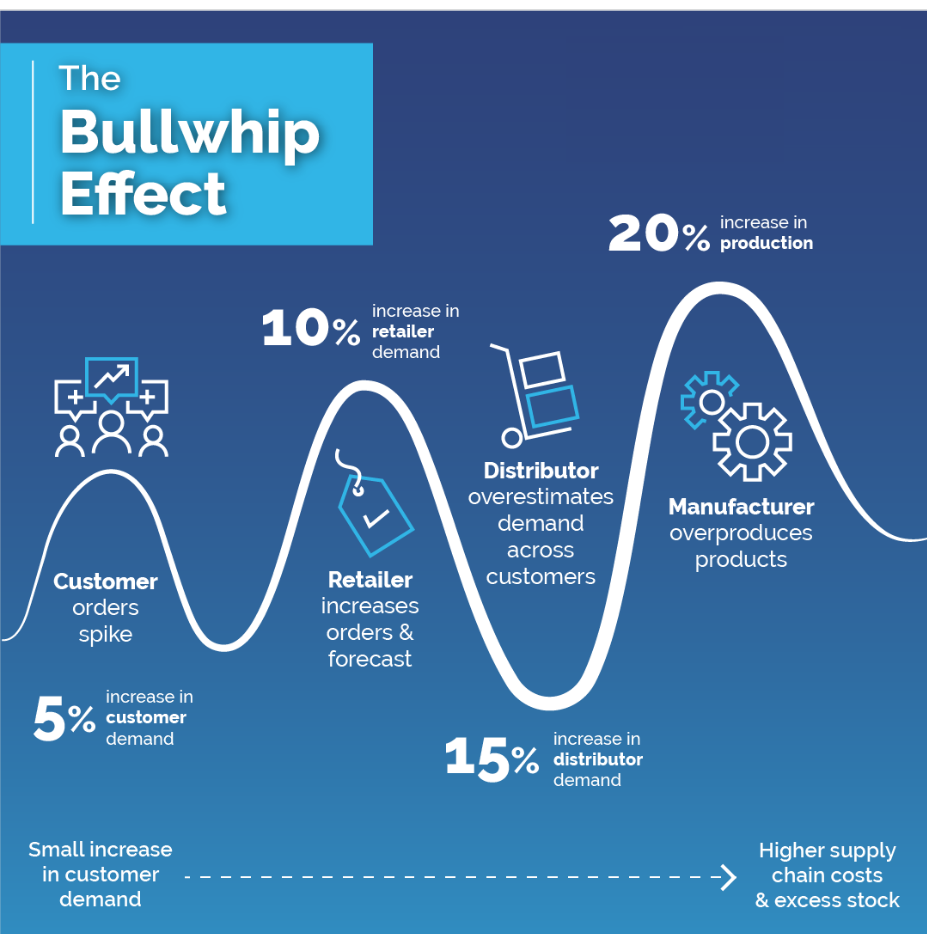
A common risk in a supply chain is referred to as the “Bullwhip Effect“, where demand can back-propagate and create an undue level of procurement; and amplification. For instance, a customer may order 10 units of a product from a retailer. The retailer may order 12 units from a distributor to ensure additional inventory (and anticipate higher future demand). In turn, a distributor may order 15 units from a manufacturer, which could order components from suppliers to make 20 units. In this case, a 10-unit order has resulted in the procurement of 20 units. The bullwhip effect can have an important effect during a supply chain disruption, as uncertain conditions may incite much higher orders than the actual long-term demand, which are amplified further upstream in the supply chain.
CHINA HAS EXPERIENCED THE BULLWHIP EFFECT FROM AMERICA BEFORE!
The Global Supply Chain learned a major lesson in the aftermass of Covid-19. They are well aware of the Bullwhip problem and can ill aford to be caught on the wrong side of it, with credit tightening and
overal global demand and economic conditions clearly weakening.
| |
|
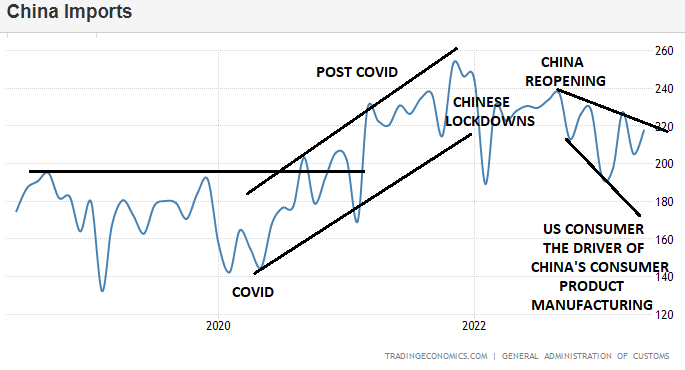
CHINESE IMPORTS
Imports to China declined by 4.5% yoy to USD 217.69 billion in May 2023, compared with market expectations of an 8% drop and following a 7.9% decrease a month earlier. Purchases of copper were down 4.6% yoy and imports of steel fell 22%. Conversely, purchases of crude oil surged 12.2% to 12.11 million bpd, the third highest monthly level on record. Increases were also seen for iron ore (4%), coal (92.6%), natural gas (17.3%). Purchases of soybeans jumped 24% to hit a record of 12.02 million tones.
| |
|
WHAT CHINA & GLOBAL PRODUCERS SEE?
CONSUMER SPENDING - Has Hit A Wall!
LATEST US RETAIL SALES
This week's release of US Retail Sales showed nominal retail sales rose just 1.6% YoY (well below inflation) - the slowest since May 2020 - suggesting the consumer is feeling the pinch in
a big way. (Chart right)
-
On a M-o-M basis, Retail Sales were up 0.4% against expectations of 0.8%.
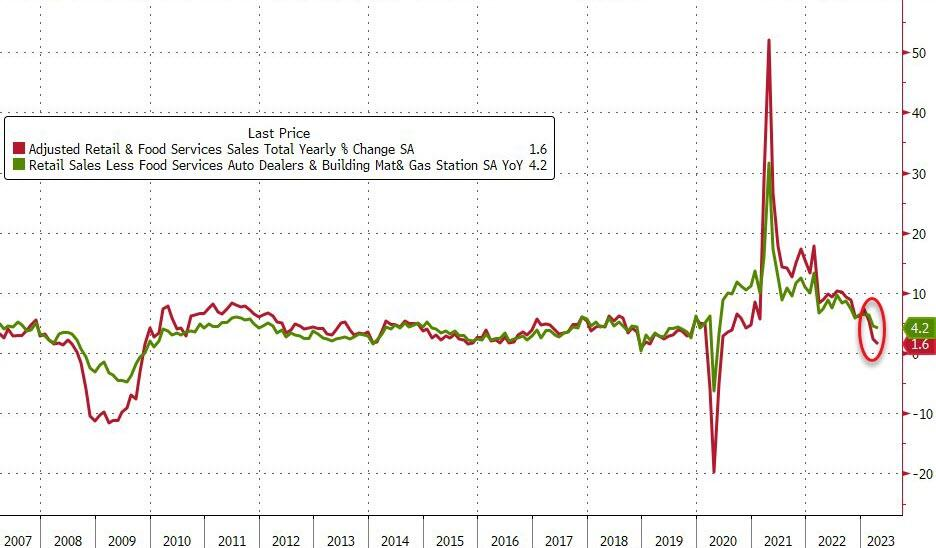
- Once stripping the more volatile components, the pace of retail sales is losing momentum.
Chart Below: All of the YoY measures are at their slowest pace since COVID lockdowns.
US RETAIL APPEARS TO BE ON THE EDGE OF A CLIFF.
Walmart, Target, & Home Depot have all recently expressed noticeable concern.
| |
|
CHART RIGHT: Global Producers have long learned the lessons of the Bullwhip effect, as they are most impacted and preparing for what they clearly see coming. Confidence in the US and a US Consumer that can continue to consume has signifcantly weakened as they witness:
- The chart to the right of the trend of US Retail Sales,
- Deteriorating US Political Striff,
- Retail / Mall store closings and warnings from major retailers while additionally increasing layoffs at Amazon?
| |
|
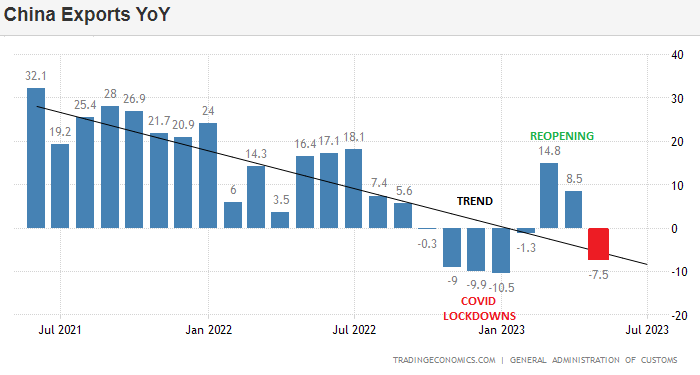
China is reacting with actions regarding orders with their import suppliers in addition to slowing overall demand.
CHART RIGHT:China Export highlights signs that Global Consumption Is slowing!!
| |
|
US INBOUND SHIPMENTS
FreightWaves is a price reporting agency (PRA) focused on the global freight market and the leading provider of high-frequency data for the global supply chain. FreightWaves’ price, demand and capacity data allow customers to benchmark, analyze, monitor and forecast the global physical economy.
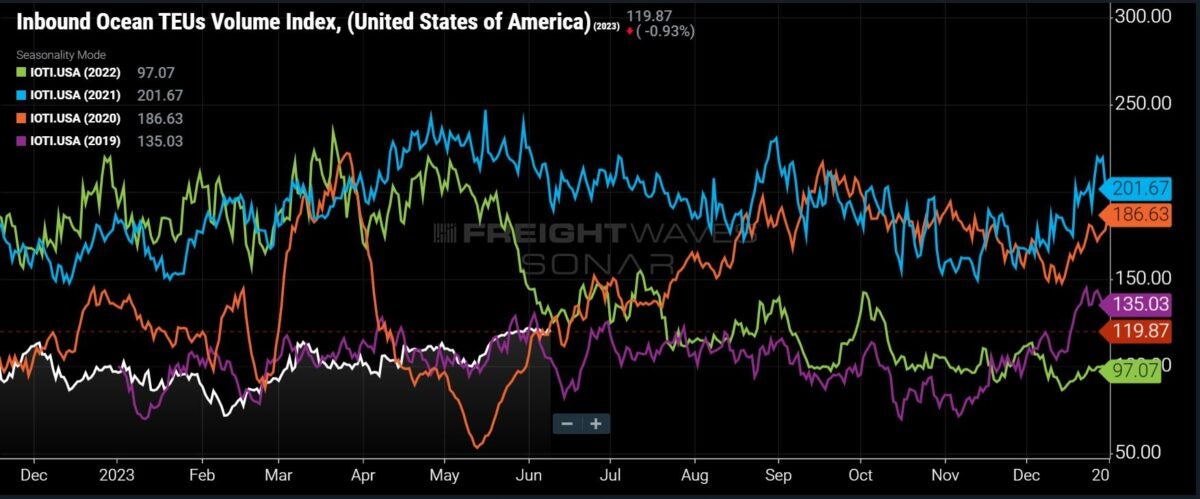
Here is what FeightWave is reporting:
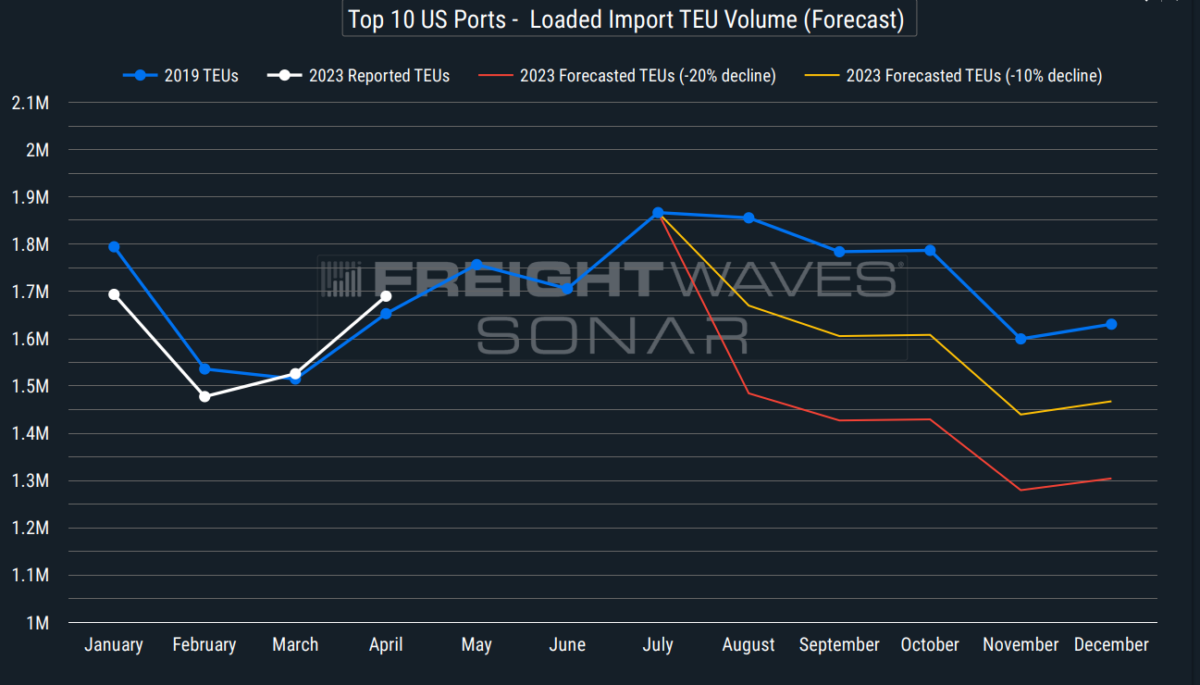
- Containerized imports still trending at 2019 levels, but major downside risks to volumes continue to rise.
- Last week, we forecast a further decline in U.S. containerized import volumes in the second half of 2023, and a “new” bottom for volumes during this downcycle. The lingering effects of the “bullwhip effect” on inventories, along with the considerable downside risks that exist to consumer spending, the upcoming months are likely to witness an unprecedented level of caution among importers during this year’s peak season. This caution, combined with a weakening global macroeconomic backdrop, only heightens the risks of declining import volumes.
-
As we forecast, ocean container bookings in the first half of 2023 (white line - chart above right) have continued trending right alongside 2019 levels (orange line). This is expected to continue through early Q3, at which point we will likely begin to see a detaching from 2019 levels to find a “new” bottom, ultimately resulting in a significant drop of 10% to 20% below levels experienced during the 2nd-half of 2019.
-
Below is a chart of what that decline of 10% (orange) to 20% (red) in monthly loaded import TEUs would look like across the Top 10 U.S. ports. (FULL REPORT)
|  | |
|
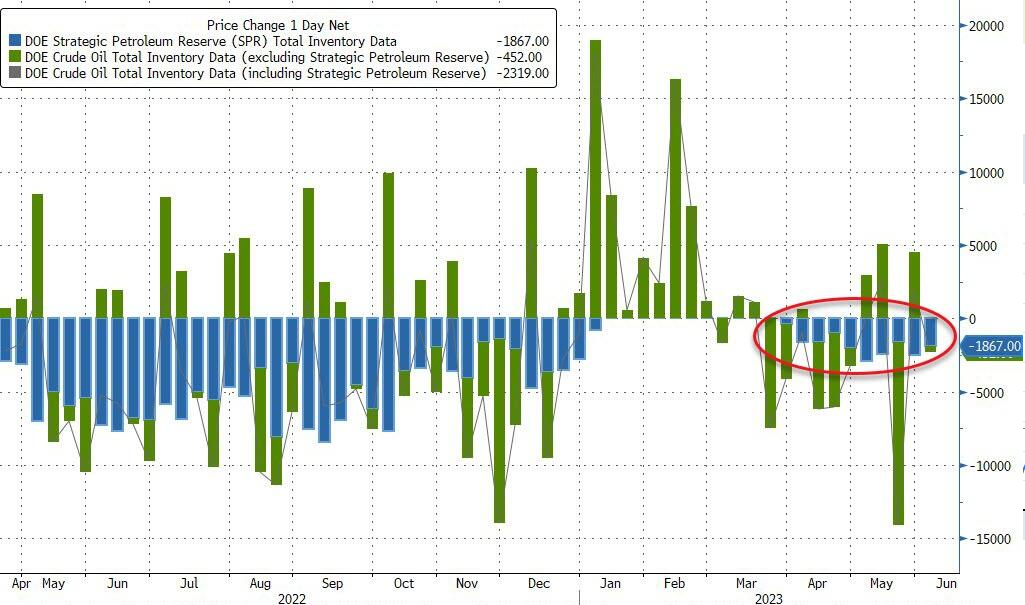
CPI / PPI FOLLOWING THE BULLWHIP -
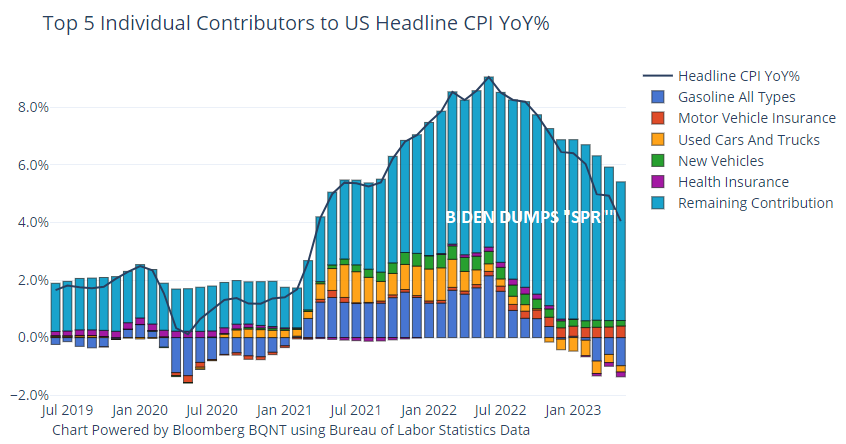
CONSUMER PRICE INDEX (CPI) - Biden Dumps SPR
Don't fall for the "Inflation is behind us" nonsense!
| |
BIDEN REGIME BUSY OVER THE LAST 11 WEEKS
Over the last 11 weeks - while publicly discussing 'buying' oil to refill SPR - the Biden admin has sold over 18 million barrels.
| |
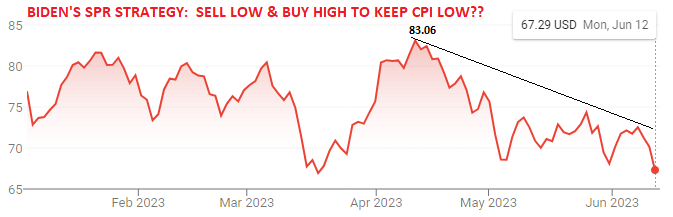
WTIC PRICES OVER THE LAST 11 WEEKS
Biden's SPR Strategy is to SELL LOW, BUY HIGH so as to drive down public Headline CPI number.
This nonsense actually works in today's momentum driven "trade the news" world?
| |
|
CPI:
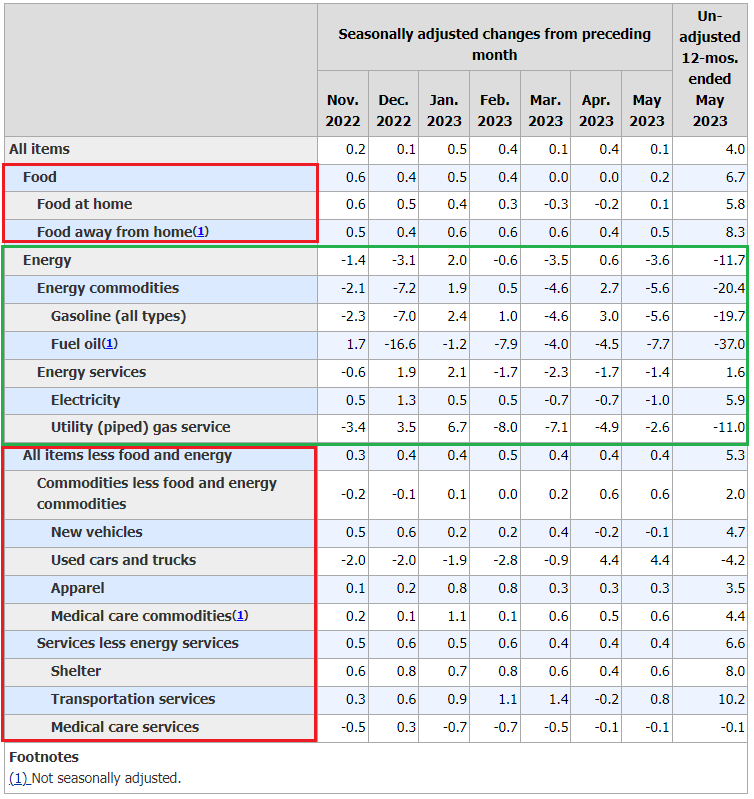
- US CPI in May rose 0.1% M/M (exp. 0.2%; prev. 0.4%) and 4% Y/Y (exp. 4.1%; prev. 4.9%). The core, however, rose at a stronger 0.4% M/M rate (exp. 0.4%; prev. +0.4%), with the core Y/Y falling to 5.3% (exp. 5.3%; prev. 5.5%).
- The softer headline figures continue to be weighed on by a sharp decline in energy prices and just modest food price inflation.
- Meanwhile, core CPI is being driven by increases in rents and used vehicle prices - items which many expect to move lower in the months ahead with third-party survey data pointing to a softening.
-
Pantheon Macroeconomics is in that camp, "Given that rents and used vehicles accounted for four-fifth of the increase in the May core, this signals a good chance of 0.2% core prints very soon." While there seems to be a consensus building on those declines in core for the near term, there remains deep scepticism on whether we can get to the 2% target anytime soon. Economist Jason Furman notes: "The most standard measure of core inflation is running at a 5% rate. That almost certainly overstates current underlying inflation. But by how much? How much will it fall? I expect some but have no confidence it is falling to 3% let alone 2%."
- As far as the Fed is concerned, SGH Macro's Tim Duy says the report doesn't have enough to stop the Fed from holding rates unchanged Wednesday, but, "It’s sufficient... to keep the Fed’s focus on hiking again in July, making this meeting a skip rather than a pause."
-
Indeed, after the data WSJ's Timiraos, whose insider info is linked to the Fed's Board of Governors, said, "Fed is expected to hold rates steady on Wednesday, with the May CPI report doing little to change the very near-term outlook... officials could use their quarterly projections to signal another rate rise is now the base case".
| |
|
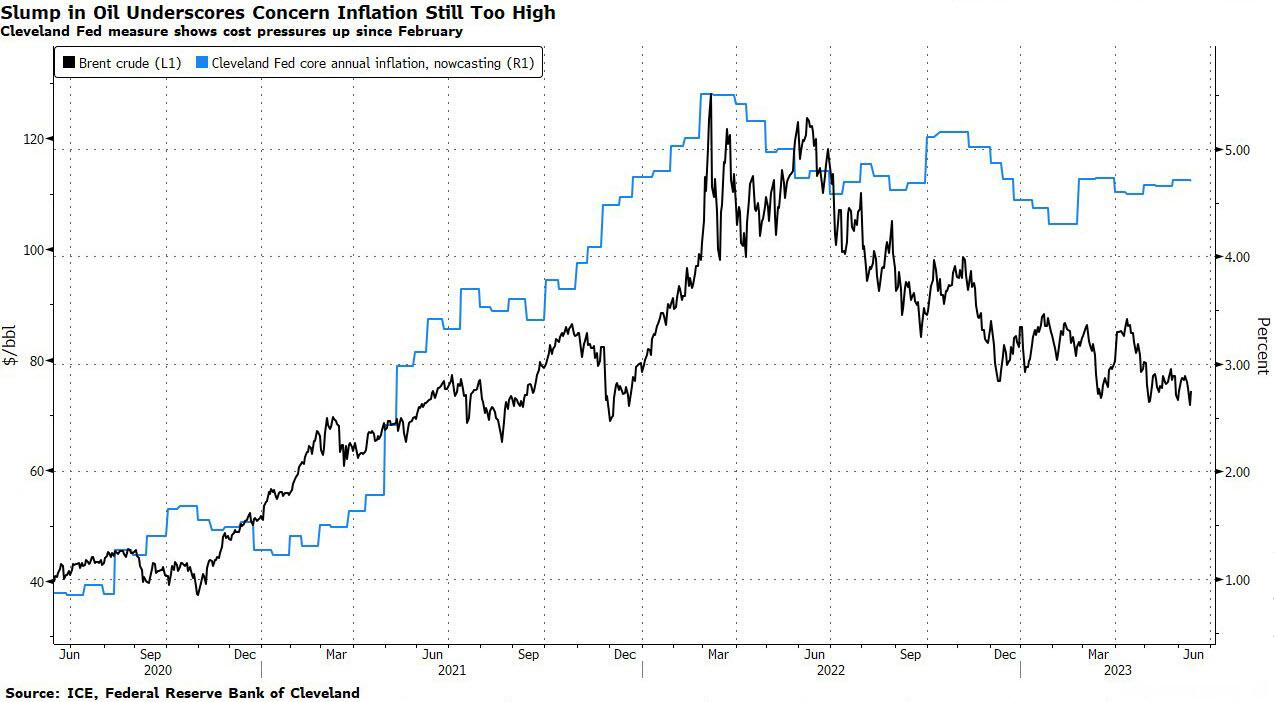
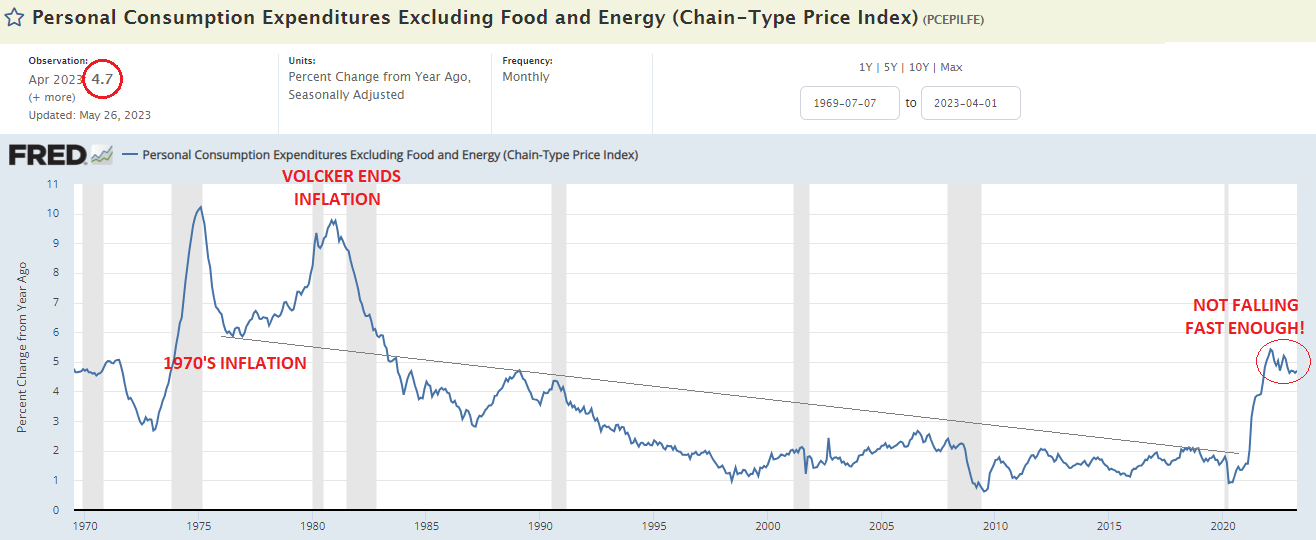
CORE PCE IS THE ISSUE
What the headline narrative fails to tell you is that the Cleveland Fed’s Nowcast for PCE core inflation, (the gauge itself being the indicator that policymakers actually focus on), has actually climbed since February when it hit the lowest since 2021. Meanwhile this has occured even as crude oil declined, despite OPEC+ output cuts!
That makes for a toxic mix for growth. Inflation readings that are strong enough to keep the Fed biased toward further hikes at a time when weakening oil demand underscores the downside risks for the global economy.The concern remains that the rally in risk assets fails to account for the potential that a drop in inflation sufficient to convince the Fed to stop hiking can only come with a sustained slump for the economy.
Even though Tuesday’s CPI release showed a significant drop - as widely expected - it still leaves inflation much higher than the Fed’s goals (at least until the Fed raises its inflation target). Stock investors may ultimately regret getting what they are wishing for!
|  | |
|
US PPI:
- May PPI data was cooler than expected, falling 0.3% M/M from the prior gain of 0.2% and a deeper fall than the expected -0.1% print, sitting on the cooler side of the analyst forecast range (-0.4 to +0.2%).
- The Y/Y cooled to 1.1% from 2.3%, cooler than the 1.5% forecast. The core metrics (ex-food and energy) saw the M/M print in line with expectations and matching the prior month's pace at 0.2%, while the Y/Y rose 2.8%, down from the prior 3.1% (revised lower from 3.2%) and a touch cooler than the expected 2.9%, matching the lowest analyst forecast (2.8-3.1% range).
- The report added to the argument that inflation is continuing to cool after the CPI report on Tuesday. Similar to CPI, the headline fall was led by a fall in energy prices, with final demand energy falling 6.8% while final demand for foods fell 1.3%.
- Analysts at Pantheon Macroeconomics note all the increase in the core was led by the trade services component, which measures gross margins for retailers and wholesalers.
- The 1.0% increase was the largest since last August, driven by an 11.3% gain in gas station margins and a 5% jump in the auto dealer component.
- The consultancy notes gas station margins are hyper-volatile and the jump in auto dealer margins will not last, with underlying pressure to the downside, as supply increases and tighter credit conditions deter buyers.
- The super core metrics (ex-food, energy and trade services) were flat in May, after rising 0.1% M/M in April (revised down from 0.2%) and +2.8% Y/Y, cooler than the prior revised down 3.3%.
- Looking ahead, Pantheon Macroeconomics suggests Core PPI will fall below zero in September, noting the recent downward trend is not just a story of falling food and energy prices.
-
The consultancy concludes, "Margin re-compression over the next year will exert intense downward pressure on core PCE inflation and the GDP deflator, as well as the PPI."
| |
|
FOMC MEETING & ANNNOUNCEMENT
WHAT YOU NEED TO KNOW
HIGHER FOR LONGER
To ensure the doves are clear:
“It will be appropriate to cut rates at such time as inflation is coming down really significantly. And we’re talking about a couple of years out.“
"I think, as anyone can see, not a single person on the committee wrote down a rate cut this year -- nor do I think it is at all likely to be appropriate if you think about it."
"Inflation has not really moved down. It has not reacted much to our existing rate hikes. We’re going to have to keep at it.”
|
 |  |
- Fed left rates unchanged at 5.00-5.25%, as expected, through a unanimous vote and raised the 2023 Fed Funds Rate dot plot forecast to 5.6% from 5.1% in March, while stating that holding the target range steady allows time to assess additional information and implications for policy. Fed said inflation remains elevated and that it is highly attentive to inflation risks with the Committee strongly committed to returning inflation to its 2% objective.
- Federal Funds Rate forecast for 2023 is at 5.6% (exp. 5.1%, prev. 5.1% in March), 2024 at 4.6% (exp. 4.4%, prev. 4.3%), 2025 at 3.4% (exp. 3.1%, prev. 3.1%), longer run at 2.5% (exp. 2.5%, prev. 2.5%).
- Fed Chair Powell said nearly all FOMC policymakers view some further rate hikes this year as appropriate and most policymakers expect subdued growth to continue. Powell also stated that inflation remains well above the 2% goal and has moderated somewhat, but added that inflation pressures continue to run high and getting inflation back to 2% has a long way to go. Furthermore, Powell said Fed projections are not a plan or decision and they will continue to make decisions meeting by meeting.
- Fed Chair Powell said during the Q&A that the main issue is determining the extent of additional tightening and it makes sense for rates to move higher but at a more moderate pace, while they did not discuss whether to go to an every-other meeting approach and he thinks July will be a live meeting. Powell called the decision a "skip" but then corrected himself stating "should not call it a skip" and stated that by taking a little more time on tightening, they reduce the chance of going too far. While he said it will be appropriate to cut rates when inflation comes down, he added that rate cuts are not appropriate this year and that no policymakers saw a rate cut for this year.
| |
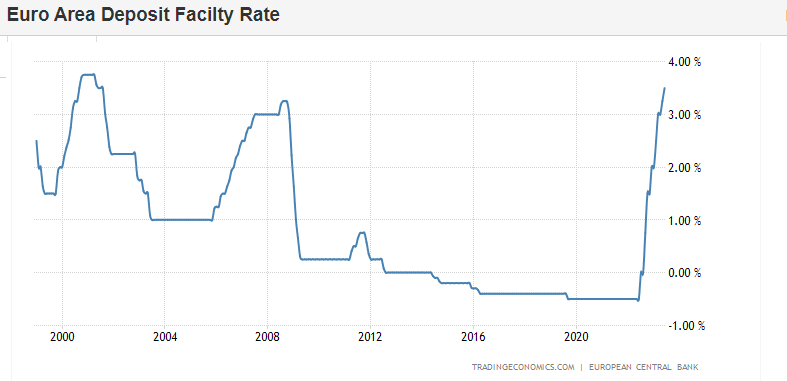
ECB MEETING & ANNOUNCEMENT
WHAT YOU NEED TO KNOW
ANNOUNCEMENT
Raised interest rates:
- On the main refinancing operations to 4% from 3.75%, matching the consensus estimate
- On the deposit facility and marginal lending facility rates to 3.5% and 4.25%, respectively
This was the 8th hike in a row, and the highest since 2001 (see chart right).
EU INFLATION
Annual inflation in the euro area eased to 6.1% from 7% in April, while core inflation fell to 5.3% from 5.6%.
ECB INFLATION PROJECTIONS
- Headline inflation to average 5.4% in 2023 (prev. 5.2%), 3.0% in 2024 (prev. 2.9%) and 2.2% in 2025 (prev. 2.1%)
- Core inflation seen at 5.1% in 2023 (prev. 4.6%), 3.0% in 2024 (prev. 2.5%) and 2.3% in 2025 (prev. 2.2%)
STATED INFLATION TARGET
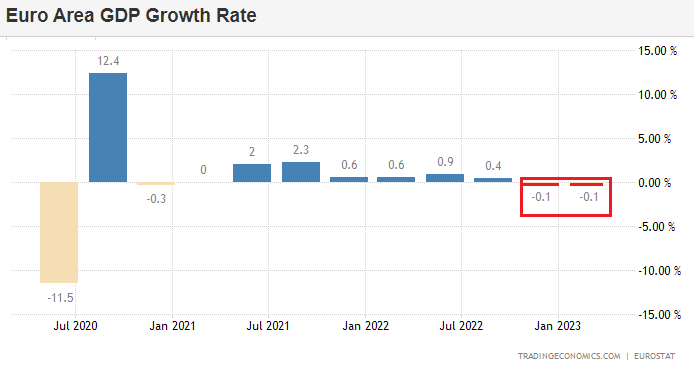
EU IN RECESSION
The EU is in a Recession having seen negative growth in Q4 2022 and Q1 2023.
- The ECB announced that it currently expects the economy to grow 0.9% in 2023 (prev. 1.0%), 1.5% in 2024 (prev. 1.6%) and 1.6% in 2025 (prev. 1.6%).
| |
|
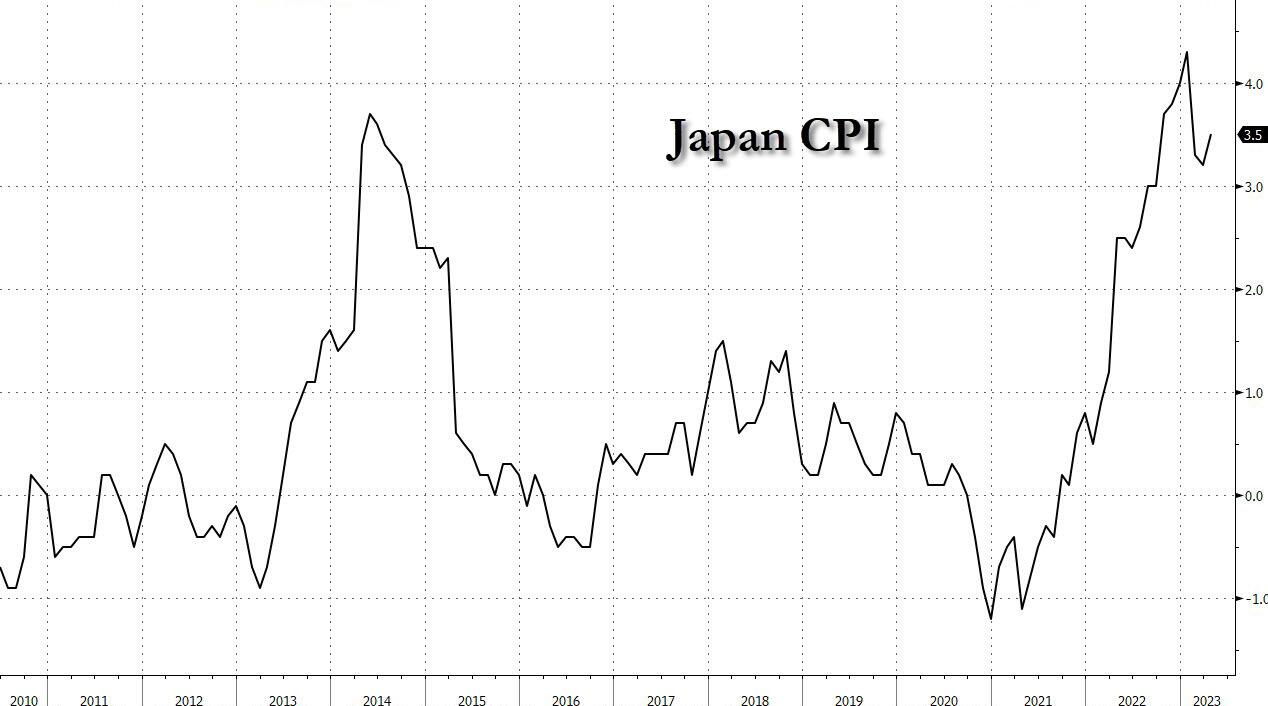
BOJ POLICY SETTING
BoJ kept its policy settings unchanged, as expected, with rates at -0.10% and the parameters of QQE with YCC maintained, in which the decision on YCC was made through a unanimous vote. BoJ said Japan's economy is picking up and is likely to continue recovering moderately, but also noted that uncertainty regarding the economy is very high. Furthermore, it reiterated that core consumer inflation is likely to slow the pace of increase towards the middle of the current fiscal year and that inflation expectations are moving sideways after heightening.
The Bank of Japan continues to see things differently. It decided to maintain its current policy settings, which still include negative interest rates and yield curve control. This decision comes as policymakers anticipate a slowdown in inflation in the coming months. With new quarterly forecasts set to be released in July, it remains uncertain as to whether these will lead to any significant policy changes. In any case, today’s statement provided very few indications of a more aggressive stance – and thus saw dollar-yen reach its highest level since November last year. The Bank of Japan remains cautious about the potential negative impact of prematurely tightening policy, which could undermine Japan's longstanding efforts
to lift inflation to a structurally higher level.
CONCLUSIONS FROM THE THREEE CENTRAL BANKS - US $$ PRESSURES
This concluded a big week in central banking with the Fed delivering its hawkish skip and the ECB its hawkish hike, the Bank of Japan being as dovish as it can reasonably be, and the PBoC fueling optimism on China with some 10bp rate cuts. So with the Fed being outflanked by the ECB, and previously by the RBA and the BoC too, and with talks of China boosting growth with a USD 140bn stimulus package too, the US dollar was dealt some heavy blows. EUR/USD rose from 1.075 early this week to 1.095 at the time of writing, largely undoing the recovery that started mid-May.
| |
|
GLOBAL ECONOMIC REPORTING: What This Week's Key Global Economic Reports Tell Us
WE CONTINUE TO CLOSELY MONITOR GLOBAL ECONOMIC REPORTS FOR RECESSION TRIGGERS
IT JUST KEEPS GETTING WORSE!
Again this week we did another deep dive into the Economic Indicators being released with a particular expansion to include a broad mix of global countries.
SUMMARY HIGHLIGHTS
-
The EU is in Recession and has been since Q1. This was announced with quietly revised data.
-
China's Exports went negative on a Y-o-Y basis. This is particularly bad, remembering that a year ago China was in full Covid lockdowns!
-
The US Jobless Claims numbers surged this week, (as we forecasted in this month's video - charts below).
- Markets are not buying the hawkish dot plots from the Fed.
- The ECB leant hawkish hiking by 25bps as expected, while raising its headline and core inflation forecasts, alongside Lagarde signalling a July hike as likely.
- US jobless claims remained elevated, above expectations.
- Import/export prices added to the cooling inflation narrative.
- Treasuries rallied on the jobless claims report in signs the jobs market is cracking in the high-frequency data, although Bunds were lower on the session following the ECB. That saw the Euro rally vs the buck, while DXY tumbled.
- The weaker dollar likely gave support to the huge equity rally, alongside more reports that China is looking to boost its flagging economy after weak activity data overnight.
| |
|
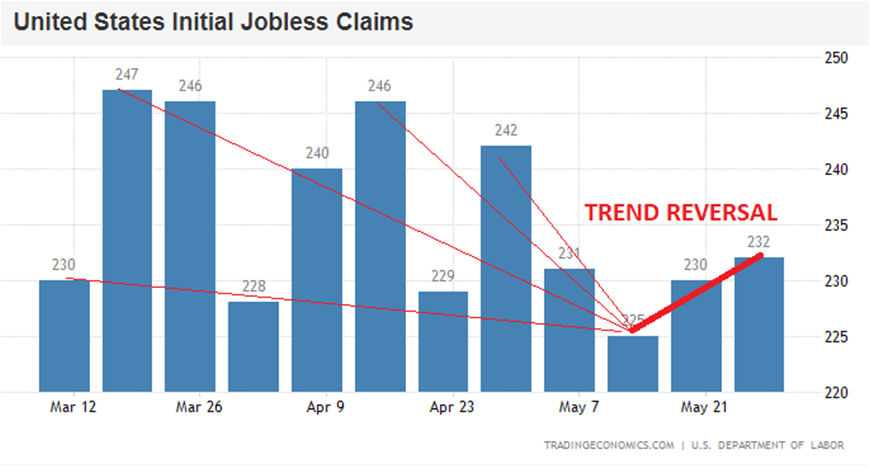
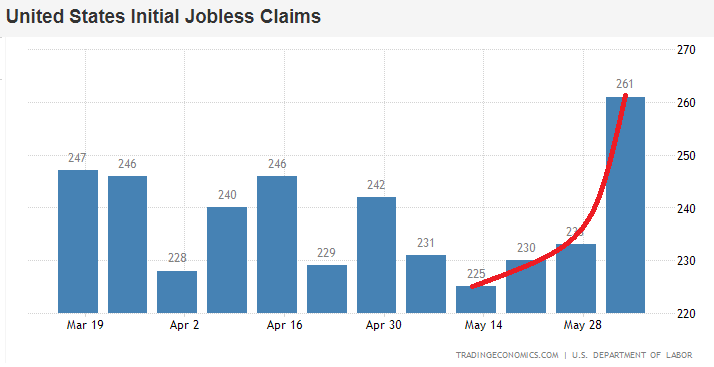
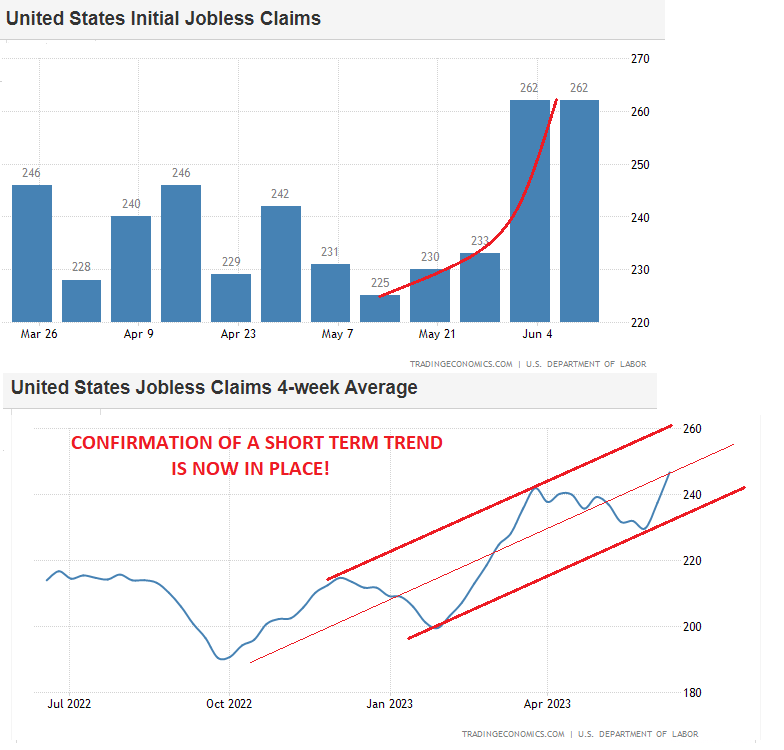
INITIAL JOBLESS CLAIMS - We Now have a Short term Trend Confirmation
The number of Americans filing for unemployment benefits were at 262,000 on the week ending June 10th, sharply above market expectations of 249,000 to match the prior week’s upwardly revised value.
- The highest since October 2021.
- Jobless Claims 4-week Average in the United States increased to 246.75 Thousand in June 10 from 237.50 Thousand in the previous week.
- The result aligned with other recent data that reflects some softening in the US labor market after a prolonged period of stubborn tightness, as US businesses start to feel the impact of the Federal Reserve’s aggressive tightening campaign.
- The four-week moving average, which removes week-to-week volatility, rose by 9,250 to 246,750.
- On a seasonally unadjusted basis, claims jumped by 28,763 to 249,212, with notable increases seen in Texas (+7,123) and Minnesota (+3,664).
- In the meantime, continuous claims rose by 20,000 from the prior week to 1,775,000, above market expectations of 1,665,000, to reflect an increased difficulty for job seekers to find employment.
CHART BELOW: This week's Jobless Report - Thursday 06-15-23
| |  |
This month's video release (LINK) chart warned the establishement of a new trend which in 2000 triggered the "popping" of the tech bubble. | Last week's Jobless Report - Thursday 06-08-23 | | |
|
WHAT DOES YOUR SCAN OF THE DATA BELOW TELL YOU? - THE MEDIA AVOIDS BAD NEWS!
We present the data in a way you can quickly see what is happening. Anything in Red is further deterioration.
In Green is an imporvement over the last release.
THIS WEEK WE SAW
Exp=Expectations, Rev=Revision, Prev=Previous
WHERE HIGHLIGHTED: RED = Deterioration, Green = Improvement
| |
|
UNITED STATES
US RETAIL SALES
Headline retail sales
rose 0.3% MoM (-0.2% exp)
Core (ex-Autos and Gas)
rose 0.4% MoM (vs +0.2% MoM)
US CPI MM SA
(May) 0.1% vs Exp. 0.2% (Prev. 0.4%)
US CPI YY NSA
(May) 4.0% vs Exp. 4.1% (Prev. 4.9%)
US Core CPI MM SA
(May) 0.4% vs Exp. 0.4% (Prev. 0.4%)
US Core CPI YY NSA
(May) 5.3% vs Exp. 5.3% (Prev. 5.5%)
US Cleveland Fed CPI
(May) 0.4% (Prev. 0.4%)
US PPI Final Demand MM
(May) -0.3% vs Exp. -0.1 (Prev. 0.2%)
US PPI Final Demand YY
(May) 1.1% vs Exp. 1.5% (Prev. 2.3%)
US PPI exFood/Energy MM
(May) 0.2% vs Exp. 0.2% (Prev. 0.2%)
US PPI exFood/Energy YY
(May) 2.8% vs Exp. 2.9% (Prev. 3.2%)
US NY Fed Manufacturing
(Jun) Jun 6.6 (Prev. -31.8)
US NY Fed Manufacturing
(Jun) 6.6 vs Exp. -15.1 (Prev. -31.8)
US Philly Fed Business Index
(Jun) -13.7 vs Exp. -14.0 (Prev. -10.4)
US Retail Sales MM
(May) 0.3% vs Exp. -0.1% (Prev. 0.4%, Rev. 0.4%)
US Export Prices MM
(May) -1.9% vs Exp. 0.0% (Prev. 0.2%, Rev. -0.1%)
US Import Prices MM
(May) -0.6% vs Exp. -0.5% (Prev. 0.4%, Rev. 0.3%)
US Initial Jobless Claims
262k vs Exp. 249k (Prev. 261.0k, Rev. 262k)
US Continued Jobless Claims
1.775M vs Exp. 1.765M (Prev. 1.757M, Rev. 1.755M)
CHINA
Chinese New Yuan Loans (CNY)
(May) 1360.0B vs Exp. 1600.0B (Prev. 718.8B)
Chinese Aggregate Financing (CNY)
(May) 1560.0B vs Exp. 2000.0B (Prev. 1220.0B)
Chinese M2 Money Supply YY
(May) 11.6% vs Exp. 12.1% (Prev. 12.4%)
Chinese Industrial Production YY (May) 3.5% vs Exp. 3.6% (Prev. 5.6%)
Chinese Retail Sales YY
(May) 12.7% vs Exp. 13.6% (Prev. 18.4%)
Chinese Urban Investment YTD YY
(May) 4.0% vs Exp. 4.4% (Prev. 4.7%)
Chinese House Prices YY
(May) 0.1% (Prev. -0.2%)
| | |
|
EUROPE
EU ZEW Survey Expectations
(Jun) -10 (Prev. -9.4)
EU Industrial Production MM
(Apr) 1.0% (Prev. -4.1%, Rev. -3.8%)
EU Industrial Production YY
(Apr) 0.2% (Prev. -1.4%)
GERMANY
German ZEW Economic Sentiment
(Jun) -8.5 (Prev. -10.7)
German ZEW Current Conditions
(Jun) -56.5 (Prev. -34.8)
UK
UK Employment Change
(Apr) 250k vs. Exp. 162k (Prev. 182k)
UK ILO Unemployment Rate
(Apr) 3.8% vs Exp. 4.0% (Prev. 3.9%)
UK Average Earnings (Ex-Bonus)
(Apr) 7.2% vs Exp. 6.9% (Prev. 6.7%, Rev. 6.8%)
UK GDP Estimate MM
(Apr) 0.2% vs. Exp. 0.2% (Prev. -0.3%)
UK GDP Estimate YY
(Apr) 0.5% vs. Exp. 0.5% (Prev. 0.3%)
UK GDP Est 3M/3M
(Apr) 0.1% vs. Exp. 0.1% (Prev. 0.1%)
UK Industrial Output MM
(Apr) -0.3% vs Exp. -0.1% (Prev. 0.7%)
UK Industrial Output YY
(Apr) -1.9% vs Exp. -1.7% (Prev. -2.0%)
UK Manufacturing Output MM
(Apr) -0.3% vs Exp. -0.2% (Prev. 0.7%)
UK Manufacturing Output YY
(Apr) -0.9% vs Exp. -0.9% (Prev. -1.3%)
SINGAPORE
Singapore Non-Oil Exports MM
(May) -14.6% vs. Exp. -1.3% (Prev. 2.7%)
Singapore Non-Oil Exports YY
(May) -14.7% vs. Exp. -8.1% (Prev. -9.8%)
AUSTRALIA & NEW ZEALAND
Australian Employment
(May) 75.9k vs Exp. 15.0k (Prev. -4.3k)
Australian Unemployment Rate
(May) 3.6% vs Exp. 3.7% (Prev. 3.7%)
Australian Participation Rate
(May) 66.9% vs Exp. 66.7% (Prev. 66.7%)
New Zealand GDP QQ
(Q1) -0.1% vs. Exp. -0.1% (Prev. -0.6%, Rev. -0.7%)
New Zealand GDP YY
(Q1) 2.2% vs. Exp. 2.6% (Prev. 2.2%, Rev. 2.3%)
JAPAN
Japanese Machinery Orders MM
(Apr) 5.5% vs Exp. 3.0% (Prev. -3.9%)
Japanese Machinery Orders YY
(Apr) -5.9% vs Exp. -8.0% (Prev. -3.5%)
Japanese Trade Balance (JPY)
(May) -1372.5B vs Exp. -1331.9B (Prev. -432.4B, Rev. -432.3B)
Japanese Exports YY
(May) 0.6% vs Exp. -0.8% (Prev. 2.6%)
Japanese Imports YY
(May) -9.9% vs Exp. -10.3% (Prev. -2.3%)
| |
|
CONCLUSION
A MAJOR POTENTIAL CHINA STIMULUS??
The WSJ is reporting:
"Beijing is planning major steps to revive the country’s flagging economy, including the possibility of billions of dollars in new infrastructure spending, and looser rules to encourage property investors to buy more homes, people familiar with the discussions say.
The push follows a series of interest rate cuts by China’s central bank this week, including one on Thursday that cut a key policy rate for the first time since August, as fresh data showed the country’s economic recovery is flickering out. The moves are a sign that Beijing officials are increasingly uneasy about the economy’s prospects now that a wave of excitement following the country’s abandonment of its draconian Covid-19 controls has receded.
More Detail:
| |
|
A CARDBOARD BOX RECESSION
"It is also important to note another major input in the manufacturing process: cardboard box demand. FreightWaves was among the first to cover the concerning signs surrounding cardboard box demand in the article, “Cardboard box demand plunging at rates unseen since the Great Recession.” Demand has remained soft ever since, and in a recent article from Charles Schwab’s chief global investment strategist, Jeffrey Kleintop, he proclaimed that the United States is currently experiencing a “cardboard box recession.” This refers to a situation in which manufacturing and trade experience a global recession while services industries continue to grow. Demand for manufacturing and trade-related goods has declined, as indicated by the decrease in demand for corrugated linerboard."
THE STUDENT LOAN PAYMENT RESTART
".... there are still a number of downside risks facing consumer spending in the 2nd-half, but one of the largest risks is student loan repayments. FreightWaves CEO Craig Fuller covered this risk at length in his recent article “An unusually terrible freight market may get a lot worse.” The article points out factors that could worsen the freight market, including the potential end of various stimulus programs that have boosted personal income and freight demand, but specifically, it highlights the potential fallout caused by the impending resumption of student loan payments.
The end of the student loan deferment program, which allowed consumers to save an average of over $15,000 since March 2020, will have a significant impact on consumer spending. With 64% of the $1.7 trillion student loan debt remaining in forbearance, the resumption of payments will create a cash flow shock for many households, particularly among the 25 million Americans ages 18-44 who have deferred their payments. This demographic plays a crucial role in driving consumer spending, and the sudden increase of approximately $393 per month in loan payments will likely lead to reduced discretionary income and a potential decrease in spending capacity."
| |
CURRENT MARKET PERSPECTIVE | |
|
ARE WE THERE YET??
REMEMBER, THE LAST 5% IS ALWAYS THE MOST EXPENSIVE!
| |
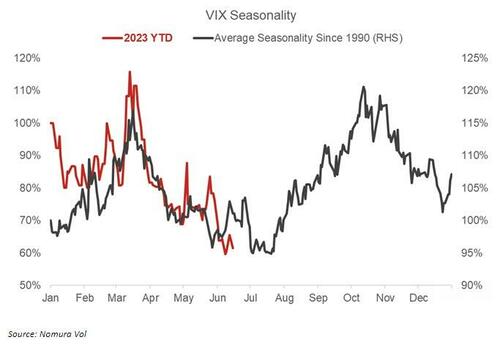
SELL GREED, BUY FEAR!
There are some proven market truisms that may be particulatly valuable to revisit at this point in the market's recent surge:
- "Shorting markets is extremely risky because markets can remain irrational longer than you can remain solvent!"
- "Sell Greed, Buy Fear!"
- "The last 5% of a topping ot bottoming market is always the most expensive!"
The list of reasons why this market is going higher is only matched by an equal list of reasons why the market is about to head lower! With over $4.2T in options having expired on Friday, there can be little doubt there are serious people with serious thinking, placing serious money on their opposing views. What can we take from this?
Yet another truism is: "Markets always do what will hurt the most number of participants!"
...... and yet another: "Bubbles are popped when Recessions arrive!'
My experience (with endless scars incurred) is that now is precisely the time to STAND ASIDE! If you are an investor, leave the action to speculators and the gamblers. Wait for the market to tell you who was right and who was wrong. Then, and only then - re-enter the market. Normally you don't need to wait long.
Legendary invesotor Warren Buffett summarizes all the above proven words of wisdom into his three Rules of Investing:
- Don't Lose Money,
- Don't Lose Money,
- Never forget Rule #1 and #2!
CHART BELOW: A rising VIX typically alligns with a falling equity market.
| |
|
ALL MAJOR MARKET SIGNALLING POTENTIAL MAJOR REVERSAL
Major Tops are often drawn-out and "Doomed" in appearance. This is because major reversal normally cross all major markets (Ie Equities, Currencies, Credit and Bonds) and often take time to "synchronize".
Our current bias is that a major market top is soon to be put in, because we see reversal patterns across most major markets, both in the US and Globally. This is rare!
However, this doesn't mean that a market high will necessarily immediately result in a market drop. Markets can still remain elevated for a period of time before something triggers a major drop. We don't believe the market is quite ready for a major capitulation lower. That may be later in Q3?
| |
|
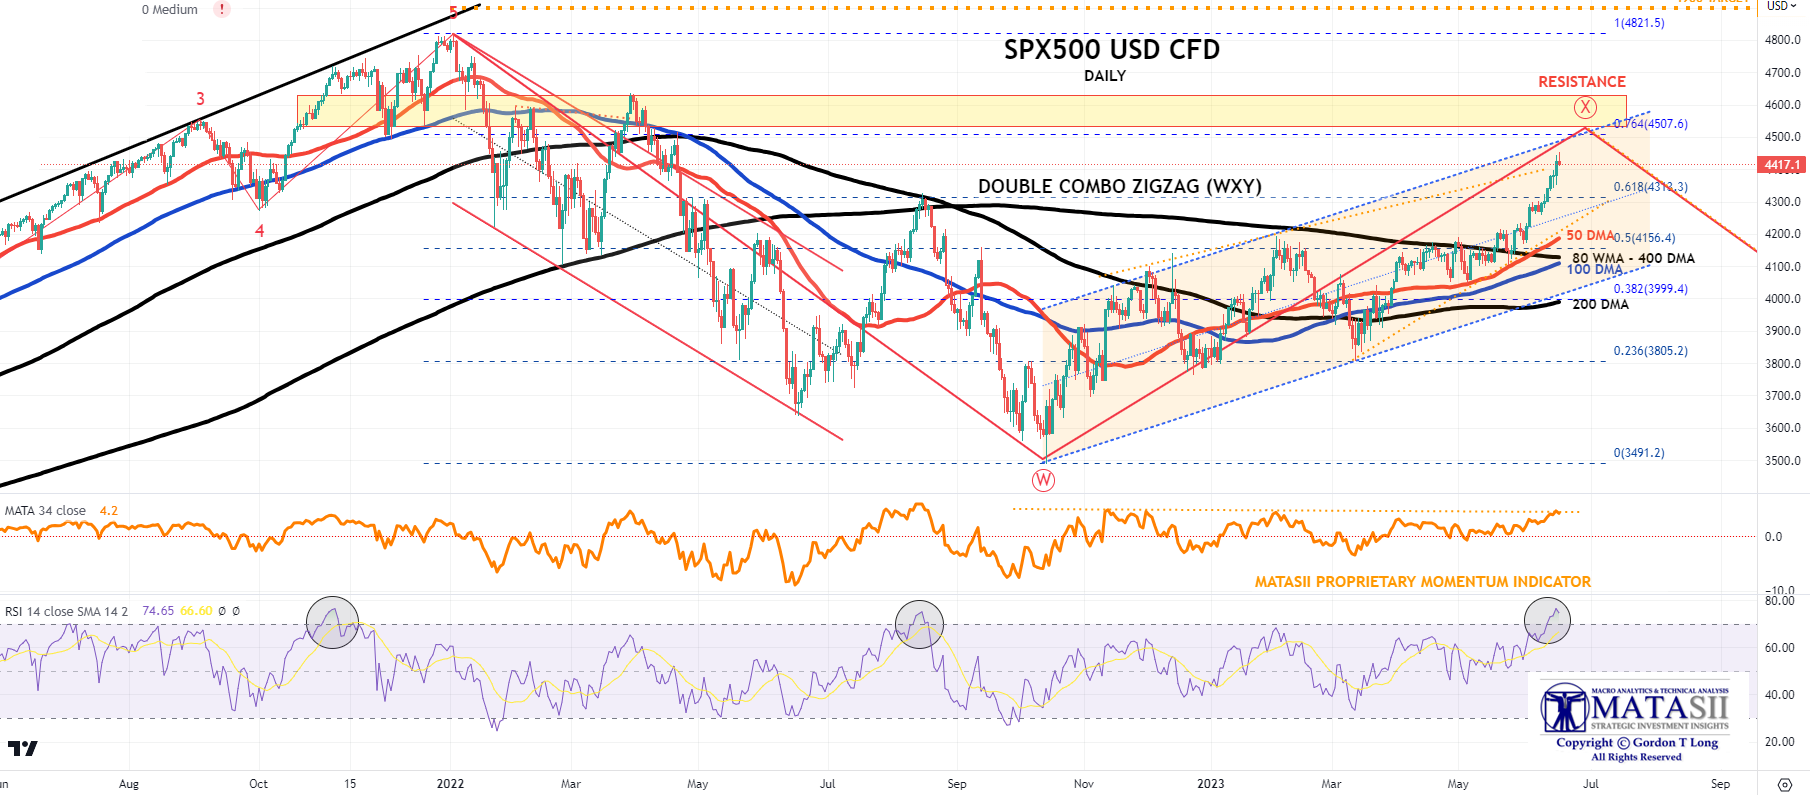
S&P 500 - MAJOR "X"LEG NEARING ENDING
We believe we are very near the completion of the "X:" leg of a classic Double Combo ZigZag pattern before the "Y" leg down occurs (normally equals the "W" length in time and price).
Our Long Term S&P 500 Head & Shoulders pattern also appears to support both the initial Fibonacci Cluster Window as part of the "choppy ending diagonal pattern" exhibited, and the June Quadruple Witch turn. Remember the Fibonacci Cluster Window is between June 16th and June 30th. (This was detailed two weeks ago with charts)
| |
YOUR DESK TOP / TABLET / PHONE ANNOTATED CHART
Macro Analytics Chart Above: SUBSCRIBER LINK
| |
|
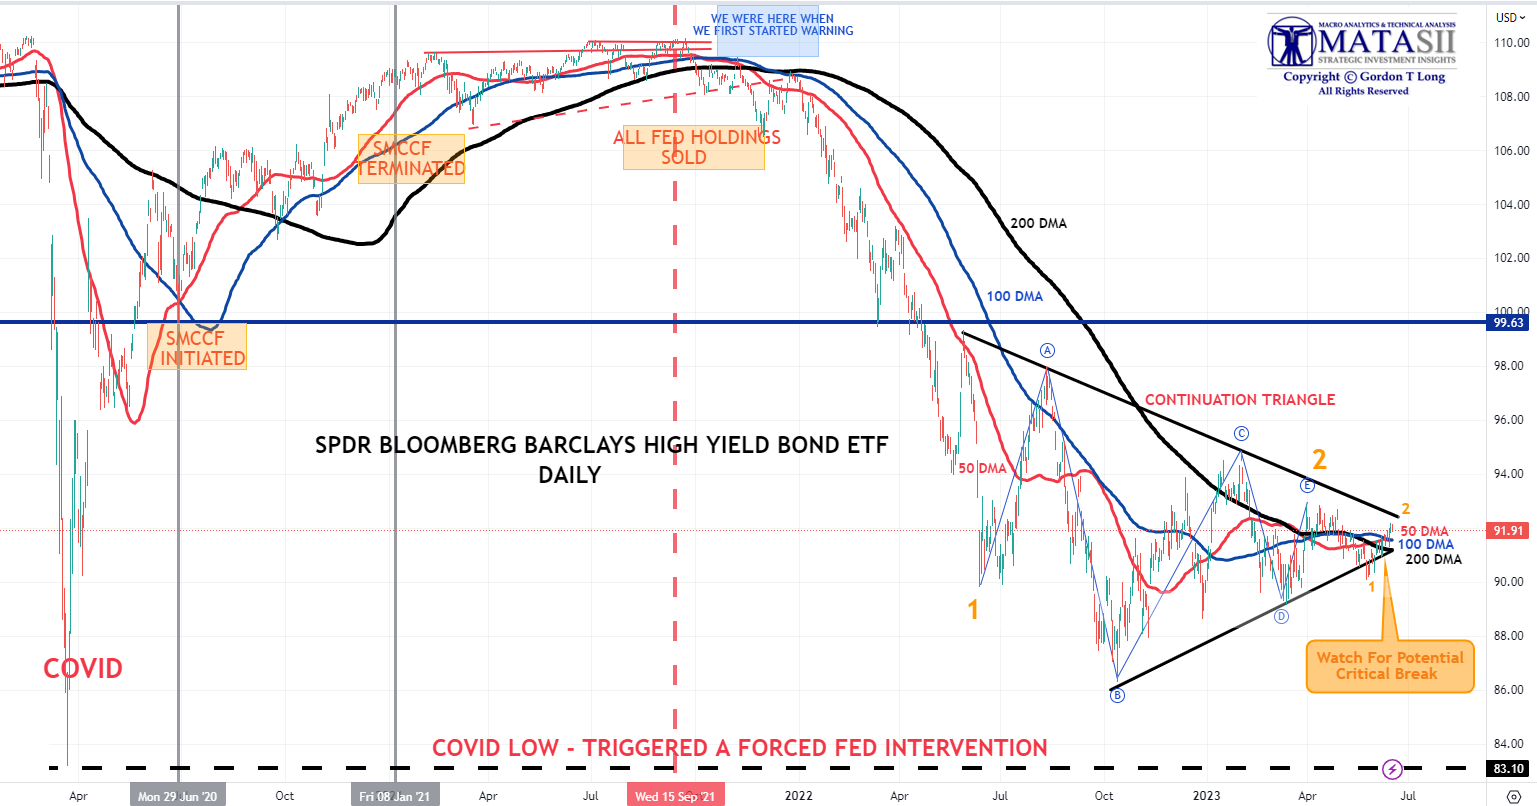
CREDIT - "JNK"
The consolidation pattern in the HY Corporate Bond Market appears to be nearing completion before heading lower in its' next major leg down. This leg will be leg "3" (labeled in red) and is normally the largest leg and often 1.618 of leg "1" in price.
| |
|
YOUR DESK TOP / TABLET / PHONE ANNOTATED CHART
Macro Analytics Chart Above: SUBSCRIBER LINK
| |
|
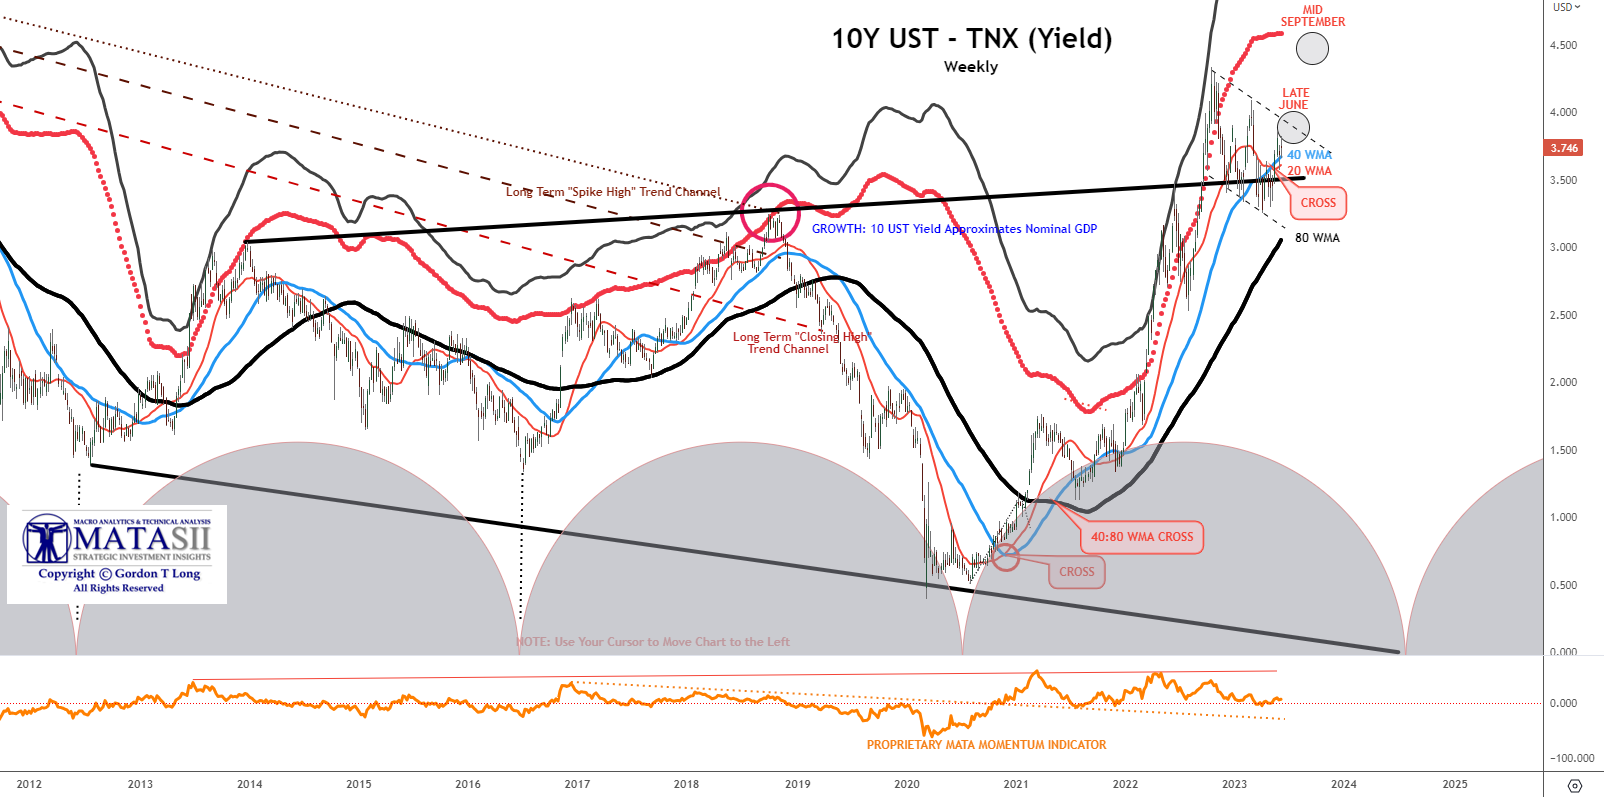
10UST YIELD - "TNX"
As we pointed out in last week's Newsletter, we see the potential for further increases in the 10Y UST Yield (a fall in price) before an Intermediate Term top in in place.
| |
|
YOUR DESK TOP / TABLET / PHONE ANNOTATED CHART
Macro Analytics Chart Above: SUBSCRIBER LINK
| |
|
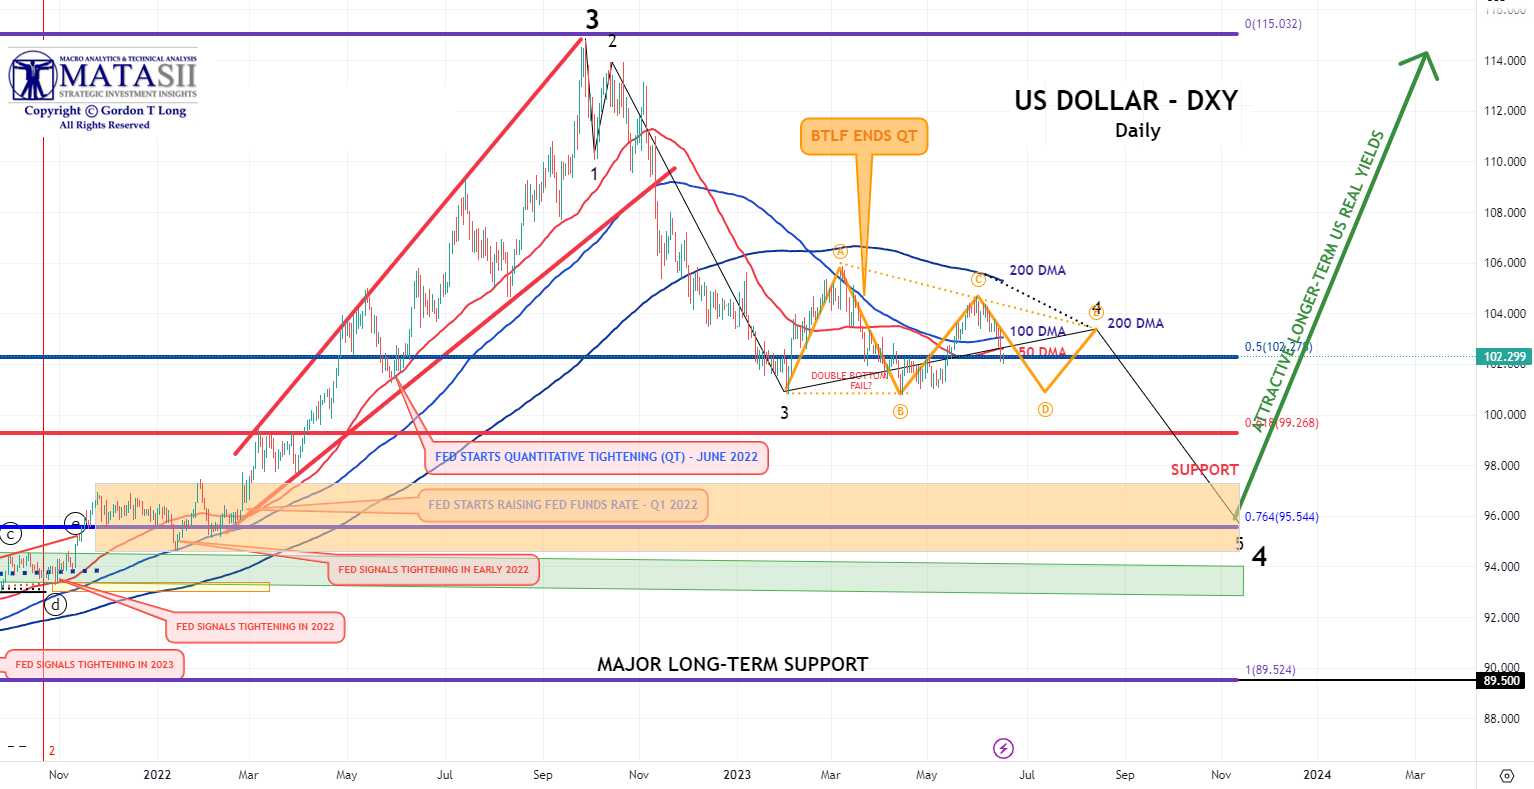
US DOLLAR - "DXY"
The US Dollar appears to need more time for the 10Y UST Yield to reach a near term high before the dollar starts to weaken on US Treasuries not being as attractive and the pressure of the US Treasury's $1.5T post Debt Ceiling TGA build hitting the market and pressuring pricies down (and yields up)!
| |
YOUR DESK TOP / TABLET / PHONE ANNOTATED CHART
Macro Analytics Chart Above: SUBSCRIBER LINK
| |
|
NOTICE Information on these pages contains forward-looking statements that involve risks and uncertainties. Markets and instruments profiled on this page are for informational purposes only and should not in any way come across as a recommendation to buy or sell in these assets. You should do your own thorough research before making any investment decisions. MATASII.com does not in any way guarantee that this information is free from mistakes, errors, or material misstatements. It also does not guarantee that this information is of a timely nature. Investing in Open Markets involves a great deal of risk, including the loss of all or a portion of your investment, as well as emotional distress. All risks, losses and costs associated with investing, including total loss of principal, are your responsibility.
FAIR USE NOTICE This site contains copyrighted material the use of which has not always been specifically authorized by the copyright owner. We are making such material available in our efforts to advance understanding of environmental, political, human rights, economic, democracy, scientific, and social justice issues, etc. We believe this constitutes a ‘fair use’ of any such copyrighted material as provided for in section 107 of the US Copyright Law. In accordance with Title 17 U.S.C. Section 107, the material on this site is distributed without profit to those who have expressed a prior interest in receiving the included information for research and educational purposes. If you wish to use copyrighted material from this site for purposes of your own that go beyond ‘fair use’, you must obtain permission from the copyright owner.
========
| |
MATASII'S STRATEGIC INVESTMENT INSIGHTS | |
2020 VIDEOS OUTLINING THE COMING RISE IN INFLATION & COMMODITY PRICES | |
|
RELEASED - 06-07-23
VIDEO: 20 Minutes with 47 supporting slides.
| |
IDENTIFICATION OF HIGH PROBABILITY TARGET ZONES | |
Learn the HPTZ Methodology!
Identify areas of High Probability for market movements
Set up your charts with accurate Market Road Maps
Available at Amazon.com
| |
The Most Insightful Macro Analytics On The Web | | | | |