|
Gordon T Long Research exclusively distributed at MATASII.com
Subscribe to Gordon T Long Research - $35 / Month - LINK
Complete MATASII.com Offerings - $55/Month - LINK
SEND YOUR INSIGHTFUL COMMENTS - WE READ THEM ALL - lcmgroupe2@comcast.net
| |
|
LONGWave - OCTOBER 2024
Technical Analysis - 10/14/24
| |
STAGFLATION'S LOOMING HOLD ON THE FED'S DUAL MANDATE
OBSERVATIONS: WHAT WE HAVE FORGOTTEN ABOUT AMERICA
Adam Smith wrote the landmark book "Wealth of Nations" in 1776. This was incredibly serendipitous that his thinking came into focus during that same year the American nation was founded. Clearly, his thinking had a profound impact on our forefathers thoughts towards architecting the governance of this new Republic.
What he got right were two important pillars we need to remember during this election season:
- First, that wealth is created by individuals, operating in their own self-interest, and that this is achieved through the understanding that EMPATHY for others was required in order to earn the TRUST of others. Trust was required in order for others to voluntarily choose to engage, socially and in commerce.
- Secondly, based on his book the US founding fathers, chose to MINIMIZE THE ROLE OF GOVERNMENT and to rely on free enterprise to be the engine of the nascent nation.
Jeff Thomas (a "Brit") has lived multi-nationally since childhood and questions governments as a general principle. Being an Austrian economist believing in personal liberty and limiting government, he recently penned the following salient reminders:
The Smithian principle is based upon voluntary exchange – a free market, from the bottom up, not the top down. In it, each creator of goods chooses to create, not that which he most wishes to create, but that which is most likely to be salable to others.
Similarly, he recognizes that he must produce it for a price that others are prepared to pay and in no greater amounts that they are prepared to buy. Increased demand may tend to raise the price being asked, but higher prices will inspire others to compete. Their production inevitably creates a balance between demand, availability and prices.
The free market, therefore, satisfies the provision of goods, the volume of goods available and the prices of goods. No one is forced to produce. No one is forced to buy. It’s an entirely self-sustaining and endlessly self-renewing process.
In a free-market system, there are no top-down controls by legislators or regulators. In a top-down system, attempts are made to dictate quotas and prices and apply taxation. All are counter-productive.
This “natural liberty,” as Mister Smith termed it, is invariably destroyed to a greater or lesser degree by outside forces, such as governments and trade unions. They seek to dictate prices and impose quotas, tariffs and taxation. Not only do these entities not have the ability to regulate every individual agreement between any two parties, they invariably fall prey to corruption - giving rise ===>
| |
|
VIDEO PREVIEW (click image)
Pay-Per-View Page Link
|  | |
THIS WEEK WE SAW
Exp=Expectations, Rev=Revision, Prev=Previous
US
US International Trade (USD)(Aug) -70.4B vs. Exp. -70.6B (Prev. -78.8B, Rev. -78.9B)
US Goods Trade Balance (R)(USD)(Aug) -94.22B (Prev. -94.26B)
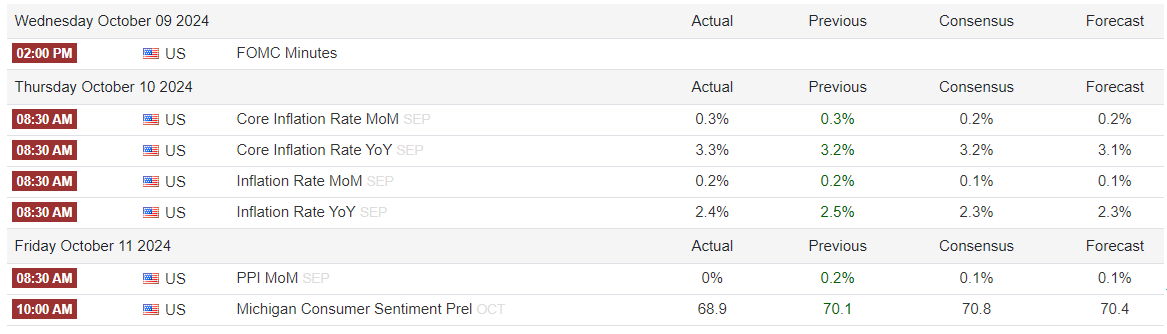
US CPI YY NSA (Sep) 2.4% vs. Exp. 2.3% (Prev. 2.5%)
US Core CPI YY NSA (Sep) 3.3% vs. Exp. 3.2% (Prev. 3.2%)
US Initial Jobless Claims w/e 258.0k vs. Exp. 230.0k (Prev. 225.0k)
US Continued Jobless Claims w/e 1.861M vs. Exp. 1.83M (Prev. 1.826M, Rev. 1.819M)
===> to cronyism, monopolies and insider deals.
Government is ... the destroyer of free enterprise.
All governments, in every era, wrestle with the question of, to what degree they should intervene in commerce in order to maximise the wealth of the country. Regardless as to whether they are sincere in their deliberations, the fatal flaw is that the answer – one that they cannot accept – is: none.
In modern times, free enterprise (i.e., capitalism) has been blamed for impoverishment, over-pricing, inadequate quality of goods and more. Yet a true free market corrects these problems. These problems, which are only too real, are the product of a century of governmental regulation of and interference in the free market. We may criticize the free market, yet we have never actually lived in a free-market system.
The successful government does not need to do good things for you; it only needs to cease doing bad things for you.
What Thomas is reminding us is that the exploding growth of the US of Regulatory State with its monstrous employee base and economic dependents / entanglements (Big Tech, Big Pharma, Big Ad, Military /Industrial/ Surveillance Complex & MSM ) has become a top down goliath (versus bottom up). This is everything our forefathers opposed and somehow we have forgotten?
As Benjamin Franklin warned: "We have created a Republic - if you can keep it!"
| |
========================= | |
|
WHAT YOU NEED TO KNOW!
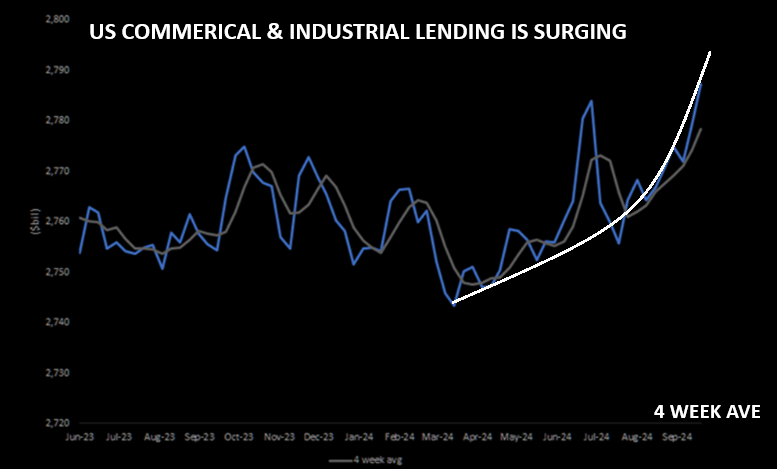
EXCESS LIQUIDITY IS BEING QUICKLY GRABBED (BY ZOMBIES?)!
US commercial & industry (C&I) weekly lending data continue to grow on the leading edge, signaling higher investment + activity (+ve orders).
For the week ending 9/26, C&I lending grew another 29 bps w/w to $2.79T, which marks the highest level since Q1’23. Outstanding C&I loans are now tracking +73 bps yoy, the strongest growth mark since 2023.
HOWEVER, Consumer Revolving Credit (Credit Cards) has suddenly plunged with rates at 21.6%. (See Global Economic Insights.)
| |
|
RESEARCH
1- STAGFLATION'S LOOMING HOLD ON THE FED'S DUAL MANDATE
- Liquidity conditions in the US and globally are re-igniting inflation.
- Meanwhile slowing Global Economic conditions are increasingly weakening full employment.
- Stagflation is becoming a bigger problem than a Recession. A "No Landing", Stagnation environment is currently the outlook.
- Weak GDP with elevated Inflation is harder for the Fed to fight than just two quarters of negative GDP (a recession).
2- CHINA: More "Half Measure" Stimulus Actions Taken
- First the Politburo (Fiscal), then PBOC (Monetary) and then Saturday the Ministry of Finance (Social & Housing).
- Yet still no Bazooka?
- China presently needs to focus on stimulating Consumer Consumption not "high value-add" Industrial Mercantilism.
| |
|
DEVELOPMENTS TO WATCH
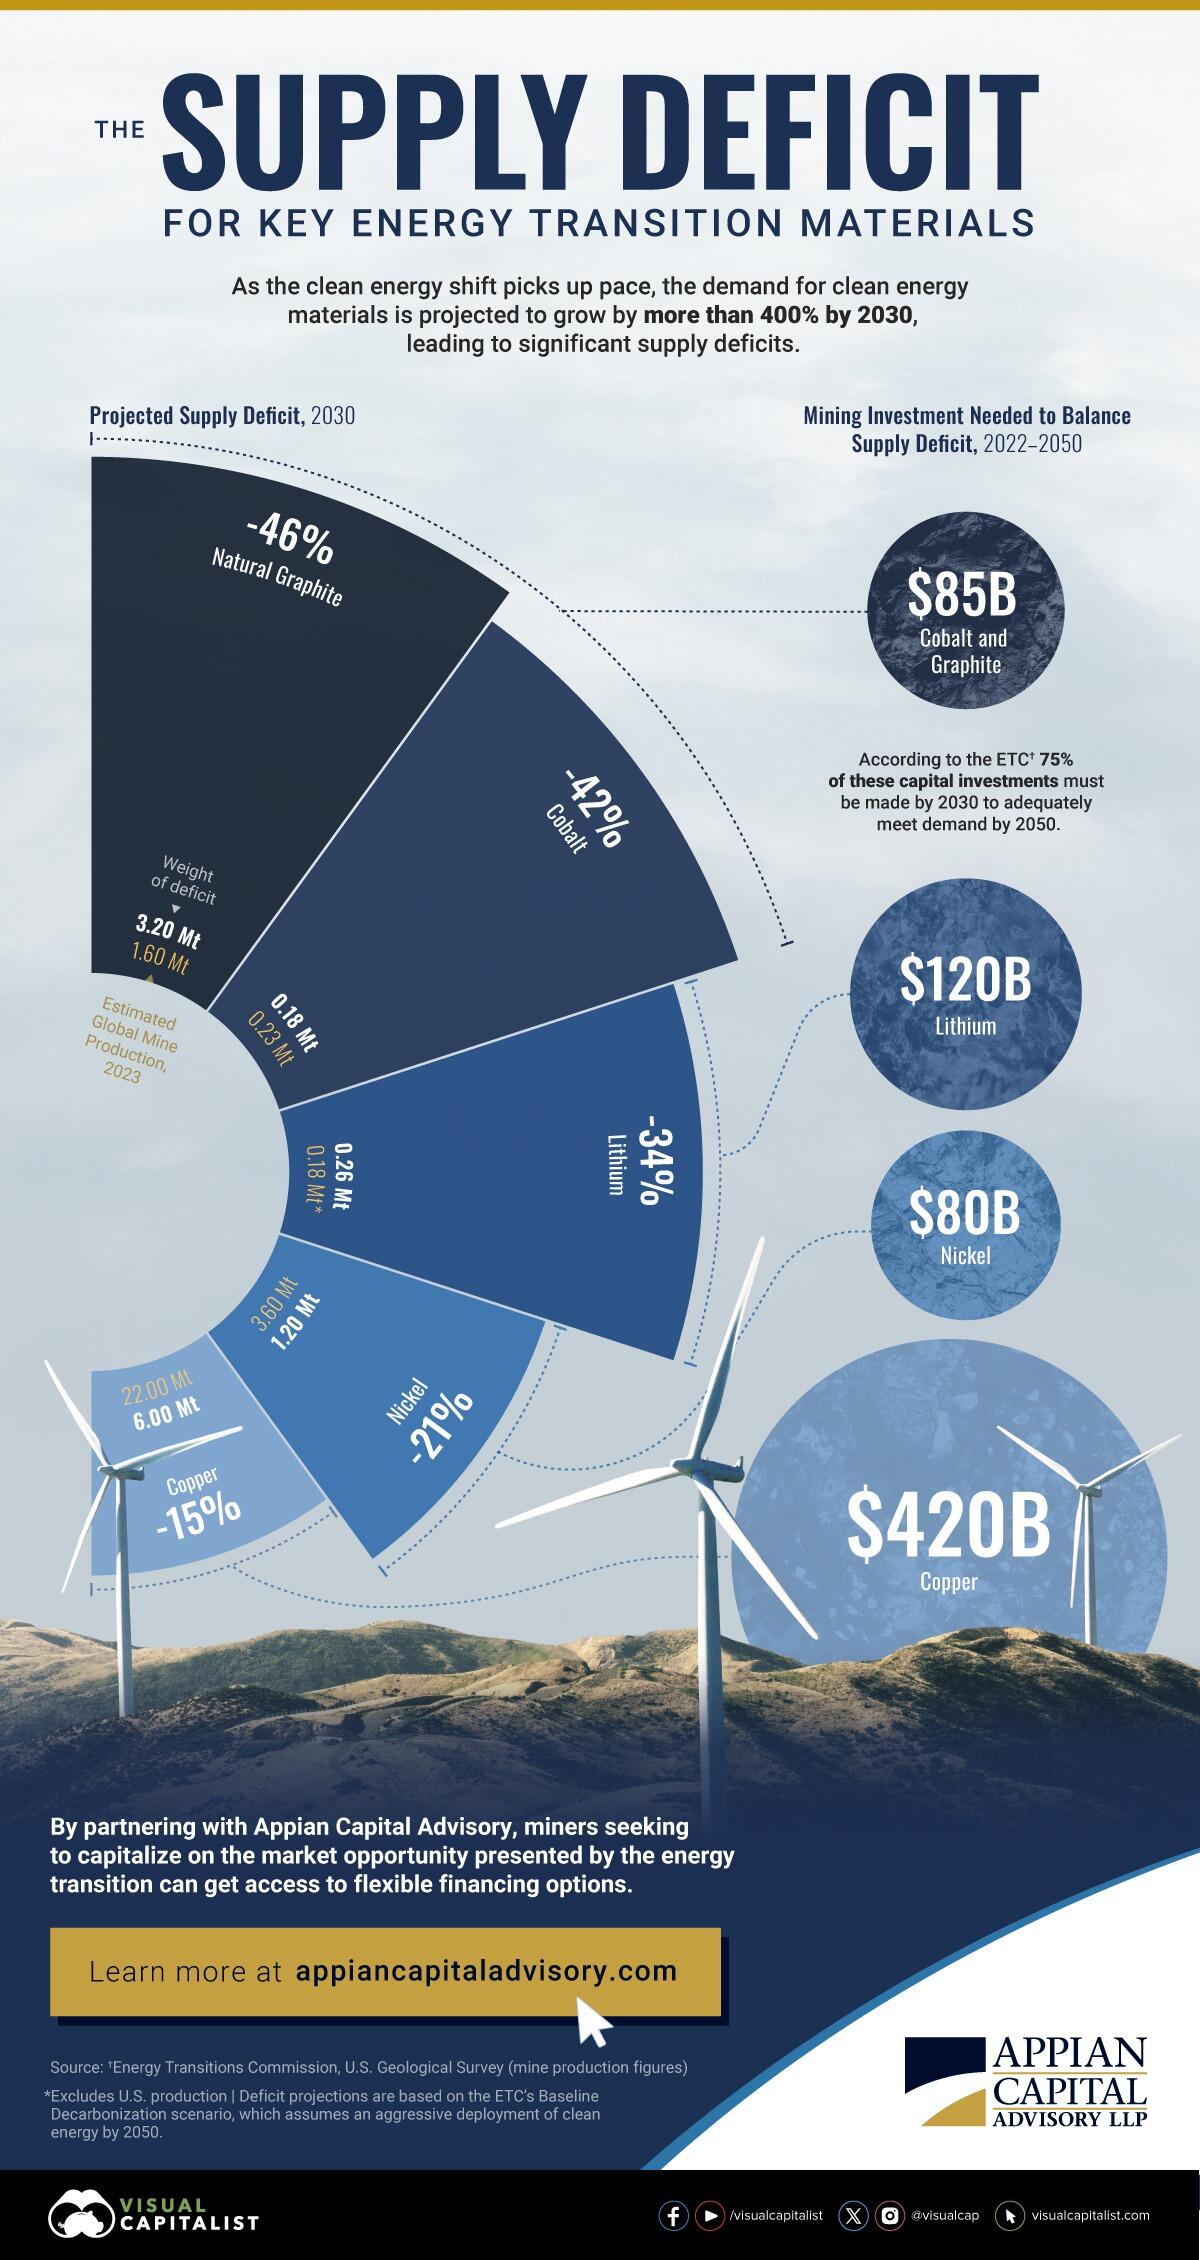
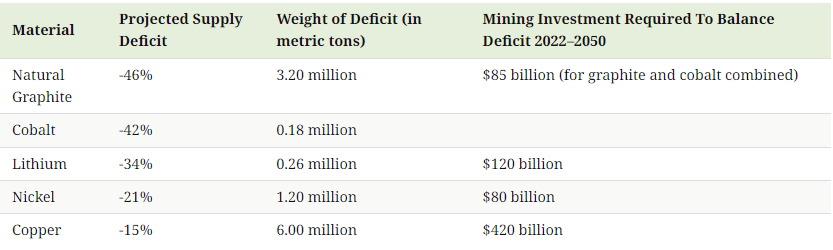
SUPPLY DEFICITS - Energy Transition Metals
(Further Support of This Week's Video)
- The demand for clean energy metals will grow by more than 400% by 2030, according to the Energy Transitions Commission (ETC).
- Supply, however, is not on track to keep up with this surging demand.
- Building a clean energy future isn’t just about technology—it’s about materials. The transition to renewable energy will require a vast array of raw metals, such as:
-
Natural Graphite and Cobalt: Critical for electric vehicles (EVs) and energy storage.
-
Nickel: Critical for battery performance and an important component of wind turbines and green hydrogen technologies.
-
Copper: Required for electrical wiring and expanding transmission infrastructure.
-
Lithium: Central to batteries in EVs and energy storage.
- Together, the above energy transition materials require more than $700 billion of investment through 2050 to balance their supply deficits.
- 75% of these capital investments should be made by 2030 in order to meet demand by 2050, according to the ETC.
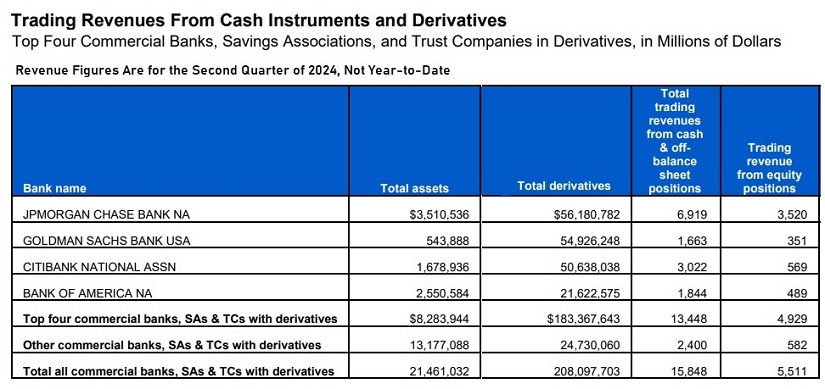
THE JP MORGAN FDIC BACKED DERIVATIVES CASINO
- The Office of the Comptroller of the Currency (OCC) released its Quarterly Report on Bank Trading and Derivatives Activities for the second quarter of this year. The shorthand for this report should be the “Casino Report.”
- The report showcases how much dangerous trading activity the brokerage firms on Wall Street have been able to muscle into their federally-insured banking units, where the deposits of millions of average Americans reside.
- Since the repeal of the Glass-Steagall Act in 1999 under the Bill Clinton administration, Wall Street trading firms have been allowed to combine with federally-insured banks – creating an endless series of crises and bailouts. No bank has been able to blur the lines between a trading casino and a federally-insured bank more aggressively than JPMorgan Chase.
- According to the FDIC, as of June 30 there were a total of 4,539 federally-insured commercial banks and savings associations in the U.S. All commercial banks and savings associations in the U.S., which held derivatives as of June 30, 2024, had trading revenues totaling $15.848 billion., Of that sum, JPMorgan Chase Bank NA represented $6.9 billion or 44 percent.
| |
|
GLOBAL ECONOMIC REPORTING
CONSUMER PRICE INDEX (CPI)
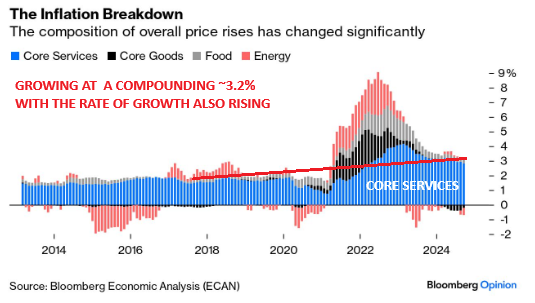
- For the 52nd straight month, core consumer prices rose on a M-o-M basis in September (+0.3% MoM - hotter than the 0.2% expected) - the strongest since March. That left Core CPI YoY up 3.3%, hotter than the 3.2% expected.
- SUPERCORE CPI: Increased on a Y-o-Y basis to +4.6%.
-
CORE SERVICES WITH FOOD: Costs surged in September:
- The index for meats, poultry, fish, and eggs rose 0.8% in September; the eggs index jumped 8.4%. The fruits and vegetables index increased 0.9% over the month, following a 0.2-percent decline in August.
- Five of the six major grocery store food group indexes increased.
PRODUCER PRICE INDEX (PPI)
- Energy prices weighed the PPI down (likely not to last) as Food + Services surged.
- The indexes for final demand Foods and for final demand goods less foods and energy increased 1.0 percent and 0.2 percent, respectively.
CONSUMER CREDIT - Hits 'Brick Wall'!
- The Fed reported that in August, total consumer credit growth plunged by more than half to just $8.9 billion, below the $12 billion estimate.
- The average rate on all credit cards in the US just hit a new high of 21.76%, up from 21.51%.
| |
|
In this week's "Current Market Perspectives", we focus on the signals that Sentiment, Fundamentals and various market Segments (Credit, Bond and Equity) are currently giving us.
=========
| |
|
1- STAGFLATION'S LOOMING HOLD ON THE FED'S DUAL MANDATE
In recent newsletters, I pointed out the explosion we are seeing in Global Excess Liquidity.
US LOOSENING INTO ALREADY EXTREMELY LOOSE FINANCIAL CONDITIONS
+ CHINA NOW REFLATING
+ EXTREME LIQUIDITY (Last Week's Detail)
= INFLATION RE-IGNITED
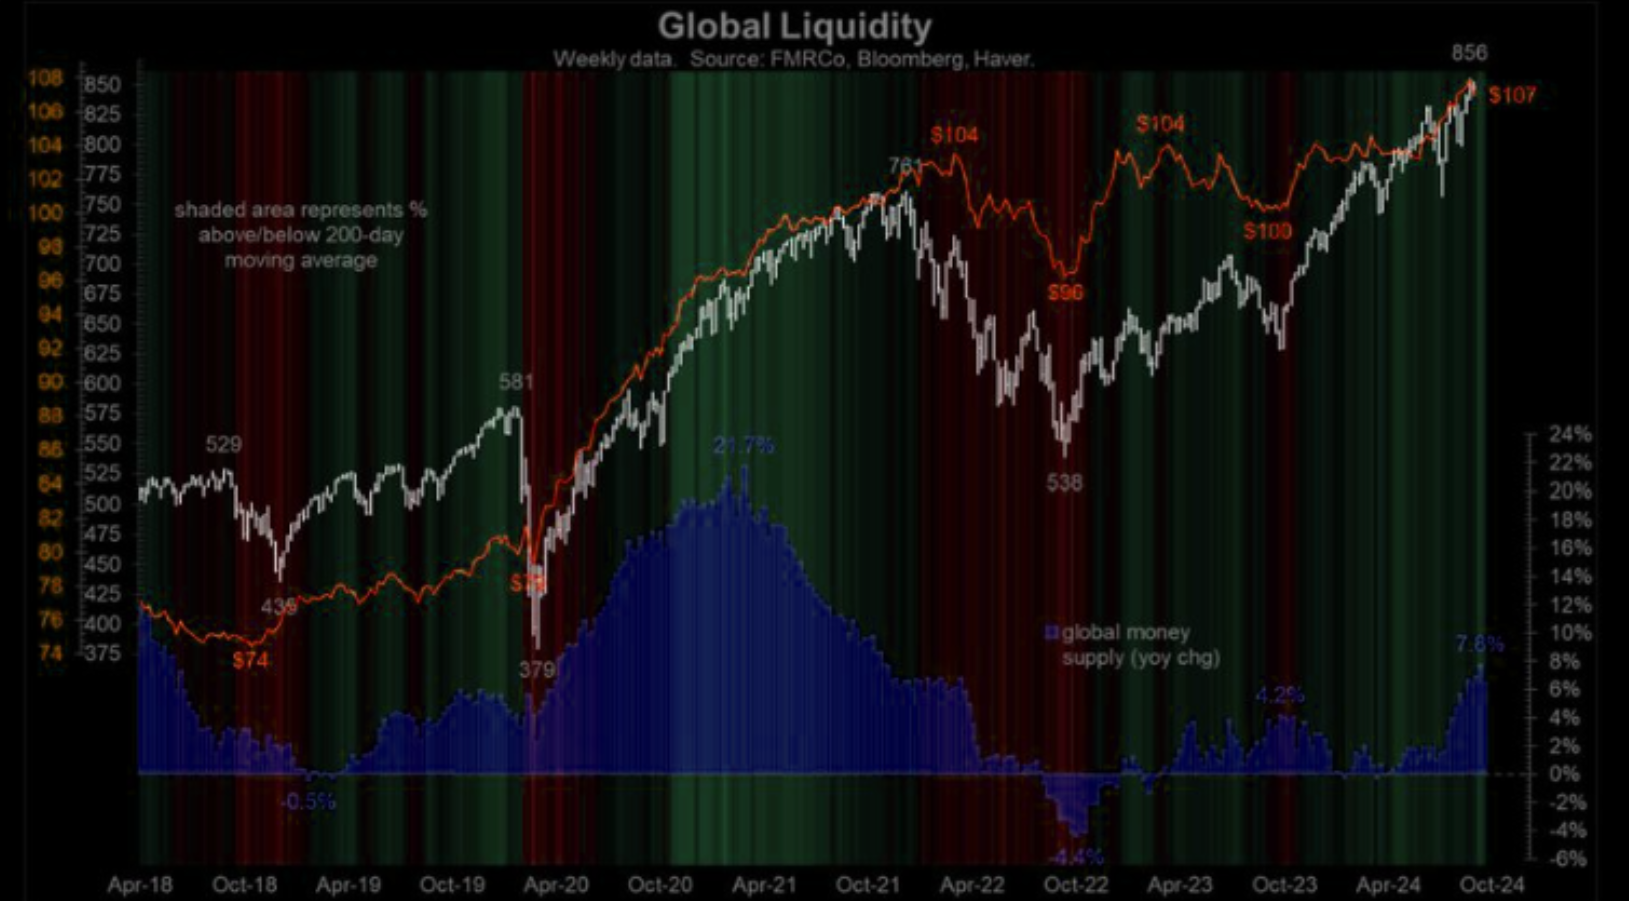
GLOBAL MONEY SUPPLY
Global Money Supply has now hit all-time high of $107 Trillion! [NOTE: Sorry for the quality but this chart was particularly hard to come by!]
| |
RAPIDLY RISING COMMERCIAL LENDING
US commercial & industry (C&I) weekly lending data continues to grow on the leading edge, signaling higher investment + activity (+ve orders).
For the week ending 9/26, C&I lending grew another 29 bps w/w to $2.79T, which marks the highest level since Q1’23. Outstanding C&I loans are now tracking +73 bps yoy, the strongest growth mark since 2023.
| |
|
FURTHER SPIKE IN EXCESS LIQUIDITY "KICKING IN"!
It is interesting to note that Consumer Revolving Credit (Credit Cards) however has suddenly plunged with rates at 21.6%. (See the Global Economic Insights section below.)
THE FEDERAL RESERVE'S DUAL MANDATE
The Fed's modern statutory mandate, as described in the 1977 amendment to the Federal Reserve Act, is to promote maximum employment and stable prices. These goals are commonly referred to as the Dual Mandate.
DUAL MANDATE
- PRICE STABILITY => Fight Inflation
- FULL EMPLOYMENT => Stop Layoffs & Recessions
THE FED'S FIRST PRIORITY
- The reality is that Inflation reduces the government's debt burden, while full employment increases tax revenues.
- The Fed historically will lean towards sacrificing price stability, (inflation and the US dollar), to protect maximum employment, (minimize job losses which are particularly disruptive to profits, the banks, the bond market and politicians).
| |
|
1- PRICE STABILITY & FIGHTING INFLATION
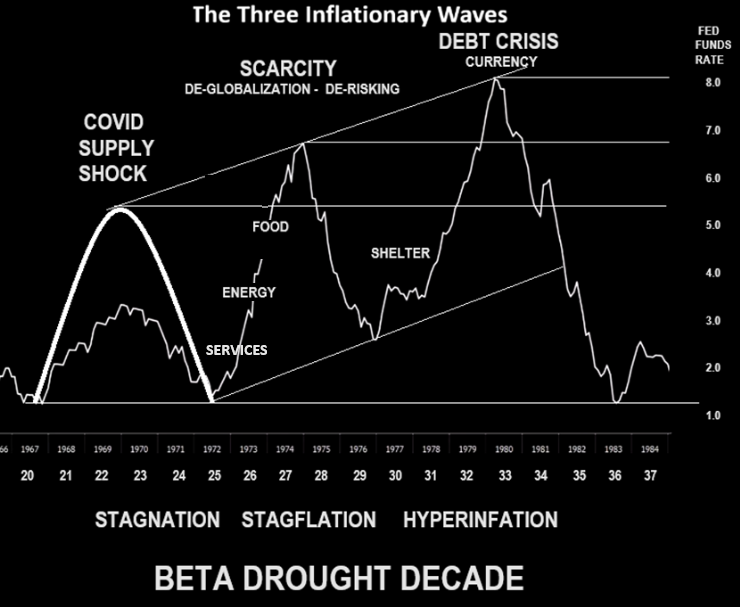
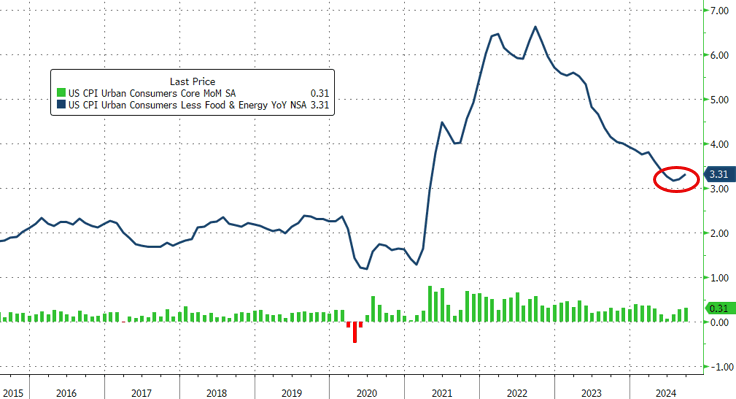
The Covid Supply Shock, which triggered the first wave of inflation, forced the Fed into significant increases in the Fed Funds Rate. With the lag delay associated with the Rate Cuts, we have only recently seen Inflation rates fall, but are still in the 3% range and not the 2% target.
However, we are now only beginning to experience new inflation drivers just as the Fed has begun cutting the Fed Funds Rate:
- Excess Global Liquidity as central Banks Global rush to cut rates
- The full impact of massive US Fiscal Deficits which are showing with Inflation Expectations being built into the system - Example: the US port workers settling for a 66% compensation increase, while Boeing workers and others head to the picket lines.
- Service Inflation, (as shown in Core and SuperCore measures), is currently accelerating upward and shows no signs of in fact falling.
|  | |
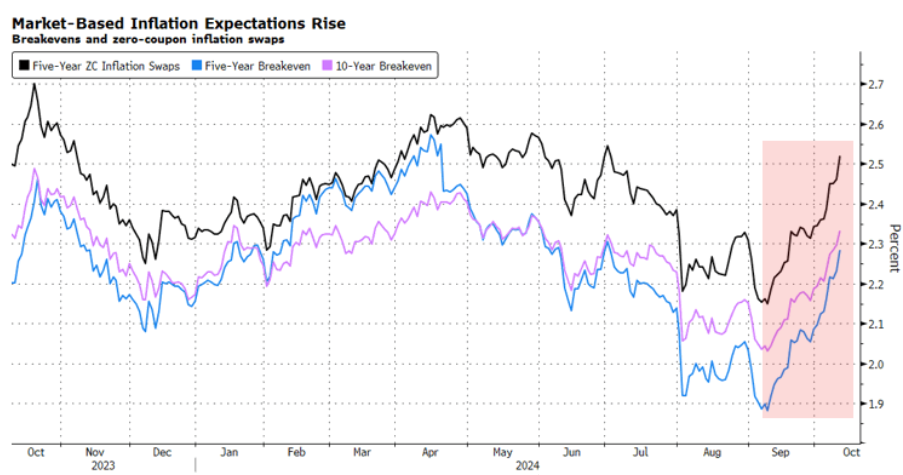
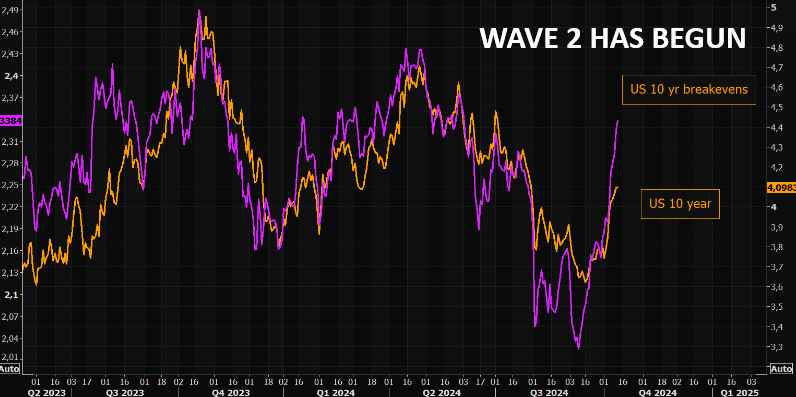
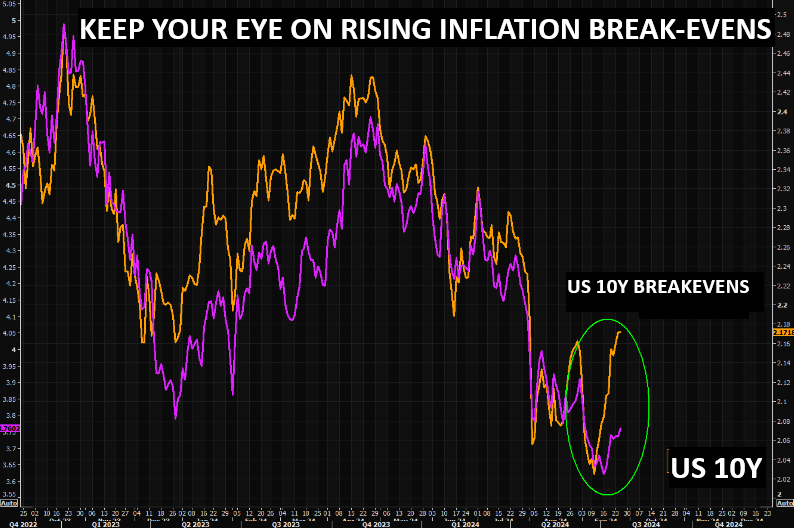
RISING INFLATION BREAKEVENS
US 10 year breakevens have now moved quickly to early summer highs. (chart right)
Market determined inflation expectations are rising significantly when determined through inflation breakevens and zero coupon inflation Swaps. (chart below)
| |
|
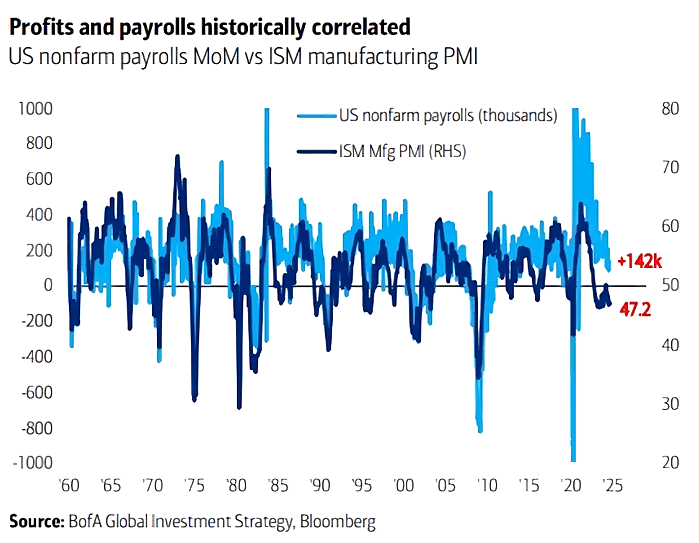
2- FULL EMPLOYMENT & LABOR MARKETS
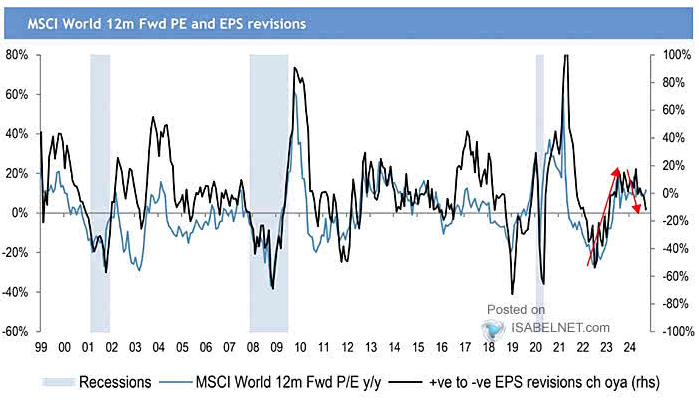
Downward revisions in global EPS raise concerns, suggesting that the global economic landscape is precarious. This is prompting central banks to adopt more aggressive strategies to stimulate growth and wholesale reductions in Interest rate.
The Federal Reserve has been the last to follow.
The U.S. ISM manufacturing index reading below 50 signals a contraction in manufacturing activity. Historically, this has correlated with falling labor numbers. (chart below)
| |
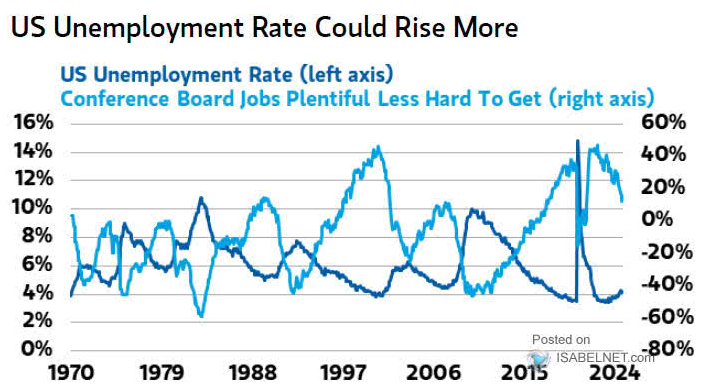
Shifting consumer perception regarding job availability suggests notable change reflecting a rise in the U.S. unemployment rate, (likely to be reflected in BLS reporting after the election). | |
|
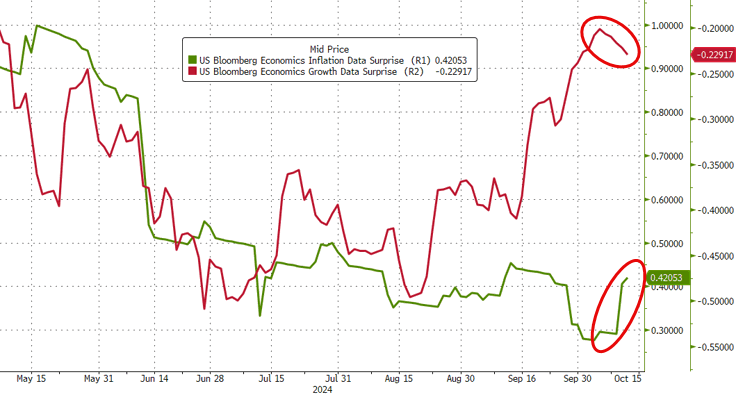
STAGFLATION COMETH!
Since August the Inflation macro data has surprised to the upside, while the growth macro data to the downside.
It clearly smells of looming Stagflation?!?
| |  |
| |
|
CONCLUSIONS
- Liquidity conditions in the US and globally are re-igniting inflation.
- Meanwhile slowing Global Economic conditions are increasingly weakening full employment.
- Stagflation is becoming a bigger problem than a Recession. A "No Landing", Stagnation environment is currently the outlook.
- Weak GDP with elevated Inflation is harder for the Fed to fight than just two quarters of negative GDP (a recession).
- The fight against Stagflation is "on Deck" waiting for its turn at bad!
Expect the Fed to lower rates to fight slowing economic conditions while Inflation worsens.
| |
|
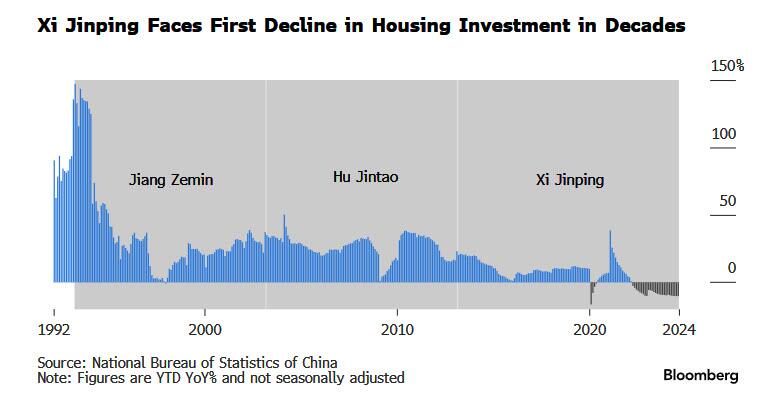
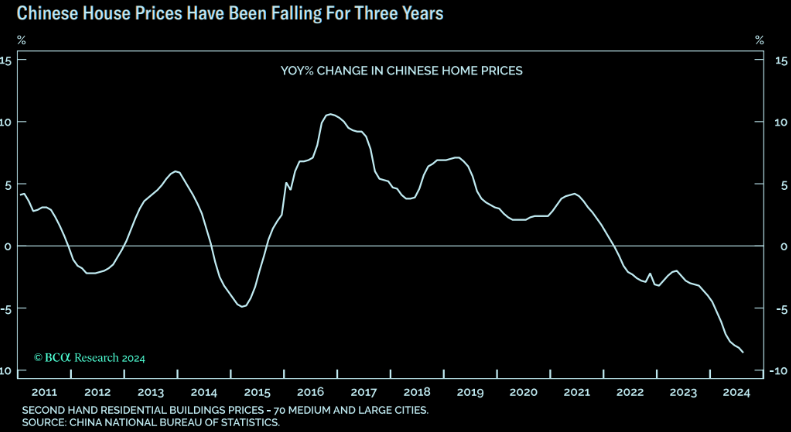
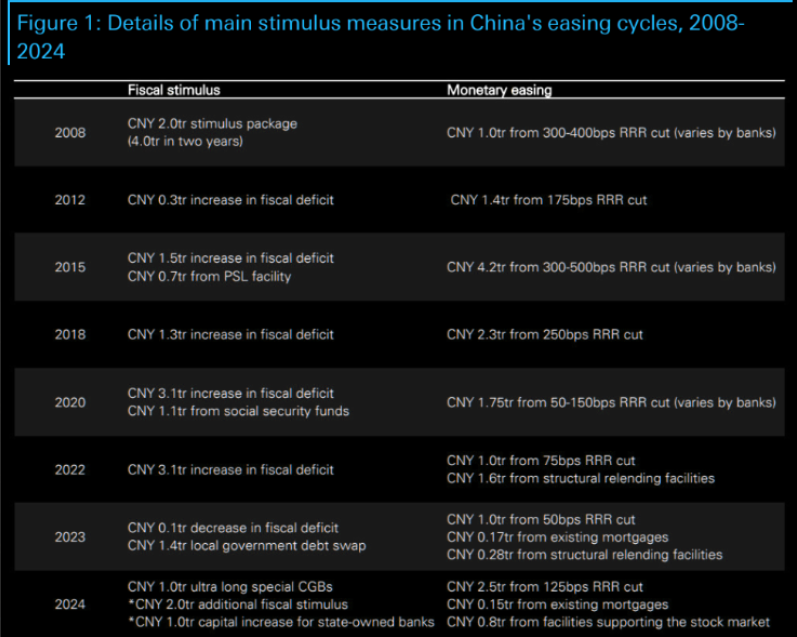
2- CHINA: More "Half Measure" Stimulus Actions Taken
- THURSDAY ANNOUNCEMENT 09/19/24 - From the Politburo: Significant Fiscal Policy Support
- TUESDAY ANNOUNCEMENT 09/24/24 - From the PBOC: Important Monetary Policy Support
- SATURDAY ANNOUNCEMENT 10/12/24 - The Ministry of Finance (Social & Housing Support)
STILL NO BAZOOKA!
- China announced intentions to further ramp up support for the economy, promising more aid for the slumping property sector and indebted local governments. But as Bloomberg reported "officials again failed to convince economists that they’re doing enough to defeat deflation".
- Finance Minister Lan Fo’an refrained from putting a price tag on China’s fiscal stimulus as many investors expected, signaling instead that details would come when China’s legislature meets in the coming weeks.
- More importantly, Lan did not announce any new stimulus on consumption/household subsidies, and instead he said he will introduce further incremental measures in the near future without providing more details.
- Lan also suggested some of the proposed measures would require approval by the NPC Standing Committee, which is expected to meet tin the coming weeks.
- The supportive measures he did announce, however, gave little indication Chinese authorities felt any urgency to ramp up consumption, which many economists see as essential to reflating the economy and putting it on a more positive growth trajectory. (Yet which the market was convinced would happen, which is why Chinese stocks erupted in a 30% frenzy in recent weeks).
BOTTOM LINE: The post-melt up hangover comes next and stocks will plunge, draining what little "wealth effect" had been created.
|  | |
WHAT WAS ANNOUNCED
Here is a snapshot of the package announced by the MOF, courtesy of Goldman who writes that major fiscal stimulus measures include:
- Raising the government debt limit “by a relatively large amount in a one-off effort” to accelerate local government debt resolution, with the magnitude of debt resolution to be the largest in recent years,
- Increasing local government funding by RMB400bn through the unspent bond issuance quota accumulated from previous years,
- Issuing additional central government special bonds (CGSB) to help large state-owned banks replenish their equity capital,
- Allowing local government special bonds (LGSB) to be used for land acquisition and redevelopment, as well as the purchase of housing inventory,
- Increasing the transfer payment to students.
- On forward guidance, MOF Head Mr. Lan Fo’an emphasized that the central government has relatively large space for debt expansion and deficit increases, and flagged that policymakers are studying other incremental policy tools.
- Goldman views today's MOF meeting as largely in line with the market's wide-ranging expectations, with the upside from clear forward guidance on multi-year fiscal expansion, a larger-scale local government debt resolution and more central government debt financing, but downside from a lack of specifics on the size of stimulus, and little detail on the RMB1tn CGSB to support consumption speculated by markets previously.
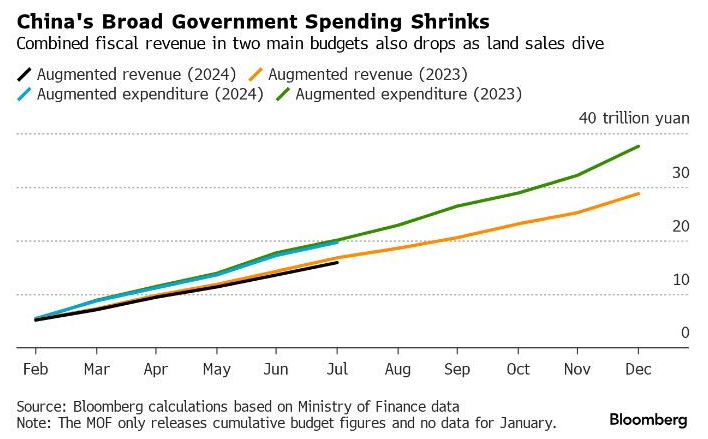
- Given falling tax and land sales revenue, we estimate the gap, between government revenue (including on-budget fiscal revenue and off-budget government-managed fund revenue) out-turns and MOF projections made in the 2024 budget, could be RMB2.3tn this year,
- Goldman expects policymakers to approve an additional RMB1-2tn in ultra-long-term (ULT) CGSB quota in the next NPC standing committee meeting (around late Oct – early Nov), scale up the local government debt swap plan potentially to the magnitude of around RMB5tn for multiple years, and plan notably higher government bond issuance quotas in 2025 and beyond vs. the 2024 budget, (by setting a higher official deficit target and larger ULT CGSB quota).
WHAT HAD ALREADY BEEN ANNOUNCED
|  | |
|
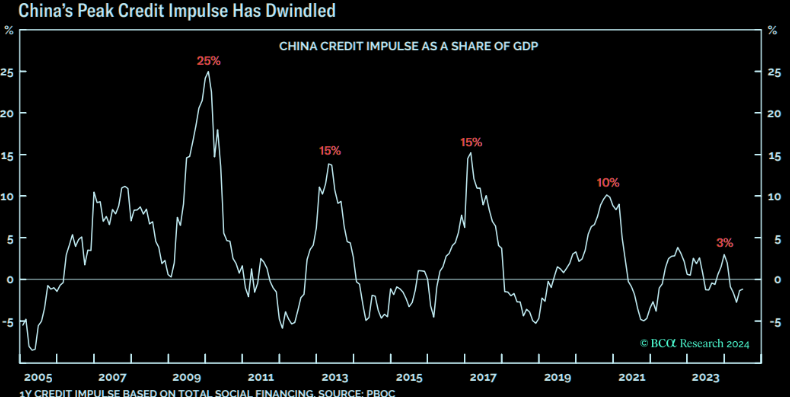
CHINESE CREDIT IMPULSE
Credit impulse has dwindled....so has the boost to growth. Basically forget credit impulses:
"Through 2000-20, when China’s housing boom was in full swing, it was possible to channel the exponential credit curve into the housing and construction boom. But now, absent an alternative destination for the productive use of credit of the same magnitude, it will be difficult to generate those same monster credit impulses."
- Absent the multi-decade housing and construction boom, China will be unable to generate the monster credit impulses that it did through 2000-20.
- Hence, the recent melt-up in Chinese stocks and China plays may last a few weeks more, but is unlikely to be a rerun of the 2015 episode either in magnitude or in duration.
| |
|
CONCLUSION
China's stimulus measures are expected to stabilize the property market, but unresolved issues remain, particularly a worsening fiscal situation due to weaker growth affecting tax revenues. This limits the ability for fiscal easing.
Continued reliance on investment to defend GDP growth may exacerbate deflation. Easing measures haven't yet improved the negative GDP deflator.
China presently needs to focus on stimulating Consumer Consumption, not "high value-add" Industrial Mercantilism.
| |
|
DEVELOPMENTS TO WATCH
SUPPLY DEFICITS - Energy Transition Metals
- The demand for clean energy metals will grow by more than 400% by 2030, according to the Energy Transitions Commission (ETC).
- Supply, however, is not on track to keep up with this surging demand.
- Building a clean energy future isn’t just about technology — it’s about materials. The transition to renewable energy will require a vast array of raw metals, such as:
- Natural Graphite and Cobalt: Critical for electric vehicles (EVs) and energy storage
- Nickel: Critical for battery performance and an important component of wind turbines and green hydrogen technologies
- Copper: Required for electrical wiring and expanding transmission infrastructure
- Lithium: Central to batteries in EVs and energy storage
- Together, the above energy transition materials require more than $700 billion of investment through 2050 to balance their supply deficits.
- 75% of these capital investments should be made by 2030 in order to meet demand by 2050, according to the ETC.
| | |
| |
|
THE JP MORGAN FDIC BACKED DERIVATIVES CASINO
From the research of our friends at WallStreetOnParade Pam Martens and Russ Martens: October 7, 2024:
On September 24, the Office of the Comptroller of the Currency (OCC) released its Quarterly Report on Bank Trading and Derivatives Activities for the second quarter of this year. The OCC is the federal regulator of banks that operate across state lines, which are known as “national banks.”
The shorthand for this report should be the “Casino Report.” Increasingly, the report showcases how much dangerous trading activity the brokerage firms on Wall Street have been able to muscle into their federally-insured banking units where the deposits of millions of average Americans reside. Since the repeal of the Glass-Steagall Act in 1999 under the Bill Clinton administration, Wall Street trading firms have been allowed to combine with federally-insured banks – creating an endless series of crises and bailouts.
No bank has been able to blur the lines between a trading casino and a federally-insured bank more aggressively than JPMorgan Chase – and get away with it under the nose of its federal bank regulators. Almost all of this transformation has occurred with Jamie Dimon sitting at the helm of the bank as Chairman and CEO.
According to the FDIC, as of June 30 there were a total of 4,539 federally-insured commercial banks and savings associations in the U.S. According to Table 19 located in the Appendix of the current OCC report, (see partial section below), all commercial banks and savings associations in the U.S. which held derivatives as of June 30, 2024 had trading revenues totaling $15.848 billion. ,Of that sum, JPMorgan Chase Bank NA represented $6.9 billion or 44 percent.
| |
|
Even more striking, JPMorgan Chase Bank’s equity trading revenues (stock trading) inside its federally-insured bank came in at $3.5 billion of the total $5.5 billion in stock trading at all banks and savings associations, or a whopping 64 percent of the total.
The Securities and Exchange Commission (SEC), whose job it is to provide regulatory oversight of stock trading in the U.S., is not allowed to peek inside federally-insured banks to see what is going on with stock trading. This appears to be a feature, not a bug, of the megabanks’ refashioning of the landscape of Wall Street.
Of equal concern, as we reported recently, federally-insured banks are not allowed to employ licensed traders. According to the Wall Street self-regulator, FINRA, only broker-dealers are allowed to employ licensed traders and only licensed supervisors are allowed to oversee this trading. (For what happens when trader licensing rules are subverted, see our report: Jamie Dimon’s Top Women and Their Missing Licenses.)
JPMorgan Chase Bank NA also appears to have a stranglehold on trading gold and silver contracts inside its bank. Table 21 in the latest OCC report shows that all commercial banks, savings associations and trust companies with derivatives account for $483 billion in precious metals contracts. Of that sum, JPMorgan Chase Bank NA holds $281.7 billion, or 58 percent.
| |
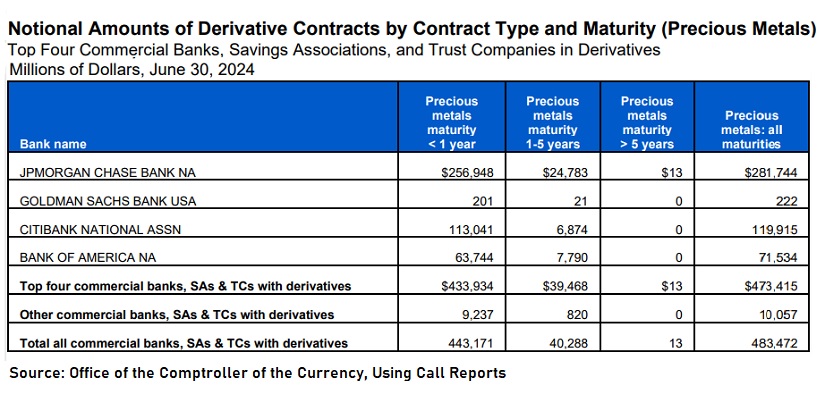 | |
That concentration of activity by one bank in precious metals is being tolerated by federal regulators, despite the fact that the U.S. Justice Department criminally charged JPMorgan Chase just four years ago with engaging in “tens of thousands of episodes of unlawful trading in the markets for precious metals futures contracts….” The bank admitted to the charges.
According to the Justice Department, the rigging occurred for more than eight years, from March 2008 to August 2016. The Justice Department wrote that traders at JPMorgan Chase:
“…knowingly and intentionally placed orders to buy and sell precious metals futures contracts with the intent to cancel those orders before execution (‘Deceptive PM [Precious Metals] Orders’), including in an attempt to profit by deceiving other market participants through false and fraudulent pretenses and representations concerning the existence of genuine supply and demand for precious metals futures contracts. By placing Deceptive PM Orders, the Subject PM Traders intended to inject false and misleading information about the genuine supply and demand for precious metals futures contracts into the markets, and to deceive other participants in those markets into believing something untrue, namely that the visible order book accurately reflected market-based forces of supply and demand. This false and misleading information was intended to, and at times did, trick other market participants, including competitor financial institutions and proprietary traders, into reacting to the apparent change and imbalance in supply and demand by buying and selling precious metals futures contracts at quantities, prices, and times that they otherwise likely would not have traded.”
| |
|
GLOBAL ECONOMIC INDICATORS:
What This Week's Key Global Economic Releases Tell Us
| |
|
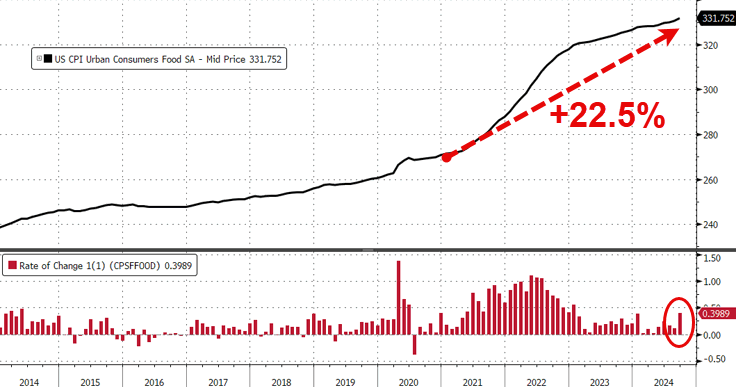
CONSUMER PRICE INDEX (CPI)
For the 52nd straight month, core consumer prices rose on a M-o-M basis in September (+0.3% MoM - hotter than the 0.2% expected) - the strongest since March. That left Core CPI YoY up 3.3%, hotter than the 3.2% expected.
HEADLINE CPI printed hotter than expected (+0.2% MoM vs +0.1% MoM exp), with the YoY CPI up 2.4% (hotter than the 2.3% expected but lowest since Feb 2021)...
Overall, headline consumer prices are up over 20% (5.1% p.a.) since the Biden-Harris admin took over, which compares to around 8% (1.97% p.a) during Trump's first term.
CORE SERVICES WITH FOOD: Costs surged in September.
SUPERCORE CPI: Increased on a Y-o-Y basis to +4.6%...
- A surge in Transportation Services costs (record high auto insurance) and Medical Care Supplies lifted Super Core...
- The silver lining is that shelter inflation continues to slow...
- The cost of auto insurance is up 56% since Biden and Harris took over.
- Food inflation.
- It looks like all aisles in the grocery store were more expensive in the month: five of the six major grocery store food group indexes increased.
- The index for meats, poultry, fish, and eggs rose 0.8% in September; the eggs index jumped 8.4%. The fruits and vegetables index increased 0.9% over the month, following a 0.2-percent decline in August.
- Jewelry and watches saw a 5.2% increase on the month - the biggest-ever MoM jump.
Real wages are down since the start of the Biden-Harris administration...
|  | |
|
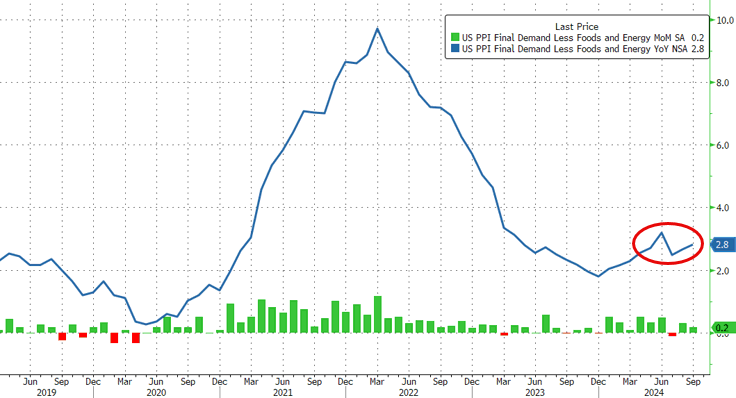
PRODUCER PRICE INDEX (PPI)
HEADLINE PPI
- Unchanged M-o-M (cooler than the +0.1% expected)
- Up 1.8% Y-o-Y (hotter than the +1.6% exp)...
- Down from the upwardly revised 1.9%
Energy prices weighed the PPI down (likely not to last) as Food + Services surged.
FINAL DEMAND GOODS
The index for final demand goods decreased 0.2 percent in September following no change in August. The decline can be traced to a 2.7 percent drop in prices for final demand energy. In contrast, the indexes for final demand Foods and for final demand goods less foods and energy increased 1.0 percent and 0.2 percent, respectively.
Product detail:
- Leading the September decline in prices for final demand goods, the index for gasoline decreased 5.6 percent.
- Prices for diesel fuel, jet fuel, chicken eggs, home heating oil, and plastic resins and materials also fell.
- Conversely, the index for processed poultry jumped 8.8 percent.
- Prices for electric power and for motor vehicles also moved higher.
FINAL DEMAND SERVICES
The index for final demand services moved up 0.2 percent in September after rising 0.4 percent in August. Leading the broad-based increase in September, prices for final demand services less trade, transportation, and warehousing advanced 0.1 percent. The indexes for final demand trade services and for final demand transportation and warehousing services also rose, 0.2 percent and 0.3 percent, respectively. (Trade indexes measure changes in margins received by wholesalers and retailers.)
Product detail:
- A 3.0-percent increase in the index for deposit services (partial) was a major factor in the September advance in prices for final demand services.
- The indexes for machinery and vehicle wholesaling, furniture retailing, desktop and portable device application, software publishing, apparel wholesaling, and airline passenger services also rose.
- Conversely, margins for professional and commercial equipment wholesaling fell 6.3 percent.
- The indexes for securities brokerage, dealing, investment advice and related services, and for consumer loans (partial) also moved lower.
CORE PPI
Core PPI jumped to +2.8% YoY (hotter than the 2.6% exp) as PPI ex-food-and-energy rose 0.2% MoM as expected...
On a YoY basis, Services costs are accelerating...
The deflationary drag of Energy prices won't last. It's a long way from The Fed's mandated 2% and it's going the wrong way!
| |
|
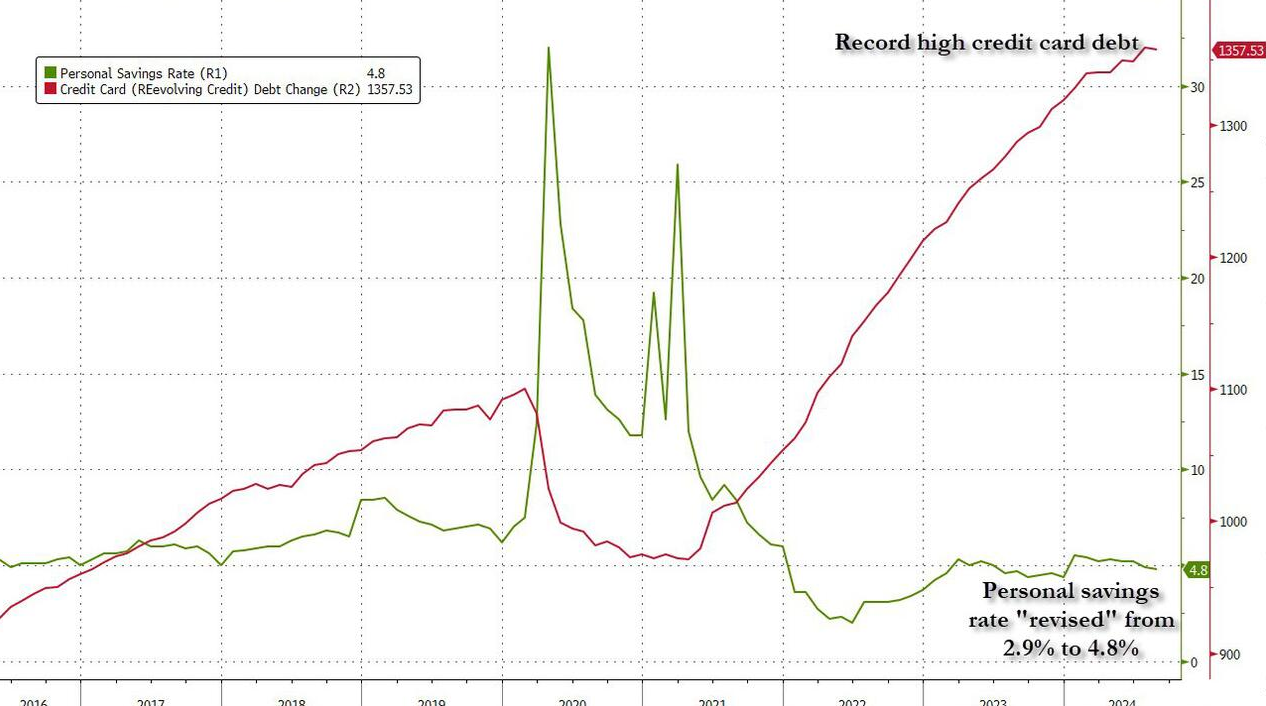
CONSUMER CREDIT - Hits a 'Brick Wall'!
The Fed reported that in August, total consumer credit growth plunged by more than half to just $8.9 billion, below the $12 billion estimate.
While non-revolving credit, which is far less volatile and much more stable, grew $10.3 billion, a big drop from the previous month's $16 billion.
Though still the second highest monthly increase of 2024, the punchline is that the much more consumer-outlook sensitive revolving credit reversed all of its July surge and then some, as August saw the biggest revolving credit drop since the covid crash!
What is especially notable is that just days before the Fed's first rate cut since the covid crash, where Powell telegraphed an econ panic with his "jumbo" rate cut, the average rate on all credit cards in the US just hit a new high of 21.76%, up from 21.51%.
| |
|
GLOBAL
WHAT DOES YOUR SCAN OF THE DATA BELOW TELL YOU? - THE MEDIA AVOIDS BAD NEWS!
We present the data in a way you can quickly see what is happening.
THIS WEEK WE SAW
Exp. =Expectations, Prev. =Previous
| |
|
UNITED STATES
- US International Trade (USD)(Aug) -70.4B vs. Exp. -70.6B (Prev. -78.8B, Rev. -78.9B)
- US Goods Trade Balance (R)(USD)(Aug) -94.22B (Prev. -94.26B)
- US CPI YY NSA (Sep) 2.4% vs. Exp. 2.3% (Prev. 2.5%)
- US Core CPI YY NSA (Sep) 3.3% vs. Exp. 3.2% (Prev. 3.2%)
- US Initial Jobless Claims w/e 258.0k vs. Exp. 230.0k (Prev. 225.0k)
- US Continued Jobless Claims w/e 1.861M vs. Exp. 1.83M (Prev. 1.826M, Rev. 1.819M)
CHINA
- Chinese FX Reserves (USD)(Sep) 3.316tln vs. Exp. 3.304tln (Prev. 3.288tln)
- China Gold Reserves (Oz)(Sep) 72.8mln (prev. 72.8mln)
JAPAN
- Japanese All Household Spending MM (Aug) 2.0% vs. Exp. 0.5% (Prev. -1.7%)
- Japanese All Household Spending YY (Aug) -1.9% vs. Exp. -2.6% (Prev. 0.1%)
- Japanese Overall Labour Cash Earnings (Aug) 3.0% vs. Exp. 3.0% (Prev. 3.6%, Rev. 3.4%)
- Japanese Corporate Goods Price MM (Sep) 0.0% vs. Exp. -0.3% (Prev. -0.2%); YY 2.8% vs. Exp. 2.3% (Prev. 2.5%, Rev. 2.6%)
UK
- UK Halifax House Prices MM (Sep) 0.3% vs. Exp. 0.4% (Prev. 0.3%)
- EU Sentix Index (Oct) -13.8 vs. Exp. -15.9 (Prev. -15.4)
- UK BBA Mortgage Rate (Sep) 7.69% (Prev. 7.83%)
- UK BRC Retail Sales YY (Sep) 1.7% (Prev. 0.8%)
- UK BRC Total Sales YY (Sep) 2.0% (Prev. 1.0%)
- UK RICS Housing Survey (Sep) 11.0 vs. Exp. 4.0 (Prev. 1.0)
- UK RICS Housing Survey (Sep) 11.0 vs. Exp. 4.0 (Prev. 1.0)
- UK GDP Estimate MM (Aug) 0.2% vs. Exp. 0.2% (Prev. 0.0%); YY 1.0% vs. Exp. 1.4% (Prev. 1.2%); 3M/3M (Aug) 0.2% vs. Exp. 0.3% (Prev. 0.5%)
| | |
|
EU
- EU Retail Sales MM (Aug) 0.2% vs. Exp. 0.2% (Prev. 0.1%); Retail Sales YY (Aug) 0.8% vs. Exp. 1.0% (Prev. -0.1%)
- EU Sentix Index (Oct) -13.8 vs. Exp. -15.9 (Prev. -15.4)
GERMANY
- German Industrial Orders MM (Aug) -5.8% vs. Exp. -2.0% (Prev. 2.9%)
- German Industrial Output MM (Aug) 2.9% vs. Exp. 0.8% (Prev. -2.4%)
- German Trade Balance, EUR, SA (Aug) 22.5B vs. Exp. 18.4B (Prev. 16.8B); Exports MM 1.3% vs. Exp. -1.0% (Prev. 1.7%), Imports MM -3.4% vs. Exp. -2.5% (Prev. 5.4%).
- German Retail Sales MM Real (Aug) 1.6% vs. Exp. 0.1% (Prev. -1.2%); YY 2.1% (Prev. -1.7%)
- German CPI Final YY (Sep) 1.6% vs. Exp. 1.6% (Prev. 1.6%). FSO: "In particular, the renewed price declines for energy dampened the inflation rate in September 2024 more than in the previous months. In contrast, the continued above-average price increases for services had an inflationary effect,"
ITALY
- Italian Industrial Output MM SA (Aug) 0.1% vs. Exp. 0.2% (Prev. -0.9%, Rev. -1.0%); Industrial Output YY WDA (Aug) -3.2% (Prev. -3.3%)
SWEDEN
- Swedish Flash CPIF (Sep) +1.1% Y/Y; CPIF-XE (Sep) 2.0% Y/Y; CPI (Sep) +1.6% Y/Y, according to the stats office
NORWAY
- Norwegian Core Inflation YY (Sep) 3.1% vs. Exp. 3.3% (Prev. 3.2%); CPI YY 3.0% vs. Exp. 3.2% (Prev. 2.6%)
AUSTRALIA
- Australian Westpac Consumer Sentiment Index (Oct) 89.8 (Prev. 84.6)
- Australian NAB Business Confidence (Sep) -2.0 (Prev. -4.0)
- Australian NAB Business Conditions (Sep) 7.0 (Prev. 3.0)
NEW ZEALAND
- New Zealand ANZ Business Confidence (Sep) 60.9% (Prev. 50.6%)
| |
CURRENT MARKET PERSPECTIVE | |
|
CPI, PPI & BANKS ALL COME IN HOT
MARKETS SURGE ON RISING YIELDS, DOLLAR & VIX???
Click All Charts to Enlarge
| 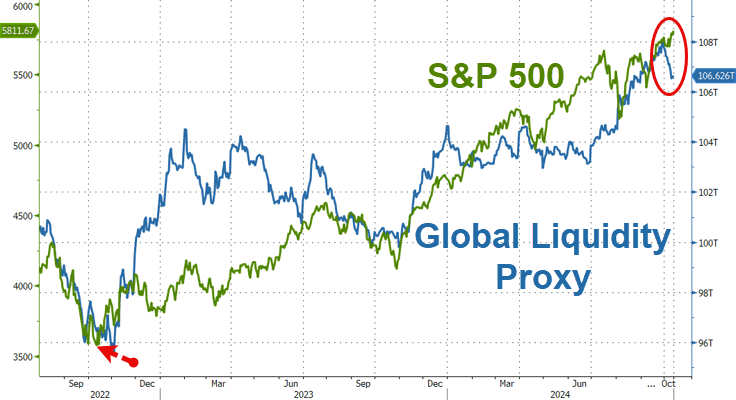 | |
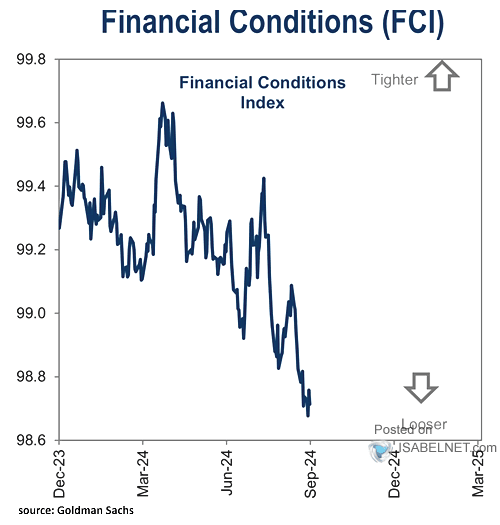
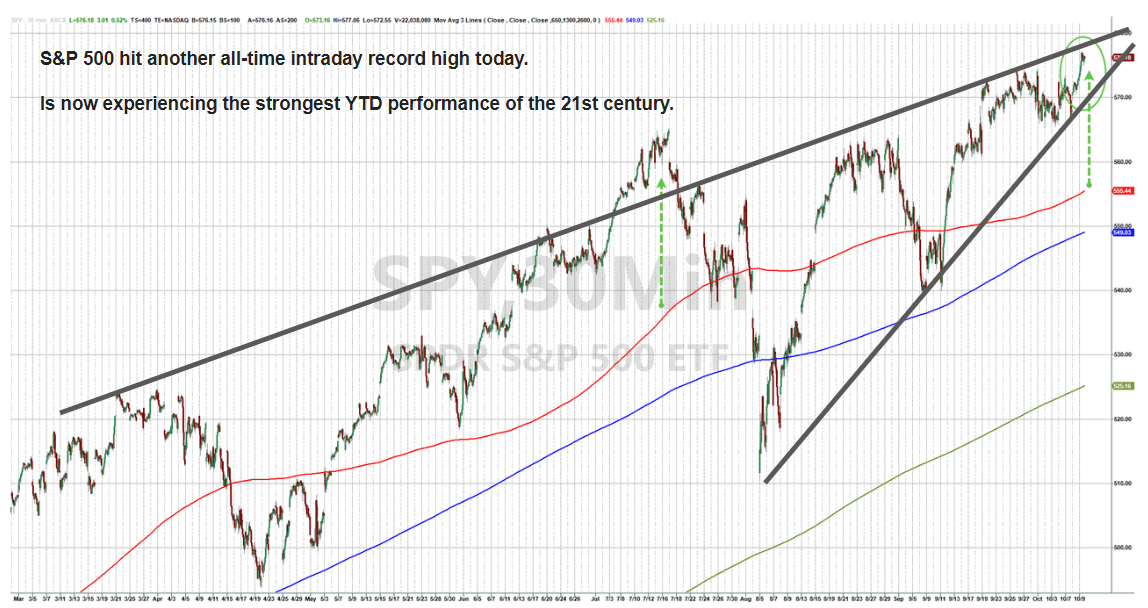
EXCESS LIQUIDITY & LOOSE FINANCIAL CONDITIONS INDEX: This weekend represents the two year anniversary from the bear market lows. The S&P is up 66% from the lows in October 2021, helped by an endless supply of liquidity from global central planners. Friday saw the 45th all-time-high of the year, but none of the prior 44 have occurred alongside this elevated level of volatility. This will be the first week of the year where the VIX has closed above 20 every day, while yields and the dollar rose.
NOTE: The above chart is a "Proxy". It works well in identifying trends. Short term moves have to be viewed carefully as a trend in change. The red circle in fact is such an incidence. Tomorrow's Newsletter will show a more accurate picture, which illustrates Global Liquidity just hit a historic high of $107 Trillion.
QUESTION: So what is up when the S&P 500 hits yet another all-time intraday record high and is now experiencing the strongest YTD performance of the 21st century?
ANSWER: EXCESS GLOBAL LIQUIDITY & EXTREMELY LOOSE FINANCIAL CONDITIONS.
BUT WHY?:SOMETHING IS SERIOUSLY WRONG SOMEWHERE (CHINA?) AND THE CENTRAL BANKS KNOW IT!
| |
|
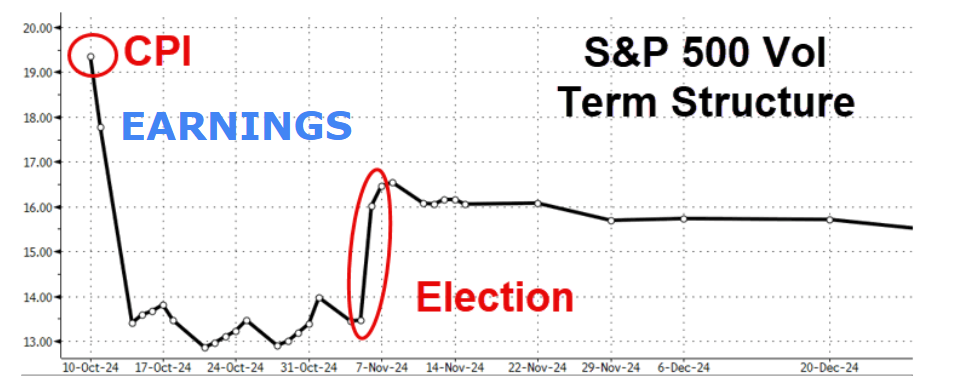
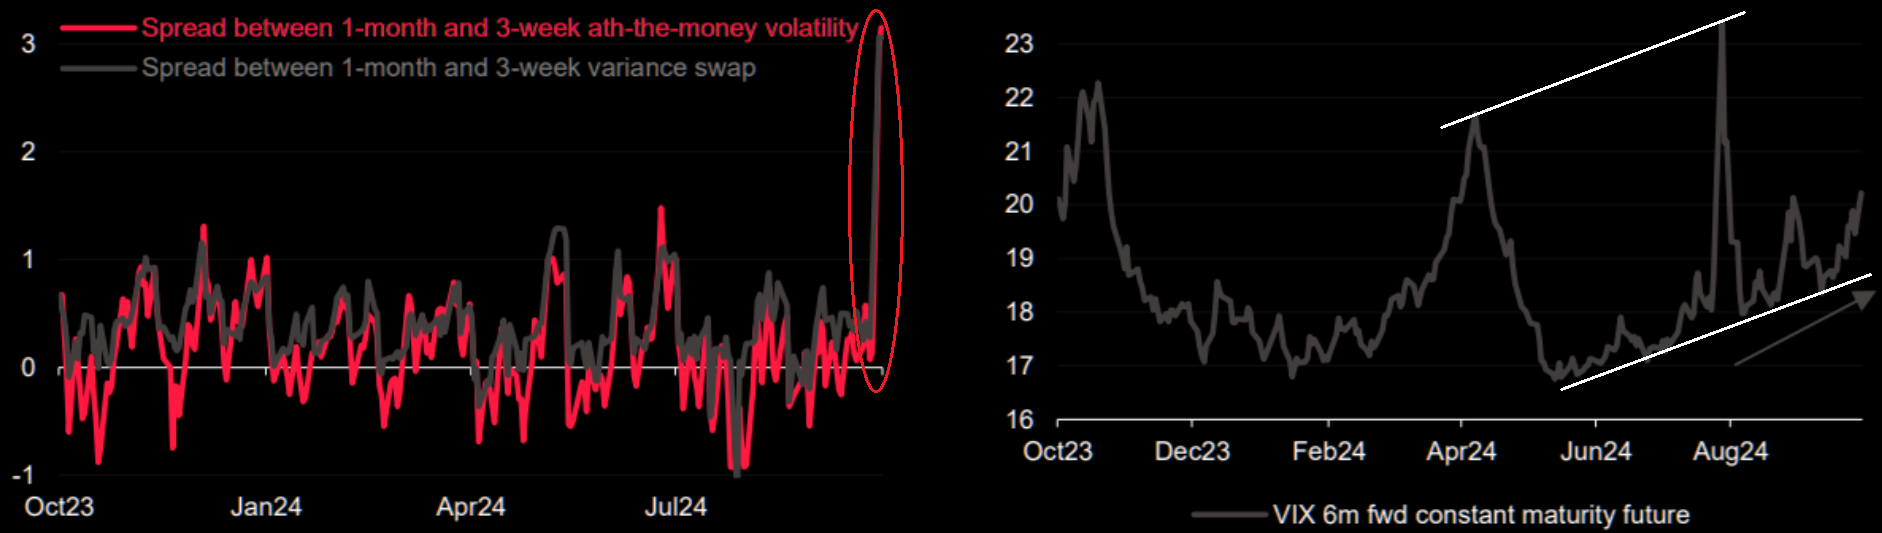
SENTIMENT
The S&P 500 Volatility Term Structure additionally echos some significant short term concerns (chart right) about the upcoming Q3 Earnings Season.
Bond volatility (MOVE Index) is riising; which is lifting Equity Volatility (VIX); which is pushing the change in Volatility (VVIX). These all make options and hedging more expensive (chart).
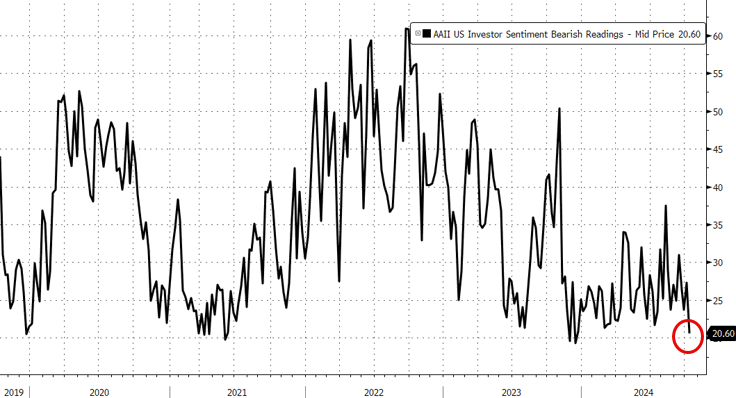
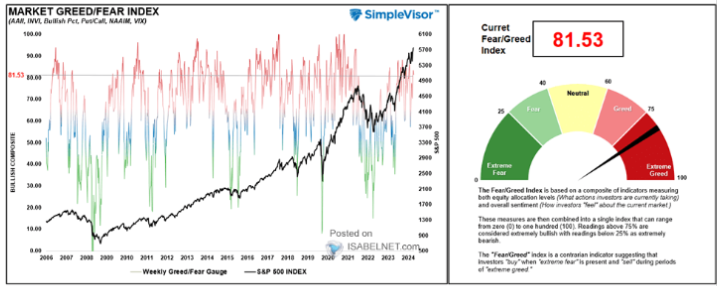
THERE ARE NO BEARS LEFT!
Almost Everyone Is Now On The Same Side Of The Boat.
| |
|
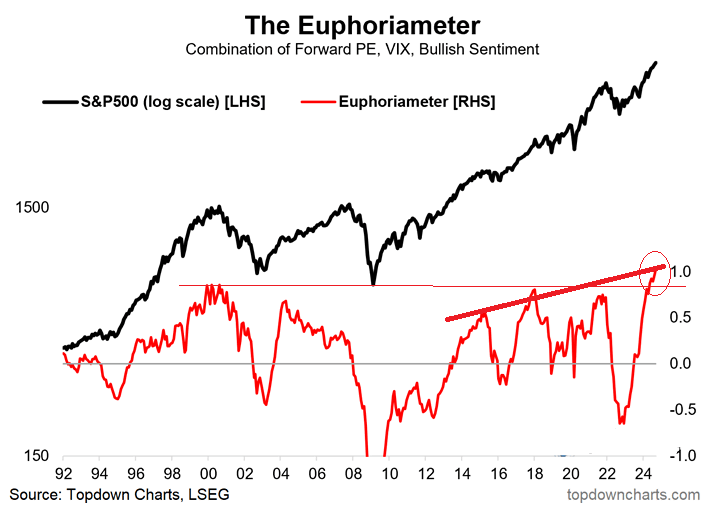
Meanwhile, now that everyone is onboard the equity train (see last week's report's detail), the Bullish sentiment among investors in the U.S. stock market continues to be strong, hitting new all-time highs as measured by the "Euphoria Meter".
The Euphoria Meter measures: a combination of:
- Forward PE
- VIX
- Bullish Sentiment
CHART BELOW
Greed/Fear index continues to stay elevated!
| |
|
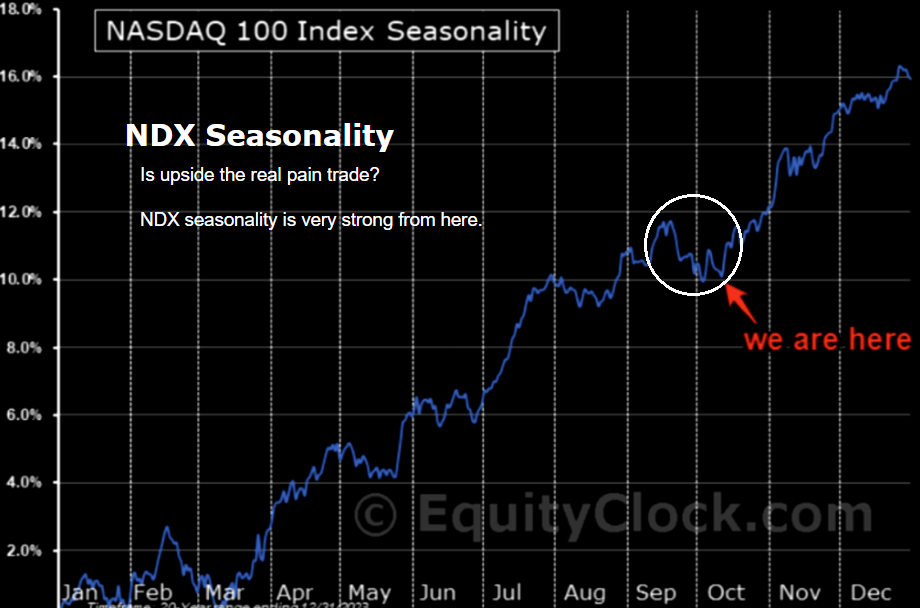
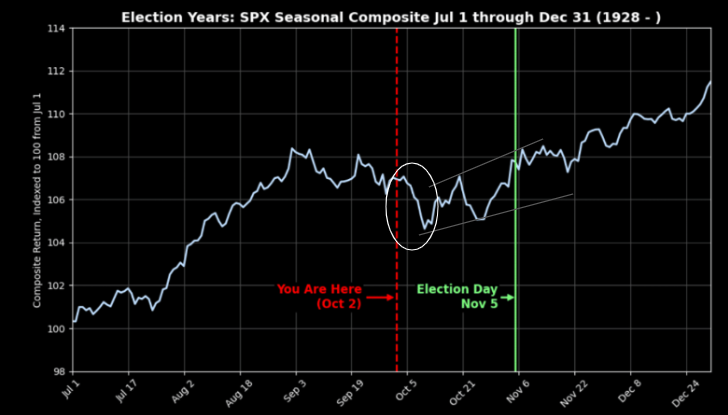
SEASONALITY - IF IT REPEATS WITH THIS AMOUNT OF "EXCESS LIQUIDITY"?
CHART RIGHT: SPX - The historical election performance of the SPX suggests our expected near term corrective / consolidation is likely with a follow on Year End stock run-up.
CHART LOWER RIGHT:The NDX seasonality has a similar but slightly different performance profile.
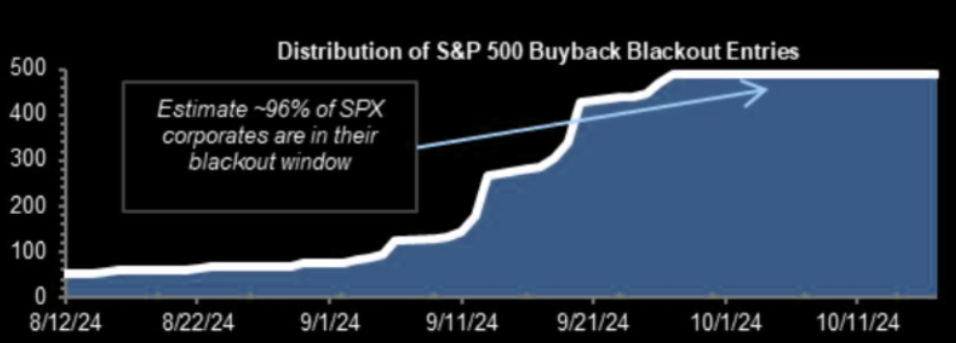
CHART BELOW: 96% of stocks are now in their blackout window.
| |
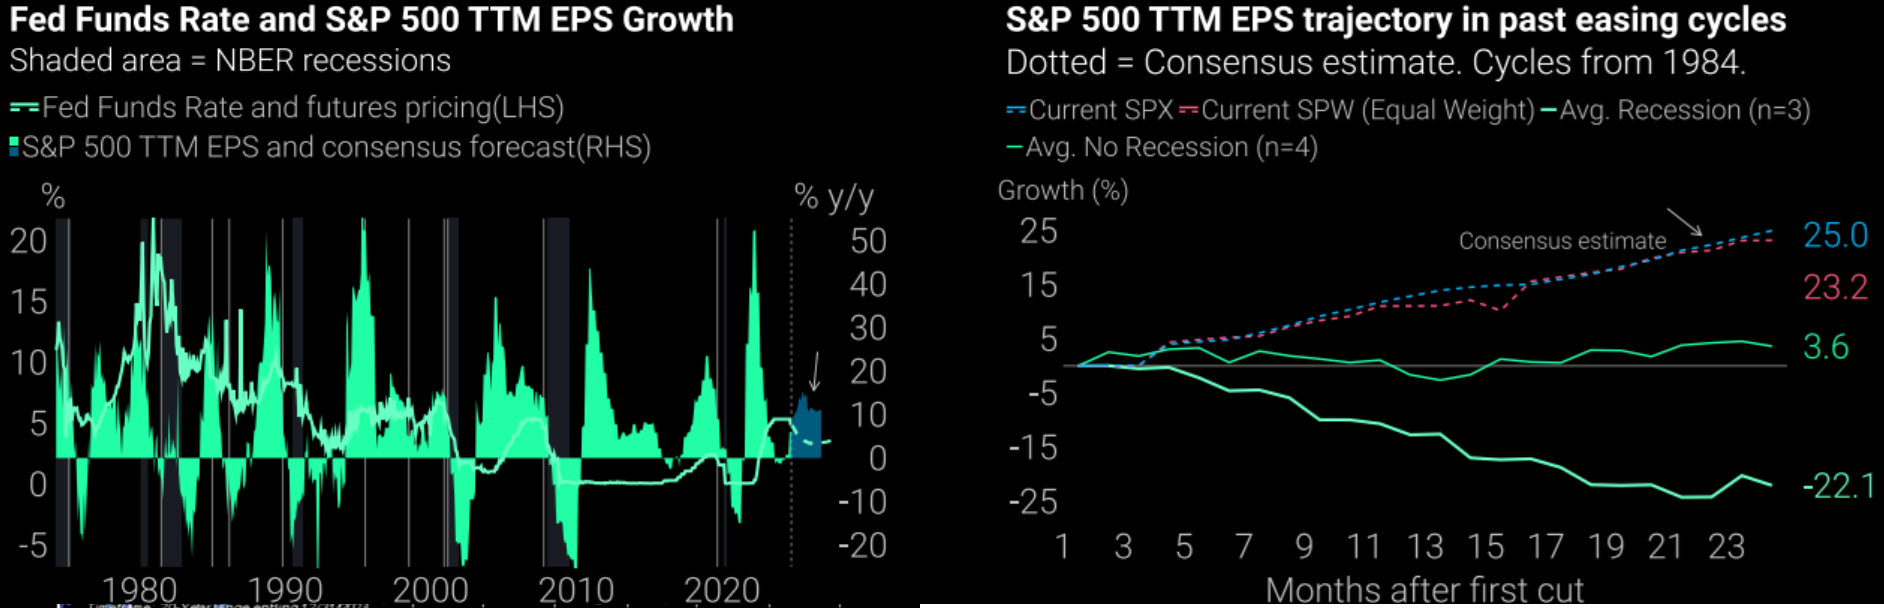
CHART BELOW: Risk On Mix
Above trend growth in the US, rising EPS and rate cuts are an attractive mix for risk assets, despite high valuations.
"Fed cutting into strong EPS recovery is bullish... EPS trajectory stronger than in past soft landings".
T.S. Lombard
| |
|
|
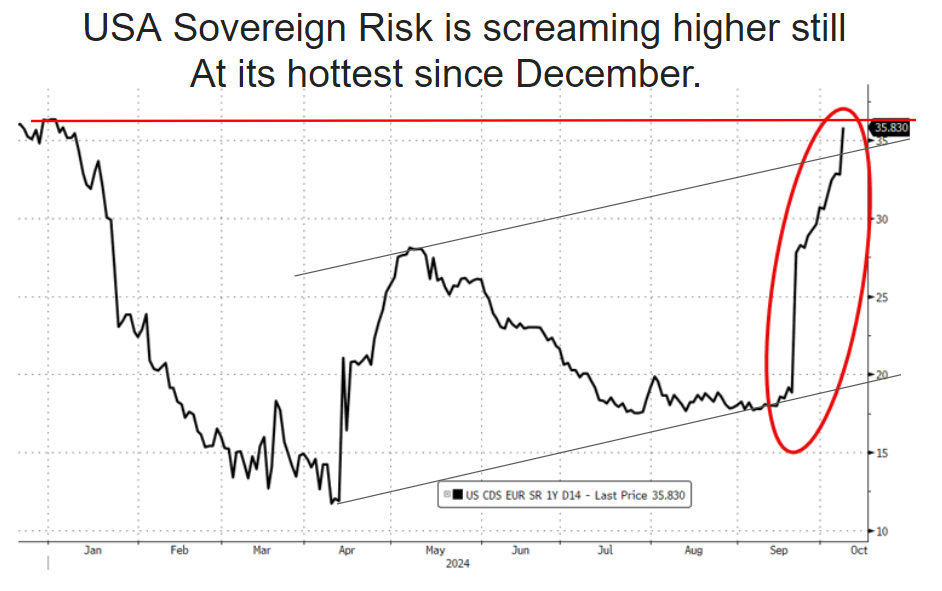
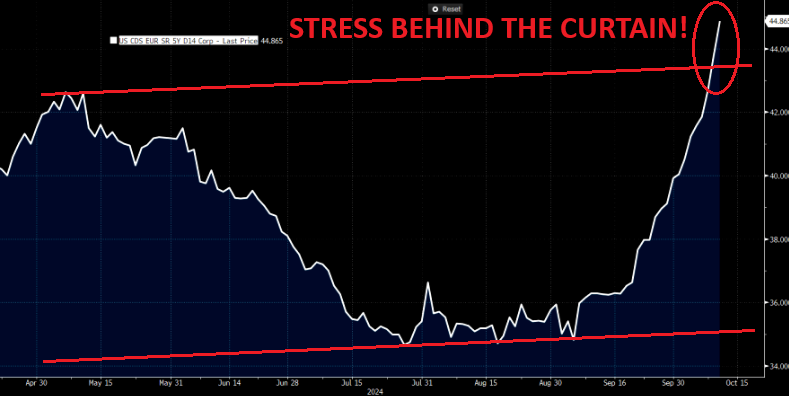
A FLIGHT TO SAFETY UNDERWAY? Bond Yields and the US$ just continue to rise!. Normally when yields rise and the dollar surges, (especially when both occur together), it weighs on equities since a stronger dollar makes US equities more expensive while higher yields are neither good for earnings nor evaluations.
Something is scaring the markets behind the scene as shown by 1 Year Credit Default Swaps (CDS)!
CHART RIGHT
... and the US 5 Year Credit Default Swap (CDS).
CHART BELOW: Some of this has to do with the US elections, but even longer dated tenors have picked up substantially. GS notes that this will be the first week of the year where the VIX has closed above 20 every day.
| |
|
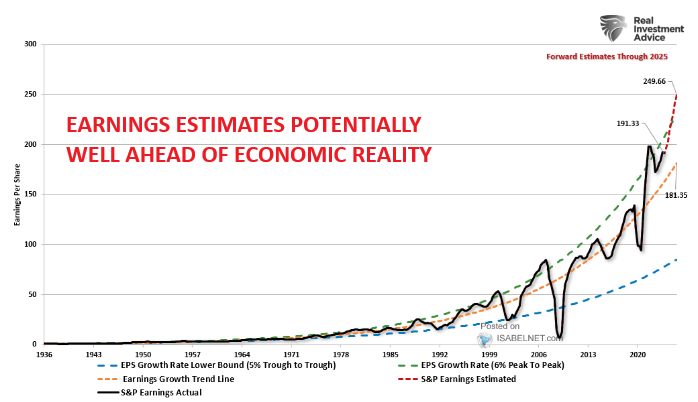
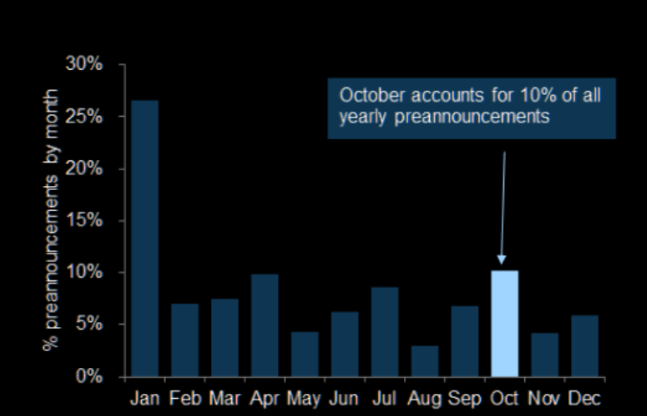
The projected earnings growth for 2025 exceeds historical norms, indicating a sense of optimism. However, there are potential risks if these estimates are not met.
REAL STOCK MARKET RISK in this earnings season the disappoint is likely to be negative earnings surprises.
CHART RIGHT: October accounts for 10% of all yearly preannouncements. This is the earning season where companies announce that their Year end "Hockey Stick" will disappoint.
This is also the season where any weakness seen in 2025 is taken out of the forecast by CEOs.
| |
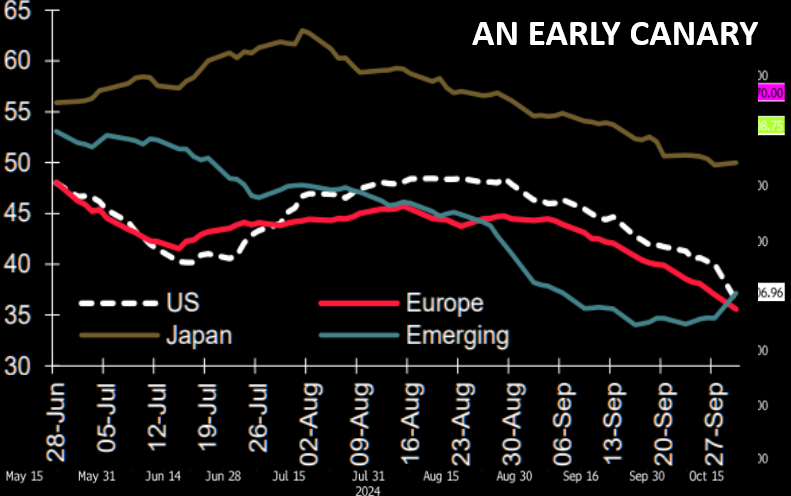
EARNINGS MOMENTUM: This low is concerning for the Intermediate outlook. It is an early Canary for 2025, since it has been extraordinary Earnings Growth (along with Corporate Buybacks) that has ben propelling the equity market. | |
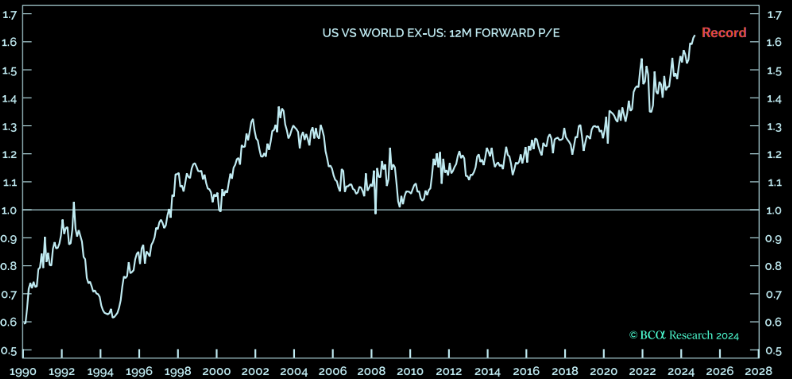
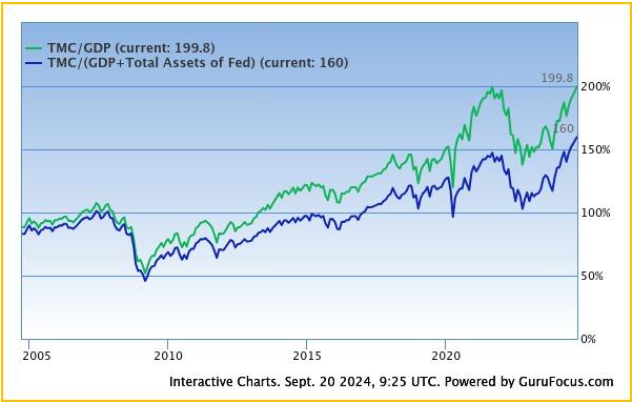
Stocks have NEVER been more expensive relative to the economy.
Total US market cap back up to 200% of GDP.
"43% of S&P 500 market cap now under FTC/DoJ antitrust investigation".
| |
|
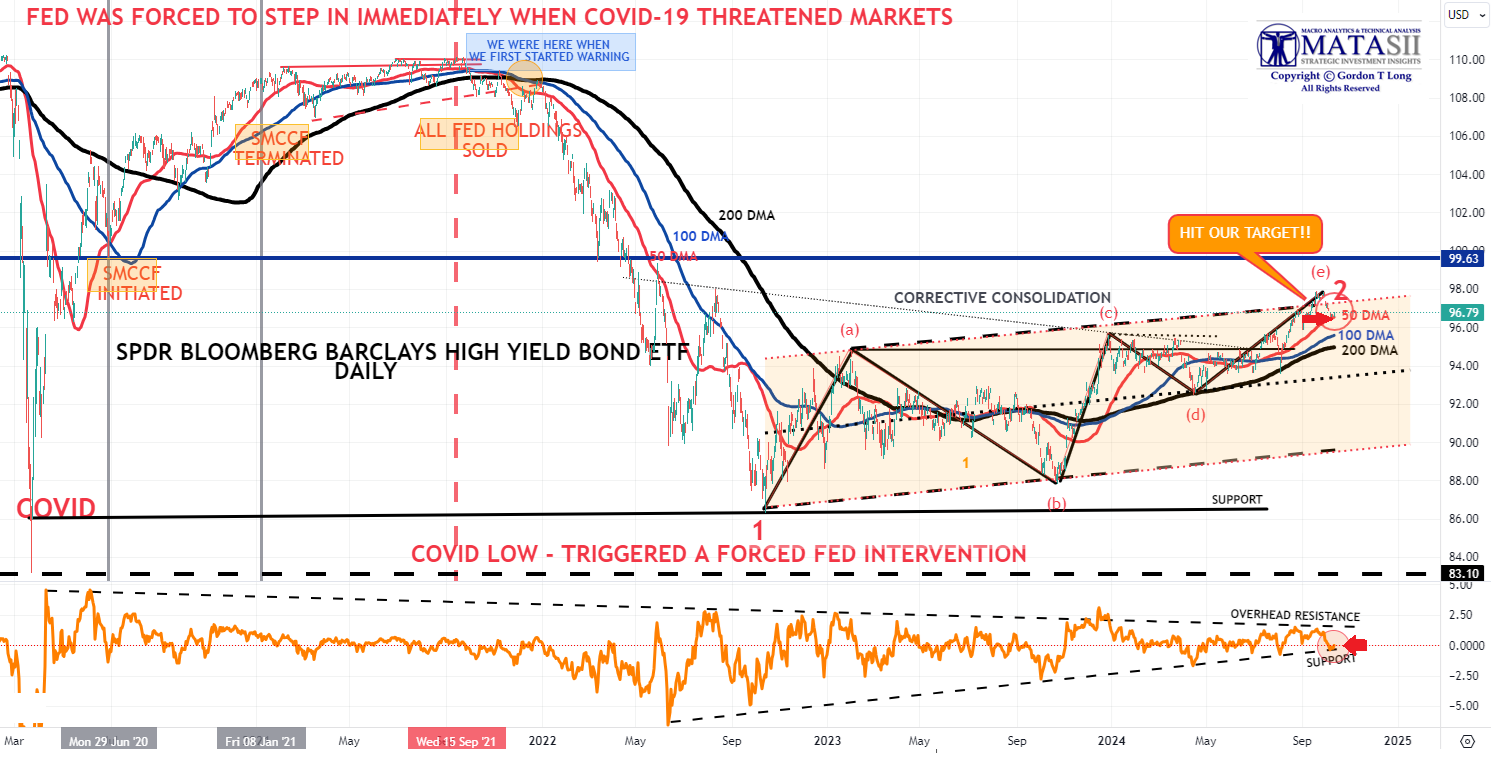
CREDIT ALWAYS LEADS! - We Have Our Target Met
HY Credit, as represented by the Bloombergs High Yield Bond ETF (JNK), has reached our target. All indications are that the corrective consolidation wave since Covid (and the buying at the time of Corporate Bonds by the Fed) have now ended.
With the Fed initiating the process of lowering the Fed Funds Rate, we should soon expect HY spreads to begin widening to reflect the reason the Fed is lowering rates - a concern for slowing economic growth, potential increasing unemployment levels and the longer term impact of elevated rates hitting! All this leads credence to a Recession being ahead of whatever degree (soft or hard)?
| |
|
YOUR DESKTOP / TABLET / PHONE ANNOTATED CHART
Macro Analytics Chart Above: SUBSCRIBER LINK
| |
|
2 - TECHNICAL ANALYSIS.
WE ARE VERY CLOSE TO A POTENTIAL MINOR CORRECTIVE / CONSOLIDATION
BEFORE A YEAR-END STOCK RUN-UP.
| |
|
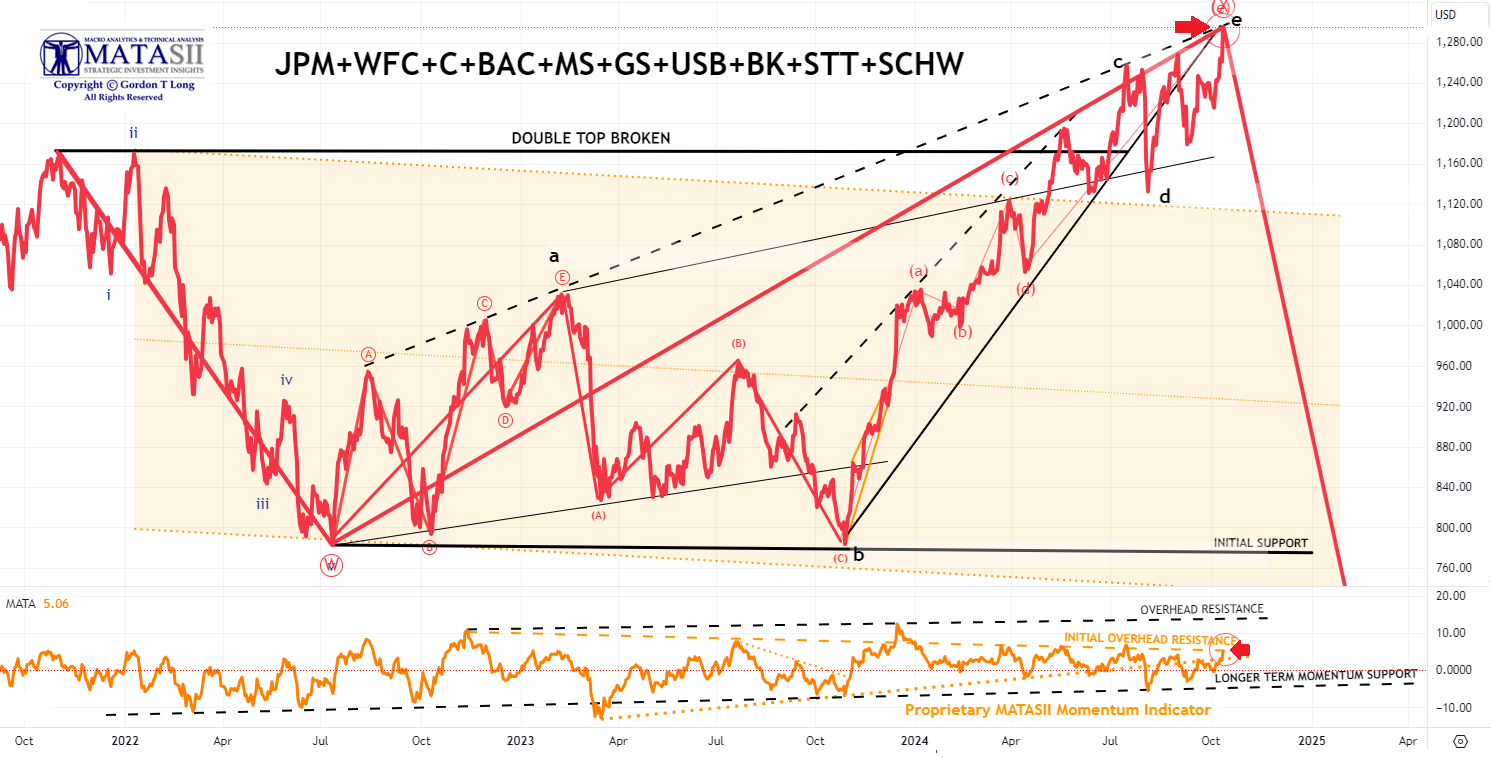
THE MATASII BANK INDEX
- The MATASII Bank Index surged on Q3 Banking results for earnings from JPM (JPM), Wells Fargo (WFC) and Mellon Bank (BK).
- The MATASII Proprietary Momentum Indicator has reached an initial overhead resistance trend line, but is below a higher overhead resistance level (dashed black line), which banks may see if bank earnings continue to report strong results!
| |
|
YOUR DESKTOP / TABLET / PHONE ANNOTATED CHART
Macro Analytics Chart Above: SUBSCRIBER LINK
| |
|
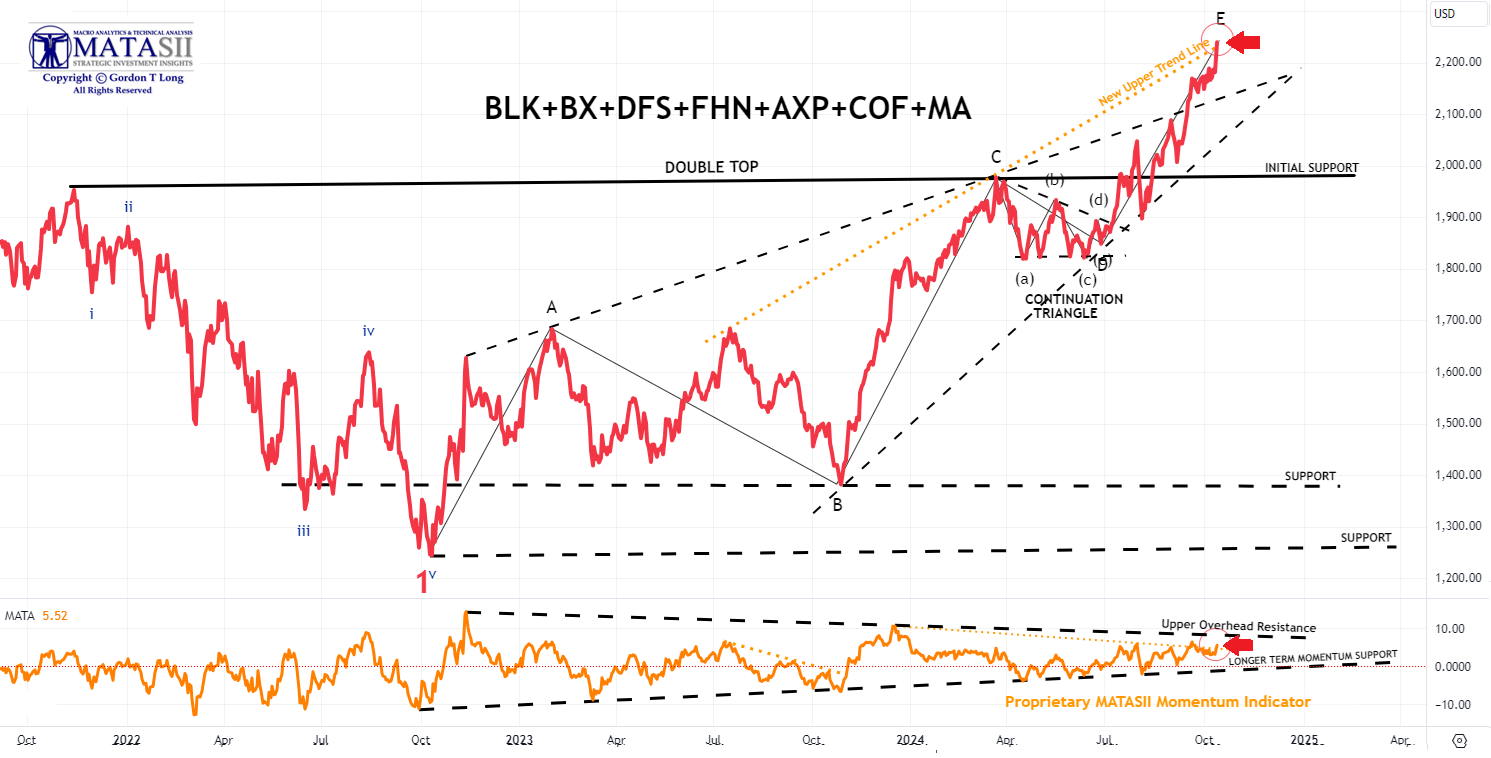
THE MATASII FINANCIAL INDEX
- The MATASII Financial Index surged to new highs with the earnings report of Blackrock (BLK), which surpassed expectations on the top and bottom line while reporting a record high AUM and a quarterly record for net inflows.
- The MATASII Proprietary Momentum Indicator, pushed through an initial overhead resistance trend line and appears to now be stretching for an upper trend line (dashed black line), if reported earnings for financials continues to be strong.
| |
|
YOUR DESKTOP / TABLET / PHONE ANNOTATED CHART
Macro Analytics Chart Above: SUBSCRIBER LINK
| |
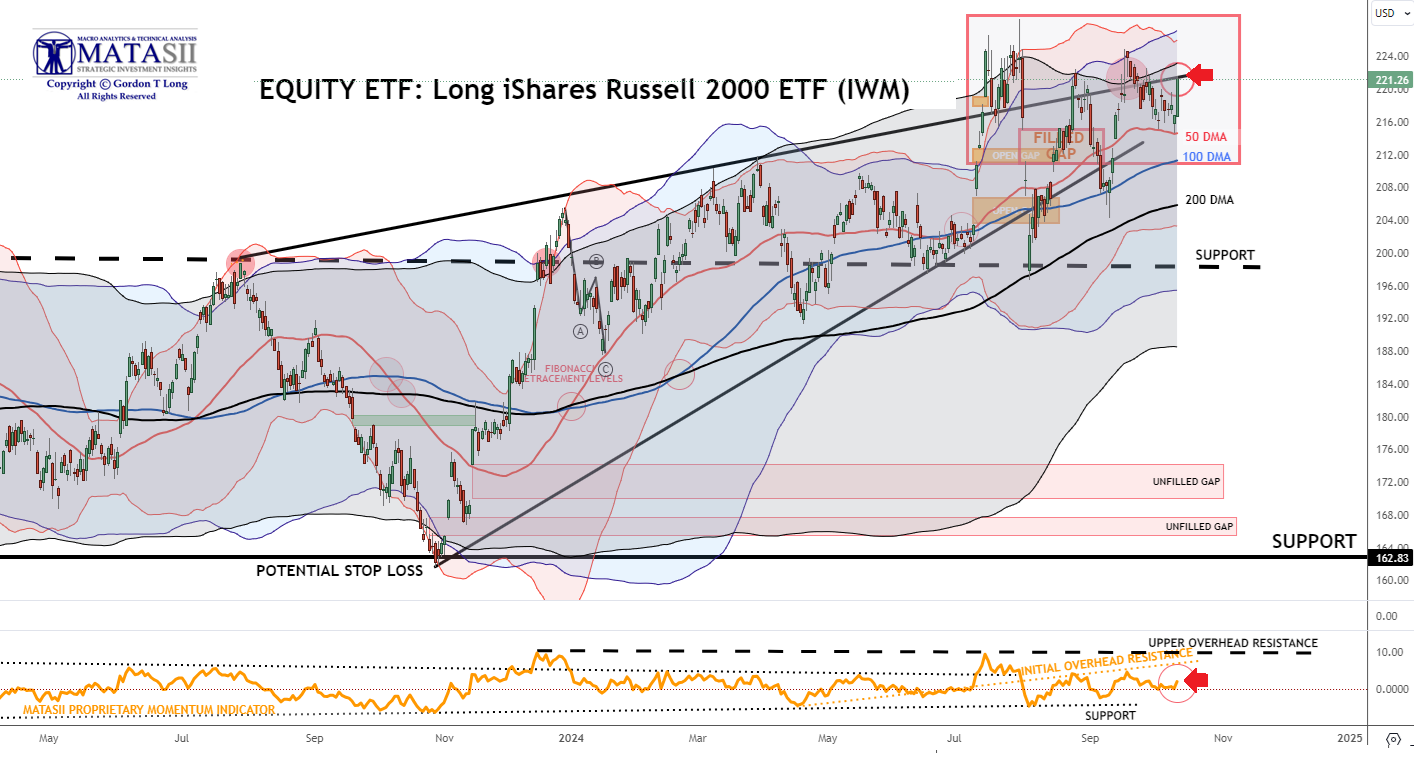
IWM - LONG iShare Russell 2000 ETF - Daily
- The IWM - LONG iShare Russell 2000 ETF exploded higher on Friday with the Russell 2000 notching a 2.1% increase.
- The IWM reached its upper rising wedge trend channel (sold black line).
| |
|
YOUR DESKTOP / TABLET / PHONE ANNOTATED CHART
Macro Analytics Chart Above: SUBSCRIBER LINK
| |
|
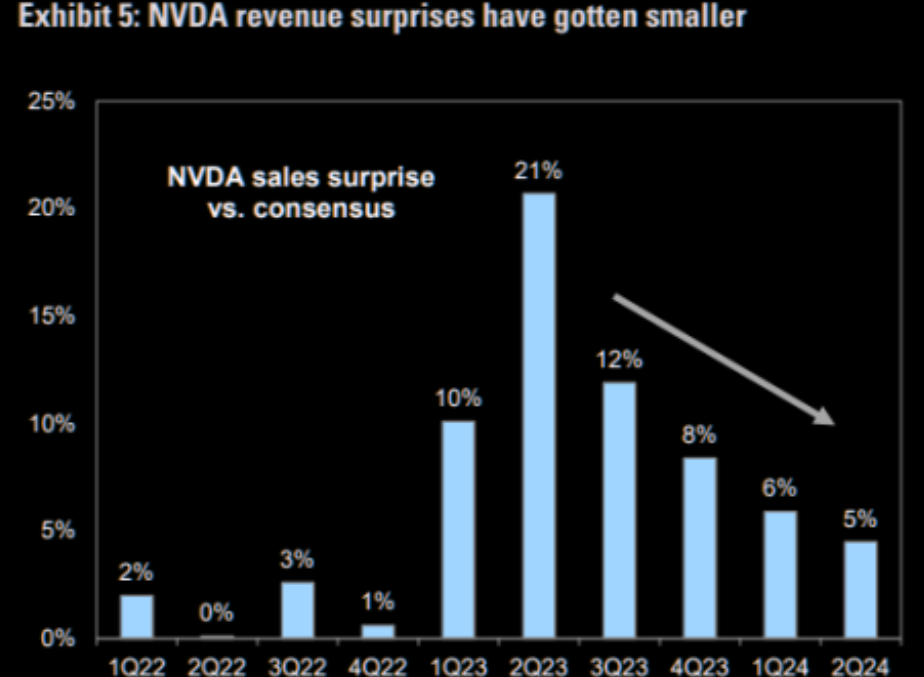
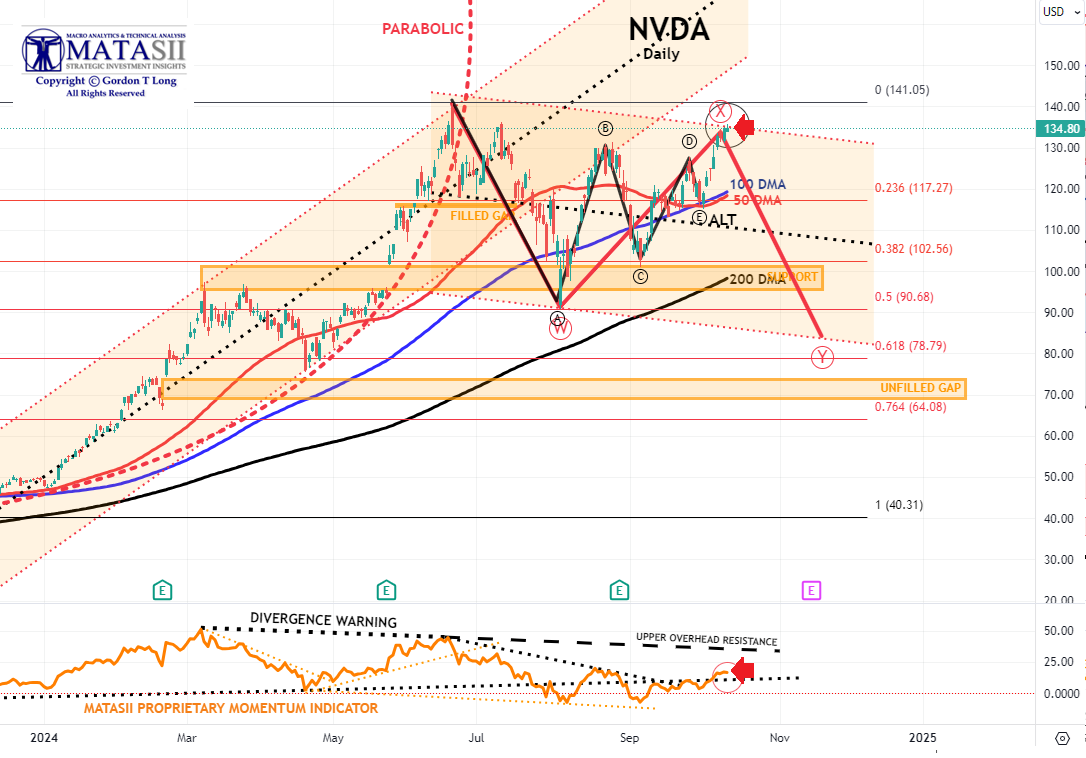
CHART RIGHT: The Phase 2 trading of Nvidia will mature as earnings growth, rather than valuation expansion, driving prices higher.
Today's Note:
- NVDA has strengthened this week with an announcement of a significant new order. The stock surged on the announcement and pushed its upper channel boundary higher.
- We now have an ALTERNATIVE ABCDE Corrective count (shown in black), which suggests the possibility of a significant breakout higher in Nvidia.
- The 50 DMA appears about to cross above the 100 DMA - a Bullish signal.
- Meanwhile the MATASII Proprietary Momentum Indicator (lower panel) has nothing its way until it reaches the upper overhead resistance level (dotted black lines).
Longer Term Note:
- The MATASII Proprietary Momentum Indicator (lower pane below) has been signaling that this sell-down was coming for some time now.
- Divergence is normally seen as a warning to the downside and is still ahead if the Divergence isn't removed by a movement higher in Momentum.
- At some point, the major unfilled gaps (at much lower levels) must be filled. We anticipate a likely test of the 200 DMA in Q4.
- NVDA therefore may no longer become a Short to Intermediate Long Term hold, but rather a position trading stock, as other competitors enter the space, force margins and the earnings growth rate contracts.
| |
|
YOUR DESKTOP / TABLET / PHONE ANNOTATED CHART
Macro Analytics Chart Above: SUBSCRIBER LINK
| |
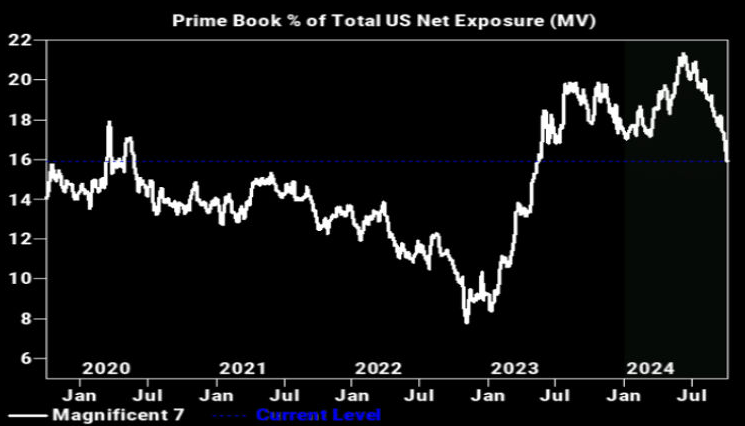
CHART RIGHT: The Hedge Fund Positioning in Mag7 now lowest since May 2023. Mega cap Tech stocks (Mag7) were collectively net sold for a 9th straight week (12 of the last 13). Net length is now at the lowest level since May ‘23.
CONTROL PACKAGE
- APPLE - AAPL - DAILY (CHART LINK)
- AMAZON - AMZN - DAILY (CHART LINK)
- META - META - DAILY (CHART LINK)
- GOOGLE - GOOG - DAILY (CHART LINK)
- NVIDIA - NVDA - DAILY (CHART LINK)
- MICROSOFT - MSFT - DAILY (CHART LINK)
- TESLA - TSLA - DAILY (CHART LINK)
AS GOES NVDA SO GOES THE MAG-7
AS GOES THE MAG-7 SO GOES THE MARKET!
| |
MAGNIFICENT 7
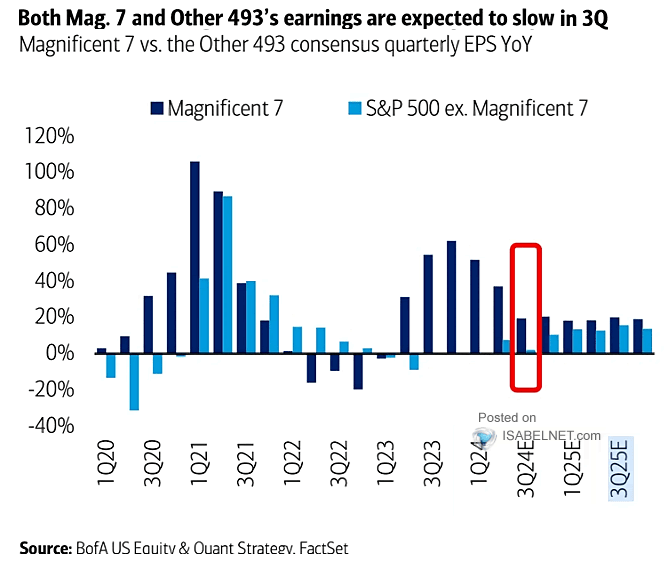
CHART RIGHT: Earnings for both the Magnificent Seven and the Other 493 stocks in the S&P 500 are projected to slow in the third quarter of 2024, reflecting broader economic uncertainties and reduced consumer demand.
CURRENT DAY'S VIEW
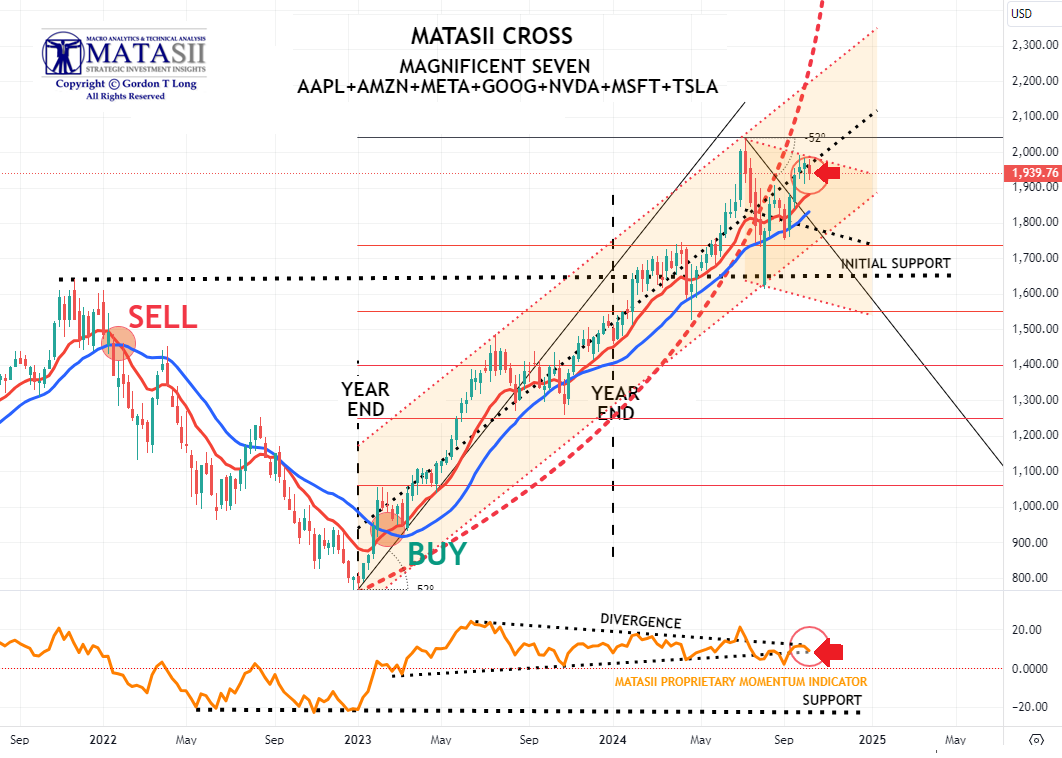
- The Magnificent Seven has again reached the upper boundary of its descending trend channel as well the center line of its longer term rising trend channel before weakening Friday on Tesla's RoboTaxi announcement disappointed investors.
- Meanwhile the MATASII Proprietary Momentum Indicator (lower pane) appears temporarily trapped between two major overhead resistance levels (dotted black lines) with weakness on Friday.
PRIOR OBSERVATIONS - STILL VALID
- As we said in former reports: "A brief counter rally may ensue, but it is highly likely that the much lower Longer term Momentum Support (lower pane black dashed line) will soon be tested".
- Continued caution is advised since major global "Dark Pools" have been identified as presently operating behind the scenes on the Mag-7.
| |
|
YOUR DESKTOP / TABLET / PHONE ANNOTATED CHART
Macro Analytics Chart Above: SUBSCRIBER LINK
| |
"CURRENCY" MARKET (Currency, Gold, Black Gold (Oil) & Bitcoin) | |
|
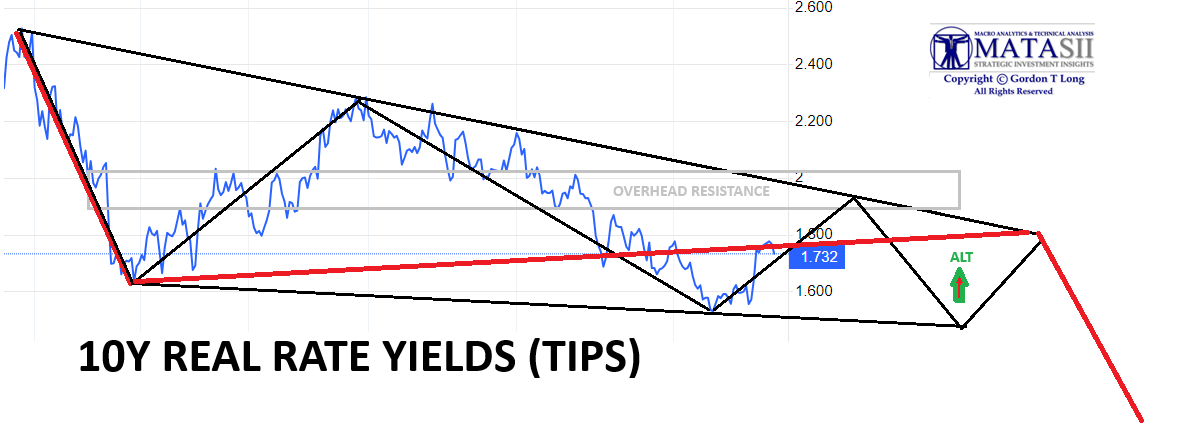
10Y REAL YIELD RATE (TIPS)
Real Rates continue to fall and begin to suggest an ending diagonal pattern is emerging, (shown in the chart to the right - as of close week ending 10/12/24). (LATEST)
NOTE: Gold is suggesting it will be resolved by the red line (chart right) with a fall in real rates (chart lower right) and rising Gold prices.
| |
CONTROL PACKAGE
There are TEN charts we have outlined in prior chart packages, which we will continue to watch closely as a CURRENT Control Set:
-
US DOLLAR -DXY - MONTHLY (CHART LINK)
-
US DOLLAR - DXY - DAILY (CHART LINK)
-
GOLD - DAILY (CHART LINK)
-
GOLD cfd's - DAILY (CHART LINK)
-
GOLD - Integrated - Barrick Gold (CHART LINK)
- SILVER - DAILY (CHART LINK)
-
OIL - XLE - MONTHLY (CHART LINK)
-
OIL - WTIC - MONTHLY - (CHART LINK)
-
BITCOIN - BTCUSD -WEEKLY (CHART LINK)
-
10y TIPS - Real Rates - Daily (CHART LINK)
| |
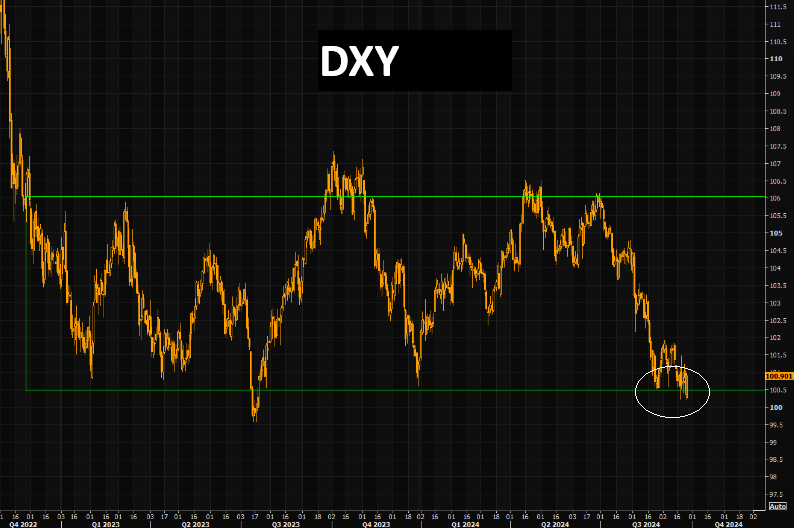
US DOLLAR - DXY - DAILY
CHART RIGHT:
Trading mean reversion often involves pain. The dollar continues trading close to range lows. It looks like it is going to "give in", but the DXY still manages holding these supports. Likely get a pop higher (max pain trade)?
CHART BELOW:
The US real effective exchange rate relative to moving average over past ten years.
This historically has been a mean reverting oscillator.
| 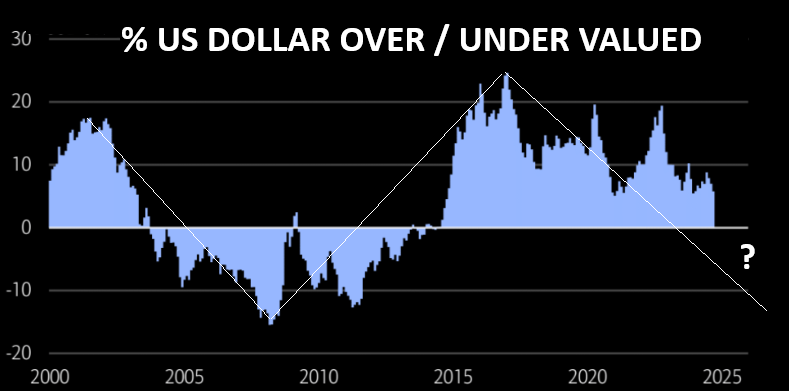 | |
MATASII CHART BELOW
CURRENT DAY'S VIEW
- The DXY continues to rally towards its 100 & 200 DMA, thereby closing the gap between its price and bands in the process of turning the moving average bands downward
- The DXY's Momentum Indicator (lower panel) has reached its overhead resistance level.
- A touch of the 100 DMA before beginning to fall towards support is likely.
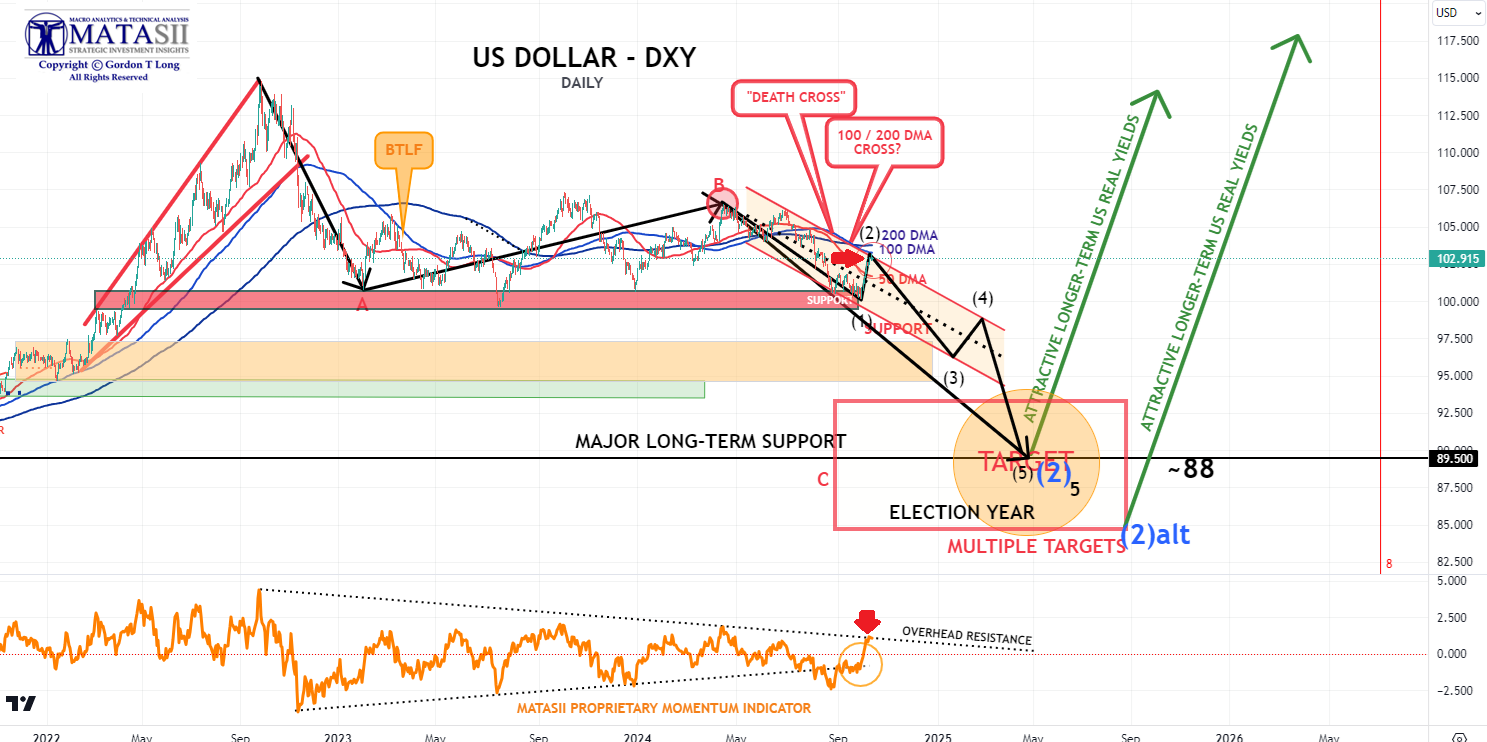
PRIOR OBSERVATIONS - STILL VALID
- We have a Death Cross on the DXY, (the 50 DMA crosses the 200 DMA to the downside).
- We also have the 100 DMA having crossed the 200 DMA to the downside.
- We would expect the Dollar to soon break its long held support level (red band below).
- A short term counter rally towards the descending 50 / 100 /200 DMA would be normal.
- Meanwhile the MATASII Proprietary Momentum Indicator (lower pane) has now hit the longer term resistance level (dotted black trend line).
| |
|
YOUR DESKTOP / TABLET / PHONE ANNOTATED CHART
Macro Analytics Chart Above: SUBSCRIBER LINK
| |
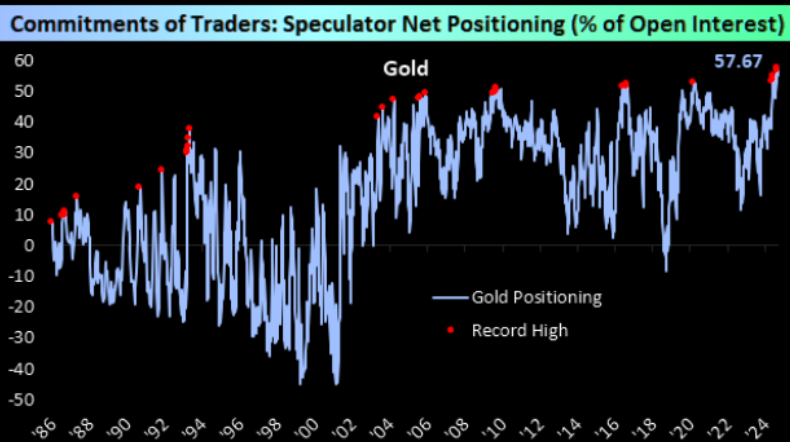
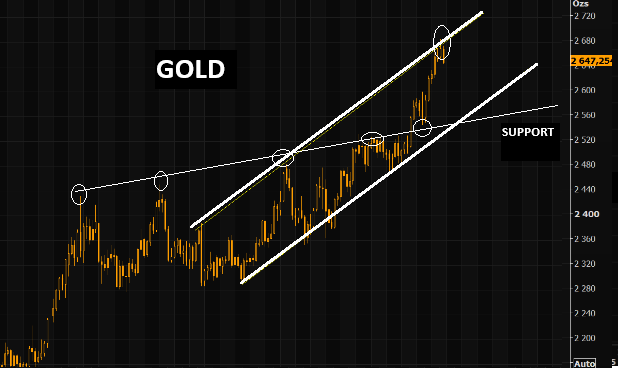
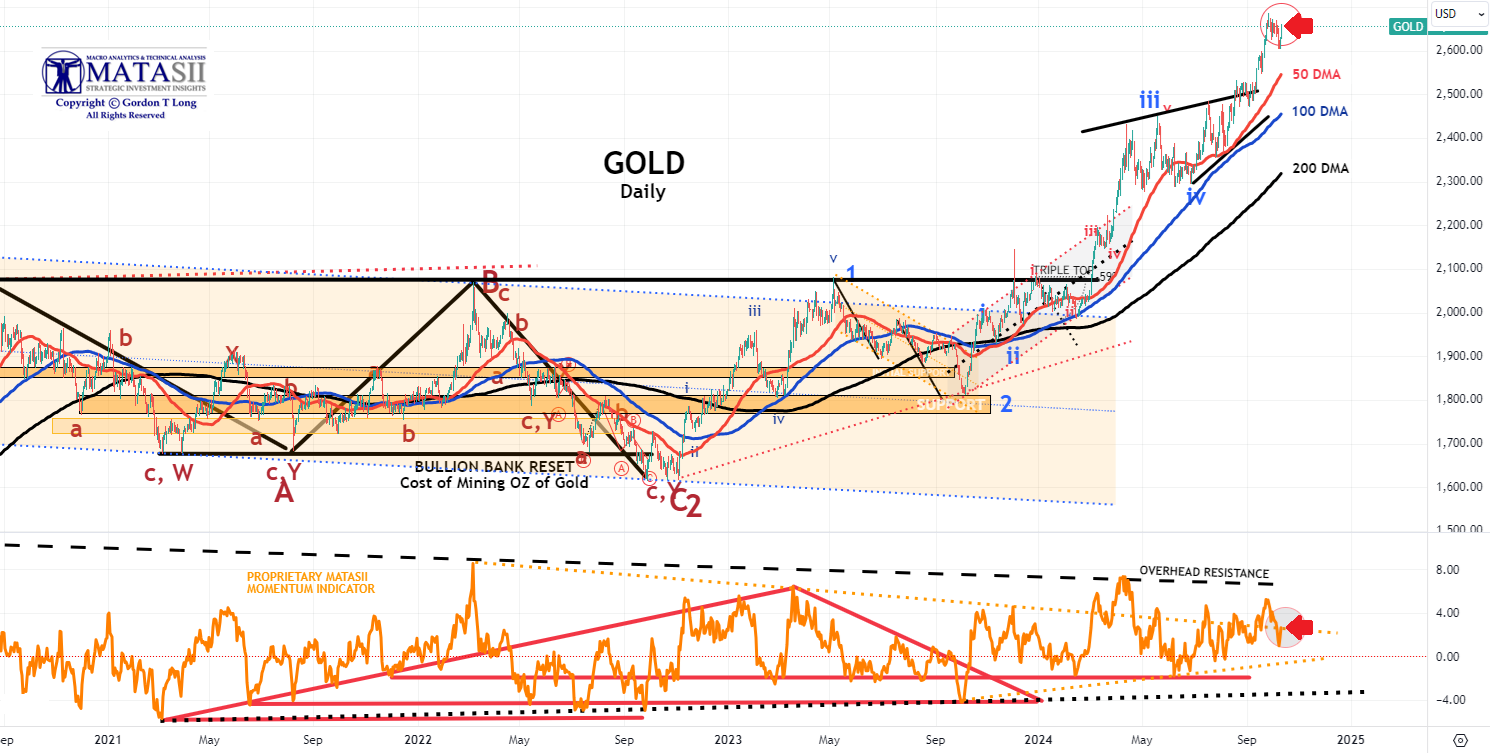
GOLD
CHART RIGHT:
It appears everyone is now chasing gold up here!
CHART BELOW:
Gold reversing in the upper part of the trend channel. The run up to channel highs has been impressive, but even great things "come to an end", or at least take a pause.
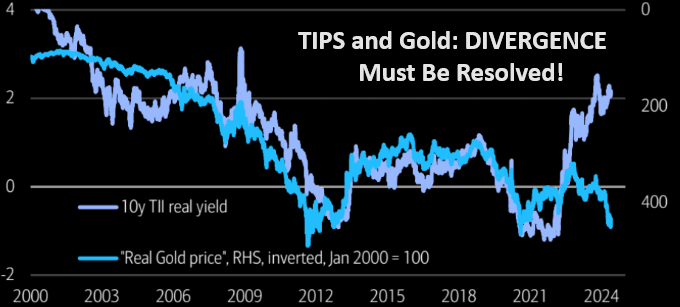
NOTE: The US 10Y Real Yield Rate (chart) is showing indications of a short term lift. Gold moves inversely to the Real Rate.
| |
CHART BELOW
- Gold continues to move marginally higher even without the support of a falling dollar or further weakening in Real Rates.
- However, you should continue to watch Real Rates closely for a potential corrective / consolidation retreat. (see chart - we had a marked rise in Real Rates on Friday!)
- The Macro continues to suggest higher prices with the dollar falling and Real Rates weakening.
| |
|
YOUR DESKTOP / TABLET / PHONE ANNOTATED CHART
Macro Analytics Chart Above: SUBSCRIBER LINK
| |
|
CONTROL PACKAGE
CHART RIGHT: The SPY is sending a potential warning that needs to be heeded!
There are FIVE charts we have outlined in prior chart packages that we will continue to watch closely as a CURRENT "control set":
- The S&P 500 (CHART LINK)
- The DJIA (CHART LINK)
- The Russell 2000 through the IWM ETF (CHART LINK)
- The MAGNIFICENT SEVEN (CHART ABOVE WITH MATASII CROSS - LINK)
- Nvidia (NVDA) (CHART LINK)
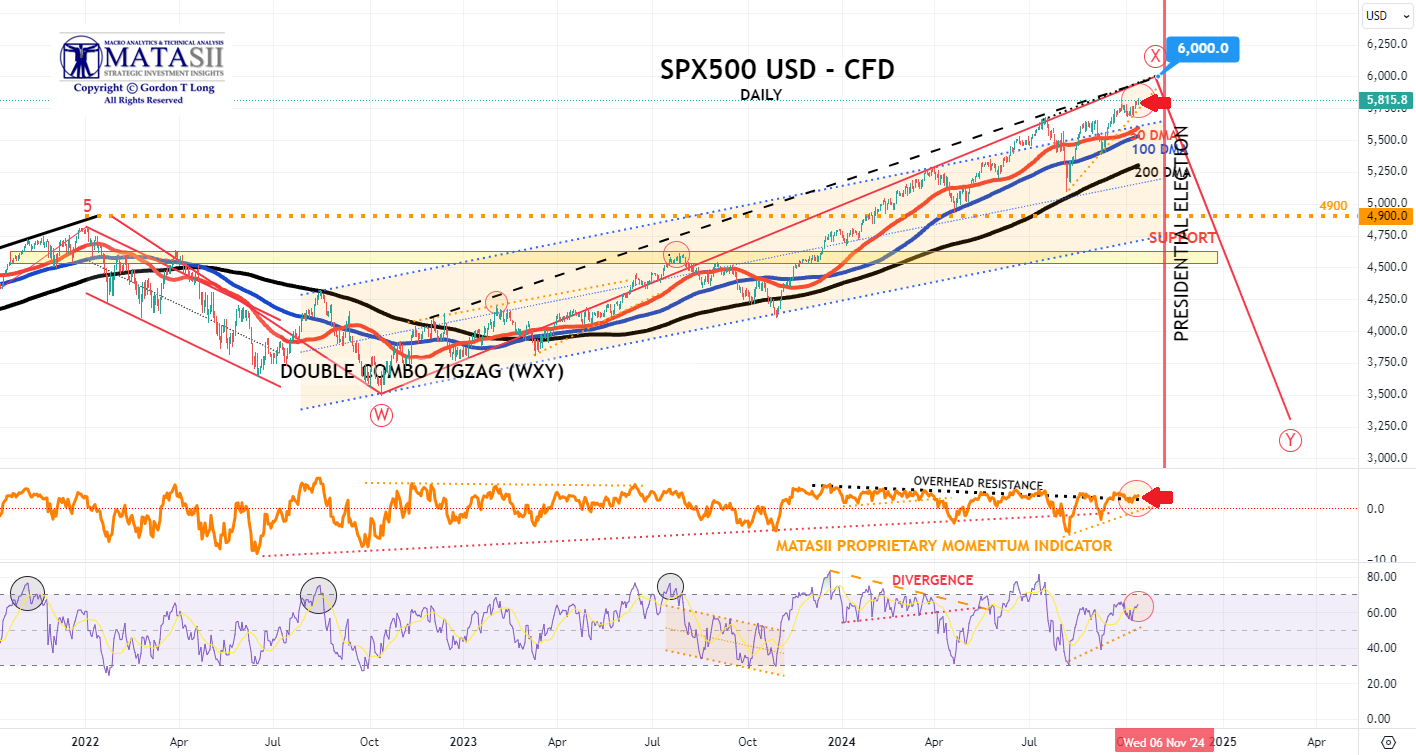
S&P 500 CFD
- The S&P 500 cfd decisively broke the previous Triple Top with the FOMC Rate announcement and continues to rise to new highs, but with a weakening rate of rise.
- The MATASII Proprietary Momentum Indicator (middle panel) has found resistance at its overhead resistance "Divergence" level, (as part of a large wedge that appears soon to end) and has started flattening.
| |
YOUR DESKTOP / TABLET / PHONE ANNOTATED CHART
Macro Analytics Chart Above: SUBSCRIBER LINK
| |
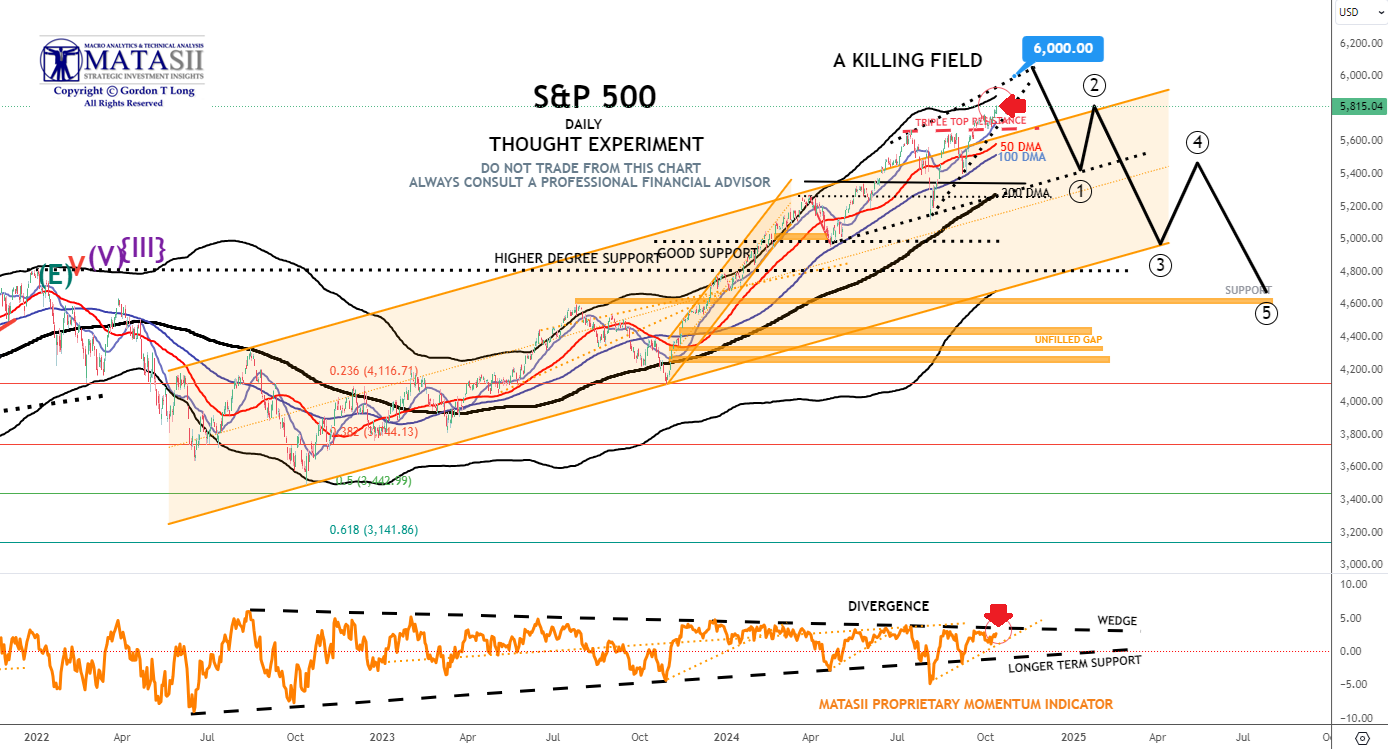
S&P 500 - Daily Our Thought Experiment
OUR CURRENT ASSESSMENT IS THAT THE INTERMEDIATE TERM IS LIKELY TO LOOK LIKE THE FOLLOWING:
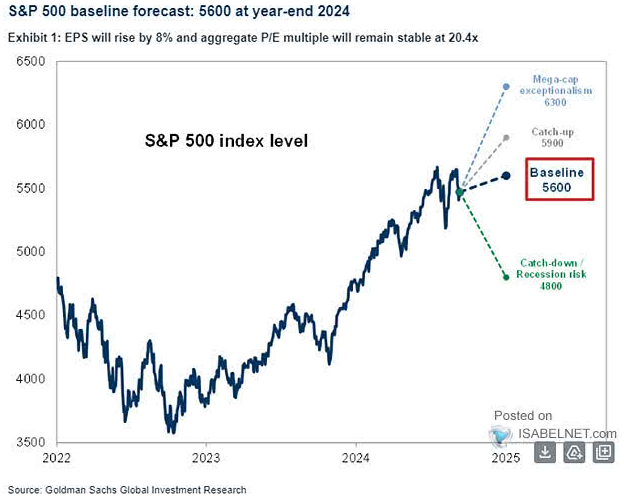
CHART RIGHT: In its base case scenario, Goldman Sachs projects a year-end 2024 price target of 5,600 for the S&P 500 index, supported by robust earnings growth and a stable price-to-earnings ratio.
NOTE: To reiterate - "the black labeled activity shown below, between now and September, looks like a "Killing Field", where the algos take Day Traders, "Dip Buyers", the "Gamma Guys" and FOMO's all out on stretchers!"
- The S&P 500 decisively broke the previous Triple Top with the FOMC Rate announcement and continues to rise to new highs, but with a weakening rate of rise.
- The MATASII Proprietary Momentum Indicator (middle pane) is approaching its overhead resistance "Divergence" level, (as part of a large wedge that appears soon to end).
| |
YOUR DESKTOP / TABLET / PHONE ANNOTATED CHART
Macro Analytics Chart Above: SUBSCRIBER LINK
| |
STOCK MONITOR: What We Spotted
|  | |
LOWER BOND YIELDS CORRECTLY SPOT A WEAKER MACRO
CONTROL PACKAGE
There are FIVE charts we have outlined in prior chart packages that we will continue to watch closely as a CURRENT "control set":
- The 10Y TREASURY NOTE YIELD - TNX - HOURLY (CHART LINK)
- The 10Y TREASURY NOTE YIELD - TNX - DAILY (CHART LINK)
- The 10Y TREASURY NOTE YIELD - TNX - WEEKLY (CHART LINK)
- The 30Y TREASURY BOND YIELD - TNX - WEEKLY (CHART LINK)
- REAL RATES (CHART LINK)
FISHER'S EQUATION = 10Y Yield = 10Y INFLATION BE% + REAL % = 2.326% + 1.732% = 4.058%
3YR AUCTION: The US Treasury sold USD 58bln of 3yr notes at a high yield of 3.878%, tailing the when issued by 0.7bps (the first tail since June), a much softer reception than the prior stop through of 1.7bps and six auction average for the high yield to come in on the screws. The Bid-to-Cover also disappointed at 2.45x, vs. the prior 2.66x and average 2.57x. The soft demand was led by a pullback in indirect demand, taking just 56.9% of the auction, well below the prior 78.2% and average of 66.1%. Direct demand saw a decent improvement to 24%, however, up from the 11.3% and average of 18.1%. Nonetheless, it still saw dealers with a chunky 19.2% takedown, above the average 15.8% and prior 10.5%.
10YR AUCTION: Overall a mixed auction but not as strong as the September offering. The 0.4bps tail was not as strong as the prior stop-through of 1.4bps but a touch better than recent averages. The Bid-to-Cover of 2.48x was beneath the prior 2.64x and six auction average 2.51x. Direct demand fell to 8.44% from 13.7%, well beneath the 16.2% average but the indirect demand remained strong at 77.63%, above the prior 76.0% and average of 68.6%. This left dealers taking under 14% of the auction, slightly better than the average 15.2% but still up from the prior 10.2%.
30YR AUCTION: Overall a strong 30yr auction, likely supported by the concession in wake of hawkish Bostic remarks just before the auction. The US Treasury sold 22bln of 30yr bonds at a high yield of 4.389%, stopping through the WI by 1.5bps, much stronger than the prior tail of 1.4bps and six auction average for a tail of 0.9bps, marking the first stop through in the 30yr auctions since June. The Bid-to-Cover of 2.50x was well above the prior and average of 2.38x. Although a strong auction, there was a lack of direct demand which only took 7.37% of the supply, down from the prior 15.7% and the average of 18.4%, however, this was heavily offset by a surge in indirect bidders. Indirect demand jumped to 80.47% from 68.7%, well above the six-auction average of 65.4%, leaving dealers with just 12.16% of the auction, beneath the prior 15.7% and average 16.2%.
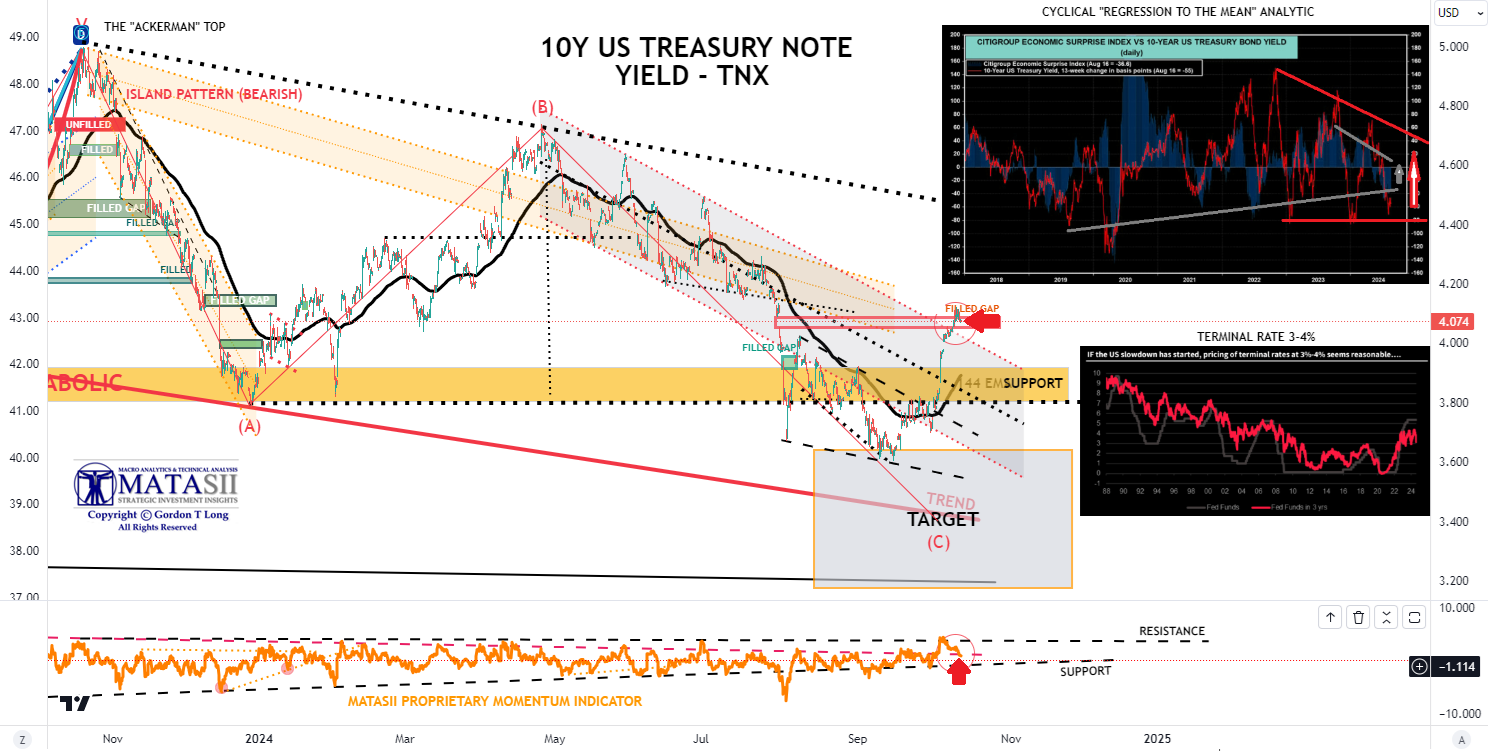
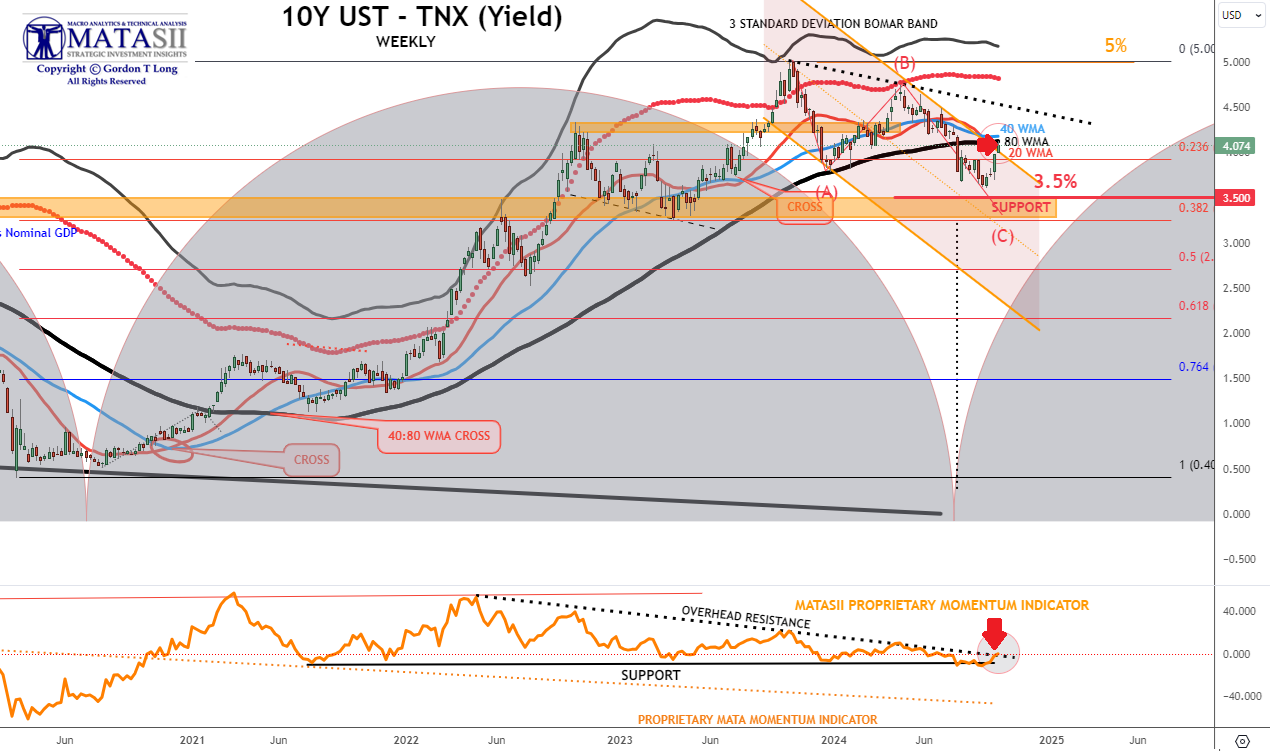
10Y UST - TNX - WEEKLY
CURRENT DAY'S VIEW
- Yields continue to rise, having reached the 20 WMA and close to touching the 80 WMA.
- The TNX has reached overhead resistance on its' MATASII Proprietary Momentum Indicator.
- The expected counter rally is likely close to being finished.
PRIOR OBSERVATIONS - STILL VALID
- The 20 WMA has crossed the 80 WMA - this is normally quite Bearish for Yields!
- The distance of yields below the WMAs was quite large and as we suggested a retracement towards the bands should be expected before heading lower (occurred this week).
- The Proprietary MATASII Momentum Indicator (lower pane) is now showing the beginnings of a test of its overhead resistance trend level.
|  | |
YOUR DESKTOP / TABLET / PHONE ANNOTATED CHART
Macro Analytics Chart Above: SUBSCRIBER LINK
| |
10Y UST - TNX - HOURLY
CURRENT DAY'S VIEW
- The TNX is in the process of closing an unfilled open gap.
- Momentum has already began falling off (lower panel).
- The counter rally is likely near being completed.
PRIOR OBSERVATIONS - STILL VALID
- The TNX yields aggressively rose this week filling the open gap before falling off slightly on Friday.
- The Momentum Indicator (lower pane) is now showing a test of a lower support level level.
- The Fed has been signalling rates will be taken lower, but at a slower rate than the market is currently pricing in. The "hot" CPI and PPI releases this week now makes it more difficult for the Fed to cut rates aggressively.
| |
YOUR DESKTOP / TABLET / PHONE ANNOTATED CHART
Macro Analytics Chart Above: SUBSCRIBER LINK
| |
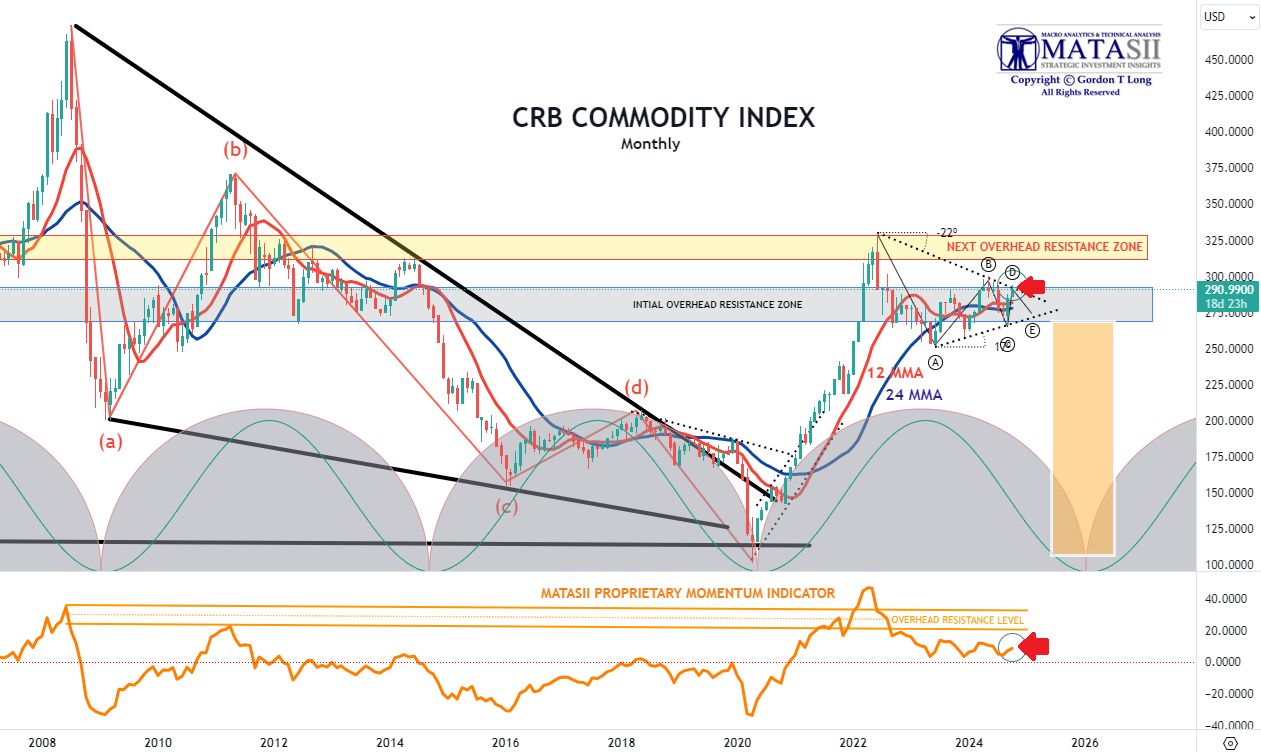
CRB COMMODITY INDEX - MONTHLY
- The overall Commodity Indexes, as measured by the CRB Commodity, reflect a Corrective / Consolidation is presently nearing completion.
- However, many of the individual sectors (not shown here) have already completed the Corrective / Consolidation and broken higher over the last 30-60 days.
- Examples:
- Invesco DB Agricultural Fund (DBA)
- VanEck Agribusiness (MOO)
- Food Producers (FT350 Food Producers - NMX45)
- Teucrium Agricultural Fund ETV (TAGS)
- Advisory Shares Restaurant ETF (EATZ)
- Invesco Food & Beverage ETF (PBJ)
- Teucrium Wheat Fund ETV (WEAT)
- Teucrium Corn Fund ETV (CORN)
- Teucrium Soybean Fund ETV (SOTB)
- Teucrium Sugar Fund ETV (CANE)
| |
YOUR DESKTOP / TABLET / PHONE ANNOTATED CHART
Macro Analytics Chart Above: SUBSCRIBER LINK
| |
NOTICE Information on these pages contains forward-looking statements that involve risks and uncertainties. Markets and instruments profiled on this page are for informational purposes only and should not in any way come across as a recommendation to buy or sell in these assets. You should do your own thorough research before making any investment decisions. MATASII.com does not in any way guarantee that this information is free from mistakes, errors, or material misstatements. It also does not guarantee that this information is of a timely nature. Investing in Open Markets involves a great deal of risk, including the loss of all or a portion of your investment, as well as emotional distress. All risks, losses and costs associated with investing, including total loss of principal, are your responsibility.
FAIR USE NOTICE This site contains copyrighted material the use of which has not always been specifically authorized by the copyright owner. We are making such material available in our efforts to advance understanding of environmental, political, human rights, economic, democracy, scientific, and social justice issues, etc. We believe this constitutes a ‘fair use’ of any such copyrighted material as provided for in section 107 of the US Copyright Law. In accordance with Title 17 U.S.C. Section 107, the material on this site is distributed without profit to those who have expressed a prior interest in receiving the included information for research and educational purposes. If you wish to use copyrighted material from this site for purposes of your own that go beyond ‘fair use’, you must obtain permission from the copyright owner.
========
| |
MATASII'S STRATEGIC INVESTMENT INSIGHTS | |
2020 VIDEOS OUTLINING THE COMING RISE IN INFLATION, STAGLFLATION & COMMODITY PRICES | |
IDENTIFICATION OF HIGH PROBABILITY TARGET ZONES | |
Learn the HPTZ Methodology!
Identify areas of High Probability for market movements
Set up your charts with accurate Market Road Maps
Available at Amazon.com
| |
The Most Insightful Macro Analytics On The Web | | | | |