|
Gordon T Long Research exclusively distributed at MATASII.com
Subscribe to Gordon T Long Research - $35 / Month - LINK
Complete MATASII.com Offerings - $55/Month - LINK
SEND YOUR INSIGHTFUL COMMENTS - WE READ THEM ALL - lcmgroupe2@comcast.net
| |
|
UnderTheLens - MAY 2024
Technical Analysis - 05/06/24
| |
FISCAL & MONETARY STOPS BEING PULLED OUT FOR THE ELECTION
OBSERVATIONS: FALSE EXPECTATIONS??
I find myself wondering if our global expectations can continue to be funded? I see massive global financing needs where credit creation must be taken to another level.
My colleague Richard Duncan just issued a superb report on the issues with deteriorating US credit growth. (I forwarded a link to all MATASII subscribers). Weak credit growth in the US is a global problem. Total Credit in the United States first exceeded $1 trillion in 1964. This quarter it will top $100 trillion. This 100-fold increase in Credit over the last 60 years, as Richard highlights, has been the most important driver of global economic growth. Credit Growth now drives Economic Growth as Capitalism has evolved into Creditism.
EXPECTATIONS THAT EVERYTHING CAN BE FINANCED
We have huge fiscal spending requirements which are increasingly "trillions" more needed each year:
- The interest on the US debt is quickly approaching $2T/year and is more than the tax revenues taken in.
- Unfunded Entitlement Liabilities are now more than $80T with the contributions held in US Treasury Bonds increasingly being redeemed for payouts. The US Treasury will be forced to issue more debt to pay the principle owed when they mature.
- The Green economy is costing Trillions and growing.
- Climate Change is costing Trillions and growing.
- Global Conflict is forcing the Remilitarization of the world.
- The Restructuring of global trade (De-Risking / Onshoring / Friendly shoring)
- The Houthis' sustained disruption of the Asia-Europe shipping route is repricing global shipping and insurance costs.
- Rare earth metals and global commodity costs continue to reprice.
- Between now and 2030, demand for power from global data centers will easily more than double ... within that comes $50bn of capital investment in US power generation alone.
- FX De-Dollarization
…. all must be financed and are INFLATIONARY!
Is our financial system ready for this? It is already experiencing serious secular and unprecedented issues...
INCREASINGLY ABOUT SOLVENCY v LIQUIDITY!
- BANKS:
- The FDIC’s published reports show more than $500 billion in unrealized losses in the US banking sector.
- There was $620b in unrealized Treasury losses last year with Silicon Valley Bank, Signature, First Republic, and now Republic First.
- CENTRAL BANK:
- The Federal Reserve, which in theory would bail out the banking sector, is itself insolvent by $900 billion.
- Total Federal Reserve capital is just $51 billion… versus $948 billion in losses. This means the Fed is insolvent 19 times over. ===>
| |
|
VIDEO PREVIEW (click image)
Pay-Per-View Page Link
|  | |
THIS WEEK WE SAW
Exp=Expectations, Rev=Revision, Prev=Previous
US
US Dallas Fed Manufacturing Business Index (Apr) -14.5 (Prev. -14.4)
US Chicago PMI (Apr) 37.9 vs. Exp. 45.0 (Prev. 41.4)
US Employment Costs (Q1) 1.2% vs. Exp. 1.0% (Prev. 0.9%)
US ISM Manufacturing PMI (Apr) 49.2 vs. Exp. 50.0 (Prev. 50.3)
US ISM Manufacturing Prices Paid (Apr) 60.9 vs. Exp. 55.0 (Prev. 55.8)
US Construction Spending MM (Mar) -0.2% vs. Exp. 0.3% (Prev. -0.3%)
US Unit Labor Costs Prelim. (Q1) 4.7% vs. Exp. 3.3% (Prev. 0.4%)
US Productivity Prelim. (Q1) 0.3% vs. Exp. 0.8%
US Non-Farm Payrolls (Apr) 175.0k vs. Exp. 243.0k (Prev. 303.0k, Rev. 315k); two month net revisions -22k (prev. +22k)
US Unemployment Rate (Apr) 3.9% vs. Exp. 3.8% (Prev. 3.8%)
US Average Earnings YY (Apr) 3.9% vs. Exp. 4.0% (Prev. 4.1%)
===>
- GOVERNMENT:
- The US government, which would bail out the Fed, is insolvent by more than $50 trillion.
Oh well, maybe I just worry too much - or too few who are actually responsible even worry about it at all??
Maybe we need to make it more personal! How about this:
- From 2012 to 2016, things became 5% more expensive (“things” = gasoline, food, consumer goods).
- From 2016 to 2020, things became 8% more expensive.
- From 2020 to today, things have become 21% more expensive.
TO REVIEW
+5% ... to +8% ... to +21% = 34%
OR 1/3 more expensive to live (even exist)!
| |
========================= | |
|
WHAT YOU NEED TO KNOW!
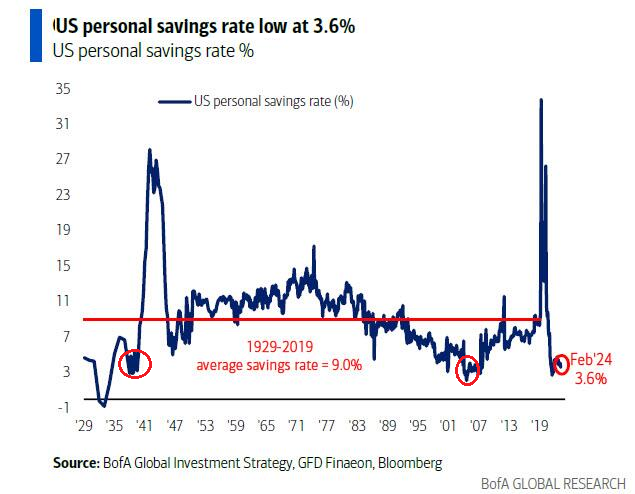
US PERSONAL SAVINGS RATE FALLS TO 3.2%
The savings rate plunged to 3.2% from 3.6% and down from 5.2% a year ago. The US savings rate is now at levels not seen since the Great Depression and the 2008 Financial Crisis (see red circles). This is about 60% below the long-term average US savings rate of 9.0%, which cannot be a healthy economy!!
Meanwhile credit card balances are at all time highs with credit card rates at record highs. It would appear the recent spending spree is almost over.
RESEARCH
- ALL STOPS NOW OUT FOR THE ELECTION!
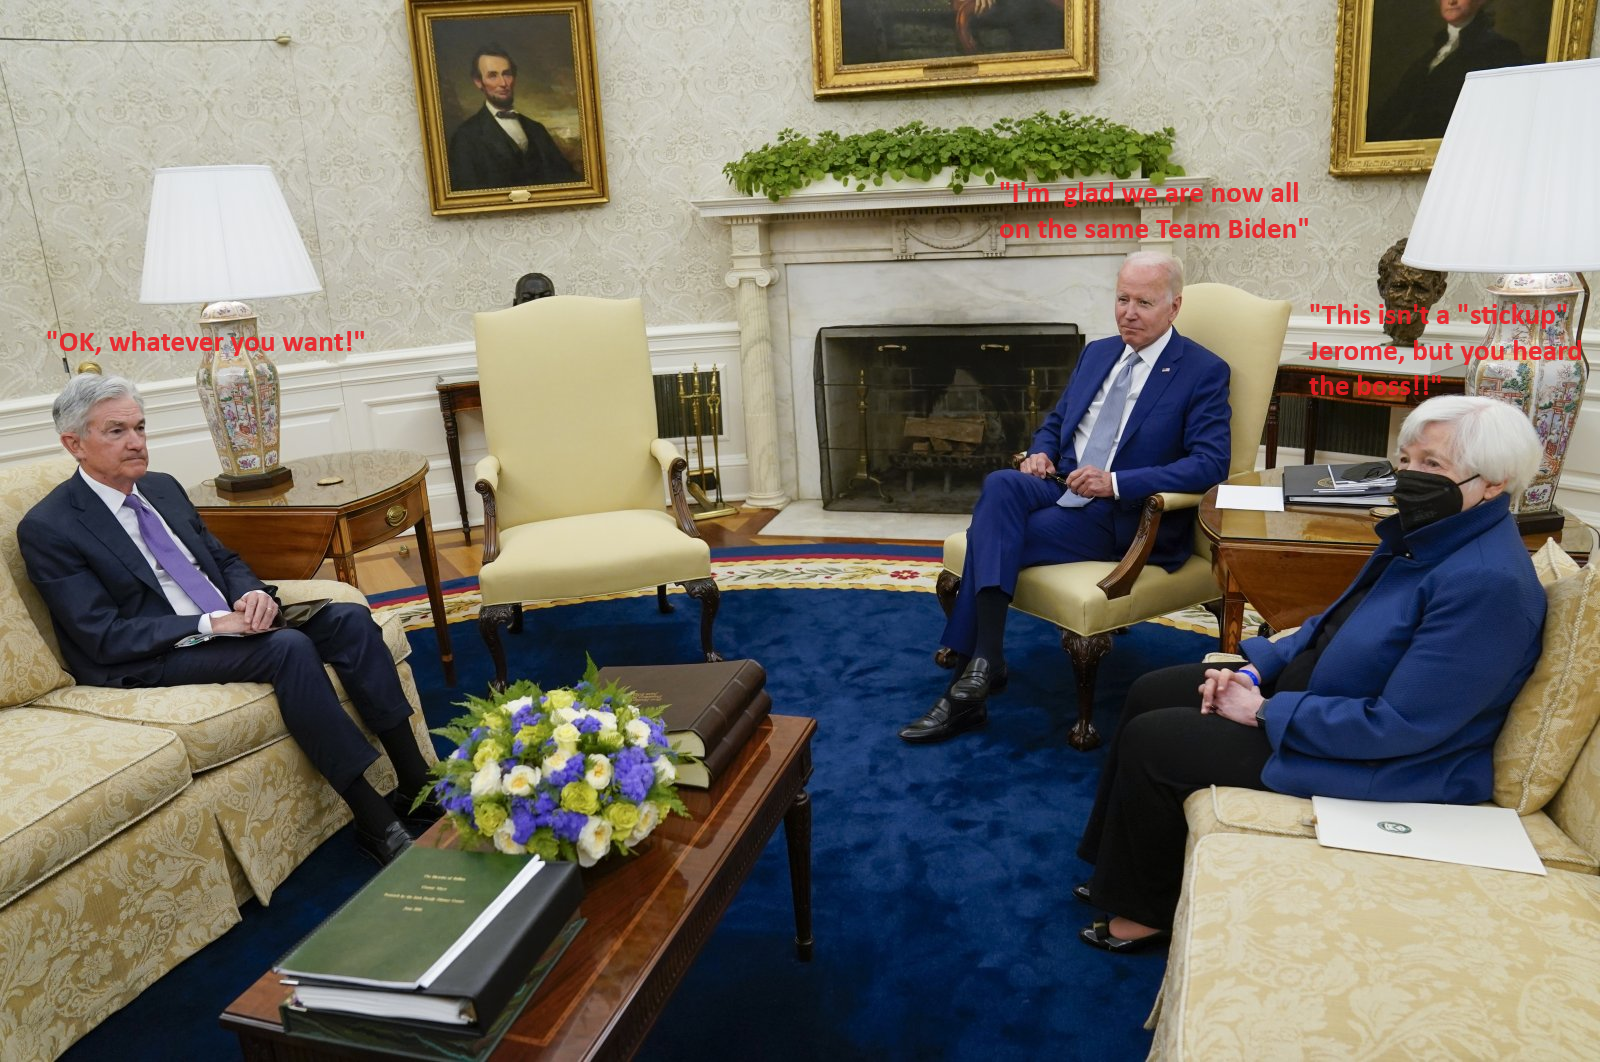
- Powell and Yellen have every incentive in the world to facilitate Monetary and Fiscal Policy to get Biden re-elected, but maybe more importantly to protect their personal legacies? Better to leave on your terms than subject to disgrace!
- In that regard, we have never seen Fiscal and Monetary Policy recently become more closely aligned and supportive! This had not been the case before Biden ran into troubles in the polls.
- Throughout most of Biden's first term he has saddled the Fed with ~$6.7T in fiscal deficits that sparked an Inflation surge not seen since the 1970's. The Fed initially espousing the Covid Supply Chain Inflation shock as "Only Transitory" was suddenly made to look inept as it scrambled to fight Biden's fiscal driven Inflation.
A Classic case of "too many dollars chasing the same amount of goods & services".
- So what are they up to? What is their plan? Of course I can't be certain, but some things are very clear.
WE LAY OUT THE DETAILS IN THE RESEARCH SECTION
- HEDGE FUNDS SHIFT TO "INDIRECT EXCHANGE"
- Over 10 years ago, my colleague and former Global Insights partner, Ty Andros and myself produced two videos outlining the "Indirect Exchange". This followed extensive work Ty, a true Austrian Economist, had done on "Commodity Based Money".
- As we watch major Hedge Funds and Private Equity Firms capture the US Rental Housing market it is important to understand the umbrella strategy under which they work.
- I asked Ty Andros to distill it as simply as only he can. I lay it out in the Research Section what he said.
| |
|
DEVELOPMENTS TO WATCH
BLINKEN REBUFFED BY CHINA
- After Yellen's futile trip to China, Blinken's visit was even more pointed in highlighting the deterioration of Sino-US relations.
- China has clearly lost respect for America, its global leadership, competitiveness and influence.
- Blinken could best resort to the weak "dialogue-is-progress" narrative.
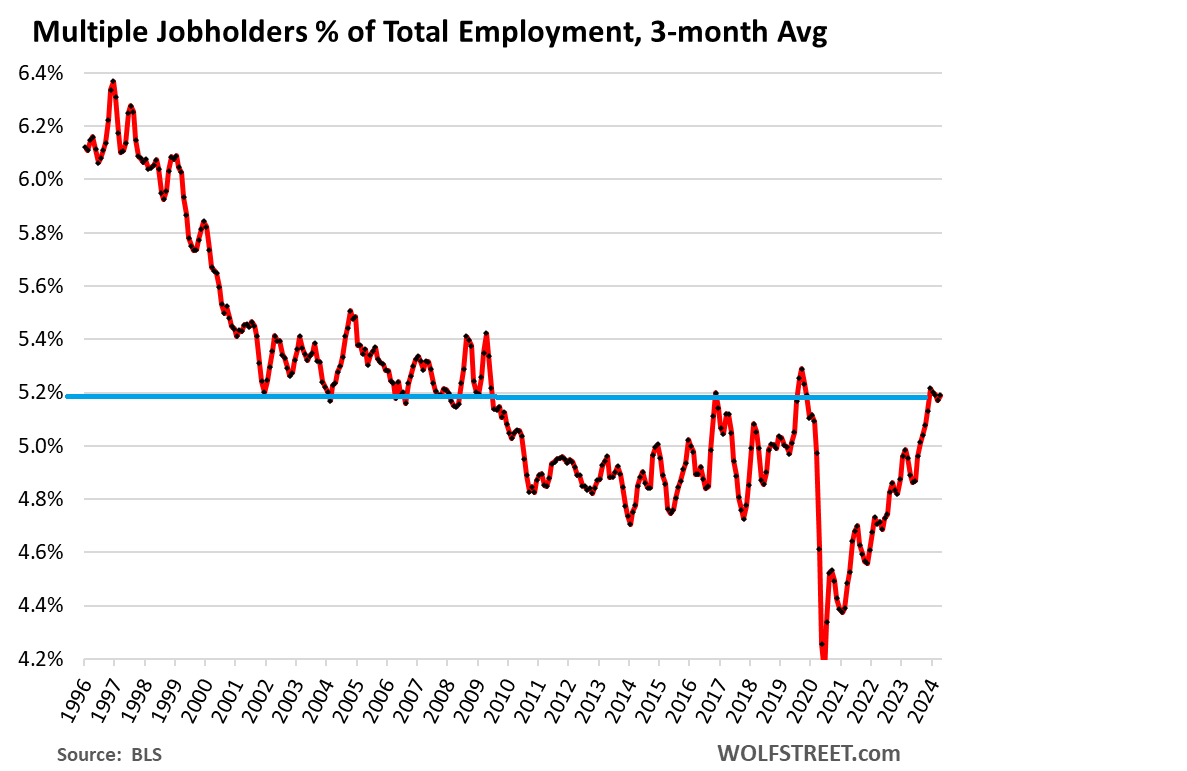
FAMILY SUPPORTING JOBS IN PERIL IN AMERICA (Unless You Work for the Government)
-
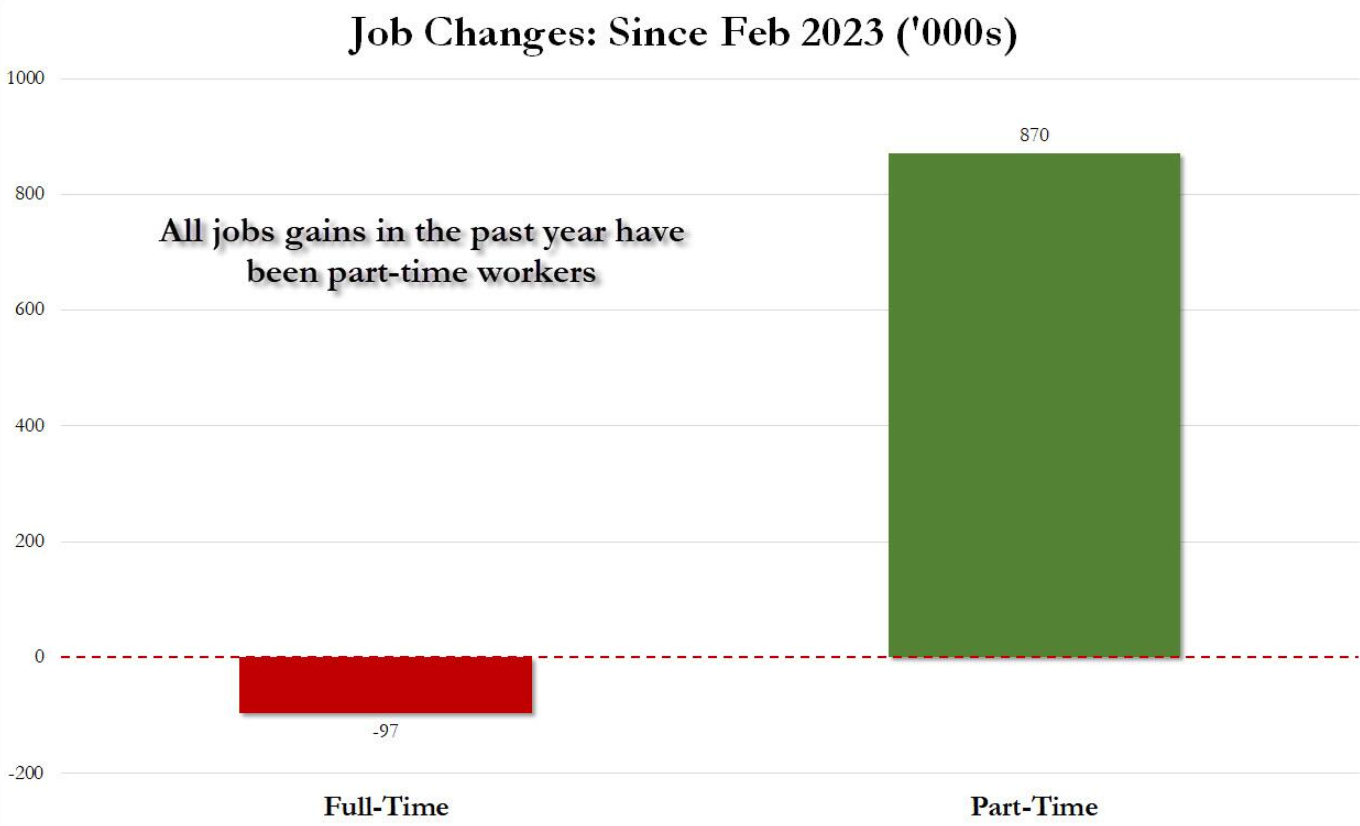
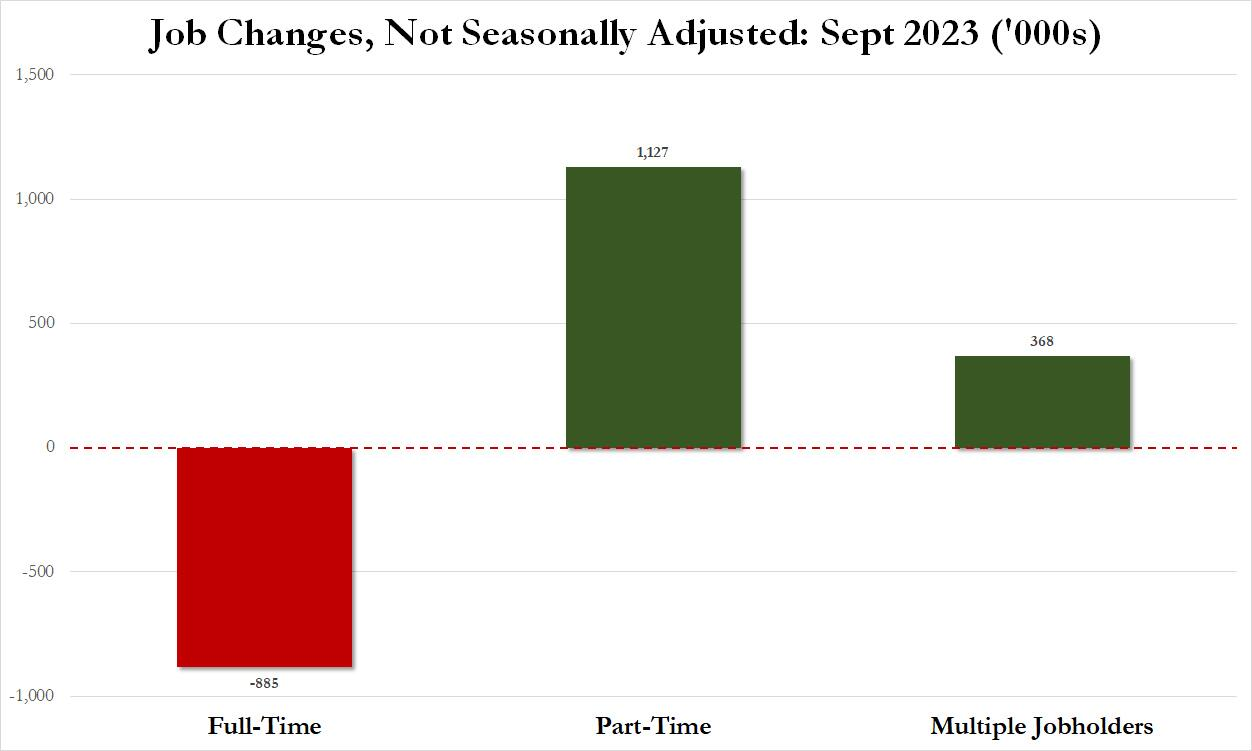
The US is creating temporary jobs, (being held by non American born workers), and losing full time jobs.
- Full time job growth is dominantly found in Government and Government funded / subsidized organizations.
- Salary and benefit increases are primarily the purview of government and union workers.
- Small Business which has been the bedrock of American employment is in freefall by almost any measure.
| |
|
GLOBAL ECONOMIC REPORTING
- APRIL LABOR REPORT (NFP)
- Not a Good Week for Key US Economic Indicators:
- Rising Unemployment Rate
- Falling new Job Creation
- Rising Employment Cost Index and Unit Labor Costs
- Falling Consumer Confidence
- ISM Manufacturing ISM in contraction
- Falling Construction Spending
- Falling Productivity
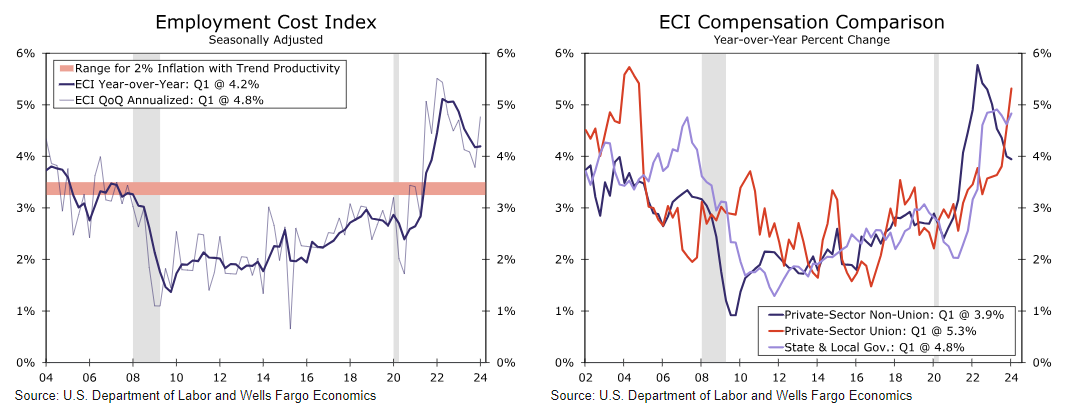
- EMPLOYMENT COST INDEX (ECI)
- US labor costs accelerated in the first quarter, led by the government sector, while hikes to state minimum wage levels contributed to higher private sector labor costs.
- Labor costs reaccelerate more than expected. We have seen a big jump in the US 1Q employment cost index of 1.2% quarter-on-quarter versus 0.9% in 4Q23, well above the 1% expected and above every single individual forecast in the Bloomberg survey.
- UNIT LABOR COSTS SOAR
- Echoing the market-worrying ECI data earlier in the week - Unit Labor Costs soared 4.7% in Q1, (well above the 4.0% expected and the 0.4% rise in Q4).
- So wage inflation is confirmed - rising at the fastest pace in a year - as all the gains we have been told to expect from AI just aren't there in the data.
| |
|
In this week's "Current Market Perspectives", we focus on the signals that sentiment, fundamentals and various markets (Credit, Bond and Equity) are currently giving us.
=========
| |
|
ALL STOPS NOW OUT FOR THE ELECTION!
"BIDENOMICS" IS BETTER LABELED "BUBBLE-NOMICS"!
Trump has been quite clear that if given the option he would replace Fed Chairman Jerome Powell. If Trump is elected Janet Yellen would be back on the corporate speaking circuit. Obviously Powell and Yellen have every incentive in the world to facilitate Monetary and Fiscal Policy to get Biden re-elected, but maybe more importantly to protect their personal legacies? Better to leave on your terms than subject to disgrace!
In that regard we have never seen Fiscal and Monetary Policy recently become more closely aligned and supportive! This had not been the case before Biden ran into troubles in the polls. Throughout most of Biden's first term he has saddled the Fed with ~$6.7T in fiscal deficits that sparked an Inflation surge not seen since the 1970's. The Fed initially espousing the Covid Supply Chain Inflation shock as "Only Transitory" was suddenly made to look inept as it scrambled to fight Biden's fiscal driven Inflation . A Classic case of "too many dollars chasing the same amount of goods & services".
So what are they up to? What is their plan? Of course I can't be certain, but some things are very clear.
YELLEN & FISCAL POLICY
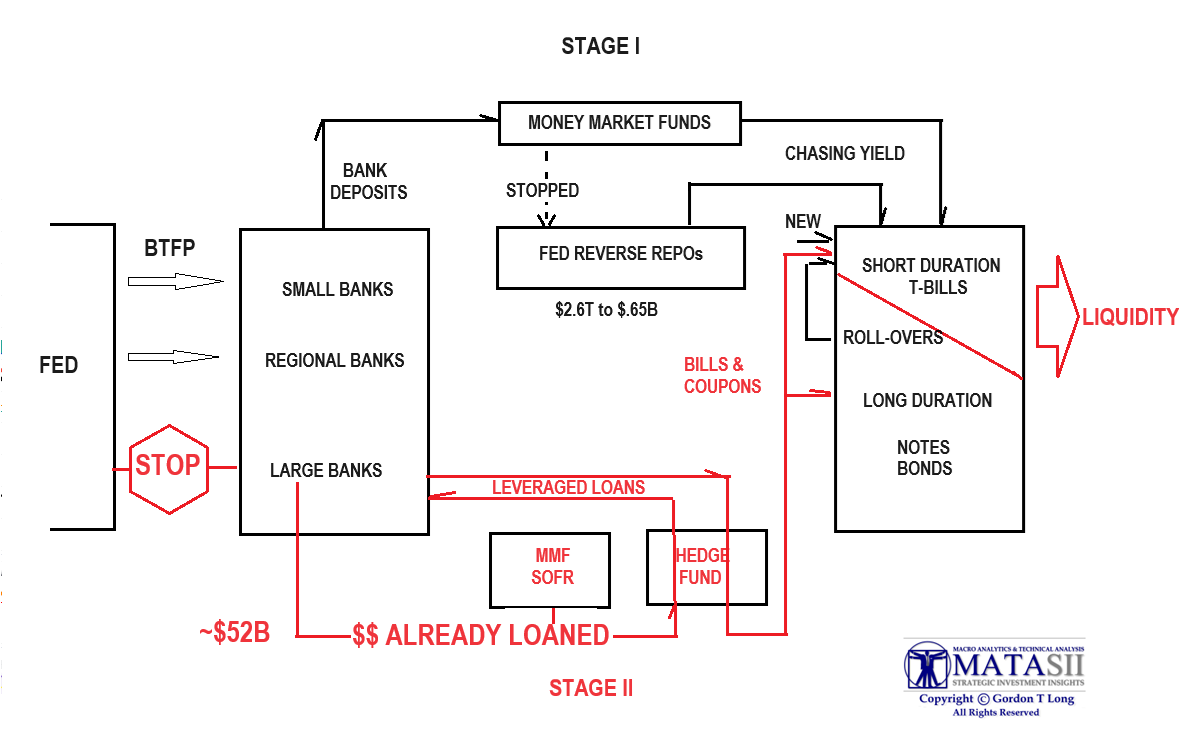
- Yellen's QRA (Quarterly Refunding Announcement) showed limited growth in auction size (suggesting that fiscal spending would be brought under control). Of course now that she has topped up the TGA to nearly $1T she has plenty of money to pump liquidity into the financial markets between now and the election.
- Yellen announced a Treasury Buyback Program that allows her to buyback Treasuries in the open market, thereby impacting price & yields based on Treasury created demand where needed. In many ways this is how Japan used Yield Curve Control (YCC) to manipulate Treasury Yields anywhere on the curve.
- Yellen's QRA also focused allocation supply on short term T-Bills versus long term coupons. Less coupon supply helps alleviate demand pressures which would force prices down and yields up if foreign buying continued, as expected to be a potential strain at Treasury auctions.
- Yellen has pressured China who had previously been the second largest holder of US debt, (having reduced their Treasury holding from ~1.3T to ~$750B), to assist in further selling. She likely gave some sort of incentives to China in her recent hasty trip to Beijing. We speculate it involved deferring Trade tariffs on China until after the election.
- Yellen is expected to have changes finalized in the Basel III SLR (Supplemental Leverage Ratio) before August. This would effectively incent banks to increase Treasury holdings which they have been limited by as the Banks have reduced being market makers carrying inventory.
- .... these are only those we are currently aware of remembering that Yellen's Stealth Liquidity Stage II is still operational but needing only Yellen to ensure that rates would be heading lower (prices up) so that the leverage loan hedge fund operators would not be exposed to "holding the bag" on the their purchases if Yields rose (chart below).
| |
|
POWELL & MONETARY POLICY
- Powell was extremely clear and reassuring at Wednesday's press conference that the FOMC did not see rates heading higher - only potentially "higher for longer". This was what the markets needed to hear and bond yields fell.
- Powell has been clear that, though he does not see rates going higher, he sees rates going down if the strong Employment momentum starts was to weaken. PRESTO - the April Labor Report on Friday suddenly plummets! We have long advocated it was much weaker than the Labor Secretary's BLS was reporting. It was time for the BLS to to be more inline with fellow Biden Cabinet member Janet Yellen & Powell's needs.
The Team appears to now all be operating from the same playbook.
| |
|
HEDGE FUNDS SHIFT TO "INDIRECT EXCHANGE"
Over 10 Years ago my colleague and former Global Insights partner, Ty Andros and myself produced two videos outlining the "Indirect Exchange". This followed extensive work Ty, a true Austrian Economist, had done on "Commodity Based Money".
As we watch major Hedge Funds and Private Equity Firms capture the US Rental Housing market it is important to understand the umbrella strategy under which they work.
I asked Ty Andros to distill it as simply as only he can. Here is what he said:
"A GLOBAL currency and financial extinction event is unfolding.
The indirect exchange is in full Bloom worldwide as FIAT currencies are being printed endlessly as modern monetary theory has been implemented.
| |
03-12-13 - Macro Analytics - WARREN BUFFETT: Master of the Indirect Exchange - w/ Ty Andros | |
|
Any growth you see is an ILLUSION of a morally and fiscally bankrupt political class. As Global Economies have ceased to produce real wealth (now its DEBT in disguise) and our trading partners worldwide see the demise of the dollar (worthless IOU coupons written on a US economy which has ceased to produce REAL wealth) on the horizon.
Sovereigns, Corporations, Hedge Funds and private equity sit on and generate piles of rotting currencies in their accounts. Their economies hobbled by runaway taxes/regulations, and exploding welfare states having destroyed REAL wealth creation. They see the unfolding worthlessness of their cash like an ice cube in the sun. Where to run to safety is the question? The indirect exchange is one of the only escapes.
The worth of the dollar and all fiat currencies is unknowable and we are only waiting for the people to wake up!
THE INDIRECT EXCHANGE
| |
USING THE "INDIRECT EXCHANGE" TO CAPTURE REAL WEALTH - 10-31-15 FRA w/ Ty Andros | |
|
The indirect exchange is where you exchange worthless currencies for 'real things' that cash flow.
- The housing markets are just one of the latest manifestations.
- In the stock market Corporate buybacks of over $1 Trillion dollars is an indirect exchange.
- China is in motion making indirect exchanges everywhere, internationally through Belt and road initiative, gold accumulation and buying cash flowing businesses worldwide.
- And the Maestro of the indirect exchange, Warren Buffett, has made himself and Berkshire Hathaway unimaginably successful -its his business model!
Anything to reduce the pile of worthless currencies they store their wealth in.
Fiat currencies offer NO ESCAPE, as they are all derivatives of the dollar!
- The dollar will be the last to fall as it is the one eyed man in the land of the Blind.
- As people wake up the crack up boom will commence.
- The indirect exchange will be the bridge from Greenbacks to Bluebacks at the time of the ultimate denouement.
You must learn to prey on worthless paper to preserve and build our wealth! It's actually the biggest opportunity in history!"
| |
|
DEVELOPMENTS TO WATCH
BLINKEN REBUFFED BY CHINA
"This was more than a slight. Aside from a calculated insult to the dignity of the United States, the move indicates Xi Jinping is making clear that the accepted norms of diplomacy will not be respected by China anymore."
Charles Burton, former Canadian diplomat who served in Beijing, to the
Gatestone Institute, April 27, 2024.
According to noted & respected Chinese scholar Gordon C Chang:
- On every major issue, the U.S. and China take different sides, and the Chinese have clearly dug in. Blinken was reduced to begging.
- China, literally and figuratively, did not roll out the red carpet for his arrival in Shanghai on Wednesday. Only a low-level official was on hand to greet Blinken as he stepped off the plane. "Aside from a calculated insult to the dignity of the United States, the move indicates Xi Jinping is making clear that the accepted norms of diplomacy will not be respected by China anymore."
-
"The latest shambolic display by the Biden administration comes in the form of Secretary of State Antony Blinken groveling before China's Ruler-for-Life Xi Jinping for a new set of protocols for governing the development of artificial intelligence between America and China, the two nations contributing the most to both the advancement of AI and its weaponization," Brandon Weichert, a national security analyst at The National Interest, told Gatestone. "Although creating such protocols may sound like a good idea, it seems like a bad idea for Washington to unilaterally agree to limit its own activities."
- "Unilaterally"? Burton and Weichert point out that China never honors agreements, so any deal with Beijing is akin to a unilateral promise.
-
"China is deeply committed to the weaponization of AI and would be counting its lucky communist star if the Americans basically deterred themselves with such a protocol," Weichert, also author of "Biohacked: China's Race to Control Life", adding he suggests the United States spend its time getting the world to restrict tech trade with China "rather than pleading with Xi Jinping for mercy."
The risk now is that the Biden administration will trade away its restrictions for meaningless promises from
China's Communists.
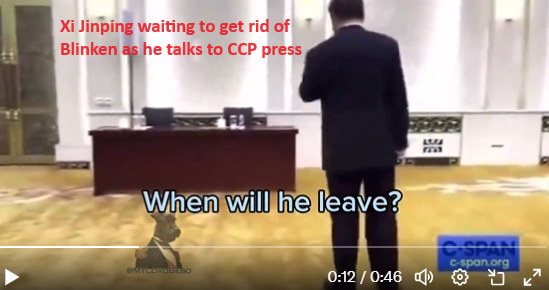
To see the disdain China now holds for the US, WATCH HIDDEN VIDEO CLIP:
Xi met Blinken on Friday, but China's leader let the cameras record his disdain for his visitor. Seconds before the secretary of state walked half-way across the room to shake hands, Xi asked an aide, "When will he leave?" This was as close to the Chinese Leader as Blinken was allowed.
| |
|
FAMILY SUPPORTING JOBS IN PERIL IN AMERICA (Unless You Work for the Government)
1- The US is creating temporary jobs (being held by non American born workers) and losing full time jobs. (chart right - Top and Bottom)
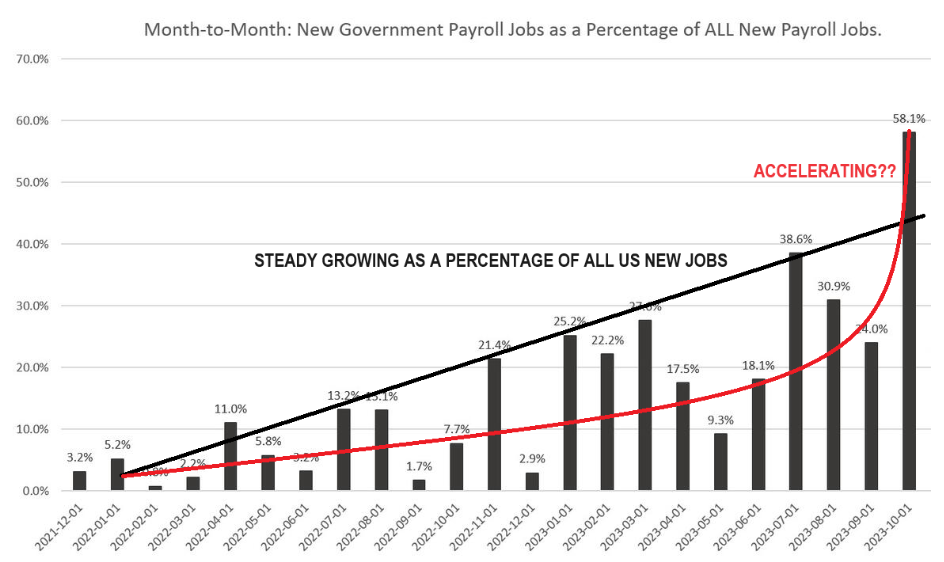
2- Full time job growth is dominantly found in Government and Government funded / subsidized organizations (chart below)
| |  |
| |
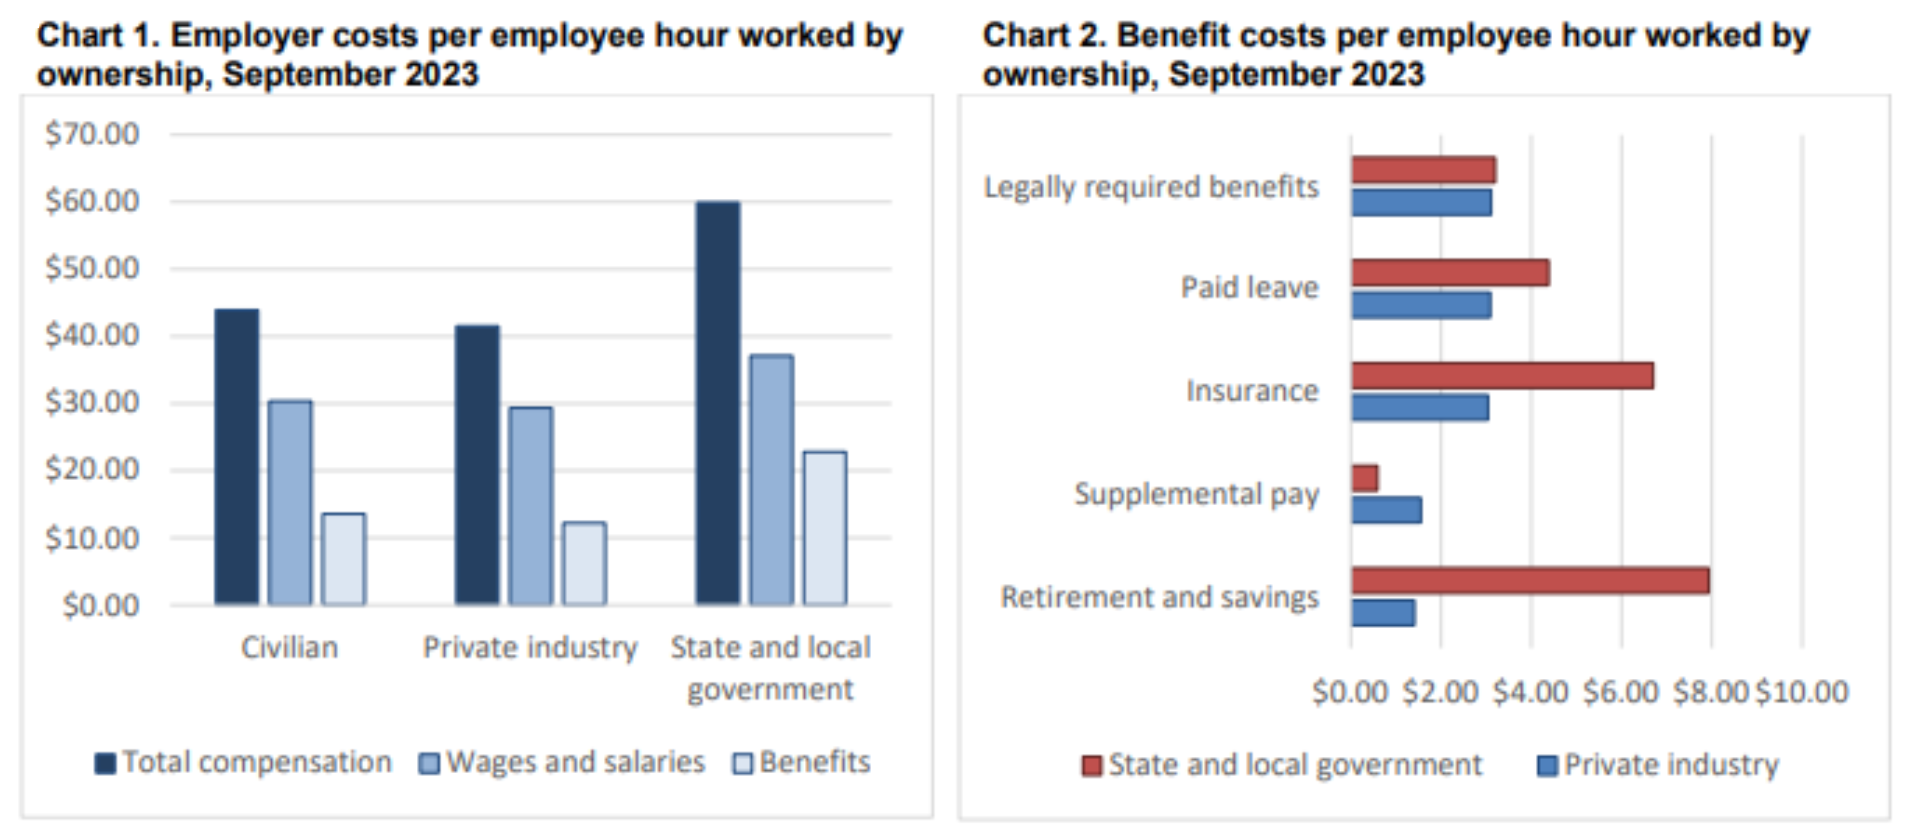
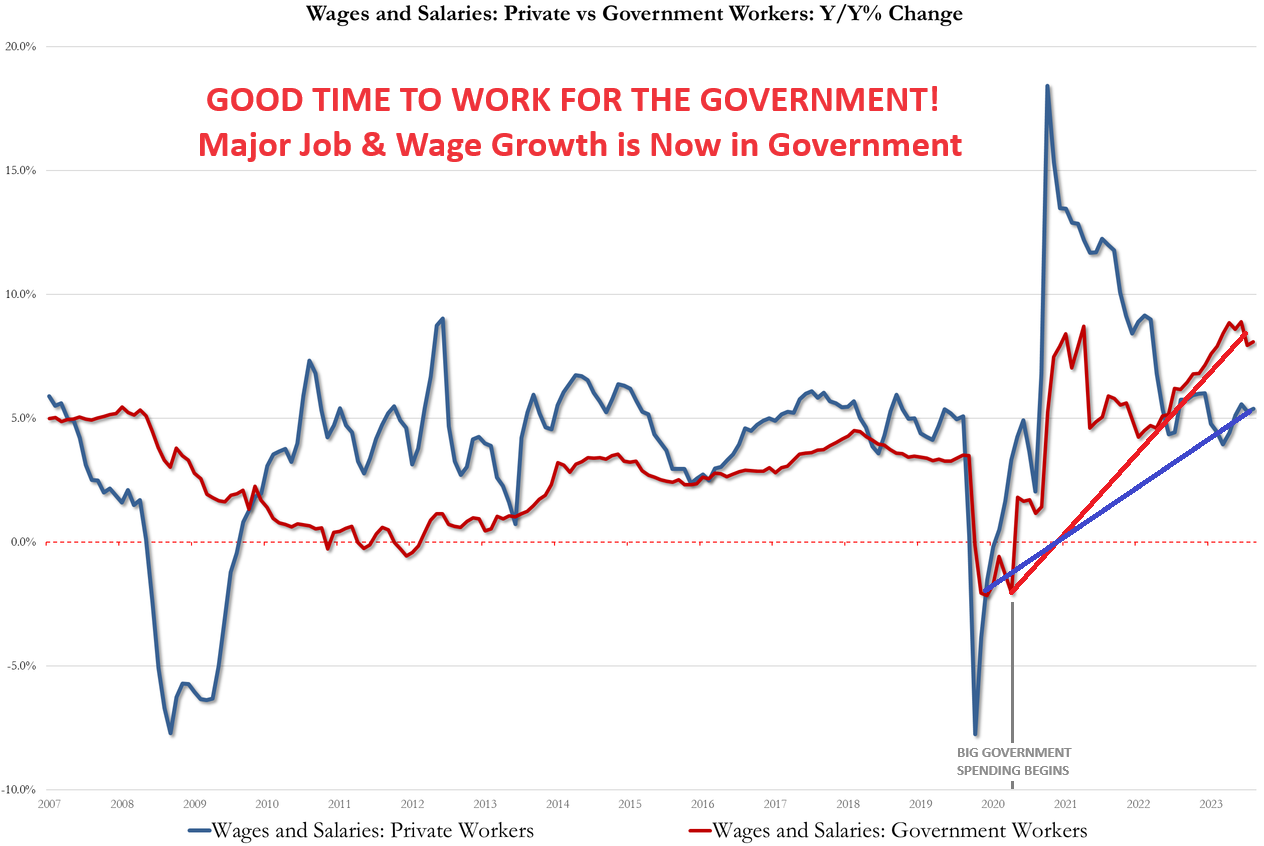
3- Salary and benefit increases are primarily the purview of government and union workers. | |
Guess who is to blame for the rise in employment costs? The Government, where compensation is up 4.8% YoY, (re-accelerating back near its fastest in history). | | |
Unionized service workers are seeing their wages soar at a record pace while non-unionized manufacturing workers are seeing wage growth slowing... | | |
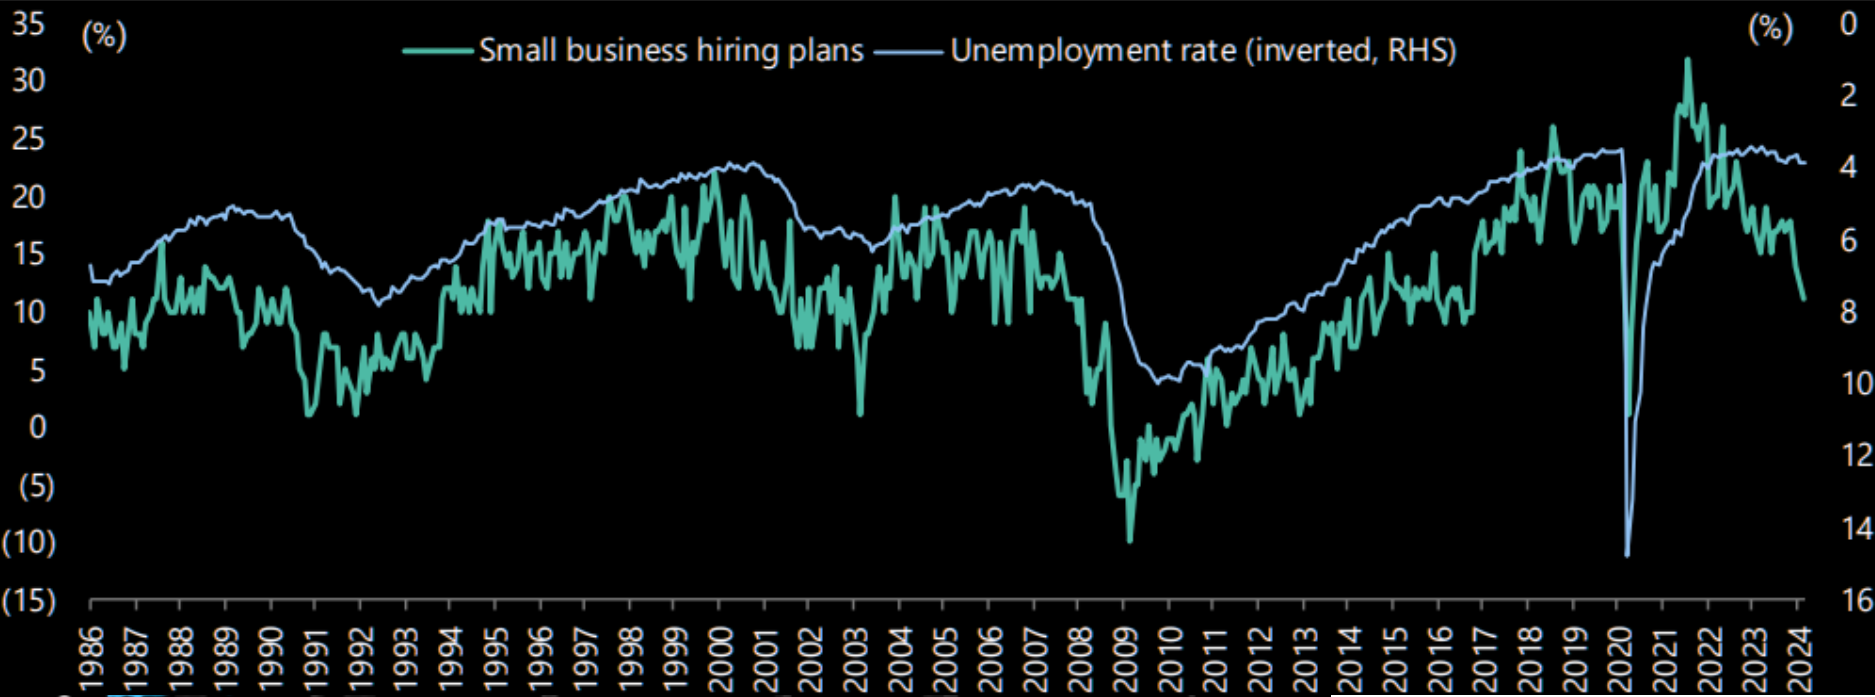
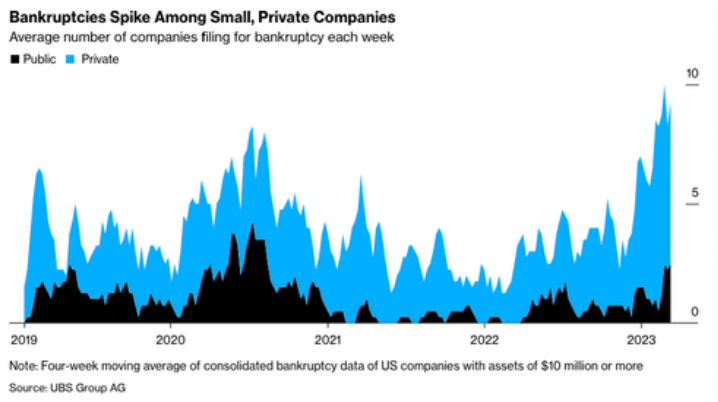
4- Small Business, which has been the bedrock of American employment, is in freefall by almost any measure. | |
|
CHART ABOVE: Small business hiring plans are plummeting.
CHART RIGHT: Bankruptcies spiking
| | |
| |
|
GLOBAL ECONOMIC INDICATORS:
What This Week's Key Global Economic Releases Tell Us
Not a Good Week for Key US Economic Indicators:
- Rising Unemployment Rate
- Falling new Job Creation
- Rising Employment Cost Index and Unit Labor Costs
- Falling Consumer Confidence
- ISM Manufacturing ISM in contraction
- Falling Construction Spending
- Falling Productivity
APRIL LABOR REPORT (NFP)
The US Jobs Report in April was a SHOCKER, confirming the weakening survey data.
- Headline NFP eased to 175k from the 315k prior, falling short of the 243k estimate with -22k two-month net revisions.
- The 175k jobs added is the lowest since October 2023's 150k, and also the first time since then that NFP fell short of expectations.
-
The unemployment rate ticked up to 3.9% from 3.8%, despite expectations for an unchanged print while the labor force participation rate remained steady at 62.7%. Earnings were also soft, M/M rose 0.20% despite expectations for a 0.3% print again, while the Y/Y dipped to 3.9% from 4.1%, deeper than the 4.0% consensus and the first time under 4% since June 2021.
- WSJ's Timiraos says this will not change much for the Fed as there's another jobs report before their next meeting. The Fed is more focused on inflation data, and it does not show an "unexpected" weakness in the labor market.
- Fed Chair Powell said on Wednesday that "A couple tenths" of an increase in the unemployment rate doesn't count as an "unexpected weakening" in the labor market that would justify cuts.
- This implies a further weakening of the labor market is needed for the Fed to cut rates, unless inflation starts to sustainably return to 2%. But after the Q1 inflation data, the Fed does not yet have that confidence.
- Nonetheless, this report does add support to the case for rate cuts this year, with markets now pricing in almost two rate cuts this year; almost fully priced in for September and December.
- By itself, a slightly softer NFP is not a cause for concern, particularly after some of the massive strength seen recently. But given some of the red flags seen in the survey data, it will open up the question of whether this may be the start of a string of downside numbers.
- At the same time, the more timely weekly jobless claims figures are running particularly low - still in the low 200k's, indicative of no material slowdown.
| |
EMPLOYMENT COST INDEX (ECI)
US labor costs accelerated in the first quarter, led by the government sector, while hikes to state minimum wage levels contributed to higher private sector labor costs.
This is the Federal Reserve’s favored measure on labor market inflation pressures.
Labor costs reaccelerate more than expected. We have seen a big jump in the US 1Q employment cost index of 1.2% quarter-on-quarter versus 0.9% in 4Q23, well above the 1% expected and above every single individual forecast in the Bloomberg survey. Not a good look as this is the Federal Reserve's favored measure of labor costs, and given labor costs are the largest cost input in a service sector-led economy, such as the US, it can help to keep price pressures elevated.
| |
The details show the strength was primarily led by the government sector where wage and salary growth rose from 4.7% year-on-year to 5% YoY, while for the private sector, wages and salaries remained at 4.3% YoY with overall compensation continuing to grow 4.1% YoY. In terms of QoQ rates, government worker compensation rose 1.3% versus 1.0% in 4Q23, while private industry compensation rose 1.1% versus 0.9% in 4Q 23. It is likely that a decent hike in minimum wages in around half the US states was the primary driver. The increase in minimum wage to $20/hour for California fast food workers will hit in 2Q. | |
|
UNIT LABOR COSTS
Echoing the market-worrying ECI data earlier in the week - Unit Labor Costs soared 4.7% in Q1 (well above the 4.0% expected and the 0.4% rise in Q4).
So wage inflation is confirmed - rising at the fastest pace in a year - as all the gains we have been told to expect from AI just aren't there in the data.
While quarterly productivity figures are quite volatile, a sustained slowdown represents another hurdle for the Federal Reserve’s inflation fight. With interest rates expected to stay at a two-decade high for awhile longer, business investment in equipment will likely continue to be a weak factor in overall economic growth.
Today's data corroborates other data that showed gross domestic product cooled in the first quarter while employment costs rose by the most in a year. As a result, inflation is proving stubborn, supporting the Fed’s pivot to a more hawkish stance that will keep interest rates higher for longer than anticipated.
| |
|
GLOBAL MACRO
WHAT DOES YOUR SCAN OF THE DATA BELOW TELL YOU? - THE MEDIA AVOIDS BAD NEWS!
We present the data in a way you can quickly see what is happening.
THIS WEEK WE SAW
Exp=Expectations, Rev=Revision, Prev=Previous
| |
|
UNITED STATES
- US Dallas Fed Manufacturing Business Index (Apr) -14.5 (Prev. -14.4)
- US Consumer Confidence (Apr) 97.0 vs. Exp. 104.0 (Prev. 104.7)
- US Chicago PMI (Apr) 37.9 vs. Exp. 45.0 (Prev. 41.4)
- US Employment Costs (Q1) 1.2% vs. Exp. 1.0% (Prev. 0.9%)
- US Monthly Home Price YY (Feb) 7.0% (Prev. 6.3%, Rev. 6.5%)
- US CaseShiller 20 YY NSA (Feb) 7.3% vs. Exp. 6.7% (Prev. 6.6%)
- US S&P Global Manufacturing PMI Final (Apr) 50.0 (Prev. 49.9)
- US ISM Manufacturing PMI (Apr) 49.2 vs. Exp. 50.0 (Prev. 50.3)
- US ISM Manufacturing Prices Paid (Apr) 60.9 vs. Exp. 55.0 (Prev. 55.8)
- US Construction Spending MM (Mar) -0.2% vs. Exp. 0.3% (Prev. -0.3%)
- US ADP National Employment (Apr) 192.0k vs. Exp. 175.0k (Prev. 184.0k, Rev. 208k)
- US JOLTS Job Openings (Mar) 8.488M vs. Exp. 8.686M (Prev. 8.756M, Rev. 8.813M)
- US Factory Orders MM (Mar) 1.6% vs. Exp. 1.6% (Prev. 1.4%, Rev. 1.2%)
- US Unit Labor Costs Prelim. (Q1) 4.7% vs. Exp. 3.3% (Prev. 0.4%)
- US Productivity Prelim. (Q1) 0.3% vs. Exp. 0.8% (Prev. 3.2%, Rev. 3.5%)
- US Initial Jobless Claims w/e 208.0k vs. Exp. 212.0k (Prev. 207.0k, Rev. 208k)
- US Continued Jobless Claims w/e 1.774M vs. Exp. 1.797M (Prev. 1.781M, Rev. 1.774M)
- US Non-Farm Payrolls (Apr) 175.0k vs. Exp. 243.0k (Prev. 303.0k, Rev. 315k); two month net revisions -22k (prev. +22k)
- US Unemployment Rate (Apr) 3.9% vs. Exp. 3.8% (Prev. 3.8%)
- US Average Earnings YY (Apr) 3.9% vs. Exp. 4.0% (Prev. 4.1%)
CHINA
- Chinese Industrial Profits YTD Y/Y (Mar) 4.3% (Prev. 10.2%)
- Chinese NBS Manufacturing PMI (Apr) 50.4 vs. Exp. 50.3 (Prev. 50.8)
- Chinese NBS Non-Manufacturing PMI (Apr) 51.2 vs. Exp. 52.3 (Prev. 53.0)
- Chinese Composite PMI (Apr) 51.7 (Prev. 52.7)
- Chinese Caixin Manufacturing PMI Final (Apr) 51.4 vs. Exp. 51.0 (Prev. 51.1)
JAPAN
- Japanese Industrial Production MM (Mar P) 3.8% vs. Exp. 3.5% (Prev. -0.6%)
- Japanese Retail Sales YY (Mar) 1.2% vs. Exp. 2.2% (Prev. 4.6%, Rev. 4.7%)
- Japanese Manufacturing PMI (Apr F) 49.6 (Prelim. 49.9)
UK
- UK BRC Shop Price Index YY (Apr) 0.8% (Prev. 1.3%)
- UK Lloyds Business Barometer (Apr) 42 (Prev. 42)
- UK S&P Global Manufacturing PMI (Apr) 49.1 vs. Exp. 48.7 (Prev. 48.7)
- UK Nationwide House Price MM (Apr) -0.4% vs. Exp. 0.2% (Prev. -0.2%); YY (Apr) 0.6% vs. Exp. 1.2% (Prev. 1.6%)
- UK S&P Global Manufacturing PMI (Apr) 49.1 vs. Exp. 48.7 (Prev. 48.7)
- UK S&P Global PMI: Composite - Output (Apr) 54.1 vs. Exp. 54 (Prev. 54); S&P Global Services PMI (Apr) 55.0 vs. Exp. 54.9 (Prev. 54.9)
TURKEY
- Turkish CPI YY (Apr) 69.8% vs. Exp. 70.33% (Prev. 68.5%); Core 75.81% (exp. 75.70%
NEW ZEALAND
- New Zealand HLFS Job Growth QQ (Q1) -0.2% vs. Exp. 0.3% (Prev. 0.4%)
- New Zealand HLFS Unemployment Rate (Q1) 4.3% vs. Exp. 4.2% (Prev. 4.0%)
- New Zealand HLFS Participation Rate* (Q1) 71.5% vs. Exp. 71.9% (Prev. 71.9%)
- New Zealand Labor Cost Index QQ (Q1) 0.8% vs. Exp. 0.8% (Prev. 1.0%)
- New Zealand Labor Cost Index YY (Q1) 3.8% vs. Exp. 3.8% (Prev. 3.9%)
| | |
|
EU
- EU Consumer Confidence Final (Apr) -14.7 vs. Exp. -14.7 (Prev. -14.7)
- EU Business Climate (Apr) -0.53 (Prev. -0.30, Rev. -0.32)
- EU Services Sentiment (Apr) 6.0 vs. Exp. 6.7 (Prev. 6.3, Rev. 6.4)
- EU Industrial Sentiment (Apr) -10.5 vs. Exp. -8.6 (Prev. -8.8, Rev. -8.9)
- EU Economic Sentiment (Apr) 95.6 vs. Exp. 96.7 (Prev. 96.3, Rev. 96.2)
- EU GDP Flash QQ (Q1) 0.3% vs. Exp. 0.2% (Prev. 0.0%, Rev. -0.1%)
- EU GDP Flash YY (Q1) 0.4% vs. Exp. 0.2% (Prev. 0.1%)
- EU HICP Flash YY (Apr) 2.4% vs. Exp. 2.4% (Prev. 2.4%)
- EU HICP-X F&E Flash YY (Apr) 2.8% vs. Exp. 2.9% (Prev. 3.1%)
- EU HCOB Manufacturing Final PMI (Apr) 45.7 vs. Exp. 45.6 (Prev. 45.6)
- EU Unemployment Rate (Mar) 6.5% vs. Exp. 6.5% (Prev. 6.5%)
GERMANY
- German CPI Prelim. MM (Apr) 0.5% vs. Exp. 0.6% (Prev. 0.4%)
- German CPI Prelim. YY (Apr) 2.2% vs. Exp. 2.3% (Prev. 2.2%)
- German HICP Prelim. MM (Apr) 0.6% vs. Exp. 0.6% (Prev. 0.6%)
- German HICP Prelim. YY (Apr) 2.4% vs. Exp. 2.3% (Prev. 2.3%)
- German GDP Flash QQ (Q1) 0.2% vs. Exp. 0.1% (Prev. -0.3%)
- German GDP Flash YY NSA (Q1) -0.9% vs. Exp. -0.8% (Prev. -0.4%)
- German Unemployment Change SA (Apr) 10k vs. Exp. 9k (Prev. 4k)
- German Unemployment Rate SA (Apr) 5.9% vs. Exp. 5.9% (Prev. 5.9%)
- German HCOB Manufacturing PMI (Apr) 42.5 vs. Exp. 42.2 (Prev. 42.2)
ITALY
- Italian HCOB Manufacturing PMI (Apr) 47.3 vs. Exp. 50 (Prev. 50.4)
FRANCE
- French CPI Prelim YY NSA (Apr) 2.2% vs. Exp. 2.2% (Prev. 2.3%)
- French CPI (EU Norm) Prelim YY (Apr) 2.4% vs. Exp. 2.2% (Prev. 2.4%)
- French HCOB Manufacturing PMI (Apr) 45.3 vs. Exp. 44.9 (Prev. 44.9)
- French Industrial Output MM (Mar) -0.3% vs. Exp. 0.3% (Prev. 0.2%); Budget Balance (Mar) -52.78B (Prev. -44.03B))
SPAIN
- Spanish CPI YY Flash NSA (Apr) 3.3% (Prev. 3.2%)
- Spanish HICP Flash YY (Apr) 3.4% vs. Exp. 3.3% (Prev. 3.3%)
TURKEY
- Turkish CPI YY (Apr) 69.8% vs. Exp. 70.33% (Prev. 68.5%); Core 75.81% (exp. 75.70%
AUSTRALIA
- Australian Retail Sales MM Final (Mar) -0.4% vs. Exp. 0.2% (Prev. 0.3%)
- Australian Manufacturing PMI (Apr F) 49.6 (Prelim. 49.9)
- Australian AIG Manufacturing Index (Apr) -13.9 (Prev. -7.0)
- Australian AIG Construction Index (Apr) -25.6 (Prev. -12.9)
- Australian Building Approvals MM (Mar) 1.9% vs. Exp. 3.0% (Prev. -1.9%, Rev. -0.9%)
- Australian Trade Balance (AUD)(Mar) 5.0B vs. Exp. 7.3B (Prev. 7.3B)
- Australian Goods/Services Exports (Mar) 0.10% (Prev. -2.20%)
- Australian Goods/Services Imports (Mar) 4.20% (Prev. 4.80%)
- Australian Judo Bank Services PMI Final (Apr) 53.6 (Prelim. 54.2)
- Australian Judo Bank Composite PMI Final (Apr) 53.0 (Prelim. 53.6)
| |
CURRENT MARKET PERSPECTIVE | |
|
LOTS OF MIXED SIGNALS THIS WEEK
A LIKELY LATE CYCLE SPX TRADING RANGE 4800 - 5200
Click All Charts to Enlarge
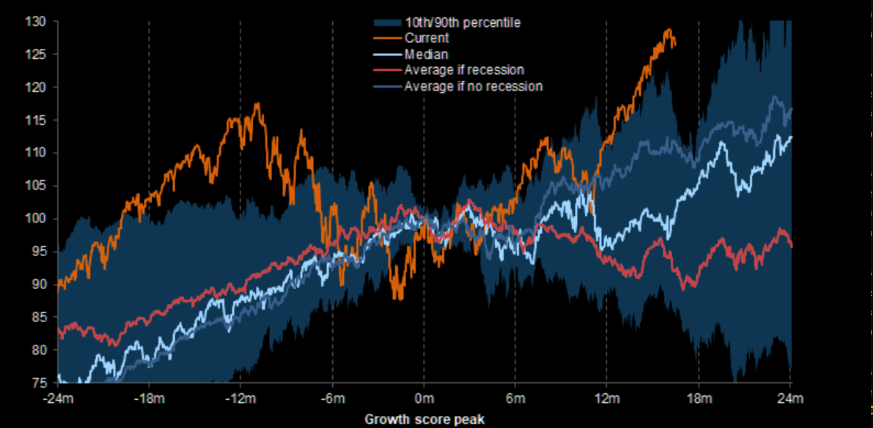
| |
LATE CYCLE: Bidenomics (Bubble-nomics) has inserted ~$6.7T in government spending into the economy, which has extended the current late business cycle positioning through the presidential period. Equities can continue to perform well in late cycle backdrops, especially if there is no recession, which the market has recently reduced the probability of this occurring (to "no-landing"). | |
|
1 - SITUATIONAL ANALYSIS
There were plenty of signals this week from the FOMC to the Labor Report resulting in big moves down in Yields. However, the markets are left with no clear direction.
Barring new date or a triggering event, the expectations are for the markets to be range bound in the near term.
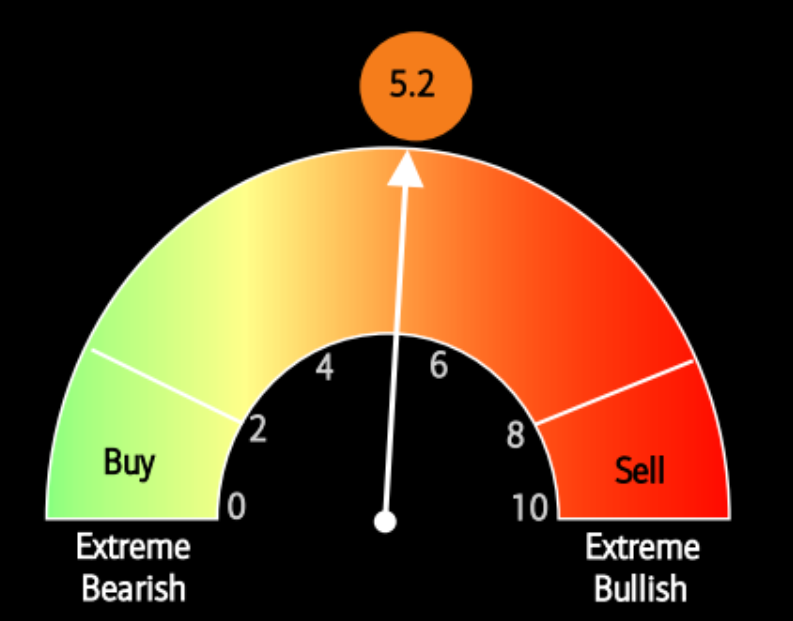
Panic Out (temporarily) - Trading Range In!
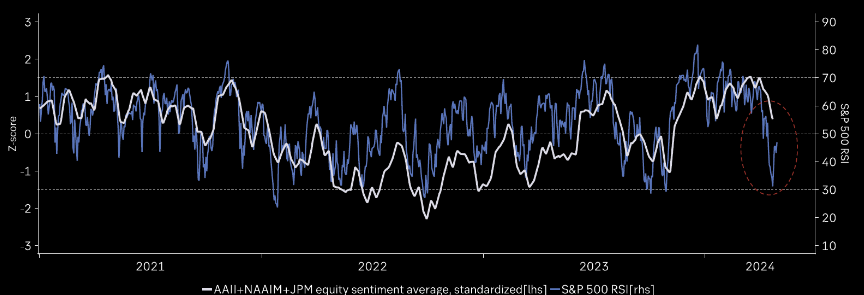
Sentiment as represented by the Fear:Greed Index is as close to neutral as it gets. This is also suggestive of a trading range until the market gives a stronger trend direction or a triggering event occurs.(CHART RIGHT)
CHART BELOW: SPX futures closed right on the 50 day moving average and the short term negative trend line. The Trading Range is likely between 5200 on the upside and possibly as low as 4800 on the downside.
| |
|
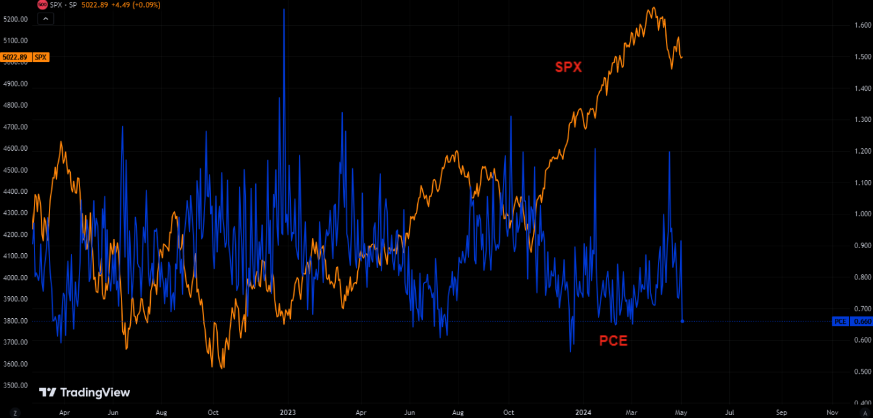
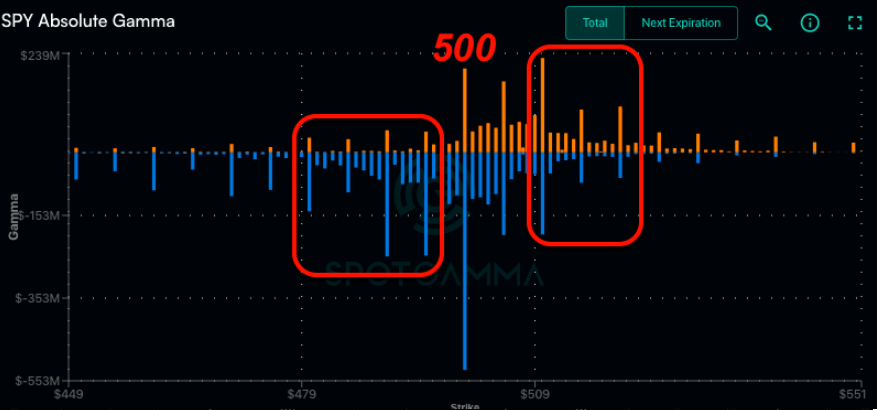
The crowd managed to load up on puts just in time for the bounce in equities. They have now decided to "puke puts". There is a reason the crowd is the crowd.(CHART RIGHT)
CHART BELOW
5k is the line in sand level from a gamma point of view. For now 5k is "sticky", but this could change abruptly. Spotgamma's assessment is: "...we think that a full short signal is only a break of 4,980, which may then lead to a test of 4,800".
| |
AS GO THE BANKS, SO GO THE MARKETS - AS GO THE FINANCIALS, SO GO THE BANKS! | |
|
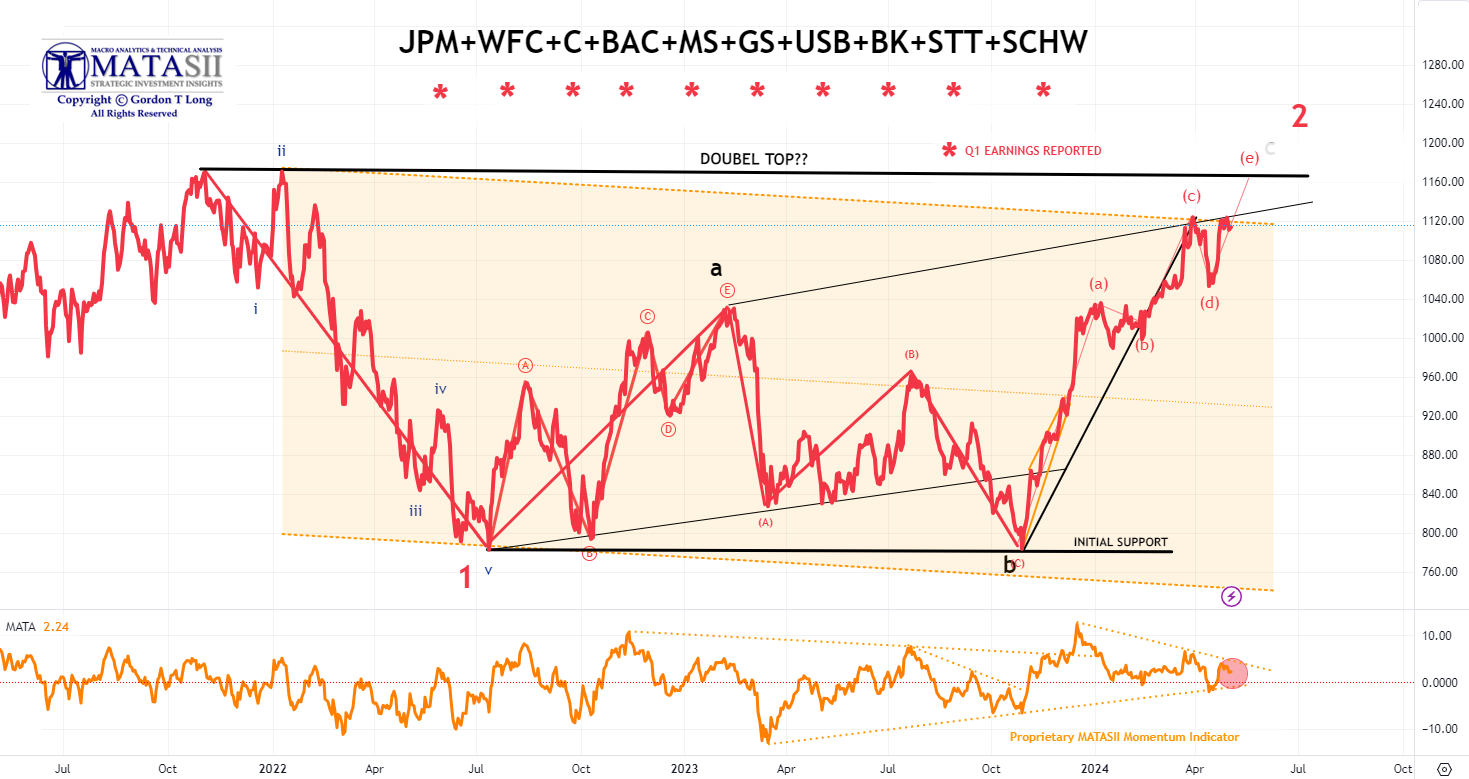
1- BANKING STOCKS
- Bank stocks, though initially weak on earnings release, have been trending up ever since.
- Presently testing underside of rising trend line.
- The pattern presently appears unfinished until a potential "Double Top" is completed.
| |
|
YOUR DESKTOP / TABLET / PHONE ANNOTATED CHART
Macro Analytics Chart Above: SUBSCRIBER LINK
| |
|
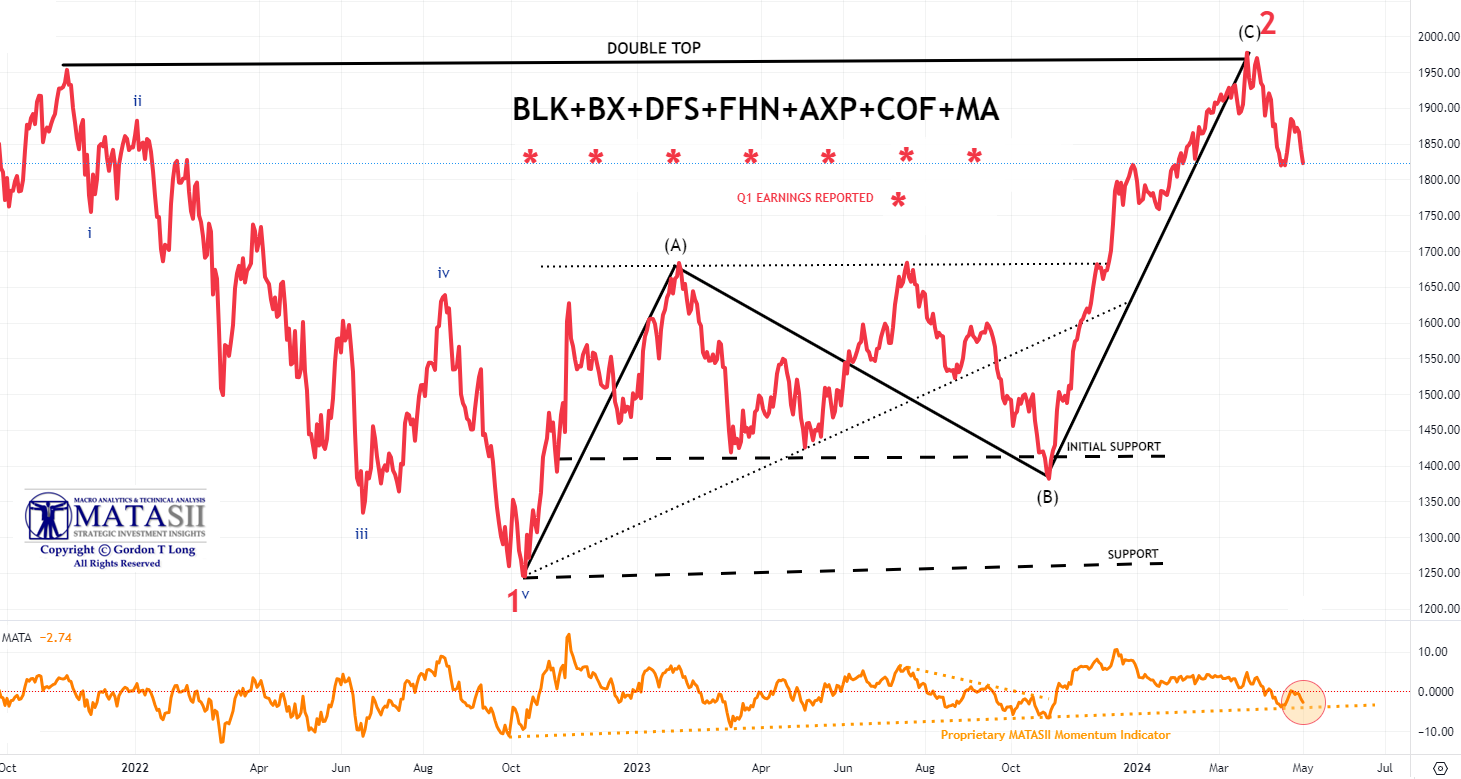
2- FINANCIAL STOCKS
- The Financial stocks appear to have already put in an intermediate double top.
- Momentum (lower pane) may act as near term support.
| |
|
YOUR DESKTOP / TABLET / PHONE ANNOTATED CHART
Macro Analytics Chart Above: SUBSCRIBER LINK
| |
CHART BELOW
- Note the Critical Support Trend line (in black) below.
- This support is likely to need to be tested before further upside gets underway. If decisively broken, the markets will test the lower end of the trading range.
| |
|
YOUR DESKTOP / TABLET / PHONE ANNOTATED CHART
Macro Analytics Chart Above: SUBSCRIBER LINK
| |
|
2 - FUNDAMENTAL ANALYSIS
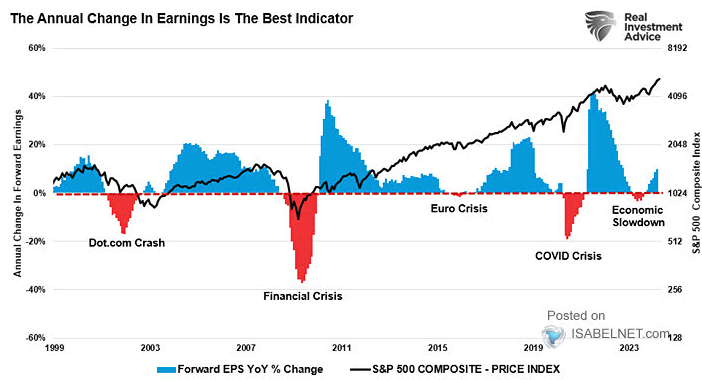
RISING FORWARD EPS Y-O-Y CHANGE CHART RIGHT
When forward earnings are rising, it is generally viewed as a positive signal for higher equity prices and can help minimize the risk of a potential deeper market correction. (chart right)
However ....
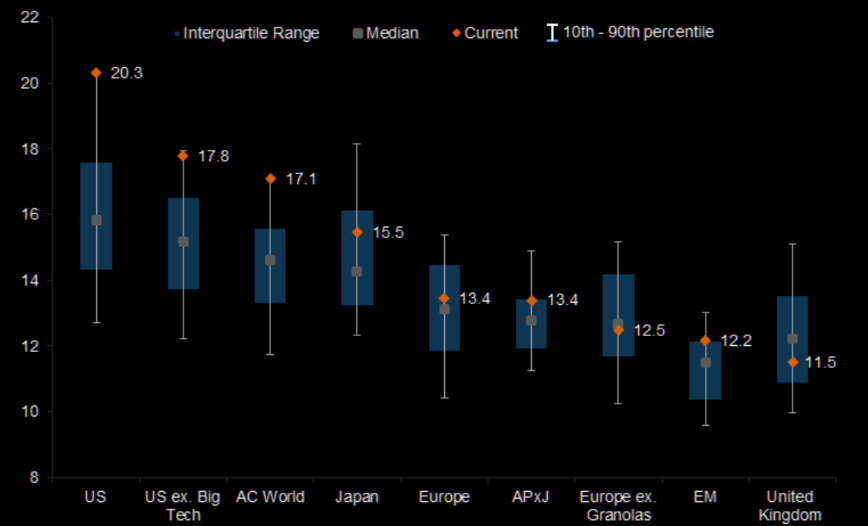
EQUITY MARKETS ARE EXPENSIVE
Equity markets are expensive, particularly in the US. The Chart Below highlights forward P/E multiple by MSCI Regions with data for the last 20 years.
| |
|
CREDIT MARKETS LEAD
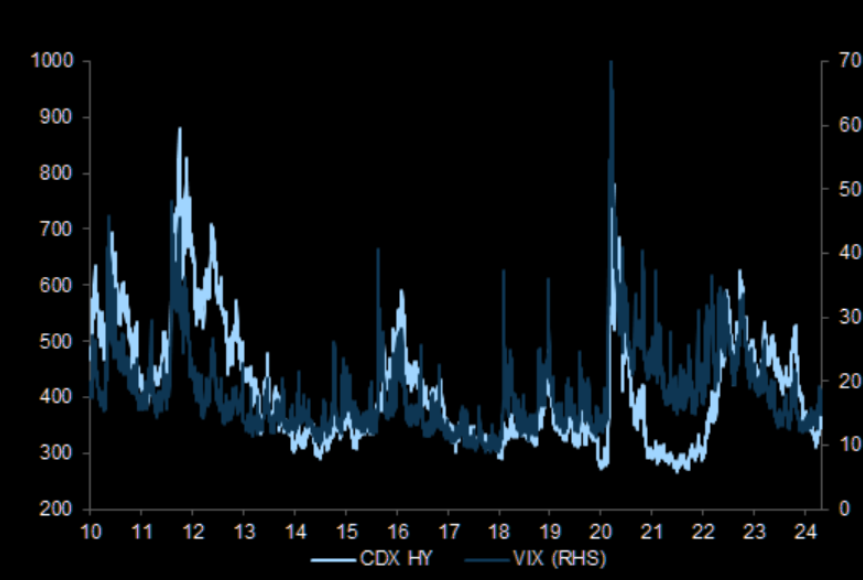
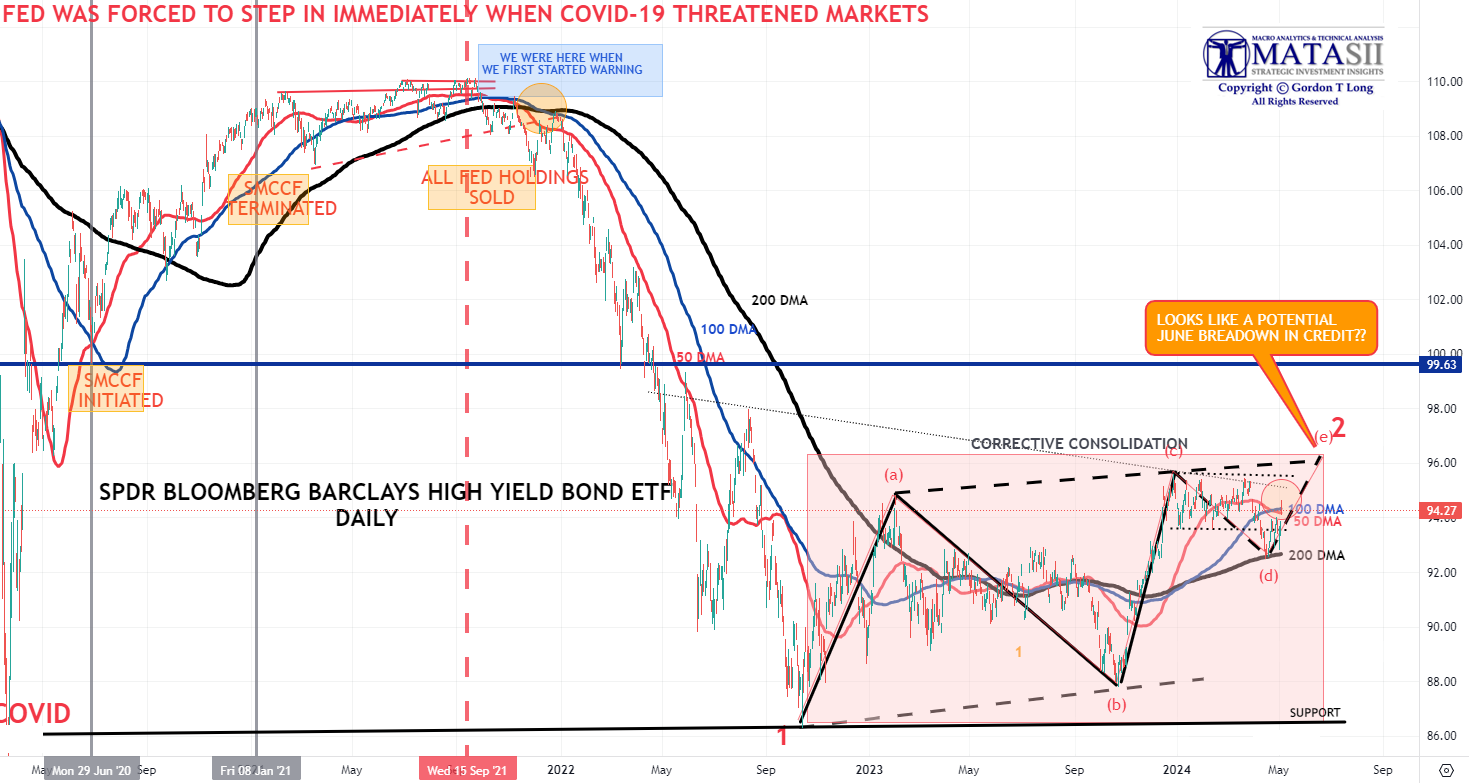
As you are well aware, we are strong believers that Credit Markets LEAD while Equity & Bond Markets FOLLOW. As such Credit Spreads have been highly skeptical the equity was going to selloff significantly.
CHART RIGHT: Credit spreads have been anchored alongside equity volatility
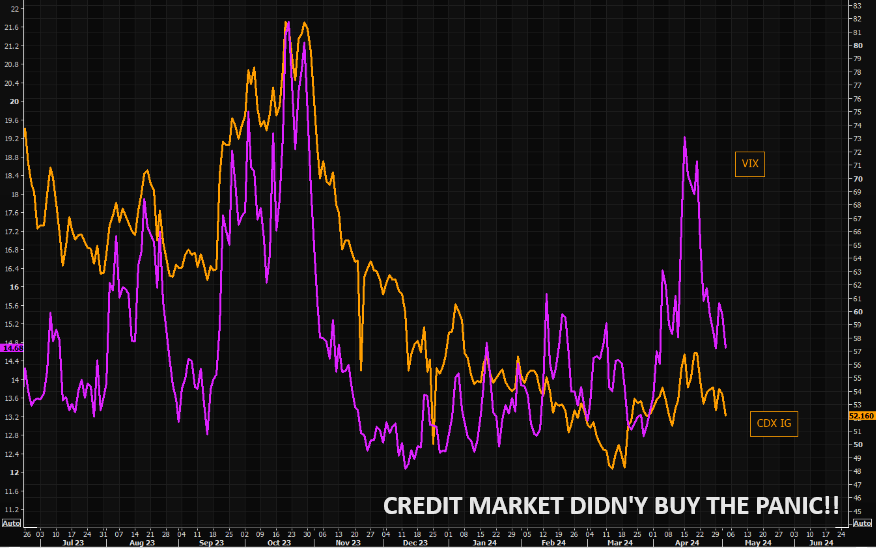
CHART BELOW: The CDX IG popped higher when VIX went crazy a few weeks ago, but the credit move was very controlled. Note things are back to "normal" in credit protection land. CDX IG closed at the lowest levels in a few weeks.
| |
THE SPDR BLOOMBERG BARCLAYS HIGH YIELD BOND ETF - Daily | |
|
YOUR DESKTOP / TABLET / PHONE ANNOTATED CHART
Macro Analytics Chart Above: SUBSCRIBER LINK
| |
|
3 - TECHNICAL ANALYSIS
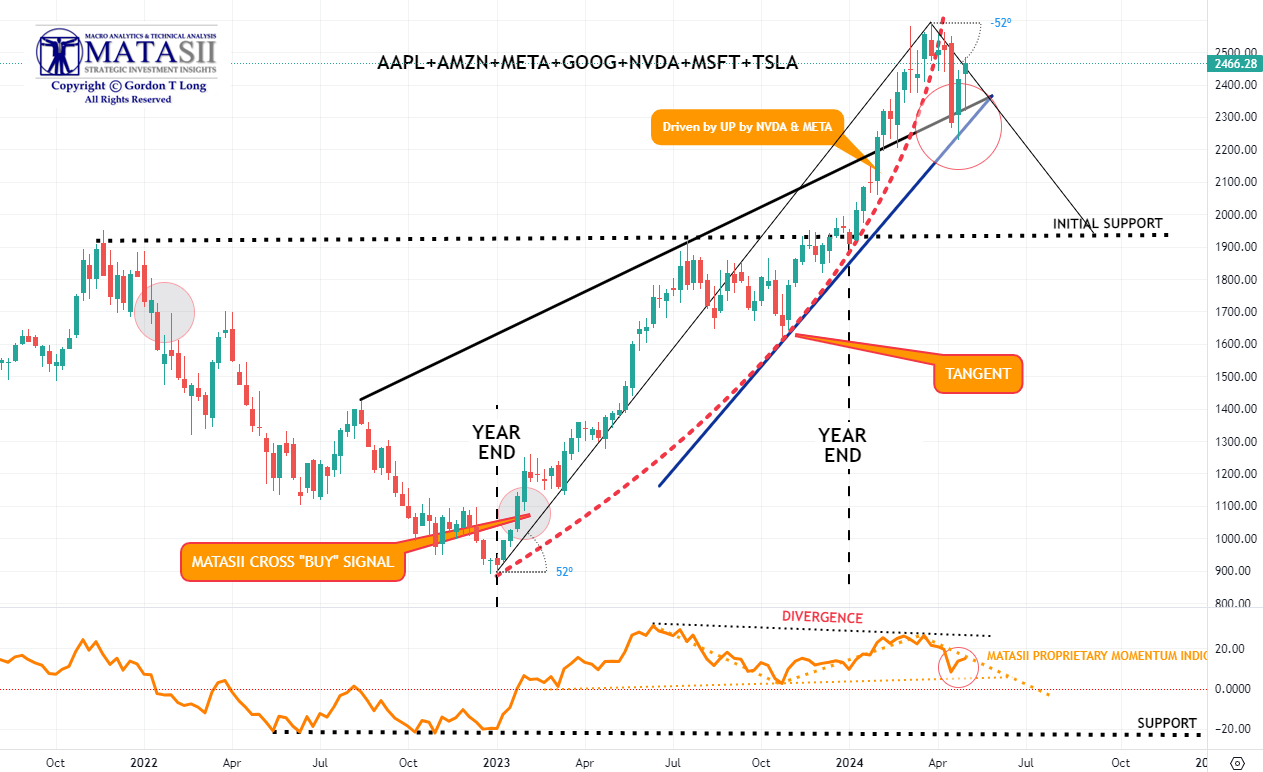
MAGNIFICENT 7
- We were reaching the vertical lift part of the parabolic (geometric) lift shown by the dashed red line before falling off and then lifting after the release of the Labor Report on Friday.
- In the short term, Momentum (bottom pane) is testing the overhead Momentum trend line resistance level (dotted orange line).
| |
YOUR DESKTOP / TABLET / PHONE ANNOTATED CHART
Macro Analytics Chart Above: SUBSCRIBER LINK
| |
|
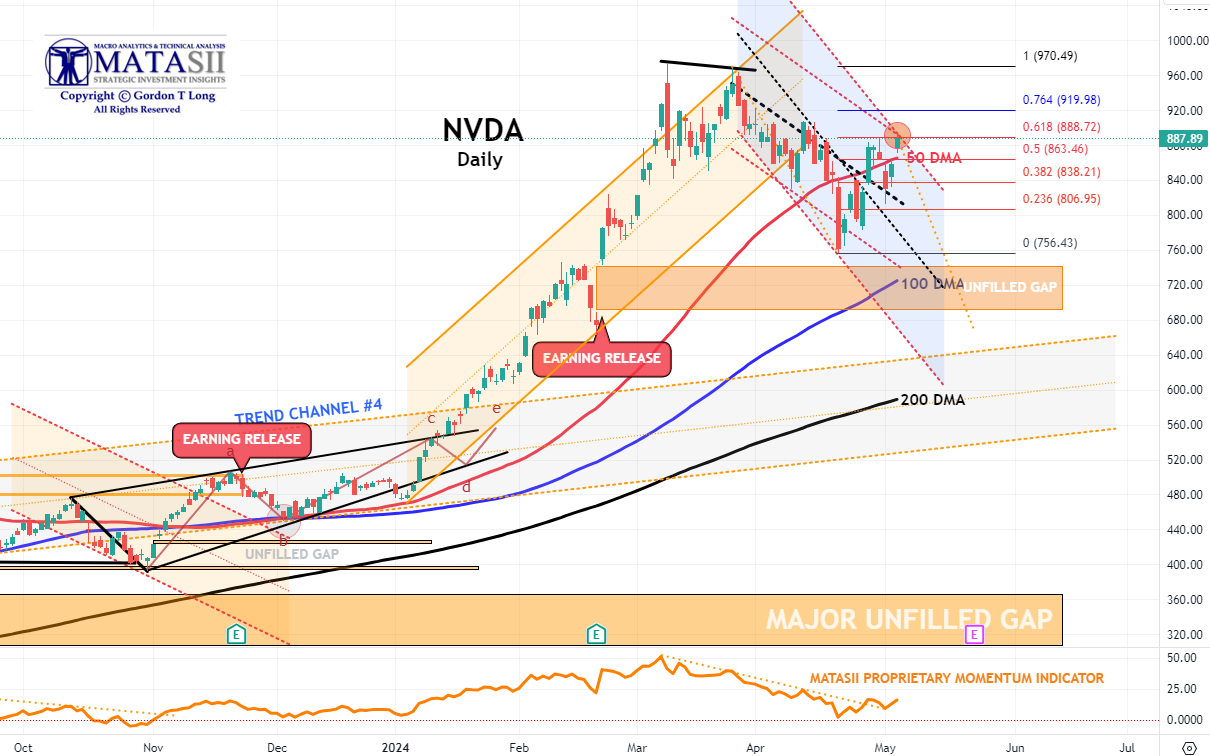
NVDA - Daily
- NVDA again broke through the overhead 50 DMA on a retest to reach a 61.8% Fibonacci Retracement level..
- NVDA Momentum (lower pane) has also broken through its overhead resistance trend line (dotted orange trend line).
- This counter rally has been noticeably strong for NVDA but appears to exhibit corrective characteristics (overlapping price movement), whereas the downward pattern from NVDA's highs appears "Impulsive" (less overlapping price movement & a "five" wave count).
- The pattern is currently suggesting we are in a corrective wave 2 of what will be a downward 5 count.
- With earnings release fast approaching(marked by the red "E" box) this potentially could be a set-up for NVDA to move towards its 200 DMA for support. Even strong earnings could be found to "disappoint" on any newly appearing concerns?
| |
|
YOUR DESKTOP / TABLET / PHONE ANNOTATED CHART
Macro Analytics Chart Above: SUBSCRIBER LINK
| |
|
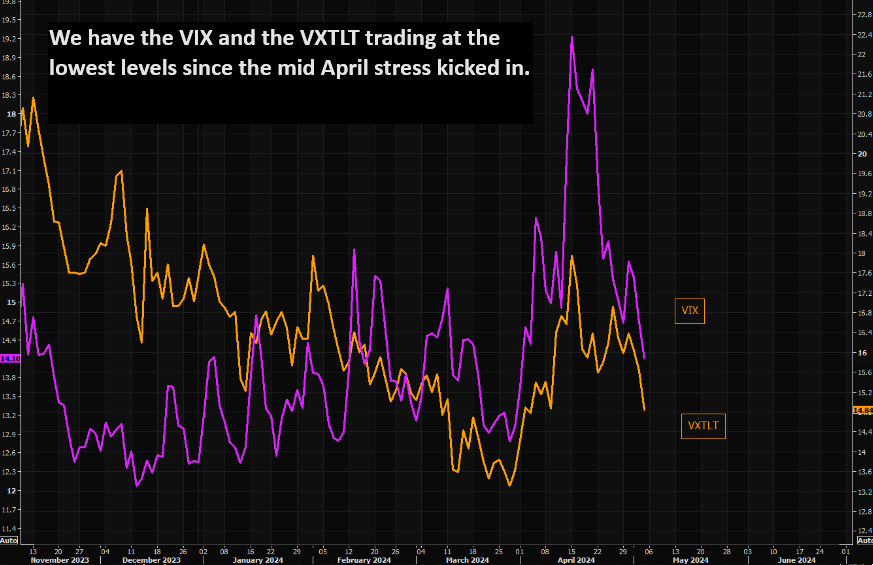
"CURRENCY" MARKET (Currency, Gold, Black Gold (Oil) & Bitcoin)
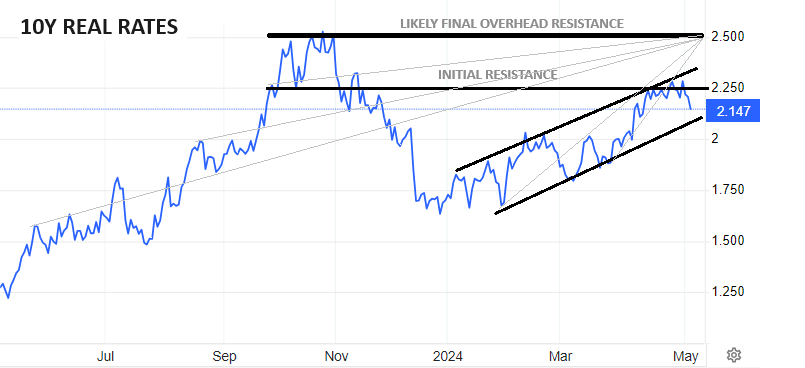
CHART RIGHT: Real Rates reached our initial overhead resistance level of 2.25% before falling off hard with Friday's Labor Report.
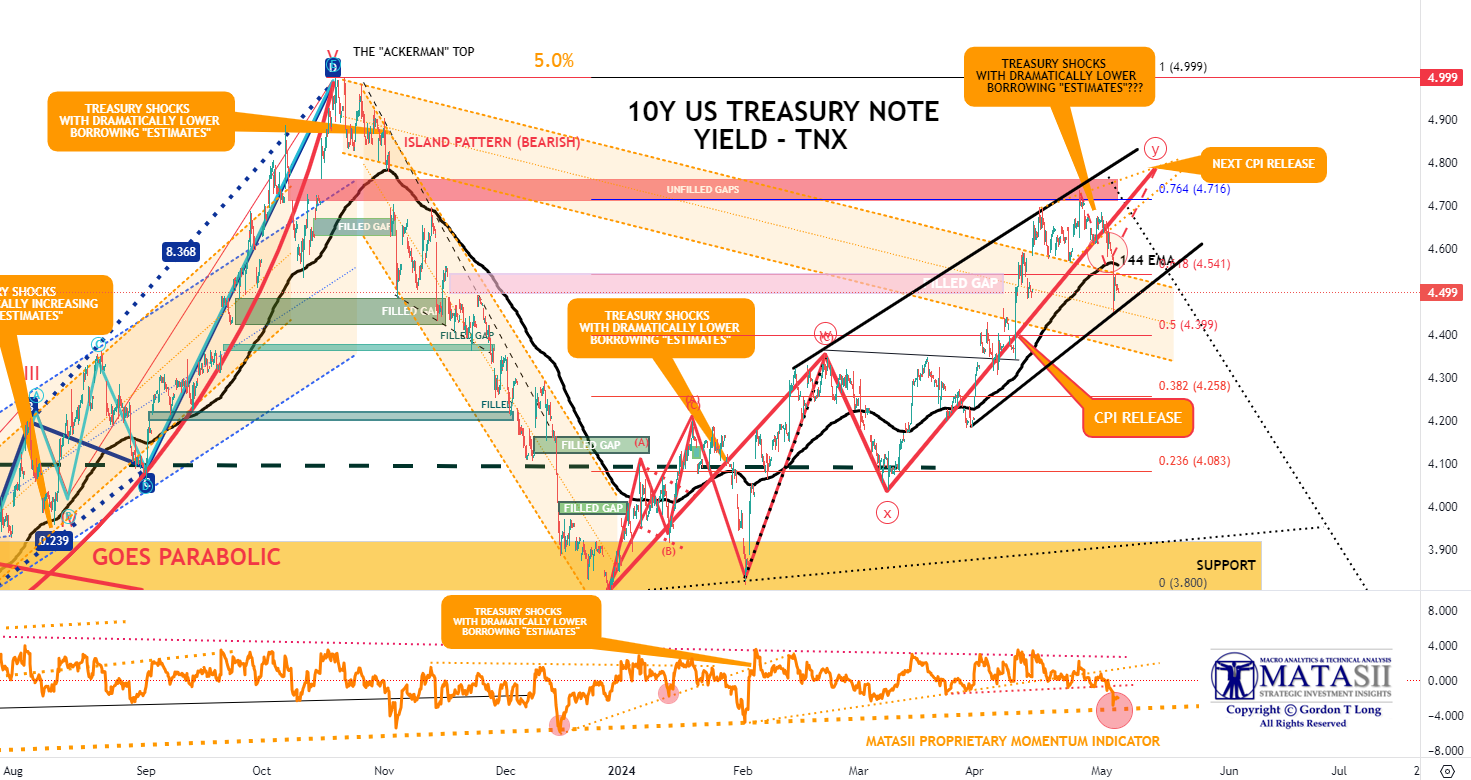
TRADING RANGE: Equity markets reacted to labor market pressures associated with a weakening Jobs Report (Friday). Yields & Rates will likely test the lower trend line (chart above right) as it waits on the next CPI report scheduled for release on May 15th.
CONTROL PACKAGE
There are TEN charts we have outlined in prior chart packages, which we will continue to watch closely as a CURRENT "control set".
-
US DOLLAR -DXY - MONTHLY (CHART LINK)
-
US DOLLAR - DXY - DAILY (CHART LINK)
-
GOLD - DAILY (CHART LINK)
-
GOLD cfd's - DAILY (CHART LINK)
-
GOLD - Integrated - Barrick Gold (CHART LINK)
- SILVER - DAILY (CHART LINK)
-
OIL - XLE - MONTHLY (CHART LINK)
-
OIL - WTIC - MONTHLY - (CHART LINK)
-
BITCOIN - BTCUSD -WEEKLY (CHART LINK)
-
10y TIPS - Real Rates - Daily (CHART LINK)
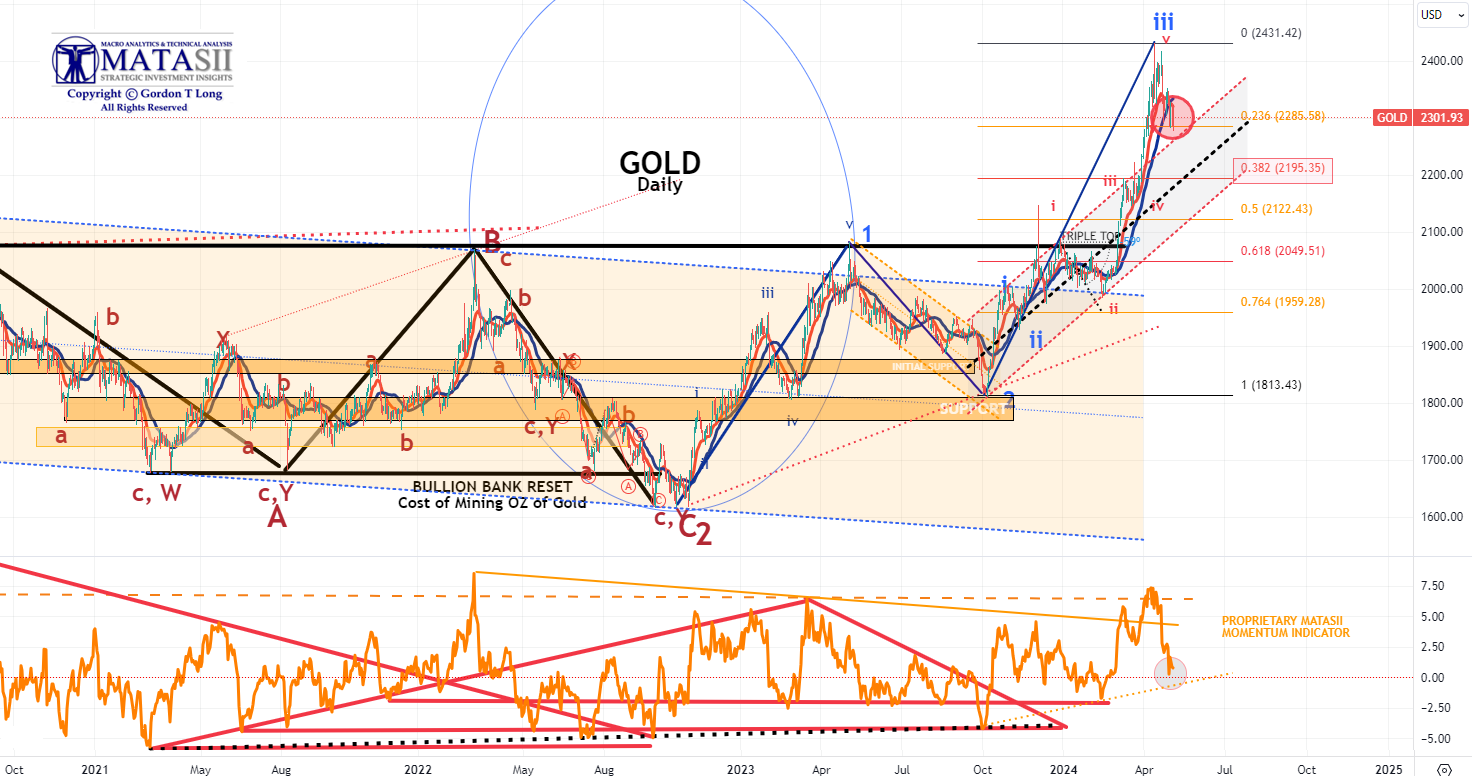
GOLD - DAILY
- Gold pulled back on Monday finding initial support at the 23.6% Fibonacci Retracement level.
- Gold Momentum (lower pane) is likely looking for support slightly lower at the dotted orange trend line.
- It appears that this initial corrective leg is an "A" wave of an ABC corrective pattern before heading higher when completed. The "C" down leg of the ABC is likely to find firm support at the 38.2% Fibonacci Retracement level (orange red box).
|  | |
YOUR DESKTOP / TABLET / PHONE ANNOTATED CHART
Macro Analytics Chart Above: SUBSCRIBER LINK
| |
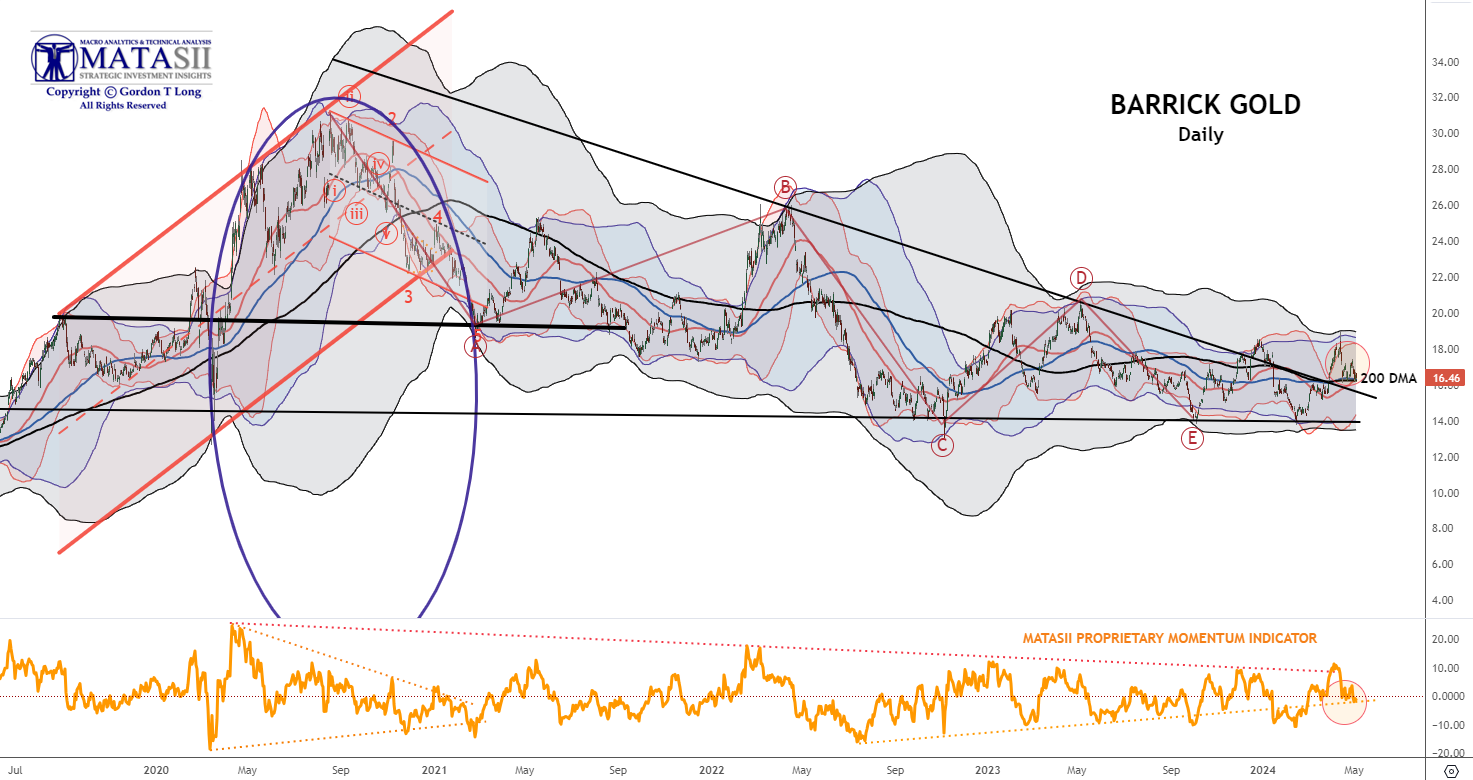
INTEGRATED GOLD MINERS
BARRICK GOLD - Daily
We continue to have a close eye on Gold and the INTEGRATED GOLD MINERS as represented by Barrick Gold.
- Barrick has broken out of its long term declining overhead resistance trend.
- Barrick has pulled back with Gold Bullion finding support at its long term 200 DMA.
- This may potentially be a good opportunity to add to your Integrated Miners positions.
| |
|
YOUR DESKTOP / TABLET / PHONE ANNOTATED CHART
Macro Analytics Chart Above: SUBSCRIBER LINK
| |
|
US EQUITY MARKETS
If this is a mild 5-10% correction, investor sentiment should bottom soon around neutral. (Chart Right)
| |
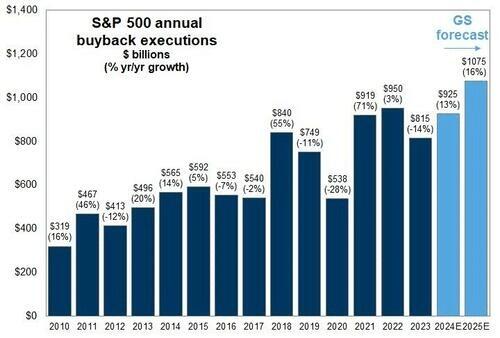
CORPORATE BUYBACKS
Corporate share buybacks will resume in the next couple of weeks, and with more than $1 trillion slated for 2024, many buybacks remain to complete. Such is particularly the case with Google adding another $70 billion to that total.
CONTROL PACKAGE
There have FIVE charts we have outlined in prior chart packages that we will continue to watch closely as a CURRENT "control set".
- The S&P 500 (CHART LINK)
- The DJIA (CHART LINK)
- The Russell 2000 through the IWM ETF (CHART LINK)
- The MAGNIFICENT SEVEN (CHART ABOVE WITH MATASII CROSS - LINK)
- Nvidia (NVDA) (CHART LINK)
| |
S&P 500 CFD
- The S&P 500 cfd bounced off its 100 DMA once again to only subsequently retrace to test its 50 DMA a second time.
- Momentum (lower pane) also bounced off its lower support to a more neutral level.
- Expect the Moving Averages (50/100/200 DMA) to narrow and tighten.
- We have a trading range set-up as the market looks for more guidance and corporate buybacks to resume.
| |
YOUR DESKTOP / TABLET / PHONE ANNOTATED CHART
Macro Analytics Chart Above: SUBSCRIBER LINK
| |
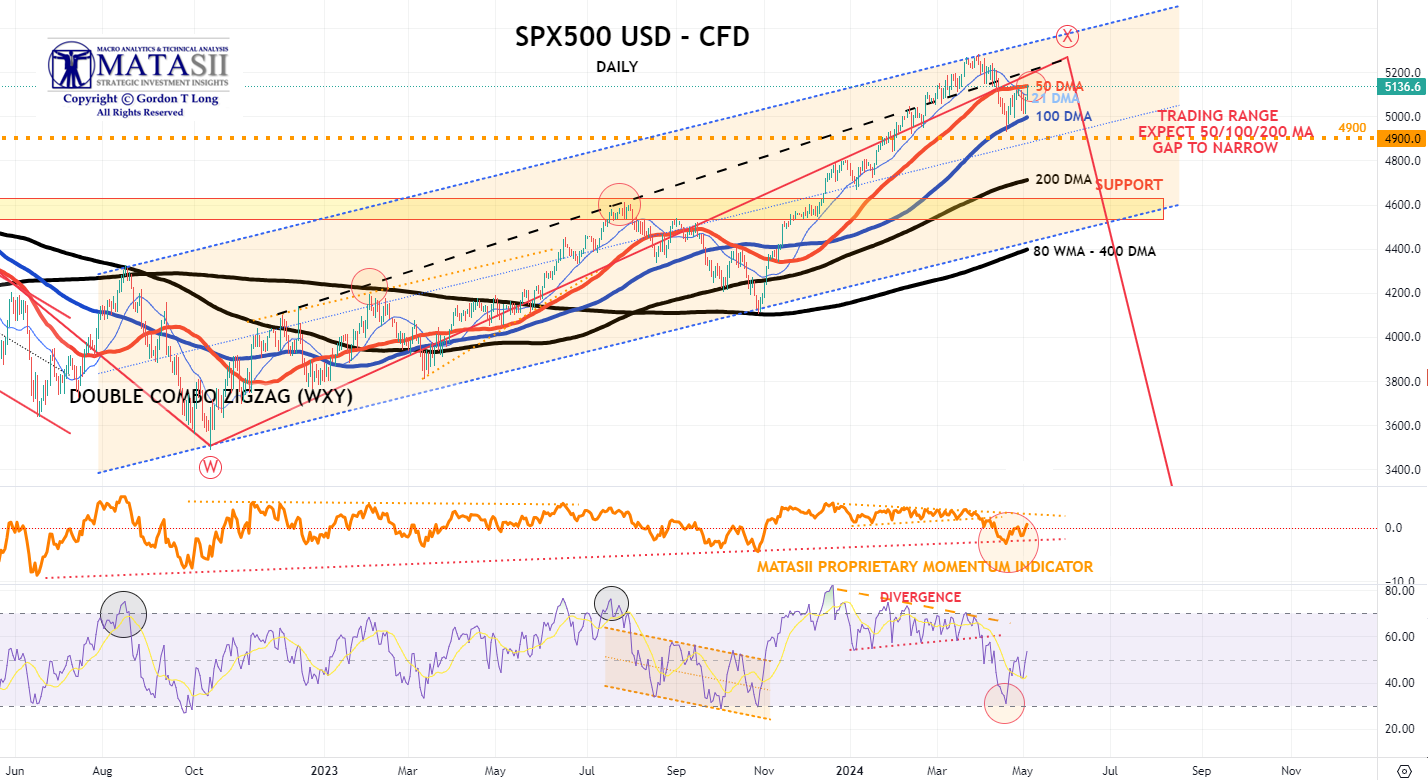
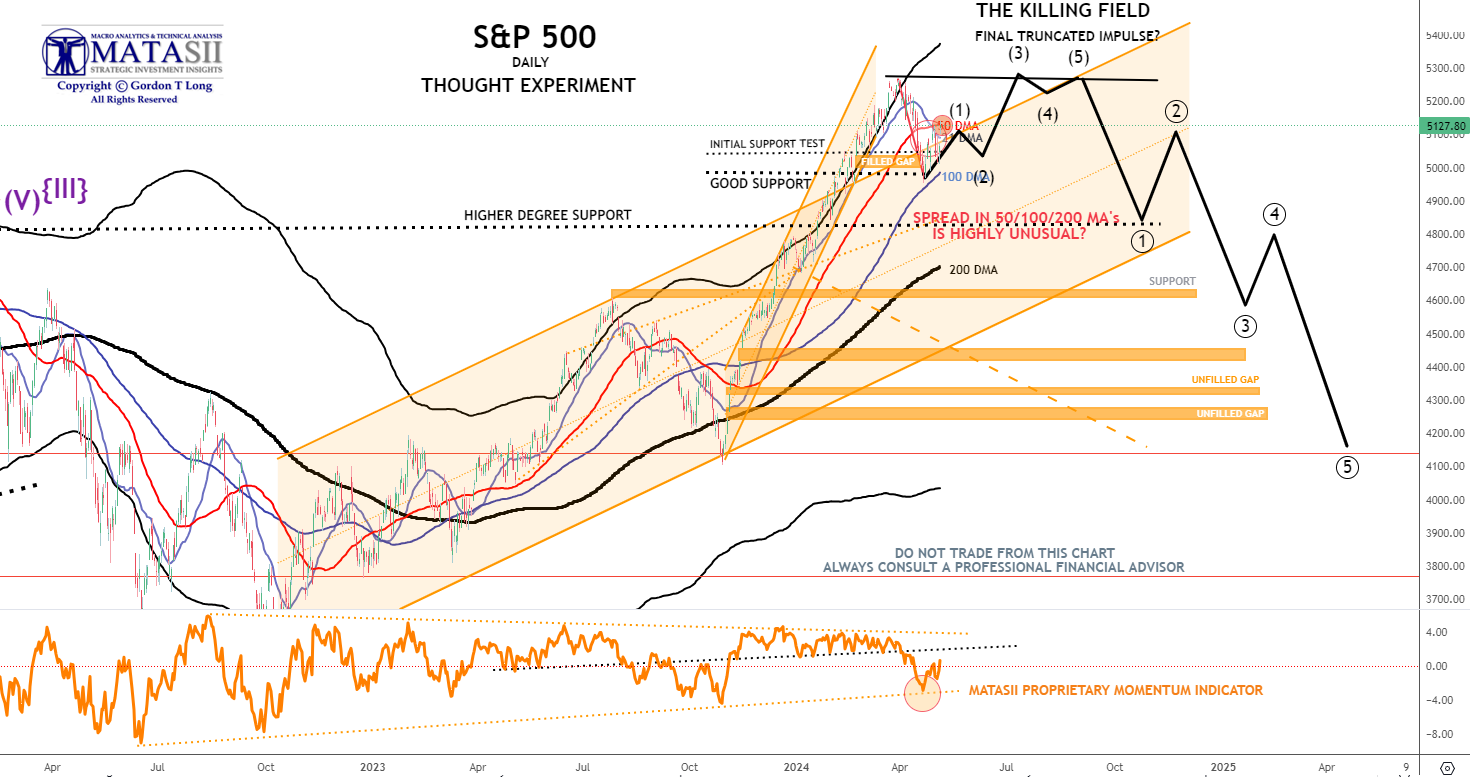
S&P 500 - Daily - Our Though Experiment
Our Though Experiment, which we have discussed many times previously in the way of a projection, suggests we have put in a near term top and will now consolidate before possibly completing one final small impulse higher OR put in a final Wave 5 of a higher degree.
NOTE: To reiterate what I previously wrote - "the black labeled activity shown below, between now and July, looks like a "Killing Field" where the algos take Day Traders, "Dip Buyers", the "Gamma Guys" and FOMO's all out on stretchers!"
- The S&P 500 bounced off its 100 DMA once again to only subsequently retrace to test its 50 DMA a second time.
- Momentum (lower pane) also found support at its lower trend support line before beginning to retrace towards its upper trend momentum. From a momentum perspective it appears to still have further upside to go.
- We appear to be in a short term trading range as the market looks for more guidance and corporate buybacks to resume..
OUR CURRENT ASSESSMENT IS THAT THE INTERMEDIATE TERM IS LIKELY TO LOOK LIKE THE FOLLOWING:
|  | |
YOUR DESKTOP / TABLET / PHONE ANNOTATED CHART
Macro Analytics Chart Above: SUBSCRIBER LINK
| |
STOCK MONITOR: What We Spotted
| |
BOND MARKET
CONTROL PACKAGE
There have FIVE charts we have outlined in prior chart packages that we will continue to watch closely as a CURRENT "control set".
- The 10Y TREASURY NOTE YIELD - TNX - HOURLY (CHART LINK)
- The 10Y TREASURY NOTE YIELD - TNX - DAILY (CHART LINK)
- The 10Y TREASURY NOTE YIELD - TNX - WEEKLY (CHART LINK)
- The 30Y TREASURY BOND YIELD - TNX - WEEKLY (CHART LINK)
- REAL RATES (CHART LINK)
FISHER'S EQUATION = 10Y Yield = 10Y INFLATION BE% +REAL % = 2.359% + 2.147% = 4.506%
- The TNX broke through support at its 144 EMA (solid black moving average) on Friday's Labor Report. It appears to have found near term support which it bounced off of.
- The TNX appears to have Momentum support (lower pane) at a long term support trend line.
| |
YOUR DESKTOP / TABLET / PHONE ANNOTATED CHART
Macro Analytics Chart Above: SUBSCRIBER LINK
| |
NOTICE Information on these pages contains forward-looking statements that involve risks and uncertainties. Markets and instruments profiled on this page are for informational purposes only and should not in any way come across as a recommendation to buy or sell in these assets. You should do your own thorough research before making any investment decisions. MATASII.com does not in any way guarantee that this information is free from mistakes, errors, or material misstatements. It also does not guarantee that this information is of a timely nature. Investing in Open Markets involves a great deal of risk, including the loss of all or a portion of your investment, as well as emotional distress. All risks, losses and costs associated with investing, including total loss of principal, are your responsibility.
FAIR USE NOTICE This site contains copyrighted material the use of which has not always been specifically authorized by the copyright owner. We are making such material available in our efforts to advance understanding of environmental, political, human rights, economic, democracy, scientific, and social justice issues, etc. We believe this constitutes a ‘fair use’ of any such copyrighted material as provided for in section 107 of the US Copyright Law. In accordance with Title 17 U.S.C. Section 107, the material on this site is distributed without profit to those who have expressed a prior interest in receiving the included information for research and educational purposes. If you wish to use copyrighted material from this site for purposes of your own that go beyond ‘fair use’, you must obtain permission from the copyright owner.
========
| |
MATASII'S STRATEGIC INVESTMENT INSIGHTS | |
2020 VIDEOS OUTLINING THE COMING RISE IN INFLATION, STAGLFLATION & COMMODITY PRICES | |
IDENTIFICATION OF HIGH PROBABILITY TARGET ZONES | |
Learn the HPTZ Methodology!
Identify areas of High Probability for market movements
Set up your charts with accurate Market Road Maps
Available at Amazon.com
| |
The Most Insightful Macro Analytics On The Web | | | | |