|
UnderTheLens - MARCH 2024
Macro Analytics - 03/04/24
| |
THE CREDIT ADDICTED "YOLO" CONSUMER
OBSERVATIONS: THE POLITICAL CLASS HAS SIMPLY LOST THEIR WAY
Our US political leaders, (I like to call them the "Political Class" because they have become divorced from "Mainstreet"), have been very busy since the Biden Regime took control with what they perceive as important:
- Open Borders with ~10M homeless and unemployed Illegal Immigrants dropped on an overburdened medical, police and community social service providers
- Wars (Ukraine, Syria, Yemen ...) and Economic Sanctions
- Spending ~$7T, which caused inflation and then fighting Inflation with disruptive and destabilizing interest rates
- Diversity Equity and Inclusion (DEI)
- Environmental, Social, & Governance (ESG)
- Transgenderism
- Woke (ism) and CRT
- Climate Change, Net Zero roll-out and Renewable Energy
- Vaccine rollouts and Mandates
- Pandemic Lockdowns
- Criminal charges, court cases and investigations of our political leaders
- Weaponization of Government agencies against political rivals
- Bank Meltdowns
- Government bond market meltdowns
- CBDCs, Crypto crackdowns
.... and so .... so... much more.
Shockingly (maybe not so shockingly), all of the above have absolutely no relationship to what "We The People" are facing and need, as standards of living and real disposable incomes are crushed to pay for these policies.
- Despite a cooling inflation rate, Americans face average food prices in U.S. cities being 20% since Biden took office.
- Gas prices are still about one-third higher than pre-Bidenomic levels.
- Gallup survey reveals that 48% of adults rated economic conditions as “poor,” the highest share in a year and getting worse.
- The University of Michigan’s monthly survey found that 20% of consumers felt their personal finances had deteriorated during Biden’s tenure.
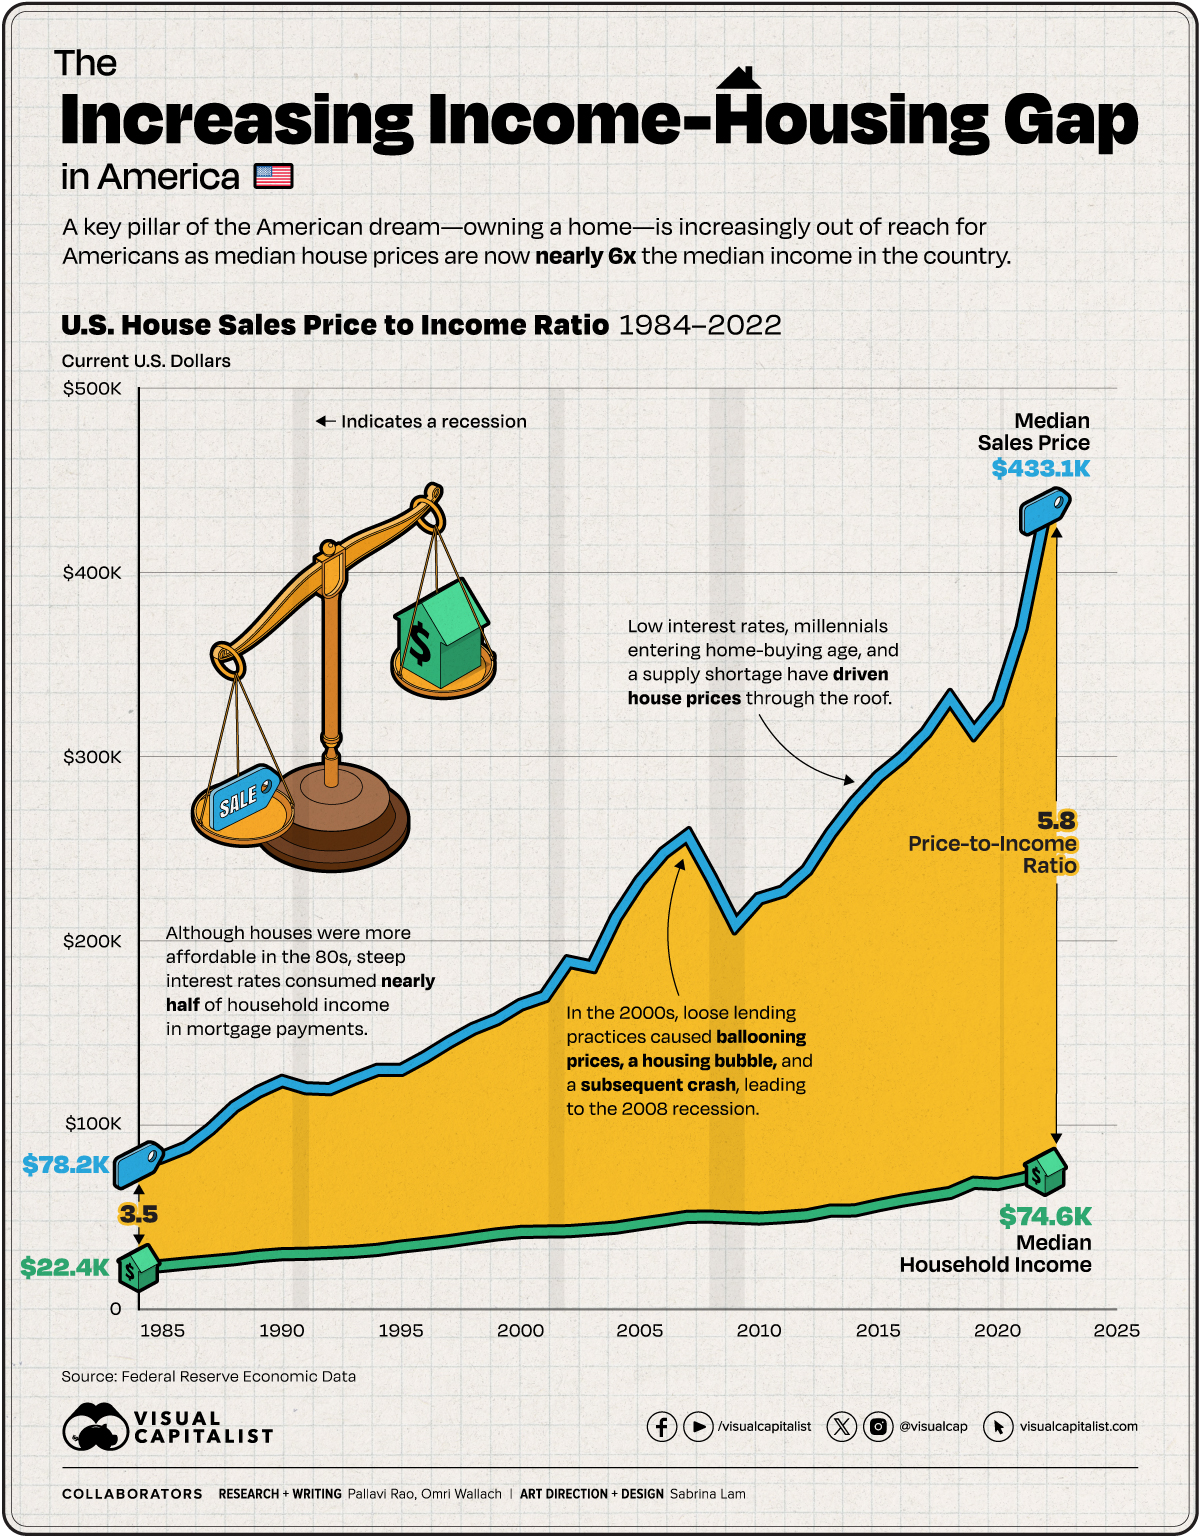
- The surging Housing to Income Gap is making home ownership unaffordable to most Americans (chart below).
- 88% of states are reporting a rise in unemployment while Federal Government reports the U.S. economy added 353,000 workers last month. Economists have spotted “oddities” in the data since “Full-time employment has plunged by nearly 1.4 million people over [the] past three months”??
- Increasing numbers of critics argue that Bidenomics actually misallocates resources and disrupts market signals.
- High inflation, interest rates and bank failures have been attributed to unwise Bidenomic policies.
- The list goes on (see more below in "THE CREDIT ADDICTED "YOLO" CONSUMER ").
How is it that our elected politicians (of both parties) have managed to avoid the disastrous consequences of all the US government policies gone wrong? In Europe, the consequences are plain to see. People are taking to the streets and abandoning the mainstream political parties, like it matters who you vote for. A 2022 survey found trust in government in the EU had fallen from 4.7 out of 10 to 3.6. Can you imagine what it is at now? However, in the US not so much as a beep? ===>
| |
 | |
THIS WEEK WE SAW
Exp=Expectations, Rev=Revision, Prev=Previous
US
US Dallas Fed Manufacturing Business Index (Feb) -11.3 (Prev. -27.4)
US Consumer Confidence (Feb) 106.7 vs. Exp. 115.0 (Prev. 114.8, Rev. 110.9)
US Durable Goods (Jan) -6.1% vs. Exp. -4.5% (Rev. -0.3%)
US GDP 2nd Estimate (Q4) 3.2% vs. Exp. 3.3% (Prev. 3.3%)
US Core PCE Price Index MM (Jan) 0.4% vs. Exp. 0.4% (Prev. 0.2%)
US Core PCE Price Index YY (Jan) 2.8% vs. Exp. 2.8% (Prev. 2.9%)
US Personal Income MM (Jan) 1.0% vs. Exp. 0.4% (Prev. 0.3%)
US Consumption, Adjusted MM (Jan) 0.2% vs. Exp. 0.2% (Prev. 0.7%)
US Chicago PMI (Feb) 44.0 vs. Exp. 48.0 (Prev. 46.0)
US Initial Jobless Claims 215k vs. Exp. 210k (Prev. 201k, Rev. 202k)
US Continued Jobless Claims 1.905M vs. Exp. 1.874M (Prev. 1.862M, Rev. 1.860M)
US Pending Sales Change MM (Jan) -4.9% vs. Exp. 1.0% (Prev. 8.3%, Rev. 5.7%)
===> I sense that below the surface, the frustration in the US has reached the point that the mainstream media is now unable to deflect coverage. The political class is certainly well aware of that.
The question is whether they can accept a loss of voter confidence across the board without raising the stakes? Or are we going to discover a new disease, asteroid, or social cause imminently to justify a new round of eye-watering government intervention in our lives? Get ready, I smell it coming!
| |
========================= | |
|
WHAT YOU NEED TO KNOW!
THE SURGING HOUSING COST TO INCOME GAP
As of 2023, an American household, hoping to buy a median-priced home, needs to make at least $100,000 a year. In some cities, they need to make nearly 3–4x that amount. In 1984, the median annual income for an American household stood at $22,420, and the median house sales price for the first quarter of the year came in at $78,200. The house sales price-to-income ratio stood at 3.49. Meanwhile, the majority of low-income Americans are considered “rent-burdened,” meaning more than one-third of their income goes toward housing costs.
It is important to note that the graphic (right) does not make allowances for:
1- actual household disposable income, nor
2- how monthly mortgage payments change depending on the interest rates at the time, and
3- datasets are in current U.S. dollars, meaning they are not adjusted for inflation.
BOTTOM LINE: Housing Affordability is making the American Dream a frustrating nightmare!
RESEARCH
THE CREDIT ADDICTED "YOLO" CONSUMER
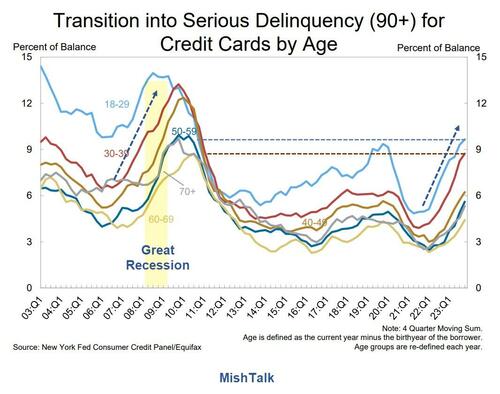
- Americans are falling behind on their credit card payments with 1 in every 12 credit card holders in arrears.
- Americans added a whopping $50 billion to their credit card balances last quarter, bringing credit card debt to a new all-time high of $1.13 trillion.
- Credit card balances in “serious delinquency,” or at least 90 days past due, rose to 6.4%. That’s 59% higher than the previous year.
- According to a third-quarter survey by Clever Real Estate, 23% of Americans acquire more debt every month just to pay the bills.
- The personal savings rate for U.S. households fell from 5.3 percent in May to 3.9 percent in December.
- Compared with pre-pandemic levels above 8 percent, recent figures represent the lowest personal savings rates since before the global financial crisis, when households were stressed by rising adjustable rate mortgages on homes they simply could not afford.
- Not only are they saving less, but Americans are also depleting their savings accounts. Aggregate personal savings has fallen by over 27 percent since December 2019.
- Eventually the party will end, and the hangover will be painful.
| |
|
DEVELOPMENTS TO WATCH
THE FED "PIVOT" & THE TREASURY "PUT"
- The Fed’s Pivot, along with the US Treasury’s willingness to run persistently large election year fiscal deficits, will likely lead the US dollar in 2024 into resuming its downtrend from its 2022 highs.
- This will also likely be a positive tailwind for the new bull market in stocks.
"IN ALL HISTORY, THERE HAS NEVER BEEN A RACE OF THIS MAGNITUDE!"
- NVIDIA GAAP earnings jumped 765% year-on-year. No one had ever seen something like this for a company of its size. But of course, no one has ever seen something that combines elements of the space race, the nuclear arms race and a race to create a super-human species.
- In all history, there has never been a race of this magnitude which we are witnessing in AI. In a rapidly changing world that is becoming digitized, it may even be that this is what the early stages of a hot war looks like. The world’s most powerful nations, and those companies that have already attained sovereign-like status, are now in an existential competition to find the Holy Grail.
| |
|
GLOBAL ECONOMIC REPORTING
-
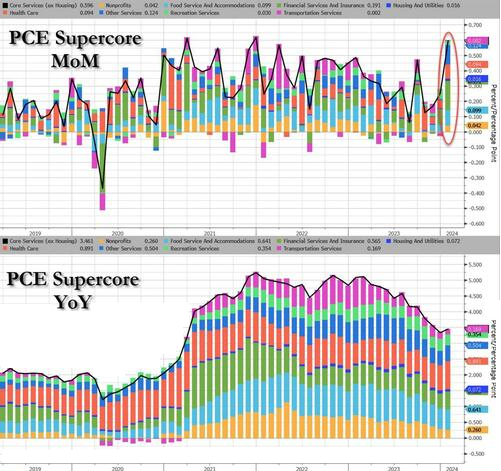
JANUARY PERSONAL CONSUMPTION EXPENDITURE (PCE): Super Core Services Is The "TELL"!
- The last time this type of core-services inflation occurred – in the 1970s and 1980s – there were clear signs that inflation was cooling sharply. Analysts thought repeatedly that the high interest rates at the time had beaten inflation back down, which caused the Fed to ease, only to find out that we’d fallen for an inflation head-fake, and then the Fed jacked up rates even further. The head fakes occurred over the 15 years between 1966 and when core services inflation finally peaked at 11% in 1981.
- From the Fed's perspective it is the Services inflation ex-Shelter and the PCE-equivalent. They actually ticked up on a Y-o-Y basis to 3.45%, thanks to a large 0.6% M-o-M jump - the biggest MoM rise since Dec 2021.
- Under the hood, the SuperCore, on every sub-element rose M-o-M
-
WEEKLY CONTINUING JOBLESS CLAIMS: We refuse to report the BLS nonsense. Instead read this analysis .
| |
|
In this week's expanded "Current Market Perspectives", we focus on the MAG-7 and how high the market could go??
=========
| |
|
THE CREDIT ADDICTED "YOLO" CONSUMER
With the US being close to a 70% Consumption dependent economy, the ability of the average American to continue consuming is of paramount importance. The present rate of deterioration of the consumer is troubling.
LIVING ON CREDIT
- Americans are falling behind on their credit card payments with 1 in every 12 credit card holders in arrears.
- CreditNews reported, Americans added a whopping $50 billion to their credit card balances last quarter, bringing credit card debt to a new all-time high of $1.13 trillion.
- Credit card balances in “serious delinquency,” or at least 90 days past due, rose to 6.4%. That’s 59% higher than the previous year.
- According to a third-quarter survey by Clever Real Estate, 23% of Americans acquire more debt every month just to pay the bills.
- Tech companies laid off tens of thousands of workers last month with Manufacturing mired in weakness,
- A majority of low-income Americans are considered “rent-burdened,” meaning more than one-third of their income goes toward housing costs.
- U.S. personal savings as a percentage of disposable income fell to 3.7% in December, the lowest in a year. The long-term average is more than 8%, according to data from YCharts.
- Although households built up excess savings during the pandemic, the windfall has already been exhausted, according to the Fed. Combined with persistent inflation, households aren’t able to save enough for a rainy day.
- If this continues, consumer spending could decelerate.
SUSTAINABLE WELL PAYING JOBS ARE REQUIRED
- While the U.S. economy added 353,000 workers last month, economists have spotted “oddities” in the data. “Full-time employment has plunged by nearly 1.4 million people over [the] past three months.”
- According to the IMF, U.S. GDP is forecast to grow a lousy 2.1% this year—and slow even further to 1.5% in 2025. U.S. inflation ticked up to 3.4% in December. Excluding food and energy, inflation was up 3.9% from a year ago.
DIGGING A HOLE THEY CAN'T GET OUT OF
- Personal consumption expenditures of goods increased 3.8 percent in the fourth quarter, outpacing overall U.S. gross domestic product (GDP) growth of 3.3 percent.
- There is nothing inherently wrong with spending more if rising income can support it, but this is not what is happening. According to data from the Bureau of Economic Analysis, in 2023 personal spending grew at more than twice the rate of personal income.
- What makes this trend dangerous is the fact that while household debt has grown at 5.5 percent per year (over $3 trillion) since 2019, real personal income has only grown by 1.9 percent per year over the same period.
- Households are more indebted both in absolute terms and relative to their income than they were before the lockdowns-induced recession of 2020.
INCREASED SPENDING IS SUPPORTED NOT BY INCOME BUT BY DEBT
- According to the Federal Reserve Bank of New York’s most recent quarterly report on Household Debt and Credit, by the end of 2023, total household debt increased to a record high of $17.5 trillion.
- This is a 24 percent increase from pre-pandemic levels at year-end 2019, and 3.6 percent higher than just one year ago.
- Most ($12.3 trillion) of this debt reflects mortgage balances, but auto loans and student debt each contribute $1.6 trillion, and credit cards over $1.1 trillion, of additional consumer debt.
- Notably, credit card balances grew by 4.6 percent in the fourth quarter, while consumer spending grew by only 0.7 percent—a warning sign that the consumer is stressed and using more debt to make regular purchases.
| |
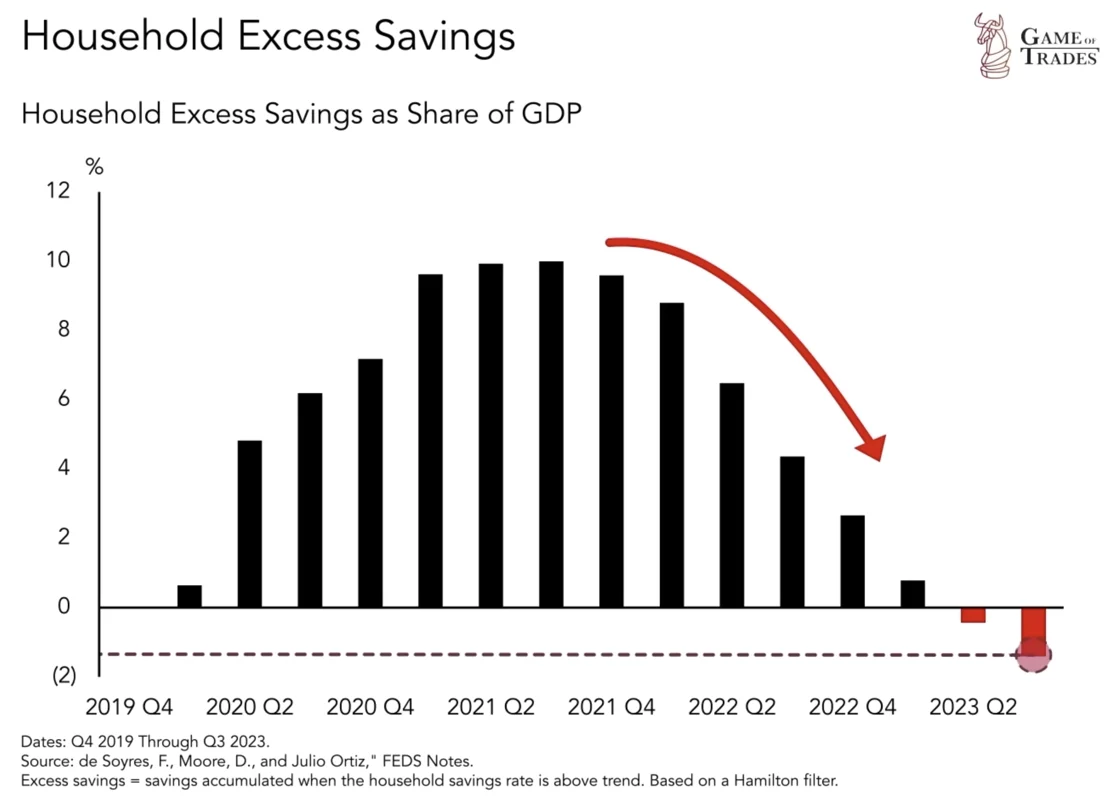
DEPLETED HOUSEHOLD SAVINGS FROM COVID
- The pandemic-related lockdowns and stimulus efforts led to significant accumulation of household savings in 2020, with excess savings reaching approximately 10% of GDP by mid-2021.
- However, these savings have now been fully depleted, leaving individuals with fewer savings than even four years ago.
- This suggests a continued decline in inflationary pressures as consumers have less disposable income to fuel demand-driven inflation.
AMERICANS ARE BOTH SAVING LESS AND EXHAUSTING EXISTING SAVINGS
- Americans are both saving less relative to their income and dipping into existing savings to try to make ends meet.
- The personal savings rate for U.S. households fell from 5.3 percent in May to 3.9 percent in December.
- Compared with pre-pandemic levels above 8 percent, recent figures represent the lowest personal savings rates since before the global financial crisis, when households were stressed by rising adjustable rate mortgages on homes they simply could not afford.
- Not only are they saving less but Americans are also depleting their savings accounts. Aggregate personal savings has fallen by over 27 percent since December 2019.
This cannot continue for much longer.
A MOUNTING STUDENT REPAYMENT PROBLEM
- This comes at a time when the debt-service burden for many families has increased from the resumption of student loan repayments.
- The moratorium on federal student debt repayments put in place in 2020 ended in September 2023.
- There is no way to know whether consumers are making these payments because, according to the Fed’s report, “missed federal student loan payments will not be reported to credit bureaus” until the fourth quarter of 2024.
- Nonetheless, it is reasonable to assume that many student loan debtors are already falling behind on their payments.
| |
|
CRIPPLING COST OF RISING FINANCE RATES
- With interest rates rising rapidly over the past two years, the cost of consumer debt service has risen accordingly.
- In February 2024, the average cost of credit card debt is now approaching 28 percent, as compared with under 23 percent last year.
- In either case, credit card debt quickly spirals out of control if left unpaid.
- U.S. households are increasingly finding themselves trapped in a vicious cycle of indebtedness.
THE RISE OF "YOLO" = YOU ONLY LIVE ONCE!!
- Americans are taking on too much debt to buy things they really can't afford.
- The holidays may have been a time to forget those worries—after all, consumer spending surged by $208 billion in the fourth quarter—but the post-holiday hangover is now being felt.
- “Millions of Americans are living paycheck to paycheck and just didn't have the extra money to pay for holiday purchases” - “They also weren't willing to sacrifice the season for their family and kids, so they took on debt to make it magical.”
- Consumers are aggressively spending and piling on debt just at the moment when they should be prudently cutting back on both.
- Bidenomics is having the same effect on households as it has had on the U.S. government. Both are living beyond their means and spending money that they do not have.
- This is the same thing as giving up on consumption tomorrow for more of it today. It is paying for today’s fleeting pleasures at the cost of tomorrow’s lasting prosperity.
- Spending someone else’s money creates the illusion of wealth and prosperity, but sooner or later, life’s realities (and creditors) intervene.
- The ability to access ever increasing lines of credit and diminishing savings will dry up, and households—unlike the U.S. government, which can print its own money, at least for a time—will have no way out.
- Eventually the party will end, and the hangover will be painful.
DATA SOURCE:
| |
|
DEVELOPMENTS TO WATCH
The following are worrying developments.
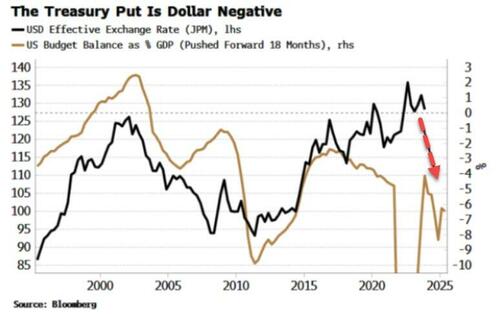
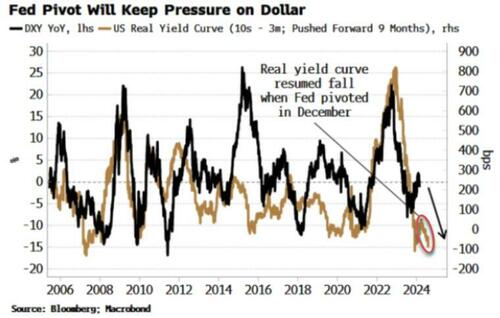
THE FED "PIVOT" & THE TREASURY "PUT"
The Fed’s Pivot along with the US Treasury’s willingness to run persistently large election year fiscal deficits will likely lead the US dollar in 2024 into resuming its downtrend from its 2022 highs.
Large fiscal deficits are a long-term negative for the currency as they are inflationary, and considering the US deficit is one of the largest in GDP terms, it poses greater downside risk to the dollar versus other currencies. This will also likely be a positive tailwind for the new bull market in stocks.
CHART BELOW
BLOOMBERG: The real yield curve had been steepening last year, as longer-term real yields were rising more than shorter-term ones, due in part to the influence of rising term premium. That would have anticipated a rising dollar. The real yield curve then began to re-flatten, which continued even after the Fed performed its verbal volte-face in December, as longer-term real yields have risen much less than short-term ones.
The DXY index is up ~2.3% this year, versus the average of 1.4% in the first two months of the year (data back to 1980). But the dollar typically sees all its net gains in the first three months of the year (1.7%) versus an average decline of 0.9% through the remainder.
|  | |
|
"IN ALL HISTORY, THERE HAS NEVER BEEN A RACE OF THIS MAGNITUDE!"
Eric Peters, CIO of One River Asset Management clearly lays it out:
“It codifies your culture, your society’s intelligence, your common sense, your history - you own your own data,” said NVIDIA founder and CEO Jensen Huang, encouraging global governments to each develop their own sovereign AI infrastructure. “You cannot allow that to be done by other people.”
NVIDIA GAAP earnings jumped 765% year-on-year. No one had ever seen something like this for a company of its size. But of course, no one has ever seen something that combines elements of the space race, the nuclear arms race and a race to create a super-human species.
In all history, there has never been a race of this magnitude. And in a rapidly changing world that is becoming digitized, it may even be that this is what the early stages of a hot war look like. The world’s most powerful nations, and those companies that have already attained sovereign-like status, are now in an existential competition to find the Holy Grail.
China has naturally been denied access to NVIDIA’s technology. Having gutted their greatest tech entrepreneurs in a display of the kind of insecurity reserved for failing autocratic governments, Beijing is now racing to ban short selling of Chinese stocks, lest they continue their chronic decline.
“We are worried that Chinese industrial support policies and macro policies that are more focused on supply rather than thinking about where the demand will come from are both careening towards a situation where overcapacity in China is going to wind up hitting world markets,” warned Jay Shambaugh, US under-secretary for international affairs.
Treasury Secretary Yellen is also expected to raise Chinese overcapacity with her G20 counterparts when they meet in Sao Paulo later this month, with the vice tightening on China. And we are left to wonder what shape a panic in Beijing will take.
| |
|
GLOBAL ECONOMIC INDICATORS: What This Week's Key Global Economic Releases Tell Us
JANUARY PERSONAL CONSUMPTION EXPENDITURE (PCE)
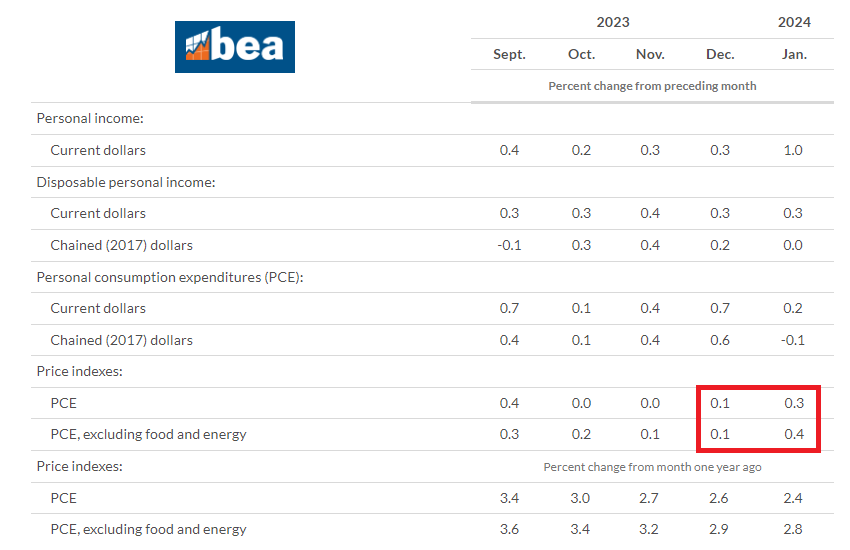
Overall, the January Core PCE price data was in line with expectations for both core and headline figures.
- Core M/M accelerated to 0.4% from 0.2%, with the headline rising to 0.3% from 0.2%.
- Core Y/Y eased to 2.8% from 2.9% with the Y/Y headline easing to 2.4% from 2.6%.
- Although the monthly figures rose, they were in line with expectations, which is at odds with the hot CPI and PPI prints seen for January, albeit analysts did revise up their PCE forecasts in wake of the CPI and PPI prints.
- Meanwhile, the easing of the Y/Y figures is a welcome sign in the Fed's fight against inflation in returning inflation back to 2%, but the monthly prints do remind us it will likely be a bumpy ride back to 2%.
- Nonetheless, there were still some concerning signs - the Fed is also very cognizant of the super-Core PCE measures.
- Core PCE Services ex housing rose 0.6%, accelerating from December's 0.3% pace.
- Meanwhile, the Core PCE annualized rates rose with the 3mnth rising to 2.8% from 2%, and the 6mnth rising to 2.6% from 2.2%.
- There have been concerns with the seasonality effects of the January data. Therefore this report likely does little to alter the Fed's current thought process, which is a patient and data-dependent approach - money markets are leaning to either a June or July meeting for the first rate cut, with just 5bps of easing priced for May.
- Aside from the prices, Personal Income saw a notable 1.0% gain from the prior 0.3%, well above the 0.4% forecast with the upside, according to Pantheon Macroeconomics, boosted by the annual increase to social security and increase in dividends, both one-time events.
- Consumption, however, was in line with expectations - real consumption fell by 0.1% and adj. spending rose by 0.2%.
- The spending may have been depressed by the cold weather in January, with retail giants HD, TJX and LOW all noting that weather in January had an unfavorable impact.
- Pantheon Macroeconomics expect spending to rebound, partly driven by the one-time increase in spending in January.
| |
CORE PCE SERVICES
-
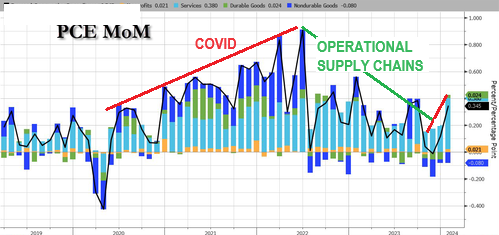
Services soared on a M-o-M basis (chart right).
- Core PCE 3M annualized rate 2.8% from 2.0%
- Core PCE 6M annualized rate 2.6% from 2.2%
| |
|
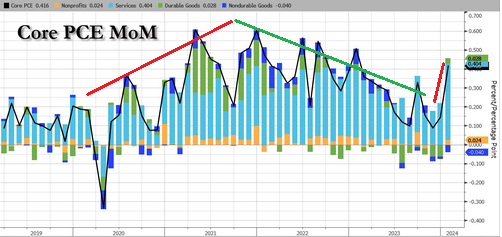
On a core basis, services costs jumped even more (chart right) and Durable Goods costs flipped from deflation.
From the Fed's perspective, it is the Services inflation ex-Shelter, and the PCE-equivalent. They actually ticked up on a Y-o-Y basis to 3.45%, thanks to a large 0.6% M-o-M jump - the largest MoM rise since Dec 2021.
Under the hood, the SuperCore, on every sub-element rose M-o-M (chart below).
| |
|
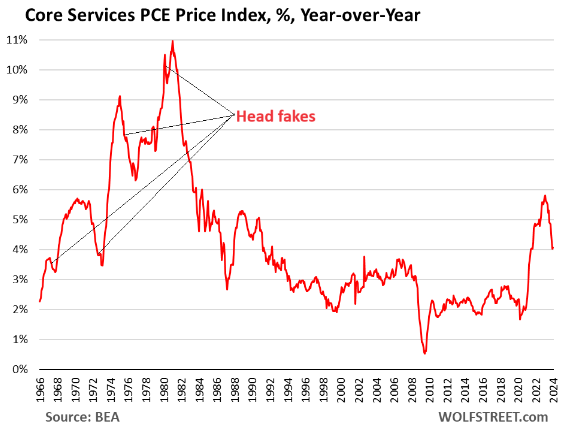
WHAT IS THIS TELLING US?
Inflation in core services is tough to beat, and it can dish up big head-fakes – a fact that Powell has mentioned a few times. Hence the Fed’s wait-and-see approach.
Last time this type of core-services inflation occurred – in the 1970s and 1980s – there were clear signs that inflation was cooling sharply. We thought repeatedly that the high interest rates at the time had beaten inflation back down, which caused the Fed to ease, only to find out that we’d fallen for an inflation head-fake, and then the Fed jacked up rates even further.
The head fakes occurred over the 15 years between 1966 and when core services inflation finally peaked at 11% in 1981. So this is the “core services” PCE price index which excludes energy and the oil-price shocks at the time.
| |
|
GLOBAL MACRO
WHAT DOES YOUR SCAN OF THE DATA BELOW TELL YOU? - THE MEDIA AVOIDS BAD NEWS!
We present the data in a way you can quickly see what is happening.
THIS WEEK WE SAW
Exp=Expectations, Rev=Revision, Prev=Previous
| |
|
UNITED STATES
-
US Dallas Fed Manufacturing Business Index (Feb) -11.3 (Prev. -27.4)
- US Building Permits Number (Jan) 1.489M (Prev. 1.47M)
- US New Home Sales-Units (Jan) 0.661M vs. Exp. 0.68M (Prev. 0.664M, Rev. 0.651M)
-
US Consumer Confidence (Feb) 106.7 vs. Exp. 115.0 (Prev. 114.8, Rev. 110.9)
-
US Durable Goods (Jan) -6.1% vs. Exp. -4.5% (Rev. -0.3%)
- US Richmond Fed Manufacturing Shipments (Feb) -15.0 (Prev. -15.0)
- US Richmond Fed Services Index (Feb) -16.0 (Prev. 4.0)
- US Richmond Fed Composite Index (Feb) -5.0 (Prev. -15.0)
- US CaseShiller 20 MM SA (Dec) 0.2% vs. Exp. 0.2% (Prev. 0.1%, Rev. 0.2%)
- US CaseShiller 20 YY NSA (Dec) 6.1% vs. Exp. 6.0% (Prev. 5.4%)
- US GDP 2nd Estimate (Q4) 3.2% vs. Exp. 3.3% (Prev. 3.3%)
- US Core PCE Prices Prelim. (Q4) 2.1% vs. Exp. 2.0% (Prev. 2.0%)
- US Core PCE Price Index MM (Jan) 0.4% vs. Exp. 0.4% (Prev. 0.2%)
- US Core PCE Price Index YY (Jan) 2.8% vs. Exp. 2.8% (Prev. 2.9%)
- US Personal Income MM (Jan) 1.0% vs. Exp. 0.4% (Prev. 0.3%)
- US Consumption, Adjusted MM (Jan) 0.2% vs. Exp. 0.2% (Prev. 0.7%)
- US Chicago PMI (Feb) 44.0 vs. Exp. 48.0 (Prev. 46.0)
- US Initial Jobless Claims 215k vs. Exp. 210k (Prev. 201k, Rev. 202k)
- US Continued Jobless Claims 1.905M vs. Exp. 1.874M (Prev. 1.862M, Rev. 1.860M)
- US Pending Sales Change MM (Jan) -4.9% vs. Exp. 1.0% (Prev. 8.3%, Rev. 5.7%)
CHINA
- Chinese NBS Manufacturing PMI (Feb) 49.1 vs. Exp. 49.1 (Prev. 49.2)
- Chinese NBS Non-Manufacturing PMI (Feb) 51.4 vs. Exp. 50.9 (Prev. 50.7)
- Chinese Composite PMI (Feb) 50.9 (Prev. 50.9)
- Chinese Caixin Manufacturing PMI Final (Feb) 50.9 vs. Exp. 50.6 (Prev. 50.8)
JAPAN
- Japanese Services PPI YY (Jan) 2.1% vs Exp. 2.4% (Prev. 2.4%)
- Japanese National CPI YY (Jan) 2.2% vs. Exp. 1.9% (Prev. 2.6%)
- Japanese National CPI Ex. Fresh Food YY (Jan) 2.0% vs. Exp. 1.8% (Prev. 2.3%)
- Japanese National CPI Ex. Fresh Food & Energy YY (Jan) 3.5% vs. Exp. 3.3% (Prev. 3.7%)
- Japanese Industrial Production MM (Jan P) -7.5% vs. Exp. -7.3% (Prev. 1.4%)
- Japanese Retail Sales YY (Jan) 2.3% vs. Exp. 2.3% (Prev. 2.1%, Rev. 2.4%)
UK
- UK BRC Shop Price Index YY (Jan) 2.5% (Prev. 2.9%)
- UK Mortgage Approvals (Jan) 55.227k vs. Exp. 52.0k (Prev. 50.459k, Rev. 51.506k); Mortgage Lending (Jan) -1.086B GB vs. Exp. 0.2B GB (Prev. -0.83B GB, Rev. -0.854B GB); BOE Consumer Credit (Jan) 1.877B GB vs. Exp. 1.6B GB (Prev. 1.197B GB, Rev. 1.257B GB); M4 Money Supply (Jan) -0.1% (Prev. 0.5%)
- UK Lloyds Business Barometer (Feb) 42 (Prev. 44)
AUSTRALIA
- Australian Weighted CPI YY (Jan) 3.40% vs. Exp. 3.60% (Prev. 3.40%)
- Australian Construction Work Done (Q4) 0.7% vs. Exp. 0.8% (Prev. 1.3%)
- Australian Capital Expenditure (Q4) 0.8% vs. Exp. 0.5% (Prev. 0.6%)
- Australian Retail Sales MM Final * (Jan) 1.1% vs. Exp. 1.5% (Prev. -2.7%)
NEW ZEALND
- New Zealand ANZ Business Confidence (Feb) 34.7% (Prev. 36.6%)
- New Zealand ANZ Activity Outlook (Jan) 29.5 (Prev. 25.6)
SWITZERLAND
- Swiss KOF Indicator (Feb) 101.6 vs. Exp. 102.0 (Prev. 101.5, Rev. 102.5); GDP YY (Q4) 0.6% vs. Exp. 0.7% (Prev. 0.3%, Rev. 0.4%); GDP QQ (Q4) 0.3% vs. Exp. 0.1% (Prev. 0.3%)
| |  |
|
EU
- EU Economic Sentiment(Feb) 95.4 vs. Exp. 96.7 (Prev. 96.2, Rev. 96.1); Consumer Confid. Final (Feb) -15.5 vs. Exp. -15.5 (Prev. -15.5); Services Sentiment (Feb) 6.0 vs. Exp. 9.0 (Prev. 8.8, Rev. 8.4); Industrial Sentiment (Feb) -9.5 vs. Exp. -9.2 (Prev. -9.4, Rev. -9.3); Selling Price Expectations (Feb) 3.8 (Prev. 4.6, Rev. 4.4); Cons Inflation Expectations (Feb) 15.5 (Prev. 11.9, Rev. 12.0)
- EU Economic Sentiment (Feb) 95.4 vs. Exp. 96.7 (Prev. 96.2, Rev. 96.1)
- EU Consumer Confidence Final (Feb) -15.5 vs. Exp. -15.5 (Prev. -15.5)
- EU Services Sentiment (Feb) 6.0 vs. Exp. 9.0 (Prev. 8.8, Rev. 8.4)
- EU Industrial Sentiment (Feb) -9.5 vs. Exp. -9.2 (Prev. -9.4, Rev. -9.3)
- EU Selling Price Expectations (Feb) 3.8 (Prev. 4.6, Rev. 4.4)
- EU Business Climate (Feb) -0.42 (Prev. -0.40, Rev. -0.42)
- Inflation data out of Europe has significantly cooled from the prior, but still printed hotter than expectations. Attention will remain on German CPI at 13:00 GMT / 08:00 ET and the EZ-wide figure tomorrow.
GERMANY
- Spanish HICP Flash YY (Feb) 2.9% vs. Exp. 2.9% (Prev. 3.5%); CPI YY Flash NSA (Feb) 2.8% vs. Exp. 2.7% (Prev. 3.4%); Core 3.4% (prev. 3.6%)
- German Unemployment Chg SA (Feb) 11.0k vs. Exp. 7.0k (Prev. -2.0k); Unemployment Rate SA (Feb) 5.9% vs. Exp. 5.8% (Prev. 5.8%); Unemployment Total SA (Feb) 2.713M (Prev. 2.694M); Unemployment Total NSA (Feb) 2.814M (Prev. 2.805M)
- German Bavaria State CPI MM (Feb) 0.5% (Prev. 0.2%); Bavaria State CPI YY (Feb) 2.6% (Prev. 2.9%)
- German Retail Sales YY Real (Jan) -1.4% vs. Exp. -1.5% (Prev. -1.7%); Retail Sales MM Real (Jan) -0.4% vs. Exp. 0.5% (Prev. -1.6%)
- German Retail Sales MM Real (Jan) -0.4% vs. Exp. 0.5% (Prev. -1.6%)
- German Retail Sales YY Real (Jan) -1.4% vs. Exp. -1.5% (Prev. -1.7%)
- German Unemployment Change (Feb) 11.0k vs. Exp. 7.0k (Prev. -2.0k)
- German CPI Prelim MM (Feb) 0.4% vs. Exp. 0.5% (Prev. 0.2%)
- German CPI Prelim YY (Feb) 2.5% vs. Exp. 2.6% (Prev. 2.9%)
FRANCE
- French CPI Prelim MM NSA (Feb) 0.8% vs. Exp. 0.7% (Prev. -0.2%); CPI Prelim YY NSA (Feb) 2.9% vs. Exp. 2.7% (Prev. 3.1%); Consumer Spending MM (Jan) -0.3% vs. Exp. -0.2% (Prev. 0.3%); CPI (EU Norm) Prelim YY (Feb) 3.1% vs. Exp. 3.0% (Prev. 3.4%)
- French Producer Prices MM (Jan) -1.3% (Prev. 0.1%, Rev. -0.1%); GDP QQ Final (Q4) 0.1%
- French CPI Prelim YY NSA (Feb) 2.9% vs. Exp. 2.7% (Prev. 3.1%)
SPAIN
- Spanish CPI Prelim YY NSA (Feb) 2.8% vs. Exp. 2.7% (Prev. 3.4%)
ITALY
- Italian Manufacturing Business Confidence (Feb) 87.3 vs. Exp. 88.7 (Prev. 88.3, Rev. 88.1); Consumer Confidence (Feb) 97.0 vs. Exp. 96.9 (Prev. 96.4)
- Italian Industrial Sales MM SA (Dec) 2.1% (Prev. -1.0%, Rev. -0.9%)
SWEDEN
- Swedish Trade Balance (Jan) 13.3B (Prev. 3.8B, Rev. 1.9B)
- Swedish PPI YY (Jan) -2.3% (Prev. -7.7%); PPI MM (Jan) 0.3% (Prev. -1.6%)
- Swedish Overall Sentiment (Feb) 90.5 (Prev. 90.5); Manufacturing Confidence (Feb) 98.4 (Prev. 99.3); Total Industry Sentiment (Feb) 92.0 (Prev. 91.7); Consumer Confidence SA (Feb) 82.7 (Prev. 82.3)
- Swedish Retail Sales YY (Jan) -1.2% (Prev. -2.2%); Retail Sales MM (Jan) 0.4% (Prev. -0.2%); GDP Final QQ (Q4) -0.1% vs. Exp. 0.1% (Prev. 0.1%); GDP Final YY (Q4) -0.2% vs. Exp. -0.3%
| |
CURRENT MARKET PERSPECTIVE | |
|
HOW HIGH CAN THE MARKETS GO?
THE NEW 64 THOUSAND DOLLAR QUESTION!
Click All Charts to Enlarge
| |
MATASII NOTE: Like the infamous contrarian Barron's cover ... is "The Economist" cover a harbinger of things to come?
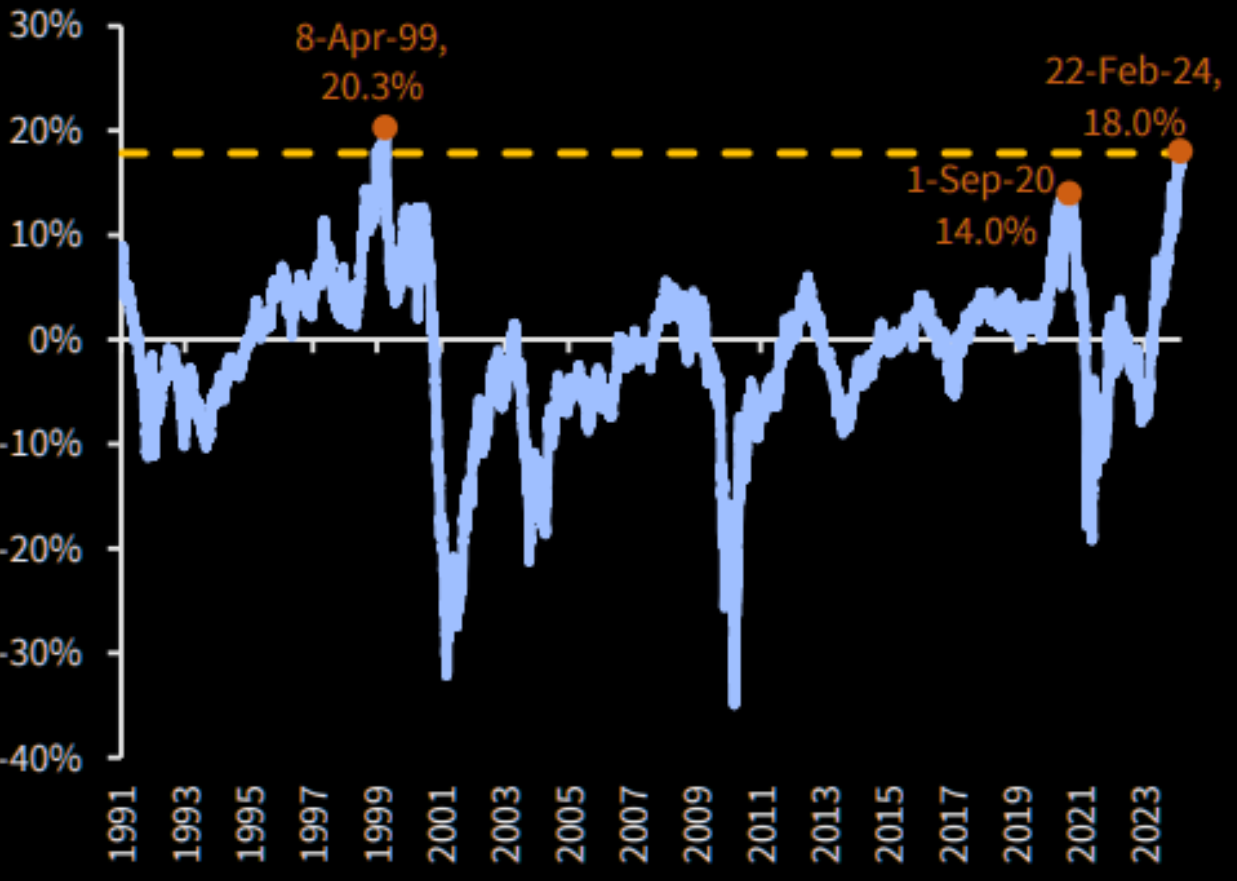
- During the pre-dotcom bubble of late-1994 the US stock market had a $5.0T capitalization, relative to a $7.6T GDP, or 66%. Today? A $53.0T capitalization on GDP of $27.4T, or 193%! Almost 3x.
- US stocks in 1995 were 16% of global GDP ($31.2T), versus today at 48% ($109.7T). Same 3x.
- At the end of 1994, the S&P 500 was trading at 12x 1995 EPS. Versus 22x the 2024 estimate today.
- In 1995 the reasonably diversified top ten US stocks represented 6% of US GDP. Today the tech-heavy top ten are 50% of US GDP.
It's not rocket science to conclude that we are now living in the biggest hype and narrative bubble since
the turn of the century.
| |
|
1 - SITUATIONAL ANALYSIS
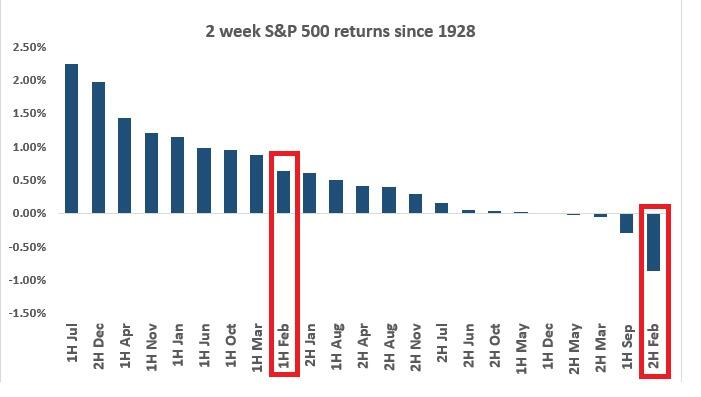
FEBRUARY'S HISTORIC 2ND HALF DOWN MONTH
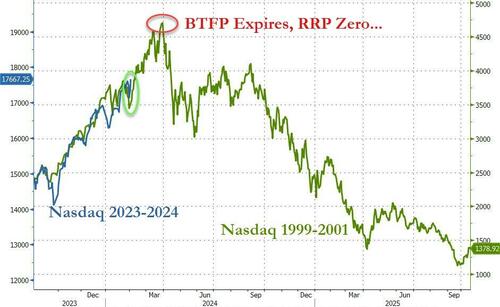
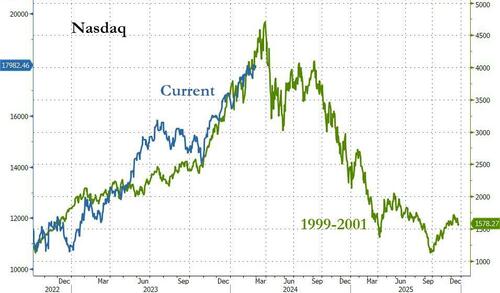
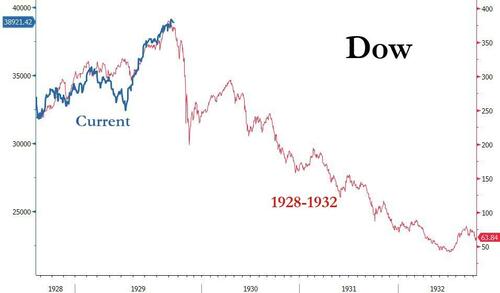
The month of February going all the way back to 1928 has exhibited the worst period for stocks annually (see chart top right). So what happened this month?
- Barring a 0.5% drop in the last 10 minutes of the trading day, this will be the first time in 10 years that the last trading day of February will be an up day for the S&P.
- It will also be the first positive Leap Day since the year 2000.
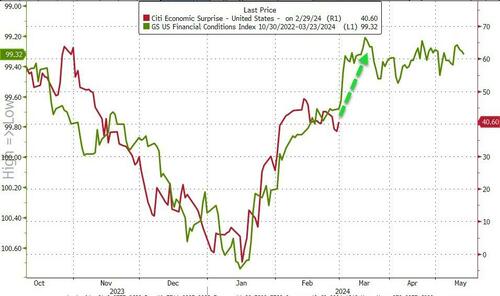
What we suspect is we have the renaissance of 'animal spirits 2.0' due to the lagged effect of the massive loosening of financial conditions that occurred in Q4 (chart #2 right).
| |
|
|
SHOULD WE PAY ATTENTION TO HISTORY?
The equity market performance in February suggests that the markets are in a period of "Irrational Exuberance". We have seen such periods before.
CHART TOP RIGHT
- The Market is soaring because AI hasn't displaced any jobs YET.
- The Market is soaring because every tech company is betting AI will displace millions of jobs SOON.
And so, 'you are CURRENTLY here'.
Technically the tailwind is set to run out right as the Ides of March strike, which would line up rather ominously with the dot-com peak analog (chart #2 right).
CHART BOTTOM RIGHT
What’s really significant about today’s situation is that you’ve got 1999-2000 all over again in the stock market, but it’s more like 2008 in terms of the disaster that’s waiting around the corner.
We didn’t have a financial crisis in 2001. That didn’t happen until 2008.
It is however very similar to 1928-1929 when we had both!
| |
|
|
2 - FUNDAMENTAL ANALYSIS
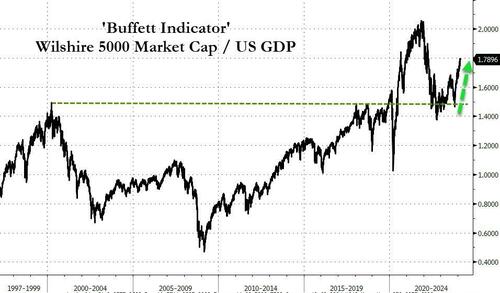
THE BUFFET MEASURE
All that exuberantly-added market cap means stocks are now anything but cheap when measured by the Buffett Indicator (chart top right).
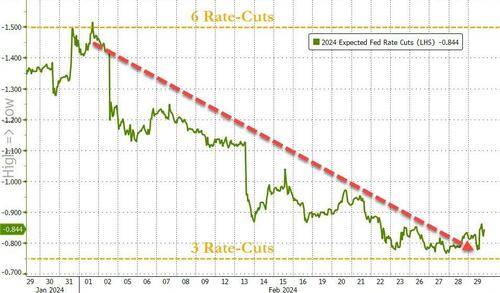
FED PIVOT CONTINUES TO BE PUSHED OUT & FLATTENED
Endlessly hawkish FedSpeak (confirmed by the FOMC Minutes), and troublingly sticky inflation prints (hard and soft), sent 2024 rate-cut expectations reeling. Moving from over 6 cuts (154bps) at the start of the month to less than 4 cuts (84bps) at the end, better-than-soft-landing data spoiled the "rescue-me" fantasy so many had for The Fed. Expectations for the start of rate-cuts was getting pushed further back with July now most likely.
It was quite a shift in February from 60% odds of a March-cut to basically 0 and a May-cut fully priced to just 18% now (chart center right).
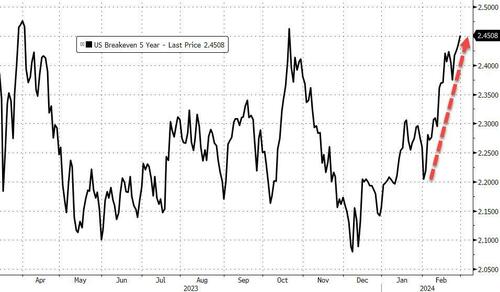
RISING BREAKEVENS
The market is suddenly aware that this disinflationary path may not be as easy as they thought at the start of the year.
Breakevens have soared higher this year with February pushing 5Y BEs back up near their highest since April 2023 (chart #4 right).
| | |
Market concentration is eerily similar to the the run-up to the Dotcom Bubble bursting! | | |
|
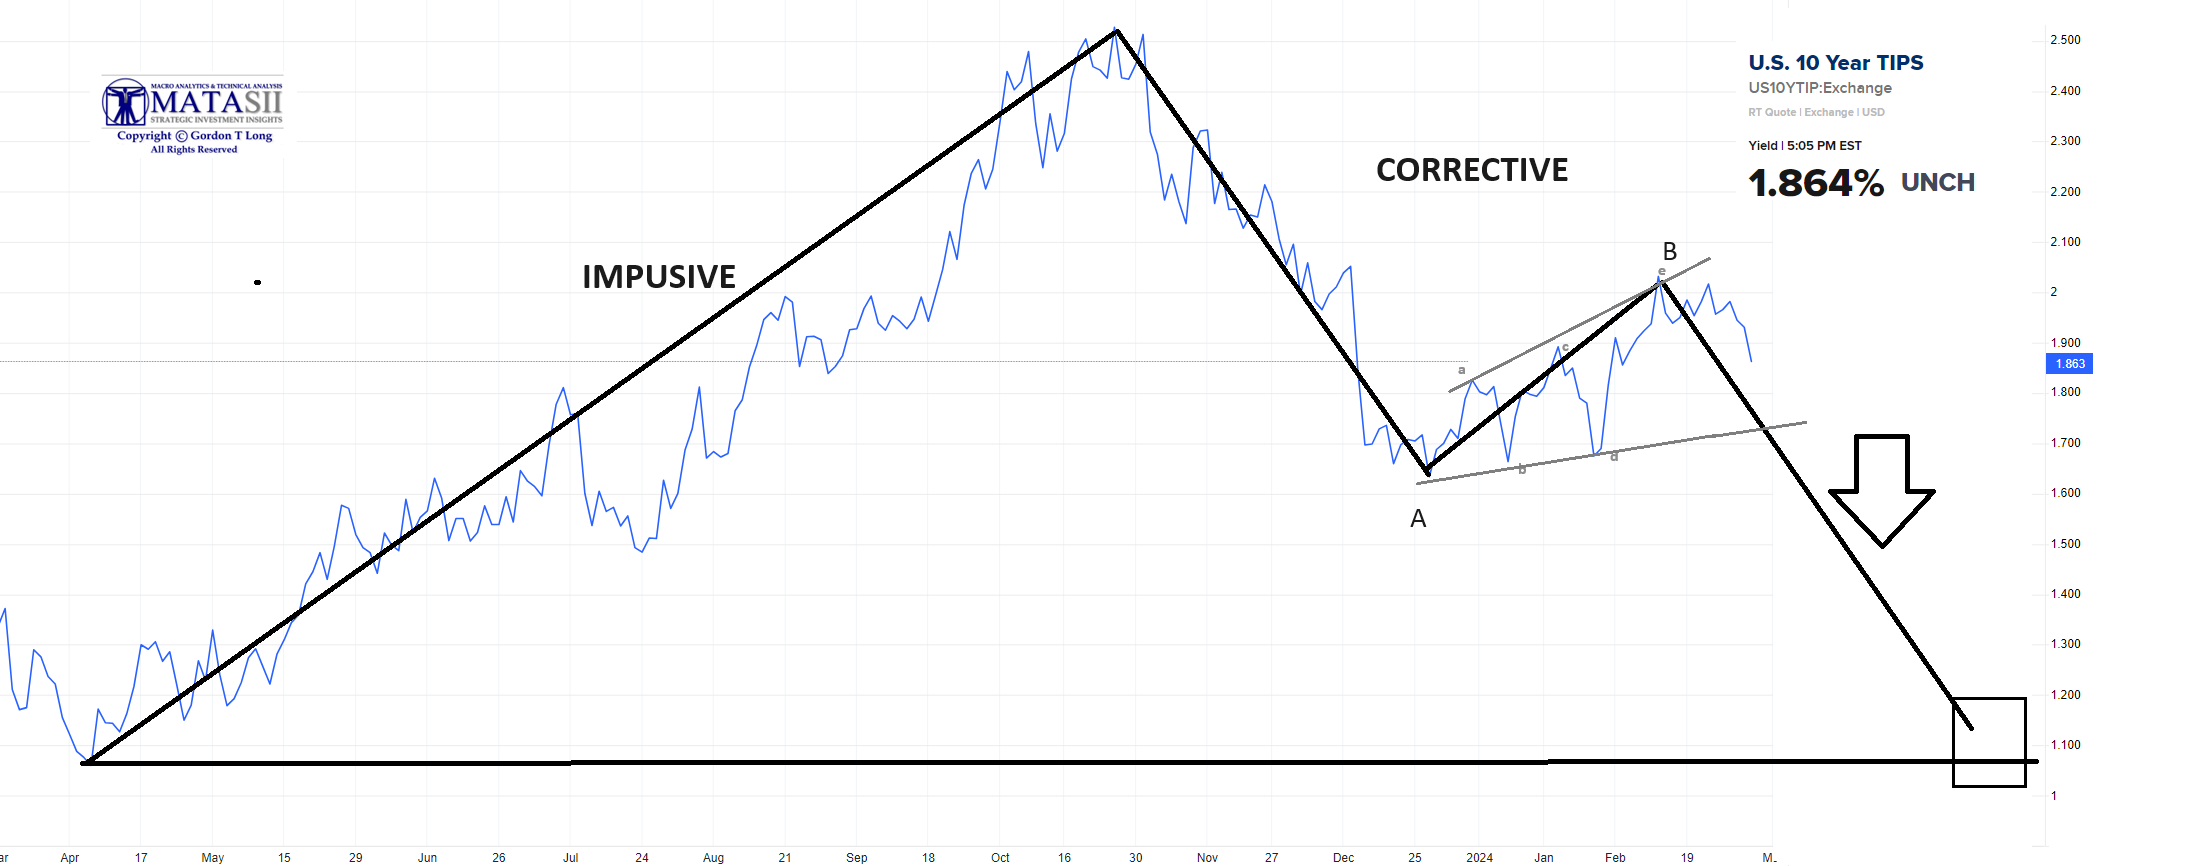
FALLING REAL RATES TO POTENTIALLY RESUME
It appears that 10 TIPS have completed a corrective consolidation and started the "C" leg of an ABC downward March. This is not confirmed until the lower trend line of the ABCDE pattern is decisively broken. Nominal bond Yields will also fall unless Inflation Breakevens rise to offset the declining TIPS yield.
| |
|
3 - TECHNICAL ANALYSIS
THE MAGNIFICENT 7
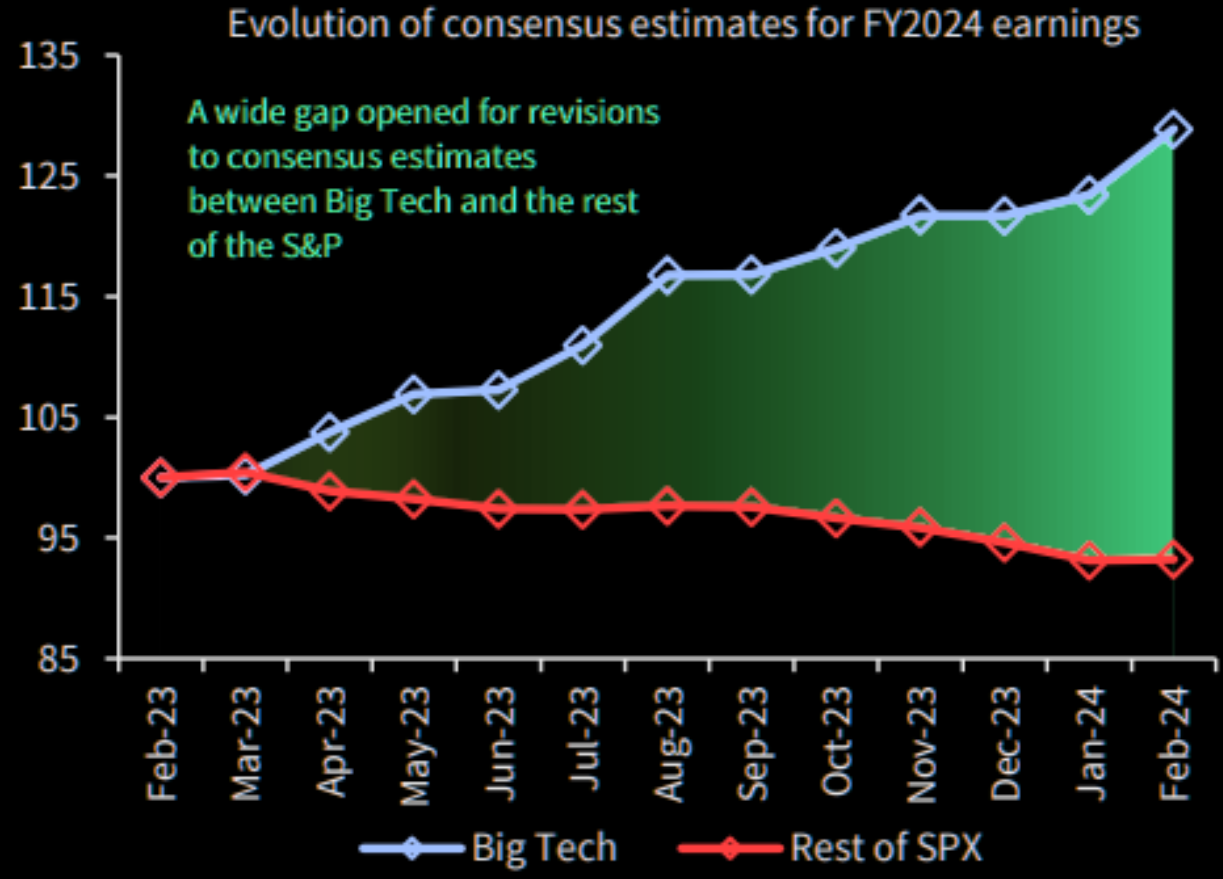
Mega-caps RV performance versus the rest of the market is a whisker away from the Dot.com bubble highs, writes Barclay (chart right).
CHART BELOW
Big Tech is the only space seeing upward revisions!
Together, these are potentially not good omens!
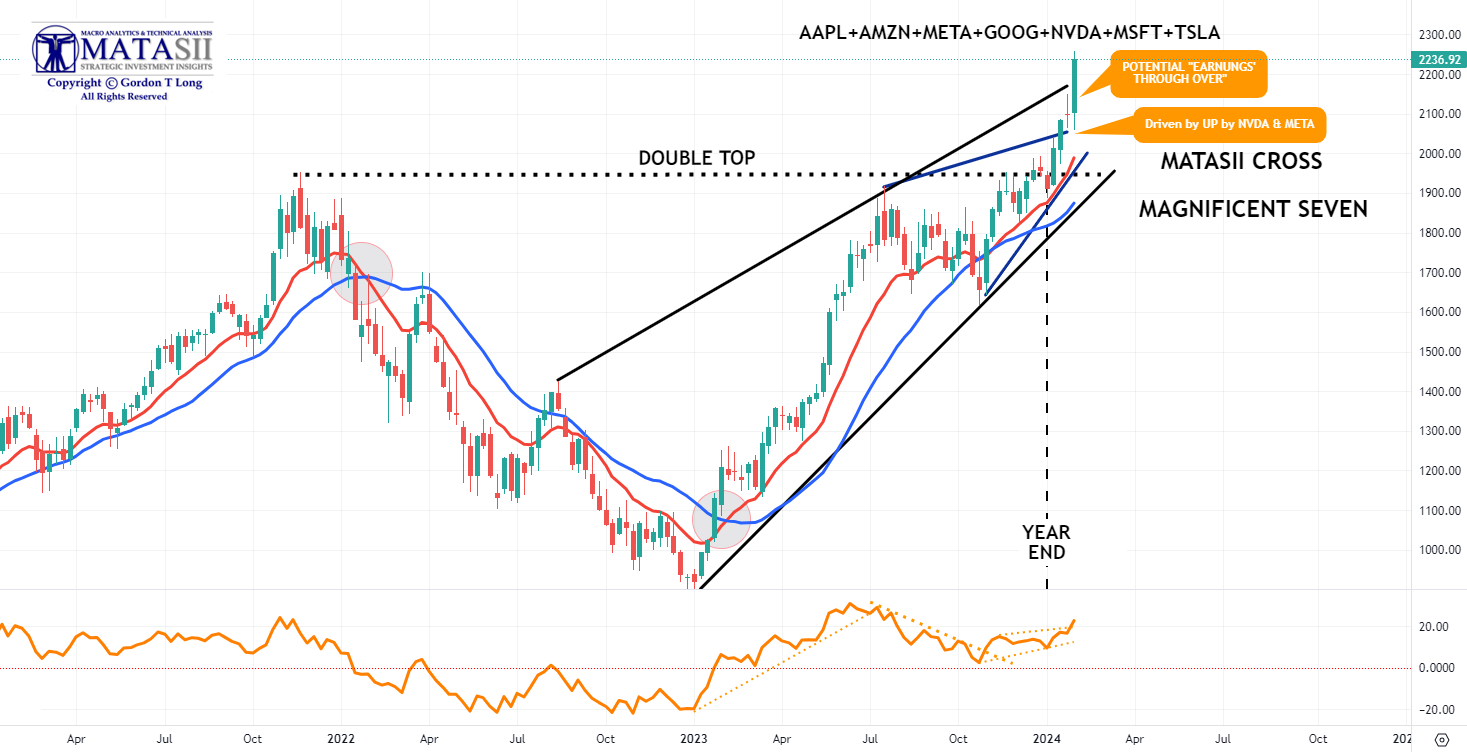
| MATASII CROSS: SIGNALLING A MAG-7 BUY | |
YOUR DESKTOP / TABLET / PHONE ANNOTATED CHART
Macro Analytics Chart Above: SUBSCRIBER LINK
| |
|
Let's look at each of the members of the Mag-7:
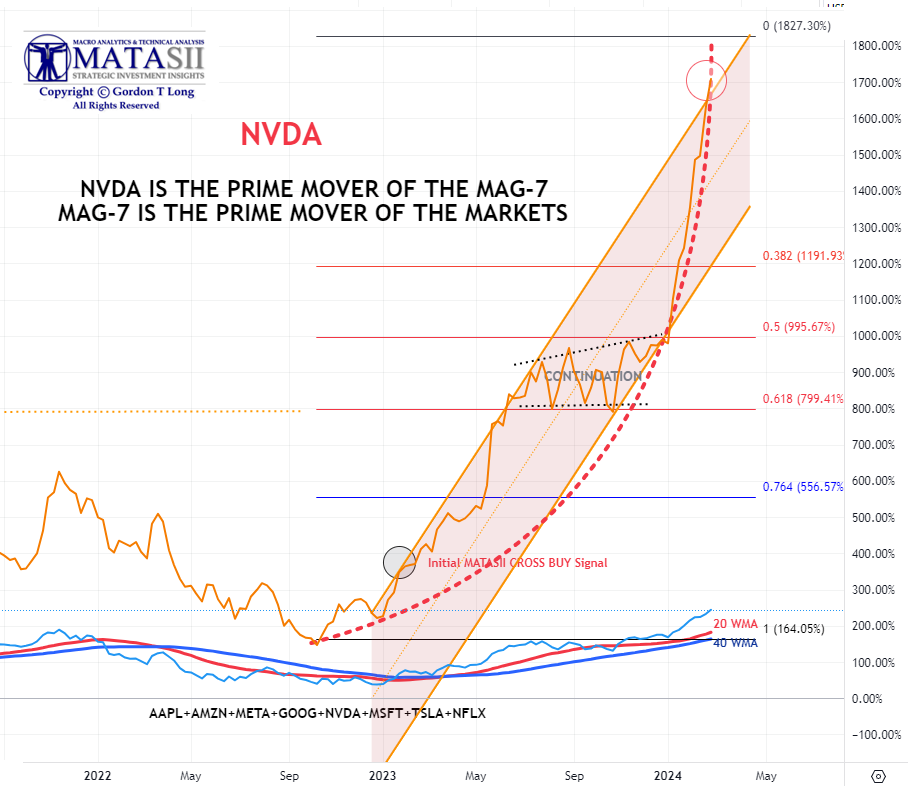
NVIDIA
The weekly NVDA chart (right) is tracking a parabolic lift shown by the dotted red line.
Though we closed Friday with a touch of the rising trend channel, the parabolic suggests there may be more to go. The projection also aligns with a possible retracement of a Fibonacci 50.0%, where the "continuation" triangle terminated.
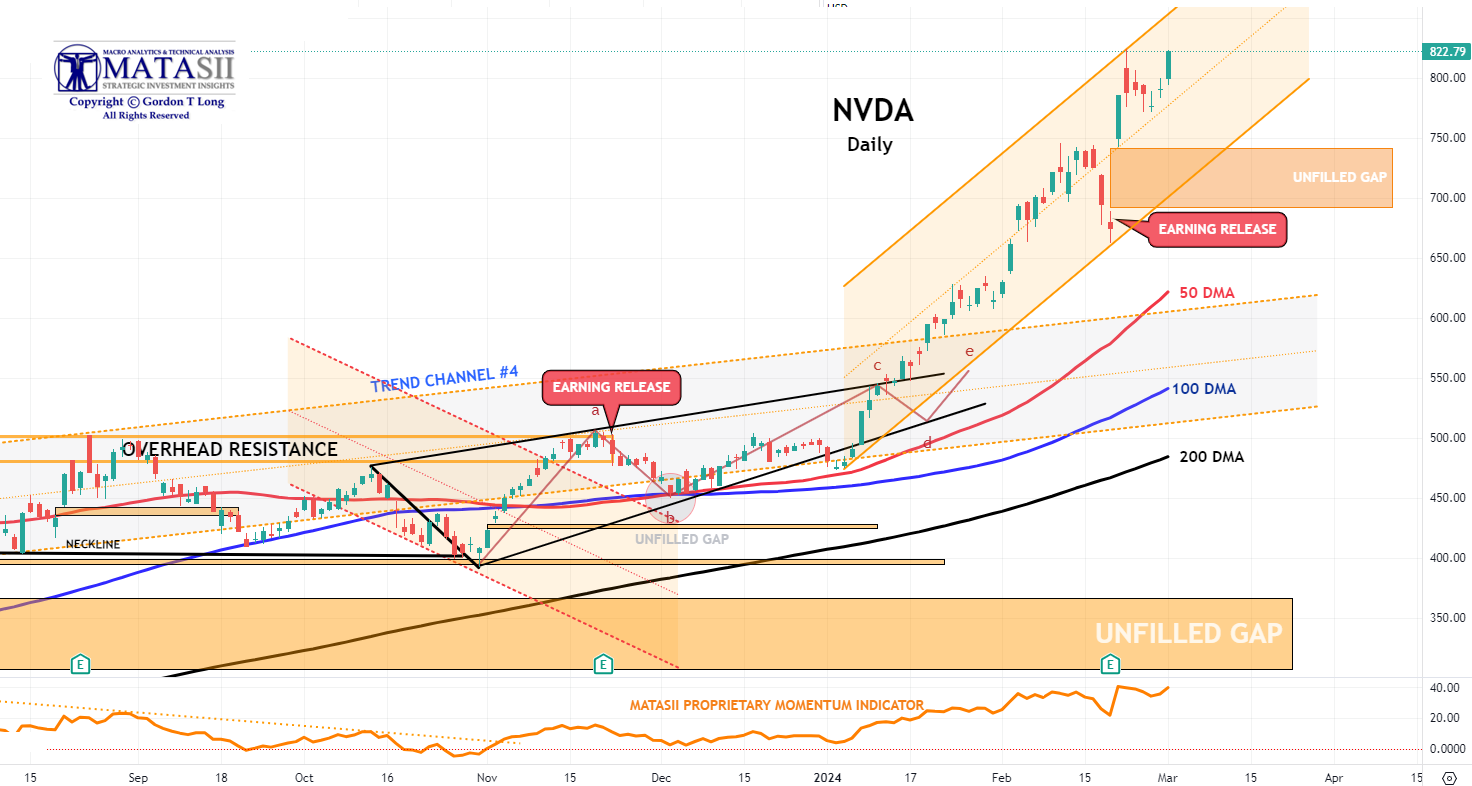
The daily chart below has the parallel trend line aligned with the potential parabolic ending. There are many unfilled gaps below the current levels along with major separations from the 50 /100/ 200 DMAs. This suggests an eventual corrective consolidation should occur and may be quite violent?
| |
|
YOUR DESKTOP / TABLET / PHONE ANNOTATED CHART
Macro Analytics Chart Above: SUBSCRIBER LINK
| |
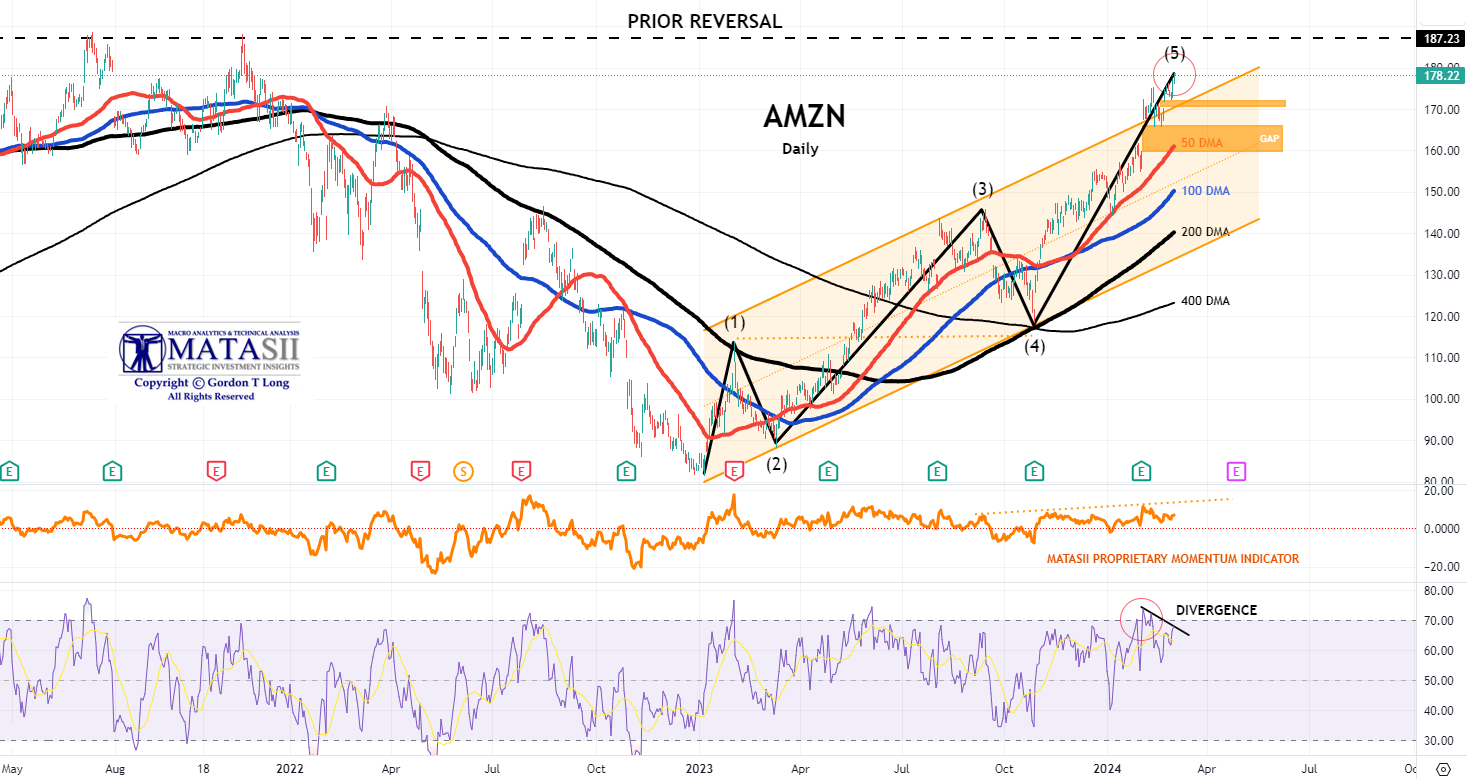
AMAZON
Amazon earnings were very impressive with EPS and Revenue topping expectations. The stock has continued to rise but the rise is now diverging from Momentum (bottom pane). The stock appears to be in a classic "though-over" from its rising trend channel. The combination suggests heightened caution.
| |
|
YOUR DESKTOP / TABLET / PHONE ANNOTATED CHART
Macro Analytics Chart Above: SUBSCRIBER LINK
| |
|
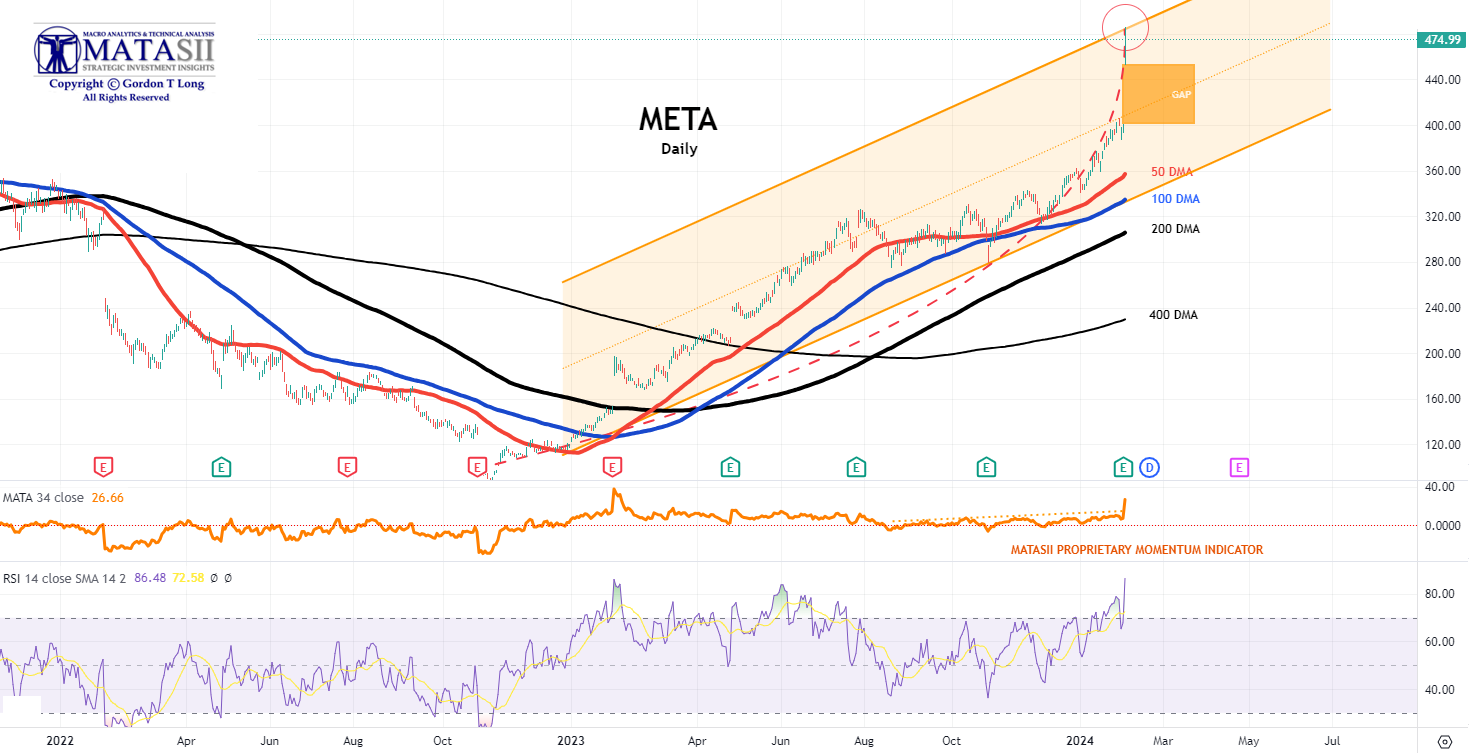
META
Meta (META) had a stellar earnings report with both top and bottom-line beats. It also boosted share buybacks and declared its first ever dividend. The stock has gapped higher. The dotted red parabolic fit and RSI (lower pane) suggests the open gap will soon be filled.
| |
|
YOUR DESKTOP / TABLET / PHONE ANNOTATED CHART
Macro Analytics Chart Above: SUBSCRIBER LINK
| |
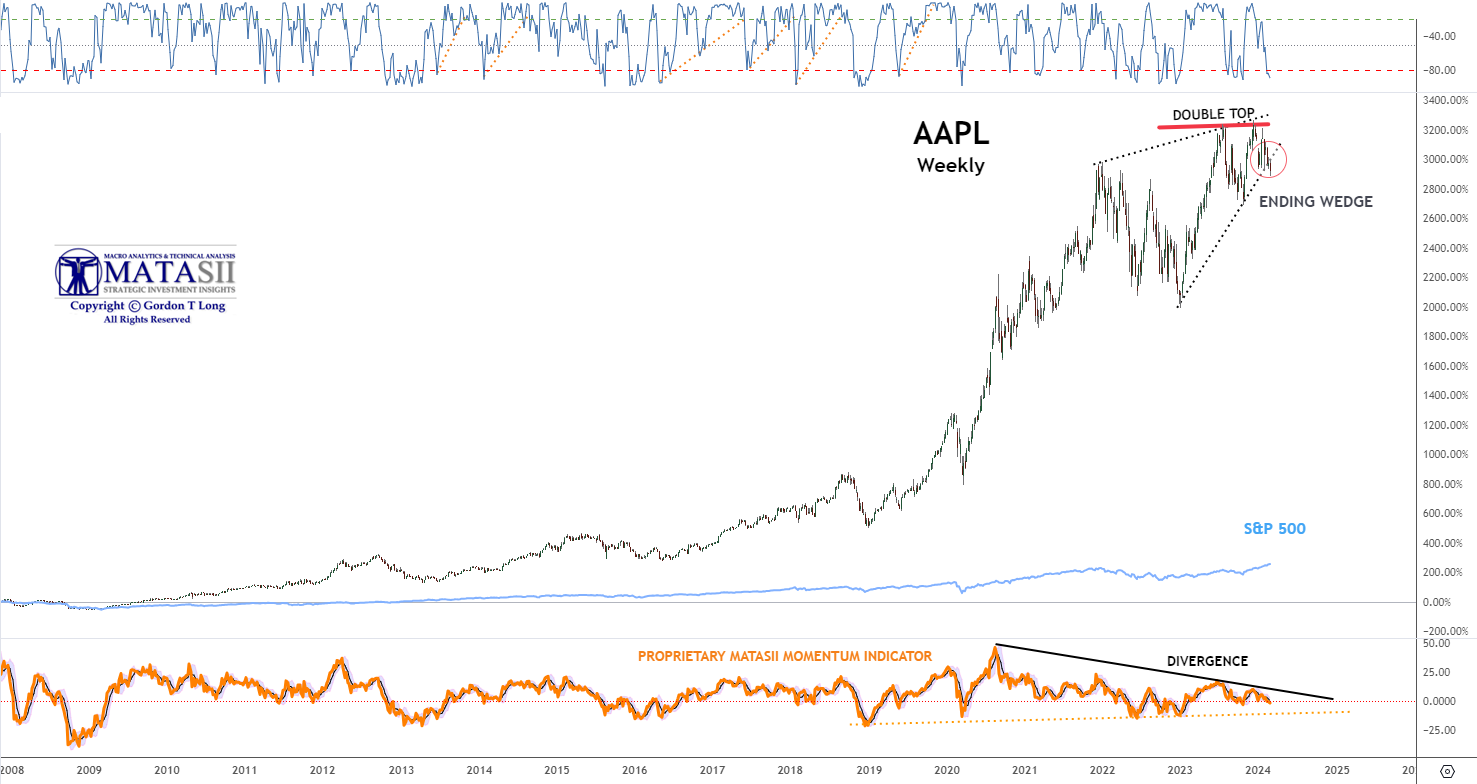
APPLE
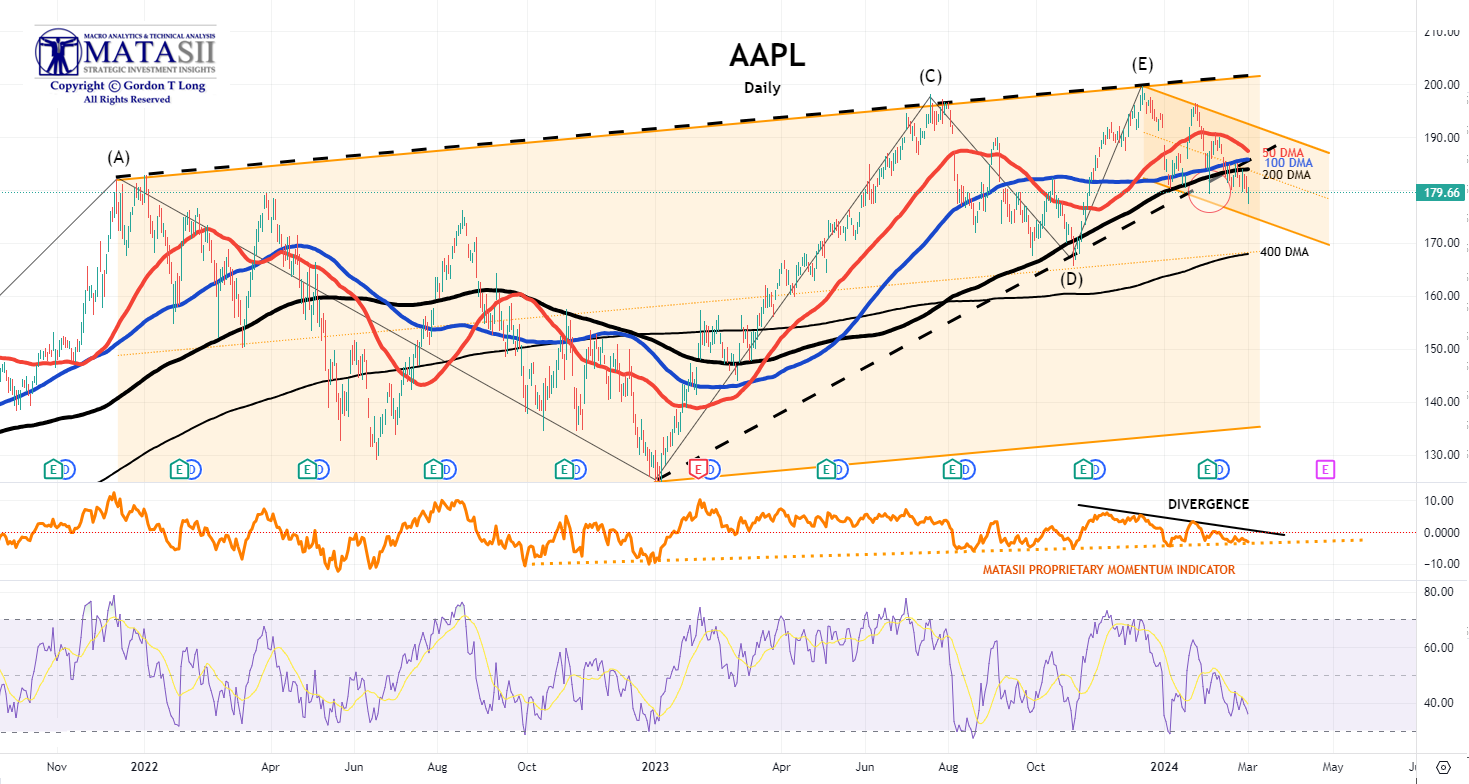
Goldman Sachs has removed Apple from its Conviction List. Apple earnings were seen as underwhelming as Greater China revenues, Mac, iPad, Wearables and Services revenues all missed.
Unlike most “growth” companies, a bet on Apple is seen as a bet on their ability to buy back shares. It appears that Apple can continue to buy back its shares with earnings and cash. Such would maintain their higher-than-market EPS growth with or without above-market earnings growth. Other than negative earnings growth and high-interest rates, a buyback tax on corporations (as is being proposed) is seen as reducing or eliminating their buyback program. If such a bill were to pass or Apple cuts back on buybacks for another reason, its premium valuation may wither away.
The longer term weekly chart for AAPL shows that it has broken below its lower support line of a rising diagonal pattern after putting in a double pattern formation. Throughout the rising diagonal (a bearish signal) the momentum was diverging, as seen in the lower pane, (also a bearish signal).
| |
|
YOUR DESKTOP / TABLET / PHONE ANNOTATED CHART
Macro Analytics Chart Above: SUBSCRIBER LINK
| |
The Daily AAPL chart below highlights the fact that the tightly "banded" DMAs for AAPL appear to be setting up for a downward cross of the 50 DMA through the 100 and 200 DMA. The 100 DMA is also likely to also break through the 200 DMA to the downside. This is referred to as a "Death Cross" and is seen as quite bearish! We also see Divergence between price and momentum with a steadily falling RSI. This is a stock under "Distribution". | |
YOUR DESKTOP / TABLET / PHONE ANNOTATED CHART
Macro Analytics Chart Above: SUBSCRIBER LINK
| |
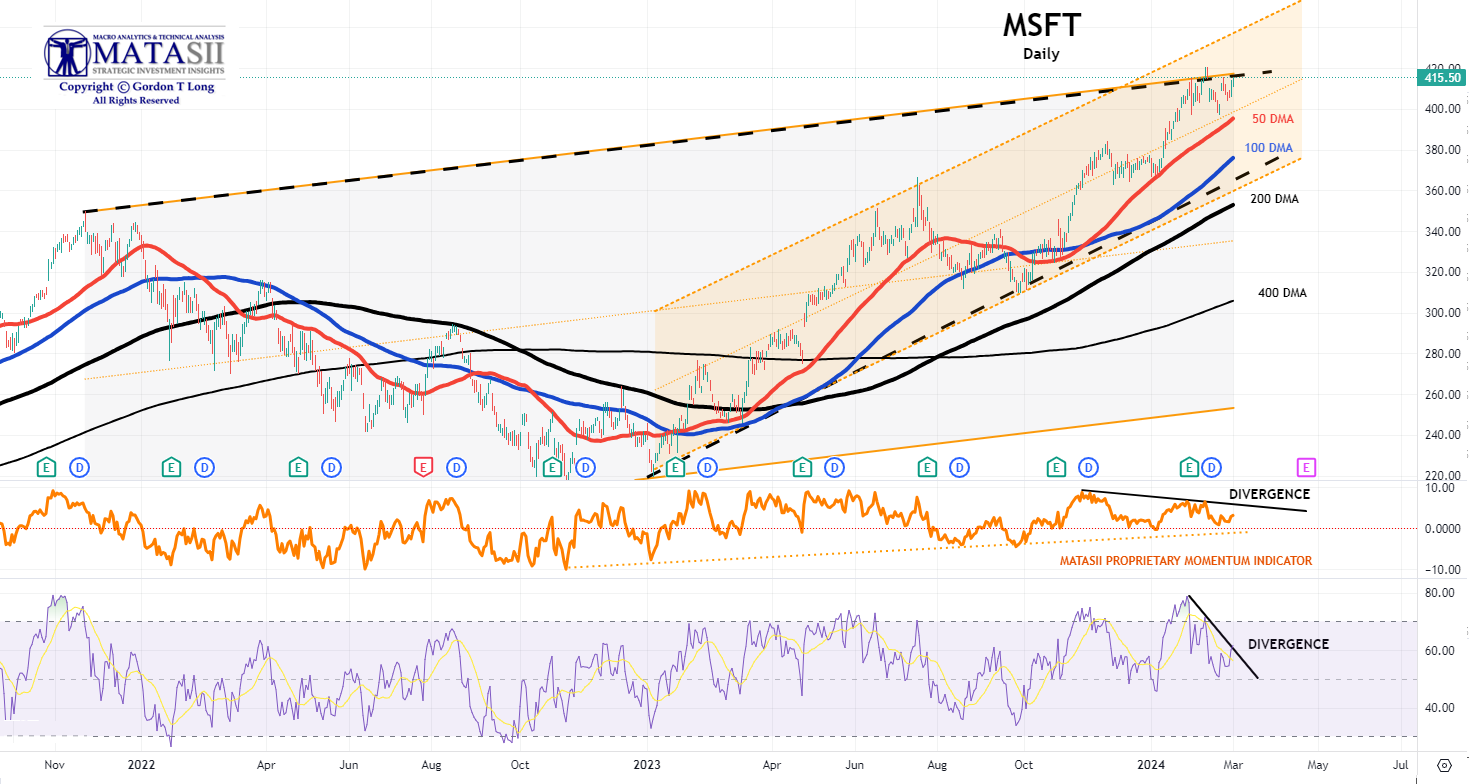
MICROSOFT
Heavy Divergence between Price and both Momentum and RSI suggests Microsoft may be near a near term high. Note the longer term rising wedge highlighted by converging black dotted trend lines.
| |
|
YOUR DESKTOP / TABLET / PHONE ANNOTATED CHART
Macro Analytics Chart Above: SUBSCRIBER LINK
| |
|
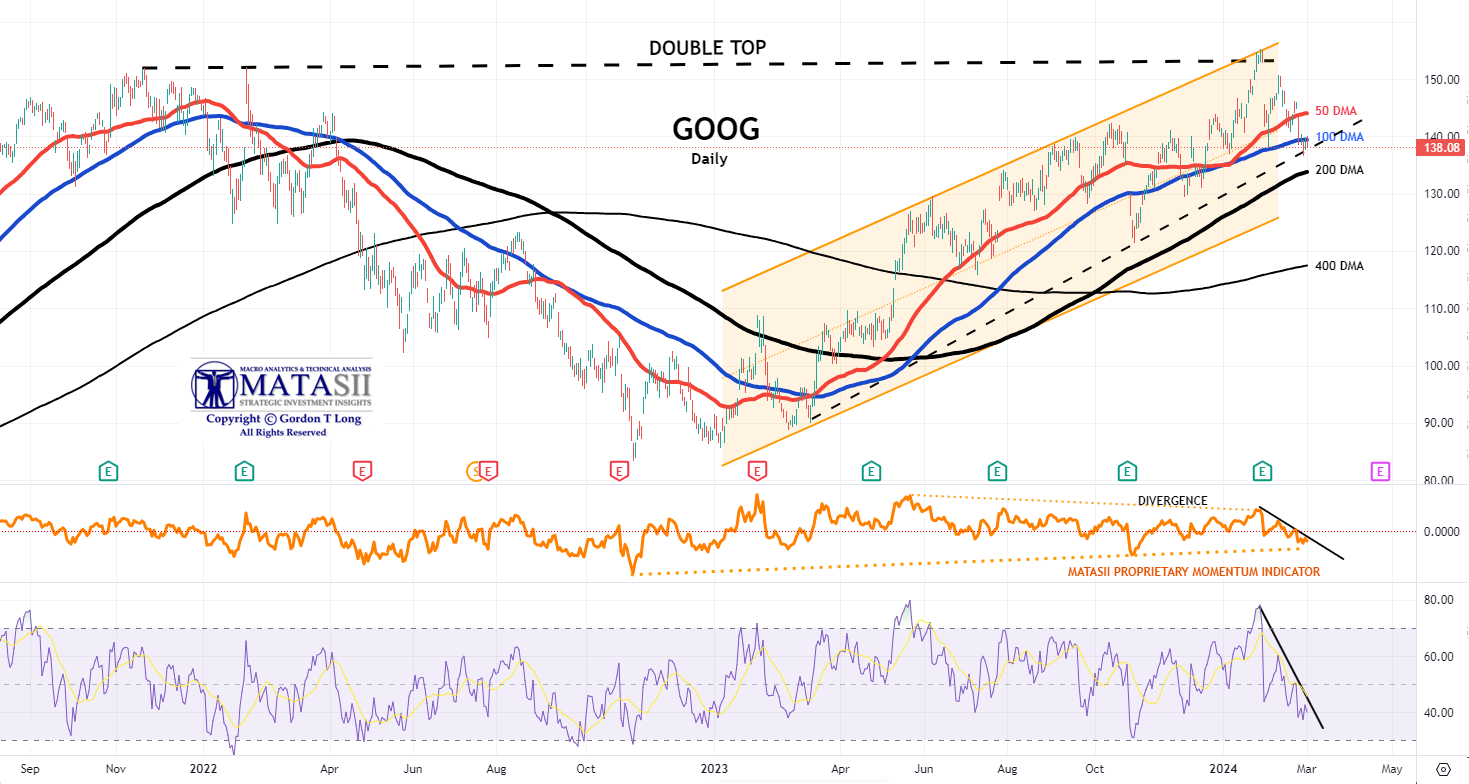
ALPHABET (GOOG)
Alphabet (GOOG) came near but did not touch its prior Double Top (black dashed line) before pulling back through its 50 and 100 DMAs. We also see a longer term diagonal pattern (black dotted converging trend lines), which suggests a short to intermediate top is near.
| |
|
YOUR DESKTOP / TABLET / PHONE ANNOTATED CHART
Macro Analytics Chart Above: SUBSCRIBER LINK
| |
|
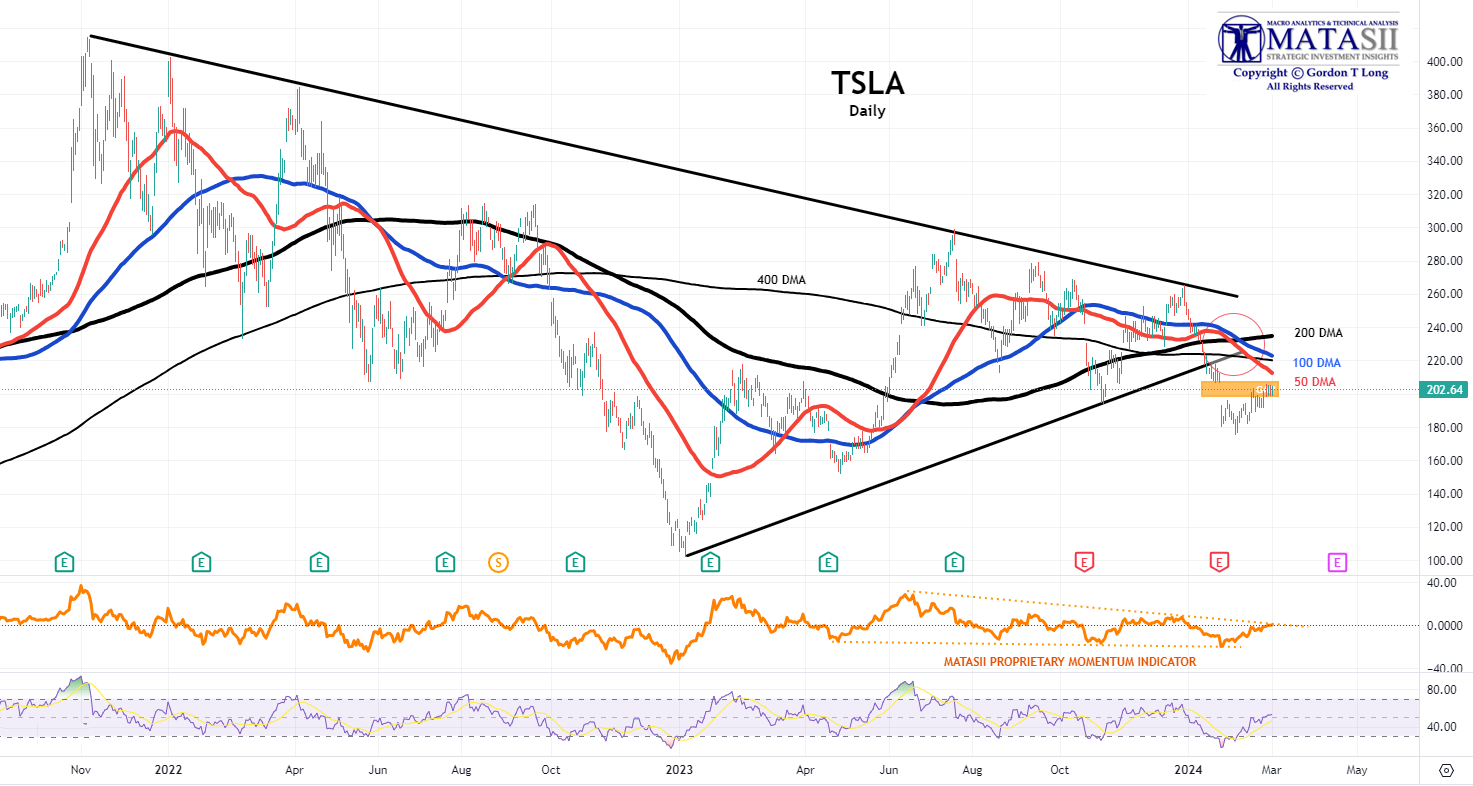
TESLA (TSLA)
The Tesla (TSLA) 50 and 100 DMAs have both crossed the 200 DMA in a downward trend. This is extremely bearish and is referred to as a Death Cross. As concerning is that the 50 DMA has also crossed the 400 DMA and the 100 DMA also appears ready to also break the 400 DMA.
Note that the long term wedge pattern (solid back converging trend lines) has recently been decisively broken to the downside.
| |
|
YOUR DESKTOP / TABLET / PHONE ANNOTATED CHART
Macro Analytics Chart Above: SUBSCRIBER LINK
| |
US EQUITY MARKETS
CONTROL PACKAGE
There are FIVE charts we have outlined in prior chart packages that we will continue to watch closely as a "control set".
-
The S&P 500 (CHART LINK)
-
The DJIA (CHART LINK)
-
The Russell 2000 through the IWM ETF (CHART LINK),
-
The MAGNIFICENT SEVEN (CHART ABOVE WITH MATASII CROSS - LINK)
-
Nvidia (NVDA) (CHART LINK)
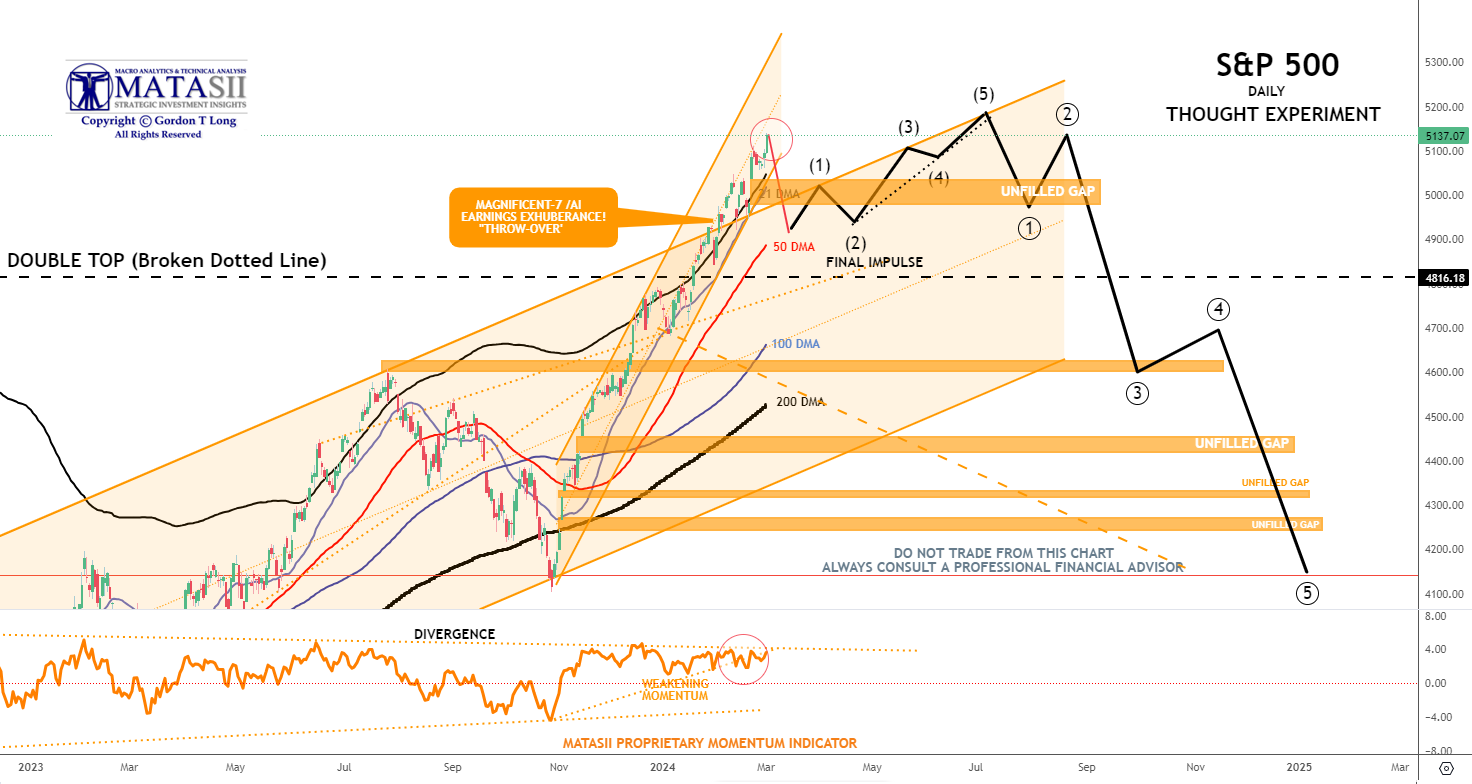
S&P 500 - Daily - Our Though Experiment
Our Though Experiment, which we have discussed previously, suggests we have put in a near term top (or very close to it) and will now consolidate before possibly completing one final small impulse higher or put in a 1-2 Wave of a much higher degree.
NOTE: To reiterate what I previously wrote - "the black labeled activity shown below, between now and July, looks like a "Killing Field" where the algos take Day Traders, "Dip Buyers", "Gamma Guys" and FOMO's all out on stretchers!"
| |
YOUR DESKTOP / TABLET / PHONE ANNOTATED CHART
Macro Analytics Chart Above: SUBSCRIBER LINK
| |
NOTICE Information on these pages contains forward-looking statements that involve risks and uncertainties. Markets and instruments profiled on this page are for informational purposes only and should not in any way come across as a recommendation to buy or sell in these assets. You should do your own thorough research before making any investment decisions. MATASII.com does not in any way guarantee that this information is free from mistakes, errors, or material misstatements. It also does not guarantee that this information is of a timely nature. Investing in Open Markets involves a great deal of risk, including the loss of all or a portion of your investment, as well as emotional distress. All risks, losses and costs associated with investing, including total loss of principal, are your responsibility.
FAIR USE NOTICE This site contains copyrighted material the use of which has not always been specifically authorized by the copyright owner. We are making such material available in our efforts to advance understanding of environmental, political, human rights, economic, democracy, scientific, and social justice issues, etc. We believe this constitutes a ‘fair use’ of any such copyrighted material as provided for in section 107 of the US Copyright Law. In accordance with Title 17 U.S.C. Section 107, the material on this site is distributed without profit to those who have expressed a prior interest in receiving the included information for research and educational purposes. If you wish to use copyrighted material from this site for purposes of your own that go beyond ‘fair use’, you must obtain permission from the copyright owner.
========
| |
MATASII'S STRATEGIC INVESTMENT INSIGHTS | |
2020 VIDEOS OUTLINING THE COMING RISE IN INFLATION & COMMODITY PRICES | |
IDENTIFICATION OF HIGH PROBABILITY TARGET ZONES | |
Learn the HPTZ Methodology!
Identify areas of High Probability for market movements
Set up your charts with accurate Market Road Maps
Available at Amazon.com
| |
The Most Insightful Macro Analytics On The Web | | | | |