|
LONGWave - FEBRUARY 2024
Technical Analysis - 02/12/24
| |
THE FED FUNDS RATE IS EFFECTIVELY ALREADY FALLING!
OBSERVATIONS: THE TARNISHED "MADE IN AMERICA" BRAND
I spent a lot of years earlier in my career involved in Manufacturing and Global Supply Chains. I have written in these pages on why I strongly feel Re-Shoring and De-Risking is a strategic imperative for the US. I believe that US Manufacturing superiority is in dire straights! Though I see the evidence almost daily, it again resonated with me when I read of Boeing's relentless problems and the potential takeover of the once great US Steel. What are they telling us?
GREAT AMERICAN BUSINESSES: Boeing and US Steel
Boeing's reputation is collapsing before our eyes from blatantly poor product and process quality problems. This once great "Made in America" brand now means nothing! It is perceived as reflection of the situation of US manufacturing capabilities overall!
US Steel is being taken over because it simply has lost its competitiveness due to US public policy having become almost predatory in its power generation & environment laws.
PRIMARY DRIVERS FOR OFFSHORING REMOVED
The reason that over 52,000 US manufacturing facilities left America after China entered the WTO in 2002 was primarily due to Chinese labor cost advantages and lower taxation. That is no longer the case. Chinese labor costs have soared. To compete it is about automation, which makes manufacturing Capital intensive - not labor intensive. US has the advantage here! Additionally, US corporate taxation is not what it used to be. The reasons that drove the offshoring wave have reversed!
The problem is that issues that were "annoying" 20 years ago are now show stoppers for investing in Manufacturing in the US.
SECONDARY FRUSTRATIONS GOT WORSE, MUCH WORSE!
-
Unproductive Regulations [Got Much Worse!]
-
Rule of Law: The safety of its employees and of business investment [Has Become a Problem from an Advantage]
-
Business Friendly & Stable Government (Regime change, socialist threat) [Has become a Major Concern]
-
Labor Pool: Union demands & worker expectations [College grads want nothing to do with this type of work.]
All these problems are fixable (like the US Fiscal Deficits), but it takes leadership, willingness to act and time. None of which we seem to have any of! The US is the Banana Republic of old that manufacturing investment avoided at all costs!!!
| |
|
THIS WEEK WE SAW
Exp=Expectations, Rev=Revision, Prev=Previous
US
US S&P Global Services PMI Final (Jan) 52.5 (Prev. 52.9)
US S&P Global Composite Final PMI (Jan) 52.0 (Prev. 52.3)
US ISM Non-Manufacturing PMI (Jan) 53.4 vs. Exp. 52.0 (Prev. 50.6, Rev. 50.5)
US Consumer Credit (Dec) 1.56B vs. Exp. 16.0B (Prev. 23.75B)
EU
German Imports MM -6.7% (exp. -1.5%); Exports MM -4.6% (exp. -2.0%); Trade Balance, EUR 22.2B (exp. 18.8B)
German HCOB Composite Final PMI (Jan) 47.0 vs. Exp. 47.1 (Prev. 47.1); HCOB Services PMI (Jan) 47.7 vs. Exp. 47.6 (Prev. 47.6)
German HCOB Services PMI (Jan) 47.7 vs. Exp. 47.6 (Prev. 47.6)
German HCOB Construction PMI (Jan) 36.3 (Prev. 37)
German Industrial Output MM (Dec) -1.6% vs. Exp. -0.4% (Prev. -0.7%)
ASIA
Chinese CPI YY (Jan) -0.8% vs. Exp. -0.5% (Prev. -0.3%)
Chinese PPI YY (Jan) -2.5% vs. Exp. -2.6% (Prev. -2.7%)
| |
========================= | |
|
WHAT YOU NEED TO KNOW!
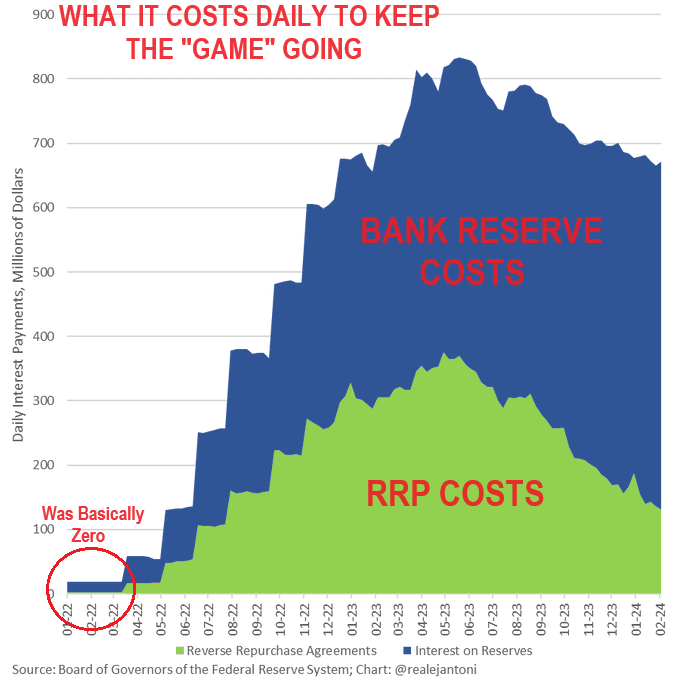
WHAT IT IS CURRENTLY COSTING THE FED TO KEEP THE "GAME" GOING!
The Federal Reserve is paying out $670 MILLION DAILY on interest payments to try and hold the system together. Even if the Fed's Reverse Repo account (RRPs) goes to zero, the money basically simply goes into bank reserves, which the Fed also pays interest on. Therefore, interest payments are here to stay unless Fed sells another $4.5 trillion off its balance sheet. This is hardly likely with QT soon to end and the Fed's balance Sheet to once again explode higher in the coming years.
REMEMBER: The Fed now paying interest on Bank Reserves and Reverse Repos is by far the main factor affecting market-determined interest rates.
RESEARCH
THE FED FUNDS RATE IS EFFECTIVELY ALREADY FALLING!
-
UNDERSTANDING WHY: Equities are RISING while Bonds are FALLING (Yields Rising)???
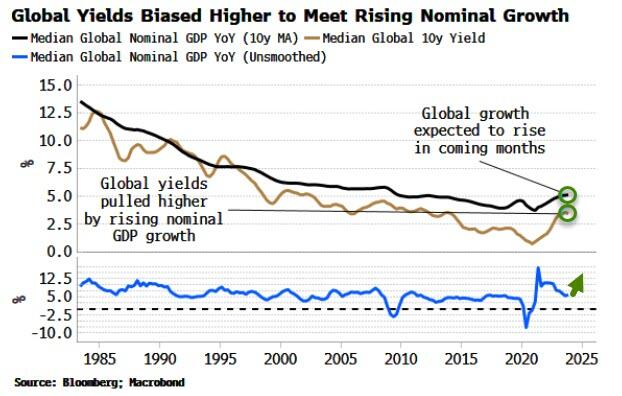
- Loosening Financial Conditions (as is to be expected) is now fostering a rise in Global Growth.
- Yields and yield curves therefore need to re-rate higher to reflect stronger nominal growth and a resurgence in global inflation.
- We need to understand that it is Forward rates (lower now due to the market expecting multiple rate cuts) PLUS Financial Conditions, which have eased significantly and is thereby providing the totality of the policy rate’s impact.
- Global central banks reached their peak rate restrictiveness last summer when banks in the aggregate stopped hiking, then some started cutting.
- As of February 1, 2024, the Federal Reserve Bank of Atlanta's GDPNow model estimates real GDP growth at 4.2% for the first quarter of 2024. This is an increase from the 3.0% estimate from January 26, 2024.
SELLING US DEBT SOON TO BECOME A SYSTEMIC PROBLEM!
- In 2024 the US has $8.9 TRILLION in existing debt needing to be refinanced ("roll overed"). This is in addition to the expected $1.7 TRILLION 2024 fiscal deficit.
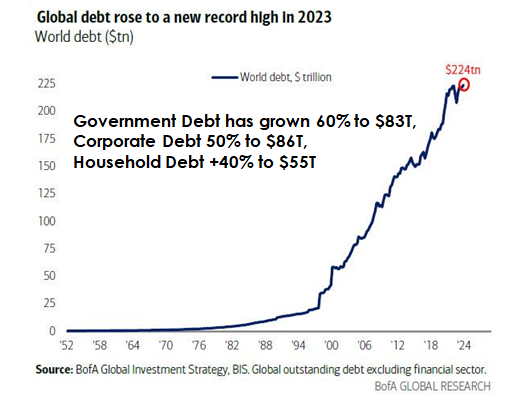
- There is now ~$224T of existing foreign debt that will also have rollover requirements in addition to the increases in global government, corporate and household debt, which are growing dramatically.
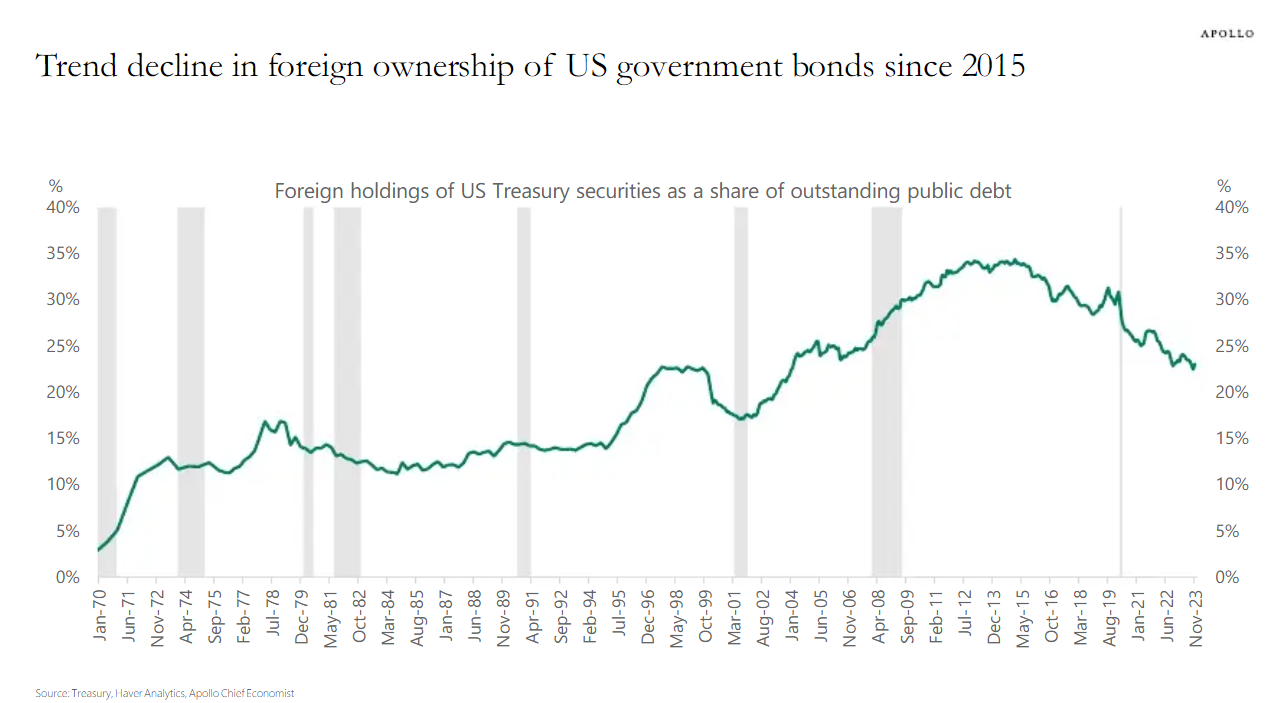
- The big problem facing the US is that foreign buyers have been steadily reducing their lending to fund US government debt due to De-Dollarization and shrinking growth rates of available FX reserves.
- With the rate of increase of the US Debt it is quickly becoming a matter of both sufficient lending volumes and at what rate?
Q4 2023 EARNINGS SEASON:
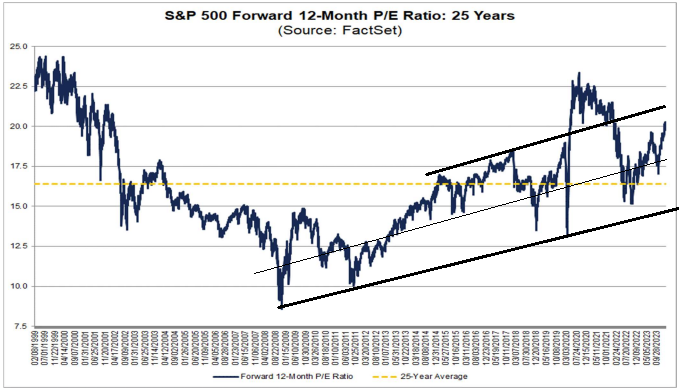
- S&P 500 Forward P/E Ratio Rose Above 20.0 For First Time in 2 Years.
- Percentage of Companies Beating EPS Estimates (75%) is Below 5-Year Average.
- Earnings Surprise Percentage (+3.8%) is Below 5-Year Average.
- Market Rewarding Positive EPS Surprises More Than Average.
- Percentage of Companies Beating Revenue Estimates (65%) is Below 5-Year Average.
- Revenue Surprise Percentage (+1.2%) is Below 5-Year Average.
- Financials: Banks Industry Leads Year-Over-Year Decline.
| |
|
DEVELOPMENTS TO WATCH
WHAT DO HISTORIC MARKET EXTREMES ACTUALLY TELL US?
- Equity Risk Premium (ERP)
- PE Ratios
- Velocity of Money
EXTREMES INDICATE WE ARE CONFUSED BY
WHAT IS HAPPENING!
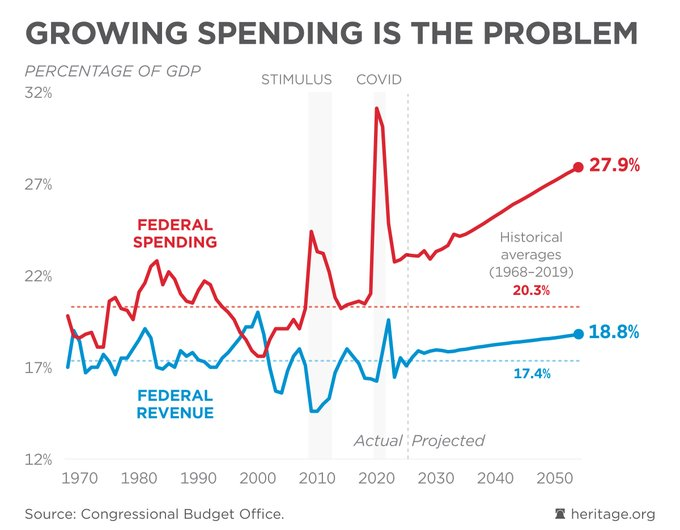
US FISCAL POLICY: THE PROBLEM IS SPENDING
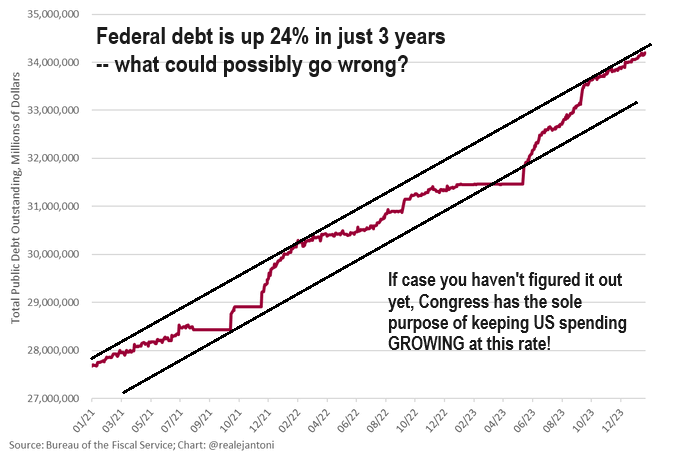
- The US Fiscal Deficit problem isn't a lack of revenue, but rather the relentless growth of government.
-
Congress has refused to do real budgeting for too long. America can't afford for its leaders to sleepwalk their way to a national bankruptcy. It's time to get serious...
-
In case you haven't figured it out yet, Congress has the sole purpose of keeping US spending GROWING at the current trend rate (or greater).
| |
|
GLOBAL ECONOMIC REPORTING
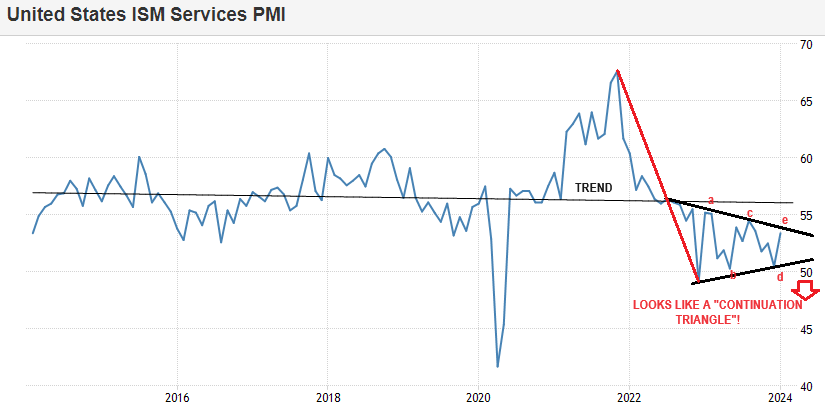
- The US ISM Services PMI in January was hot.
- The headline rose to 53.4 from 50.5, above the expected 52.0, and above the upper end of the forecast range of 53.2, while prices paid surged to 64.0 (prev. 57.4), the highest since February 2023.
| |
|
In this week's expanded "Current Market Perspectives", we focus on whether we are at or near an important Intermediate Top in US Equities.
=========
| |
|
THE FED FUNDS RATE IS EFFECTIVELY ALREADY FALLING
UNDERSTANDING WHY
Equities are RISING while Bonds are FALLING (Yields Rising)???
SITUATIONAL ANALYSIS:
- Loosening Financial Conditions (as is to be expected) is now fostering a rise in Global Growth.
- Yields and yield curves therefore need to re-rate higher to reflect stronger nominal growth and a resurgence in global inflation.
- We need to understand that it is Forward rates (lower now due to the market expecting multiple rate cuts) PLUS Financial Conditions, which have eased significantly and is thereby providing the totality of the policy rate’s impact.
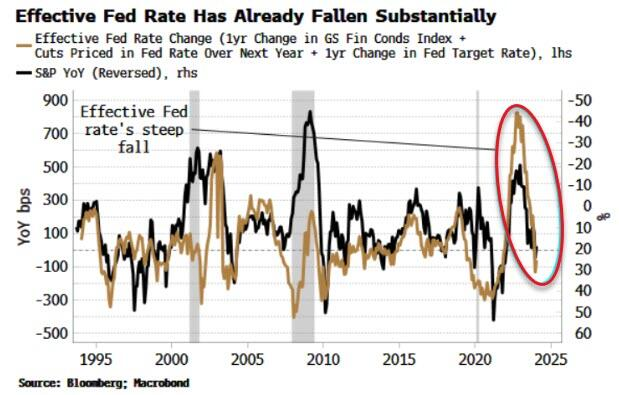
- The Federal Reserve policy rate is typically the last to move when the direction of interest rates is changing (it follows the 2Y US Treasury Note).
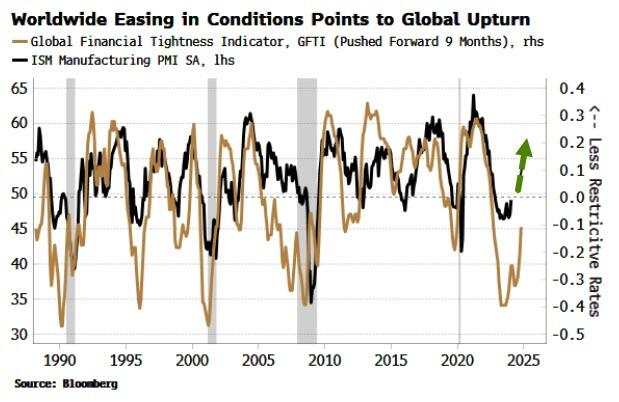
- Global central banks reached their peak rate restrictiveness last summer when banks in the aggregate stopped hiking, then some started cutting. The Global Financial Tightness Indicator (GFTI) shown below (essentially a diffusion of central-bank rate hikes) captures this and is now clearly easing. This points to a continued rise in the US manufacturing ISM, itself a highly reliable indicator of a cyclical upswing in the global economy.
| |
|
Rising global growth and a likely re-acceleration in inflation means nominal GDP should rise, pulling higher on global bond yields, especially while the risk of an imminent US recession remains low.
An inflation revival later in the year is also likely to catch central banks – who have turned prematurely dovish – off-guard, leaving yield curves more prone to bear steepening.
The Fed, ECB et al are at risk of cutting rates right around the time inflation rears its head again.
- Fear of flip-flopping will make them less likely to reverse direction and hike rates aggressively, increasing the chance policy rates lag inflation-sensing longer-term yields.
- Higher yields, as exemplified by the outlook for the US, are anticipated by only a very small proportion of professional investors (potential greatest "pain trade").
As of February 1, 2024, the Federal Reserve Bank of Atlanta's GDPNow model estimates real GDP growth at 4.2% for the first quarter of 2024. This is an increase from the 3.0% estimate from January 26, 2024.
| |
|
SELLING US DEBT SOON TO BECOME A SYSTEMIC PROBLEM!
In 2024 the US has $8.9 TRILLION in existing debt needing to be refinanced ("roll overed"). This is in addition to the expected $1.7 TRILLION 2024 fiscal deficit. Our analysis suggests the US deficit will in fact be expected to be well over $2 TRILLION, and with any sort of expanded Regional Banking Crisis or problems in Commercial Real Estate (CRE) the deficit could easily reach $3 TRILLION.
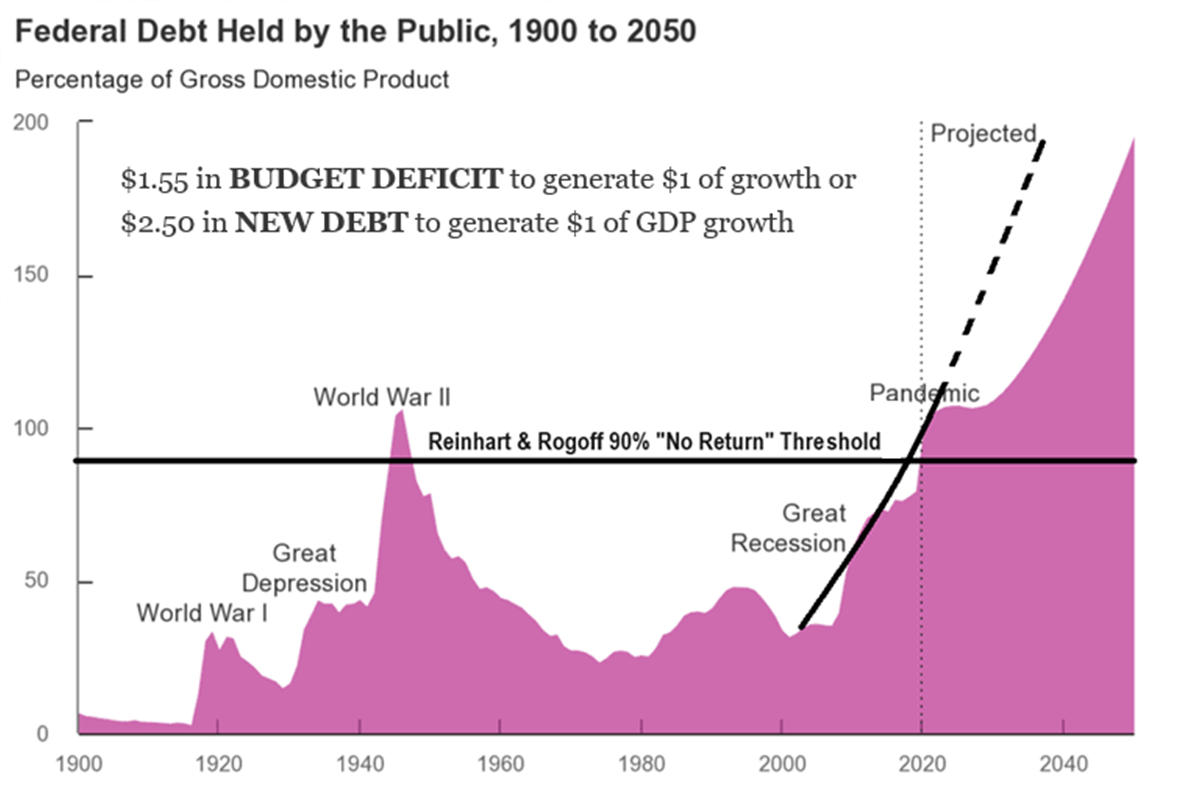
This means the US Federal government alone will need to find lenders to finance minimally, well over $10 TRILLION in US debt. If the economy slows in the slightest, the number will explode higher since it now takes:
| |
|
-
$1.55 in BUDGET DEFICIT to generate $1 of growth or
-
$2.50 in NEW DEBT to generate $1 of GDP growth
THE US WILL BE COMPETING FOR LENDERS
Additionally, the US will not only be competing against US Corporate and Consumer borrowing needs but also dramatically increasing foreign borrowing requirements.
There is now ~$224T of existing foreign debt that will also have rollover requirements in addition to the increases in global government, corporate and household debt, which are growing dramatically. (chart right)
There are increasingly serious concerns about whether this is possible (is there sufficient collateral to secure the increases); will lenders have the liquidity and what rates will it take to compete?
The big problem facing the US is that foreign buyers have been steadily reducing their lending to fund US government debt due to De-Dollarization and shrinking growth rates of available FX reserves.
| |
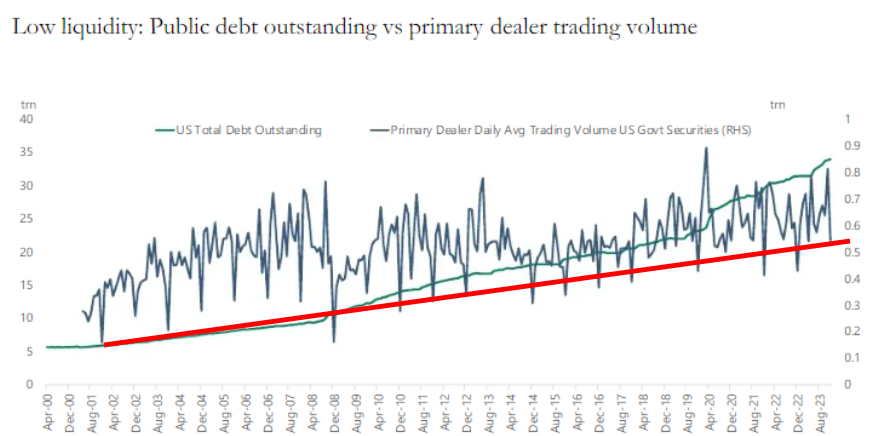
How long can the Primary Dealers be counted on to be fully capable of "back stopping" the Treasury debt auctions? There may be a looming systemic problem ahead! | |
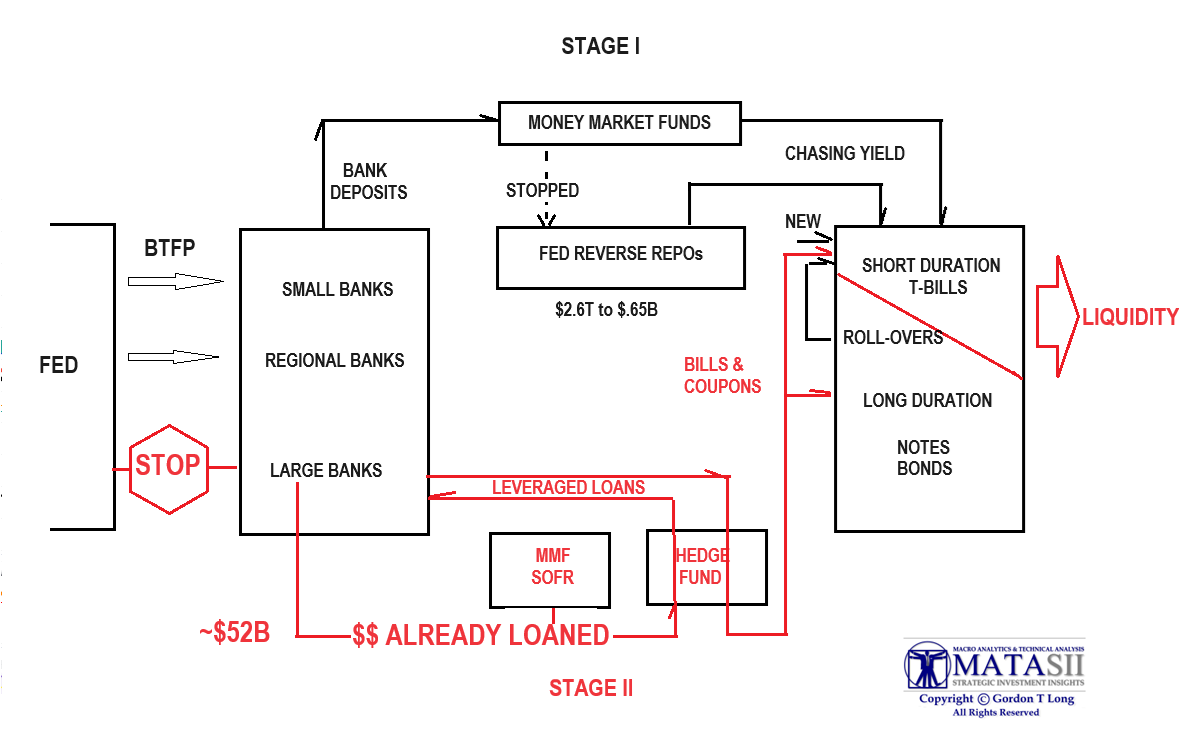
A long as Yellen's Stage II Stealth funding continues, there shouldn't be a problem. Like Stage I however, it also has a limitation. Let the games continue until they can't. | |
|
Q4 2023 EARNINGS:
KEY METRICS
-
Earnings Scorecard: For Q4 2023 (with 67% of S&P 500 companies reporting actual results), 75% of S&P 500 companies have reported a positive EPS surprise and 65% of S&P 500 companies have reported a positive revenue surprise.
-
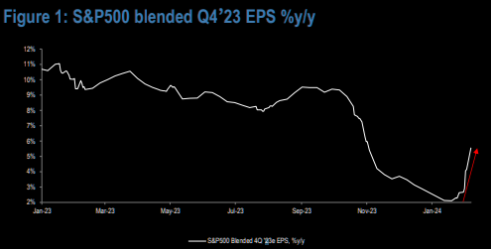
Earnings Growth: For Q4 2023, the blended (year-over-year) earnings growth rate for the S&P 500 is 2.9%. If 2.9% is the actual growth rate for the quarter, it will mark the second-straight quarter that the index has reported earnings growth.
-
Earnings Revisions: On December 31, the estimated (year-over-year) earnings growth rate for the S&P 500 for Q4 2023 was 1.5%. Eight sectors are reporting higher earnings today compared to December 31 due to positive EPS surprises.
-
Earnings Guidance: For Q1 2024, 52 S&P 500 companies have issued negative EPS guidance and 21 S&P 500 companies have issued positive EPS guidance.
-
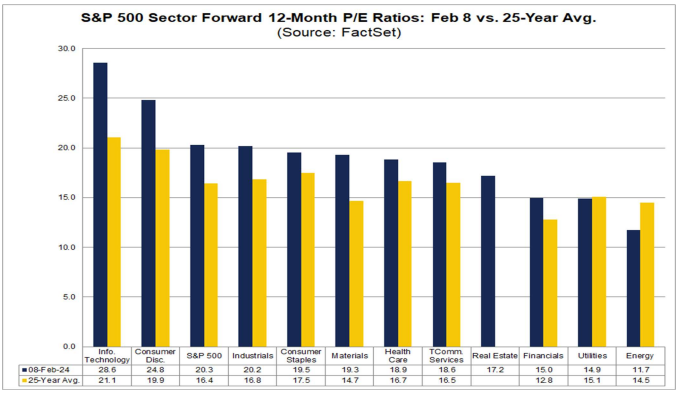
Valuation: The forward 12-month P/E ratio for the S&P 500 is 20.3. This P/E ratio is above the 5-year average (18.9) and above the 10-year average (17.7).
| |
- S&P 500 Forward P/E Ratio Rose Above 20.0 For First Time in 2 Years.
- Percentage of Companies Beating EPS Estimates (75%) is Below 5-Year Average.
- Earnings Surprise Percentage (+3.8%) is Below 5-Year Average.
- Market Rewarding Positive EPS Surprises More Than Average.
- Percentage of Companies Beating Revenue Estimates (65%) is Below 5-Year Average.
- Revenue Surprise Percentage (+1.2%) is Below 5-Year Average.
- Financials: Banks Industry Leads Year-Over-Year Decline.
| |
|
DEVELOPMENTS TO WATCH
WHAT DO HISTORIC MARKET EXTREMES TELL US?
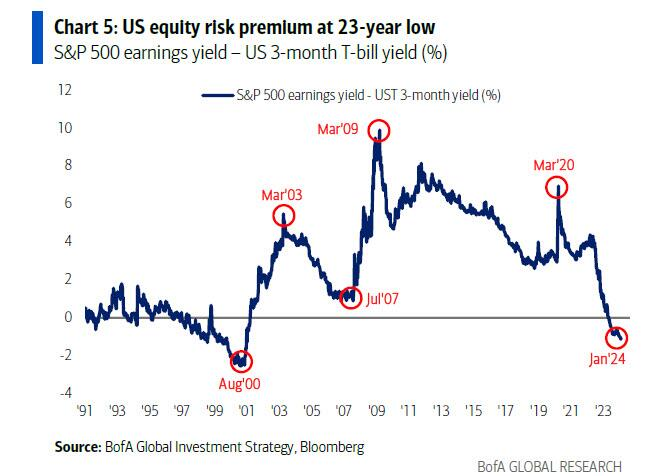
EQUITY RISK PREMIUM (ERP)
- The Equity Risk Premium is at 23-year lows.
- The S&P 500 earnings yield minus 3mth T-bill yields has not been this low since 2001.
- At the height of the dotcom bubble, the ERP was lower than now.
- All this tells us is that the market is overvalued, and we should not be surprised to see it become more so. No one knows whether the dotcom ERP lows represent an absolute limit?
- All we know from the past is that when markets move to extreme over/under-valuations, wild moves in price can happen.
PE RATIOS
- If you look at a long-term S&P 500 price-to-earnings ratio, you’ll find that it swings massively.
- In the early 1980s, investors paid a price of roughly 7x earnings for the S&P 500.
- In 2001 they paid almost 50x.
- In 2011 they paid around 13.5x.
- Now they pay around 27 or so.
- Wall Street has created armies of analysts to forecast corporate earnings, while relatively little effort is put into forecasting the large swings in the multiple investors are willing to pay for those earnings.
- Because such forecasts are harder to do; they require less math and more intuition.
VELOCITY OF MONEY
- For nearly 20 years, the velocity of money declined.
- This prompted/allowed policy makers to create massive amounts of money without sparking inflation.
- No honest economist could really explain it.
- The Fed got ever more aggressive, searching for the limit.
- Then along came Covid. Velocity collapsed further, stabilized, reversed.
- Given that no one really knew why velocity fell, if it now rises powerfully, we’re unlikely to understand why. It won’t really matter though, all that we will need to know is that its effect on prices will dwarf any notion of value.
EXTREMES INDICATE WE ARE CONFUSED WITH WHAT IS HAPPENING!
Money can be created in all sorts of ways in a fiat monetary system. This makes it hard to know how much there is at
any given point in time and therefore what the true value of something is.
| |
|
US FISCAL POLICY: THE PROBLEM IS SPENDING
We felt the consequences of the huge deficit spending spike in 2020:
- The worst inflation wave in four decades, leaving typical households worse off today than they were five years ago.
- Interest rate hikes that have put a family home out of reach for young couples across the country, not just in coastal cities. That means fewer children, dimming the nation's future.
- Interest rates have also made payments to cover the national debt surge to the highest levels (relative to the economy) in generations. This will be an anchor around our feet.
We're set to have larger and larger deficits as federal spending grows on autopilot every year.
| |
That means more inflationary pressure, keeping the cost of living high and making it harder to bring interest rates down.
The problem isn't a lack of revenue, but the relentless growth of government.
Congress has refused to do real budgeting for too long. America can't afford for its leaders to sleepwalk their way to a national bankruptcy. It's time to get serious...
In case you haven't figured it out yet, Congress has the sole purpose of keeping US spending GROWING at this rate. (right)
| |
|
GLOBAL ECONOMIC INDICATORS: What This Week's Key Global Economic Releases Tell Us
ISM SERVICES
The US ISM Services PMI in January was hot.
The headline rose to 53.4 from 50.5, above the expected 52.0, and above the upper end of the forecast range of 53.2, while prices paid surged to 64.0 (prev. 57.4), the highest since February 2023.
- Employment lifted back into expansionary territory printing 50.5 (prev. 43.8), while business activity was unchanged at 55.8.
- Backlog of new orders and supplier deliveries both rose back above 50.0 to 55.0 (prev. 52.8) and 52.4 (prev. 49.5), respectively.
- Overall, the report is hawkish, and after Friday’s US jobs report, it is the second figure which provides further tailwinds for those calling for the first cut to happen in May or later.
- Within the dataset: “The past relationship between the Services PMI and the overall economy indicates that the Services PMI for January (53.4 percent) corresponds to a 1.5% increase in real GDP on an annualized basis.”
-
On the release, Pantheon Macroeconomics pointed out, "The 2.9-point rise in the headline sounds impressive but a rebound always seemed likely after the sharp December drop".
-
Moreover, PM states, "the data adds to the evidence that the Fed’s rate hikes have not yet led to a marked slowdown in the services sector. But some tailwinds for the services sector, most notably, consumers’ excess pandemic savings, are now fading".
- Pantheon expect growth in services' activity to moderate over the next few quarters. Although, the consultancy does conclude it sees little sign of this happening just yet.
| |
REMEMBER LAST FRIDAYS BLS' LABOR REPORT WE REFUSED TO ACCEPT?
Square that report it with the following layoffs announced or took place in the last few weeks:
| |
|
1. Twitch: 35% of workforce
2. Roomba: 31% of workforce
3. Hasbro: 20% of workforce
4. LA Times: 20% of workforce
5. Spotify: 17% of workforce
6. Levi's: 15% of workforce
7. Xerox: 15% of workforce
8. Qualtrics: 14% of workforce
9. Wayfair: 13% of workforce
10. Duolingo: 10% of workforce
11. Washington Post: 10% of workforce
12: Snap: 10% of workforce
| |  |
|
13. eBay: 9% of workforce
14. Business Insider: 8% of workforce
15. Paypal: 7% of workforce
16. Okta: 7% of workforce
17. Charles Schwab: 6% of workforce
18. Docusign: 6% of workforce
19. UPS: 2% of workforce
20. Blackrock: 3% of workforce
21. Citigroup: 20,000 employees
22. Pixar: 1,300 employees
| |
|
GLOBAL MACRO
WHAT DOES YOUR SCAN OF THE DATA BELOW TELL YOU? - THE MEDIA AVOIDS BAD NEWS!
We present the data in a way you can quickly see what is happening.
THIS WEEK WE SAW
Exp=Expectations, Rev=Revision, Prev=Previous
| |
|
UNITED STATES
- US Factory Orders MM (Dec) 0.2% vs. Exp. 0.2% (Prev. 2.6%)
-
US S&P Global Services PMI Final (Jan) 52.5 (Prev. 52.9)
-
US S&P Global Composite Final PMI (Jan) 52.0 (Prev. 52.3)
-
US ISM Non-Manufacturing PMI (Jan) 53.4 vs. Exp. 52.0 (Prev. 50.6, Rev. 50.5)
- US ISM Non-Manufacturing New Orders Index (Jan) 55.0 (Prev. 52.8)
- US ISM Non-Manufacturing Index (Jan) 50.5 (Prev. 43.3, Rev. 43.8)
- US ISM Non-Manufacturing Price Paid Index (Jan) 64.0 (Prev. 57.4)
- US International Trade (USD)(Dec) -62.2B vs. Exp. -62.2B (Prev. -63.2B, Rev. -61.9B)
-
US Consumer Credit (Dec) 1.56B vs. Exp. 16.0B (Prev. 23.75B)
- US Manheim Wholesale Used Vehicle Index (Jan) 0.0% (Prev. -0.5%); YY -9.2% Y/Y (prev. -7.0%) at 204.0
- US Wholesale Inventories MM (Dec) 0.4% vs. Exp. 0.4% (Prev. 0.4%)
- US Wholesale Sales MM (Dec) 0.7% vs. Exp. 0.2% (Rev. -0.1%)
- US Initial Jobless Claims 218k vs. Exp. 220k (Prev. 224k, Rev. 227k)
- US Continued Jobless Claims w/e 1.871M vs. Exp. 1.878M (Prev. 1.898M, Rev. 1.894M)
CHINA
- Chinese Caixin Services PMI (Jan) 52.7 vs. Exp. 53.0 (Prev. 52.9); Caixin Composite PMI (Jan) 52.5 (Prev. 52.6)
- Chinese FX Reserves (Monthly) (Jan) 3.219Trl vs. Exp. 3.217Trl (Prev. 3.238Trl)
- Chinese CPI MM (Jan) 0.3% vs. Exp. 0.4% (Prev. 0.1%)
-
Chinese CPI YY (Jan) -0.8% vs. Exp. -0.5% (Prev. -0.3%)
-
Chinese PPI YY (Jan) -2.5% vs. Exp. -2.6% (Prev. -2.7%)
- Chinese CPI MM (Jan) 0.3% vs. Exp. 0.4% (Prev. 0.1%); CPI YY (Jan) -0.8% vs. Exp. -0.5% (Prev. -0.3%); PPI YY (Jan) -2.5% vs. Exp. -2.6% (Prev. -2.7%)
JAPAN
- Japanese All Household Spending MM (Dec) -0.9% vs. Exp. 0.2% (Prev. -1.0%)
- Japanese All Household Spending YY (Dec) -2.5% vs. Exp. -2.1% (Prev. -2.9%)
- Japanese Overall Labor Cash Earnings (Dec) 1.0% vs. Exp. 1.3% (Prev. 0.2%)
UK
- UK S&P Global Services PMI (Jan) 54.3 vs. Exp. 53.8 (Prev. 53.8)
- UK S&P Global Composite PMI (Jan) 52.9 (Prev. 52.5)
- UK BRC Retail Sales YY (Jan) 1.4% (Prev. 1.9%)
- UK BRC Total Sales YY (Jan) 1.2% (Prev. 1.7%)
- UK S&P Global Construction PMI (Jan) 48.8 vs. Exp. 47.3 (Prev. 46.8)
- UK Halifax House Prices MM (Jan) 1.3% (Prev. 1.1%)
- UK RICS House Price Balance (Jan) -18 vs. Exp. -25 (Prev. -30, Rev. -29),
AUSTRALIA
- Australian Trade Balance (AUD)(Dec) 10.96B vs Exp. 11.00B (Prev. 11.44B); Exports MM (Dec) 1.8% (Prev. 1.7%); Imports MM (Dec) 4.8% (Prev. -7.9%)
- Australian Retail Trade (Q4) 0.3% vs. Exp. 0.1% (Prev. 0.2%, Rev. -0.1%)
NEW ZEALND
- New Zealand HLFS Job Growth QQ (Q4) 0.4% vs. Exp. 0.3% (Prev. -0.2%)
- New Zealand HLFS Unemployment Rate (Q4) 4.0% vs. Exp. 4.2% (Prev. 3.9%)
- New Zealand Labor Cost Index QQ(Q4) 1.0% vs. Exp. 0.8% (Prev. 0.8%)
- New Zealand Labor Cost Index YY (Q4) 3.9% vs. Exp. 3.8% (Prev. 4.1%)
- New Zealand HLFS Job Growth QQ (Q4) 0.4% vs. Exp. 0.3% (Prev. -0.2%); HLFS Unemployment Rate (Q4) 4.0% vs. Exp. 4.2% (Prev. 3.9%); Labor Cost Index QQ(Q4) 1.0% vs. Exp. 0.8% (Prev. 0.8%); Labor Cost Index YY (Q4) 3.9% vs. Exp. 3.8% (Prev. 4.1%)
| | |
|
EU
- EU HCOB Services Final PMI (Jan) 48.4 vs. Exp. 48.4 (Prev. 48.4); Composite Final PMI (Jan) 47.9 vs. Exp. 47.9 (Prev. 47.9)
- UK S&P Global Services PMI (Jan) 54.3 vs. Exp. 53.8 (Prev. 53.8); Global Composite PMI (Jan) 52.9 (Prev. 52.5)
- EU Sentix Index (Feb) -12.9 vs. Exp. -15.0 (Prev. -15.8)
- EU Producer Prices MM (Dec) -0.8% vs. Exp. -0.8% (Prev. -0.3%); YY (Dec) -10.6% vs. Exp. -10.5% (Prev. -8.8%)
- EU HCOB Services PMI (Jan F) 48.4 vs. Exp. 48.4 (Prev. 48.4)
- EU S&P Global Composite PMI (Jan F) 47.9 vs. Exp. 47.9 (Prev. 47.9)
- EU Producer Prices MM (Dec) -0.8% vs. Exp. -0.8% (Prev. -0.3%)
- EU Producer Prices YY (Dec) -10.6% vs. Exp. -10.5% (Prev. -8.8%)
- EU Sentix Index (Feb) -12.9 vs. Exp. -15.0 (Prev. -15.8)
- EU HCOB Construction PMI (Jan) 41.3 (Prev. 43.6)
- EU Retail Sales YY (Dec) -0.8% vs. Exp. -0.9% (Prev. -1.1%, Rev. -0.4%); Retail Sales MM (Dec) -1.1% vs. Exp. -1.0% (Prev. -0.3%, Rev. 0.3%)
GERMANY
-
German Imports MM -6.7% (exp. -1.5%); Exports MM -4.6% (exp. -2.0%); Trade Balance, EUR 22.2B (exp. 18.8B)
-
German HCOB Composite Final PMI (Jan) 47.0 vs. Exp. 47.1 (Prev. 47.1); HCOB Services PMI (Jan) 47.7 vs. Exp. 47.6 (Prev. 47.6)
-
German HCOB Services PMI (Jan) 47.7 vs. Exp. 47.6 (Prev. 47.6)
- German HCOB Composite Final PMI (Jan) 47.0 vs. Exp. 47.1 (Prev. 47.1)
- German Industrial Orders MM (Dec) 8.9% vs. Exp. 0.0% (Prev. 0.3%)
-
German HCOB Construction PMI (Jan) 36.3 (Prev. 37)
-
German Industrial Output MM (Dec) -1.6% vs. Exp. -0.4% (Prev. -0.7%)
FRANCE
- French S&P Global Services PMI (Jan) 45.4 vs. Exp. 45 (Prev. 45); HCOB Composite PMI (Jan) 44.6 vs. Exp. 44.2 (Prev. 44.2)
- French S&P Global Services PMI (Jan) 45.4 vs. Exp. 45 (Prev. 45)
- French HCOB Composite PMI (Jan) 44.6 vs. Exp. 44.2 (Prev. 44.2)
- French HCOB Construction PMI (Jan) 39.6 (Prev. 42.6)
- French Non-Farm Payrolls QQ (Q4) 0.0% (Prev. 0.10%)
- French Trade Balance, EUR, SA (Dec) -6.829B (Prev. -5.943B, Rev. -5.939B); Imports, EUR (Dec) 57.021B (Prev. 55.395B); Exports, EUR (Dec) 50.192B (Prev. 49.451B); Current Account (Dec) -0.7B (Prev. -2.8B)
SPAIN
- Spanish Services PMI (Jan) 52.1 vs. Exp. 52.1 (Prev. 51.5)
- Spanish Ind Output Cal Adj YY (Dec) -0.2% vs. Exp. -0.2% (Prev. 0.8%, Rev. 0.9%)
ITALY
- Italian HCOB Services PMI (Jan) 51.2 vs. Exp. 50.6 (Prev. 49.8)
- Italian HCOB Construction PMI (Jan) 51.6 (Prev. 55.2)
- Italian Mfg Business Confidence (Jan) 88.3 (Prev. 95.4, Rev. 87.3); Consumer Confidence (Jan) 96.4 (Prev. 106.7, Rev. 95.8)
- Italian Retail Sales NSA YY (Dec) 0.3% (Prev. 1.5%); Retail Sales SA MM (Dec) -0.1% (Prev. 0.4%)
TURKEY
- Turkish CPI YY (Jan) 64.86% vs. Exp. 64.52% (Prev. 64.77%); CPI MM (Jan) 6.7% vs. Exp. 6.49% (Prev. 2.93%)
- Turkish PPI YY (Jan) 44.2% (Prev. 44.22%); PPI MM (Jan) 4.14% (Prev. 1.14%)
| |
CURRENT MARKET PERSPECTIVE | |
|
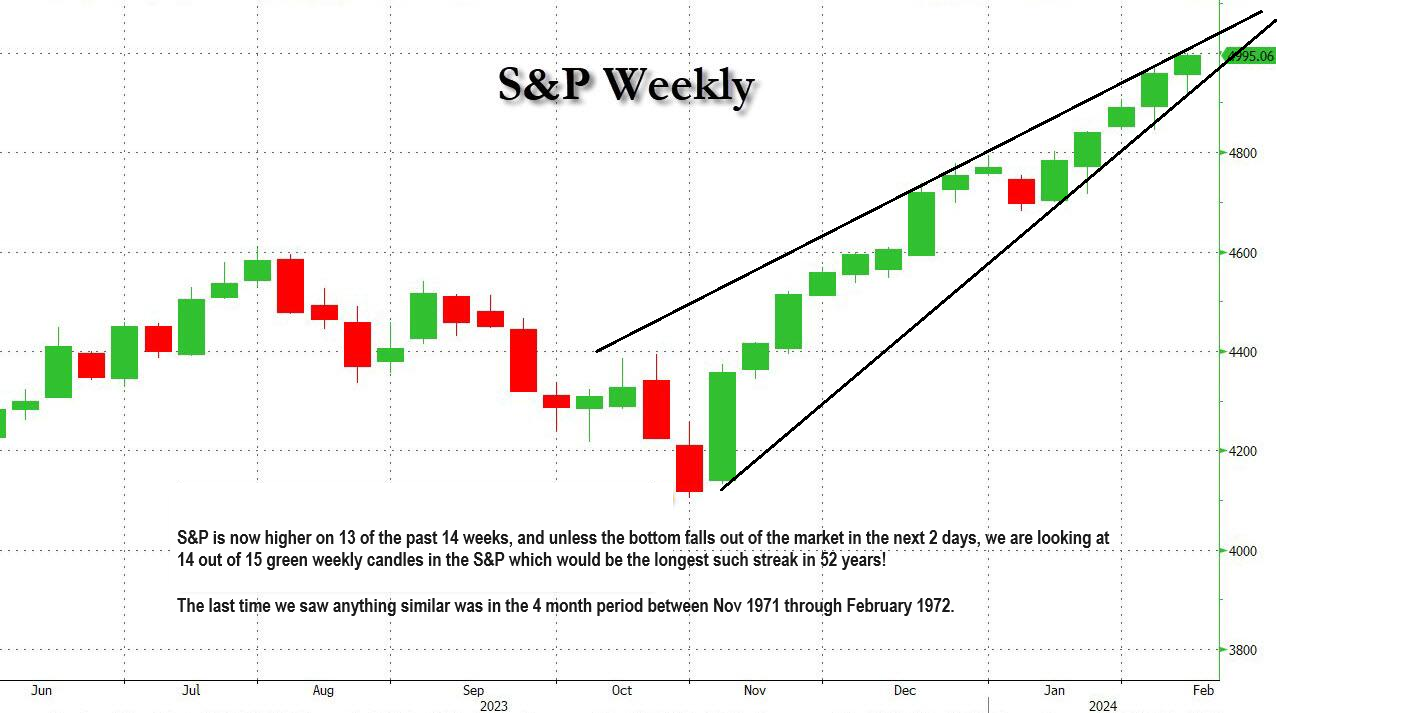
LONGEST STREAK IN 52 YEARS
DELIVERS S&P 500 > 5000!
"The Last 5% Is Always The Most Expensive!"
Click All Charts to Enlarge
| |
|
1 - SITUATIONAL ANALYSIS
"As confidence turns to arrogance, the potential energy for a major market shift builds. Investors get short volatility. This dynamic never changes."
"WE ARE MORE THAN A LITTLE STRETCHED!"
CHART TOP RIGHT:
S&P is now higher on 14 out of 15 green weekly candles in the S&P, which is the longest such streak in 52 years! The last time we saw anything similar was in the 4 month period between Nov. 1971 through Feb. 1972.
CHART BELOW
The Goldman TMT Momentum pair that has gone parabolic. Up 9 days in a row.
| |
|
ABOVE: We appear to have a bullish "Ending Diagonal" emerging.
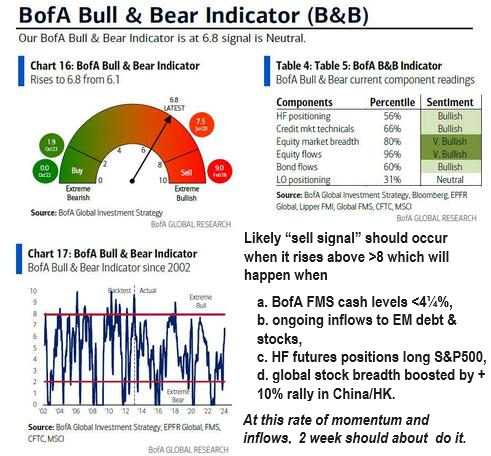
BELOW: The melt-up window is rapidly closed, and that in the latest week the BofA Bull and Bear indicator jumped to 6.8 from from 6.1, a jump driven primarily by strong inflows to risky EM assets, and fast approaching the "sell" trigger.
| |
|
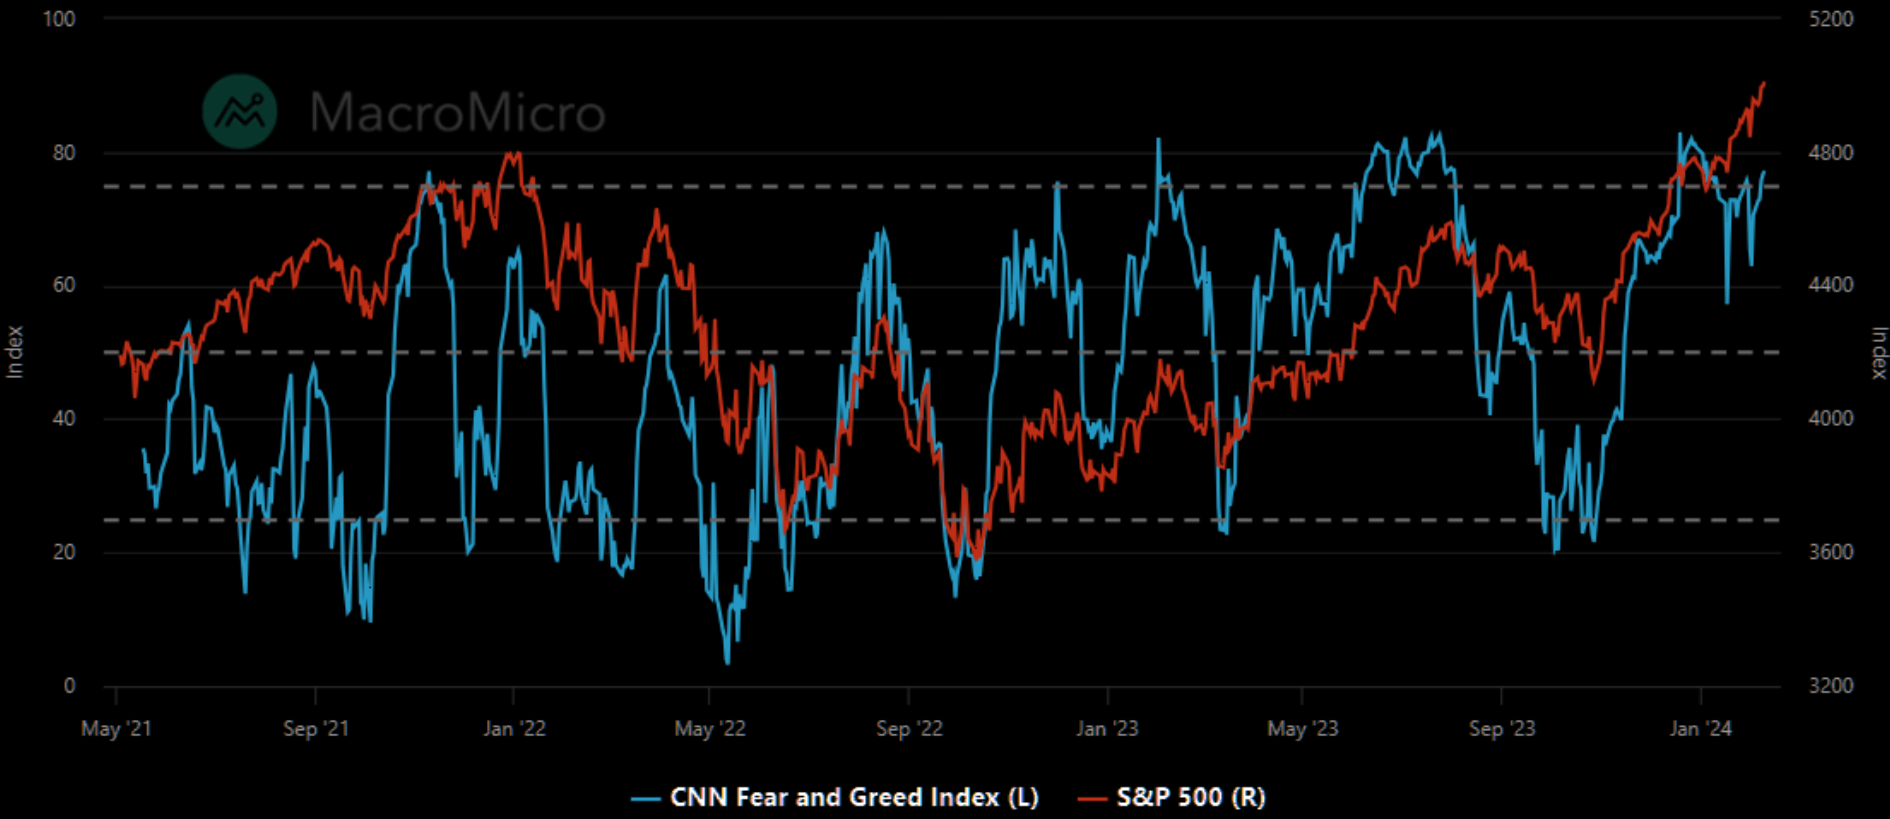
The CNN Fear-Greed Index shows the correlation of extreme Greed versus S&P 500.
REMEMBER: "The last 5% is always the most expensive!"
| |
Put call ratio at levels that have been associated with a pullback in markets. | |
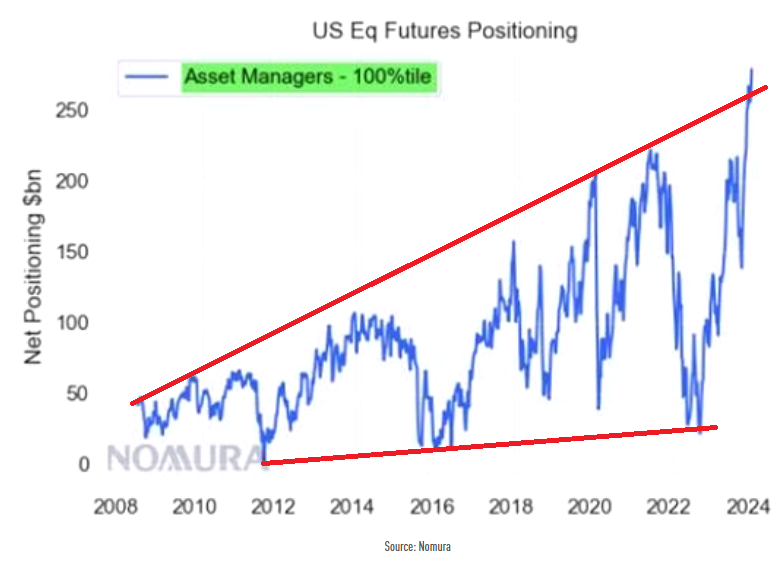
WHO IS LEFT TO BUY? WHERE ARE THE INCREMENTAL NEW BUYERS?? | |
Where will the incremental buyers now come from?? It wouldn't take many incremental sellers to disrupt the exuberance. | | |
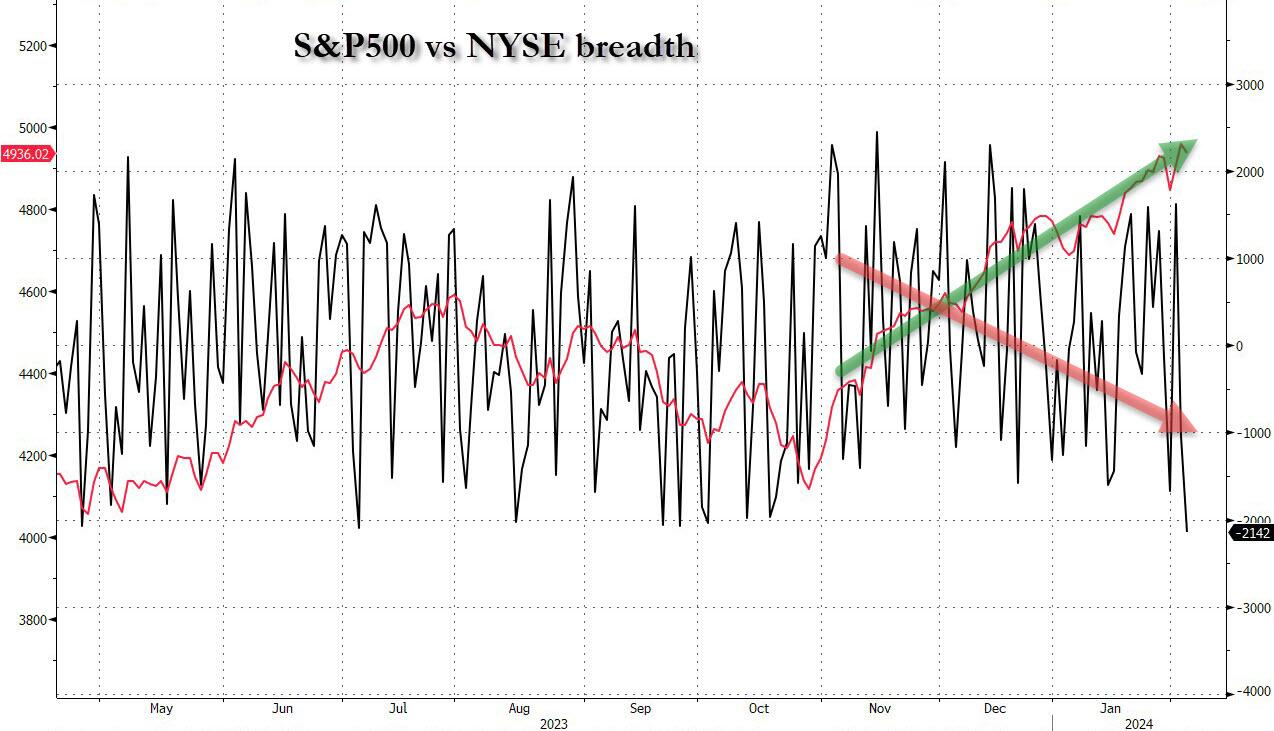
Fewer than 40% of stocks on the New York Stock Exchange are trading up, creating the biggest divergence in breadth since the Black Monday crash in 1987 (data from Sentiment Trader). We basically have two equity markets buried under the same index — one is Big Tech and the other is everything else — the banks, the materials, energy stocks and others. | | |
|
Just a few stats to digest via Goldman Sachs, remembering who is currently lifting this market higher:
- AAPL: Repurchased $20.5 billion in Q4, leaving $53.6 billion of the previous $90 billion authorization, with $173 billion in cash and cash equivalents.
- GOOG: Repurchased $16.1 billion in Q4, leaving $36.3 billion of the previous $70 billion authorization, with $111 billion in cash and marketable securities.
- META: Repurchased $6.3 billion in Q4, leaving $30.9 billion of the previous $40 billion authorization (and announced a $50 billion increase), with $65.4 billion in cash and marketable securities.
- MSFT: Repurchased $4.0 billion in Q4, leaving $15.9 billion of the previous $60 billion authorization, with $81 billion in cash and cash equivalents.
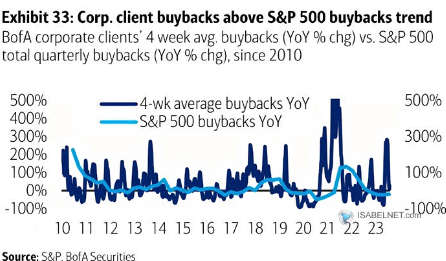
Overall corporate client buybacks as expected strongly accelerated and are tracking above typical seasonality levels for a twelfth week in a row. YTD, buybacks as a percentage of S&P 500 market cap (0.29%), are above '23 highs (0.27%) at this time.
| |
BoA's Corporate Clients - 4 Week Average Buybacks v S&P 500 Total Quarterly Buybacks | | |
|
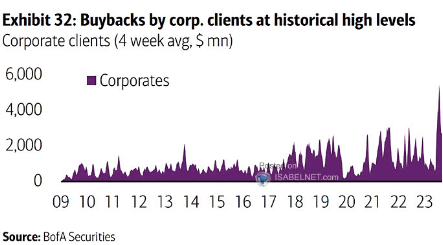
BoA's Corporate Buybacks - 4 Week Average -
At historical high levels!
| | |
|
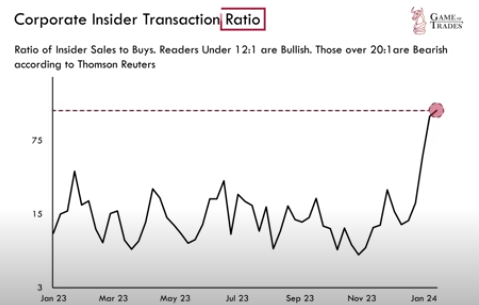
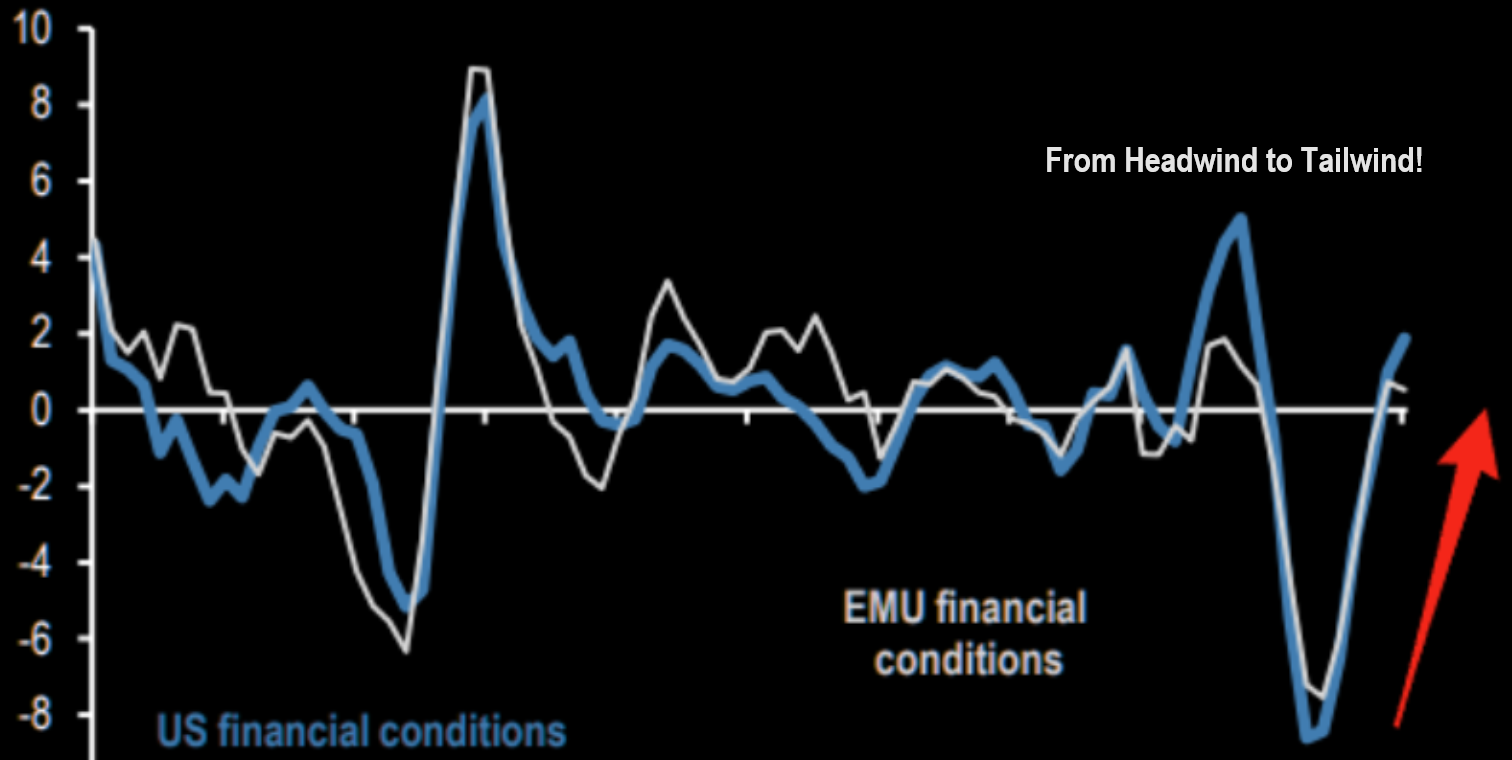
Corporate insiders are clearly worried with what they are seeing inside their market sectors (chart below left), while the easy Financial Conditions which coincided with the historic market lift since early November is abruptly changing.
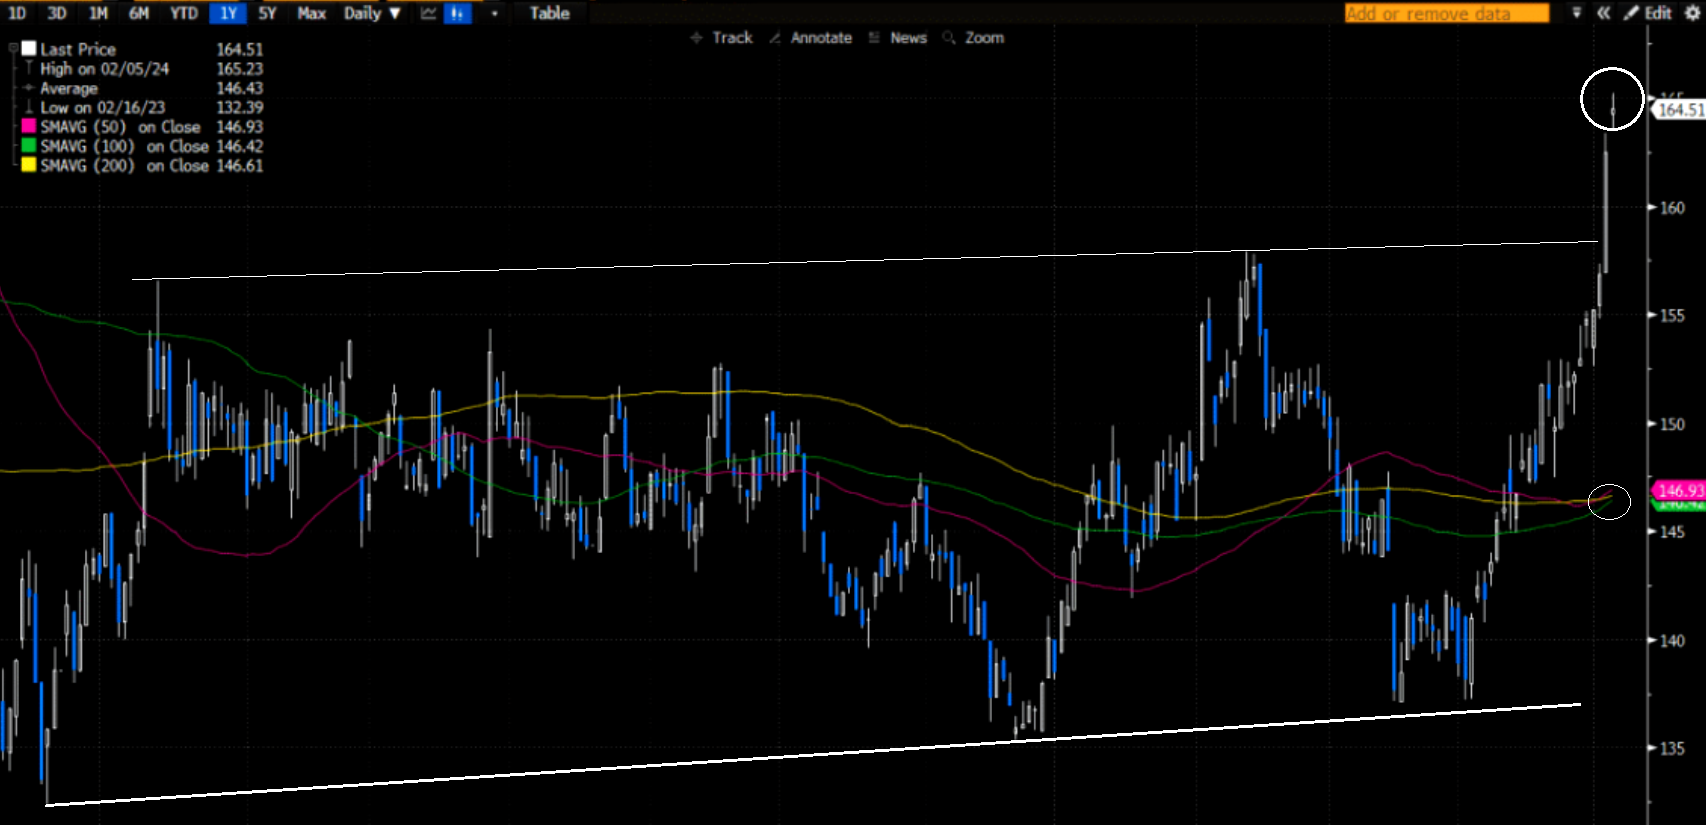
Rising bonds yields, having increased from ~3.8% to ~4.18% on the 10Y Treasury,and are quickly changing the investment environment (chart below right)!
| |
The Corporate Insider Transaction Ratio is at a level never seen before? Except for the MAG-7 Executives, everyone is heading for the exits! | | |
Meanwhile ... we are seeing an abrupt and dramatic shift in the Financial Conditions Index, which was initially instrumental in triggering this market lift since early November. | | |
|
3 - TECHNICAL ANALYSIS
US EQUITY MARKETS
Stocks are moving from strong hands to weak hands, a typical topping development.
CONTROL PACKAGE
There are FIVE charts we have outlined in prior chart packages that we will continue to watch closely as a "control set":
- The S&P 500 (CHART LINK)
- The DJIA (CHART LINK)
- The Russell 2000 through the IWM ETF (CHART LINK),
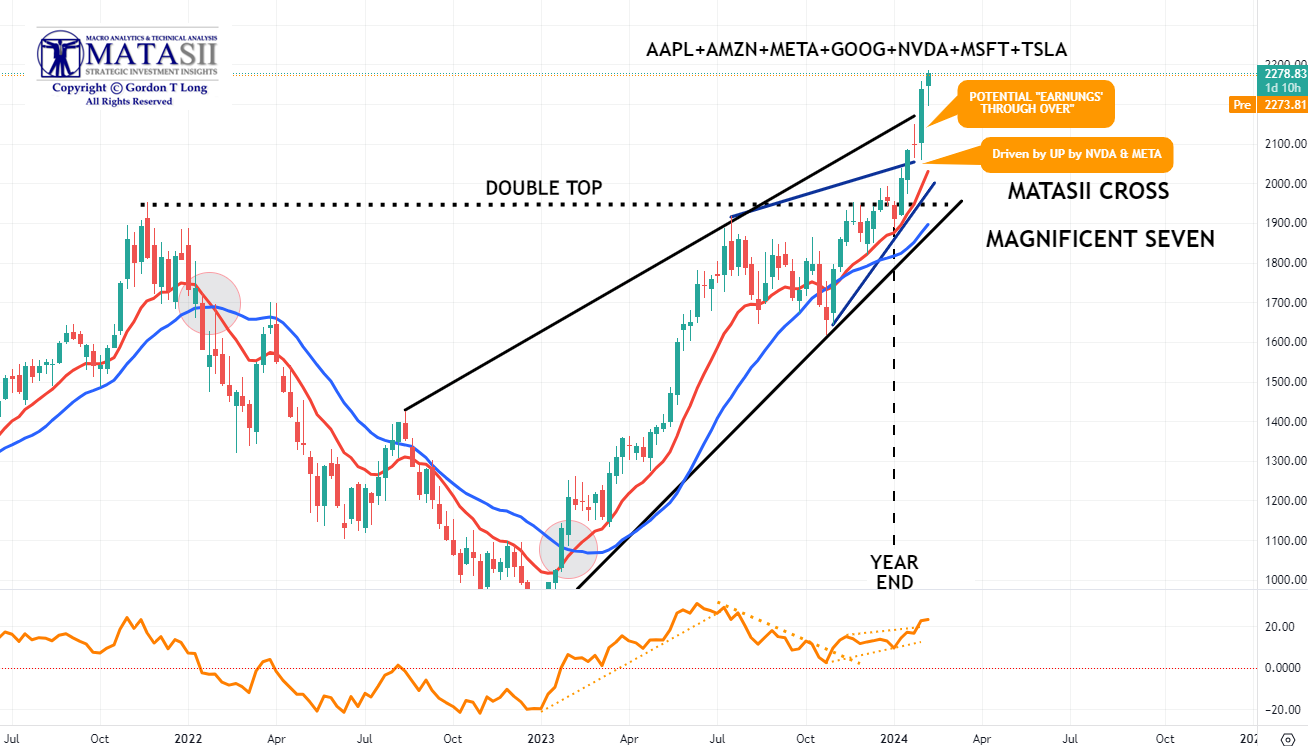
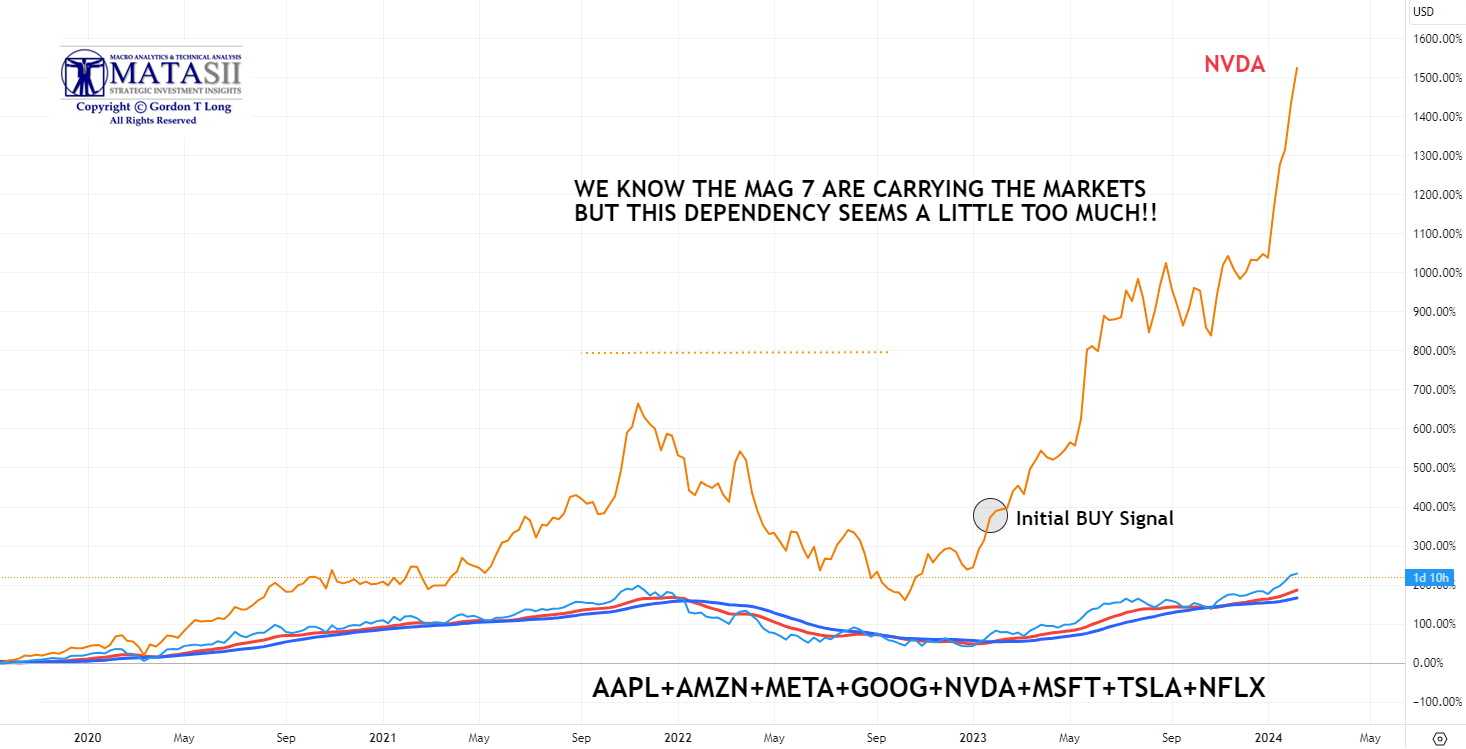
- The MAGNIFICENT SEVEN (CHART ABOVE WITH MATASII CROSS - LINK)
- Nvidia (NVDA) (CHART LINK)
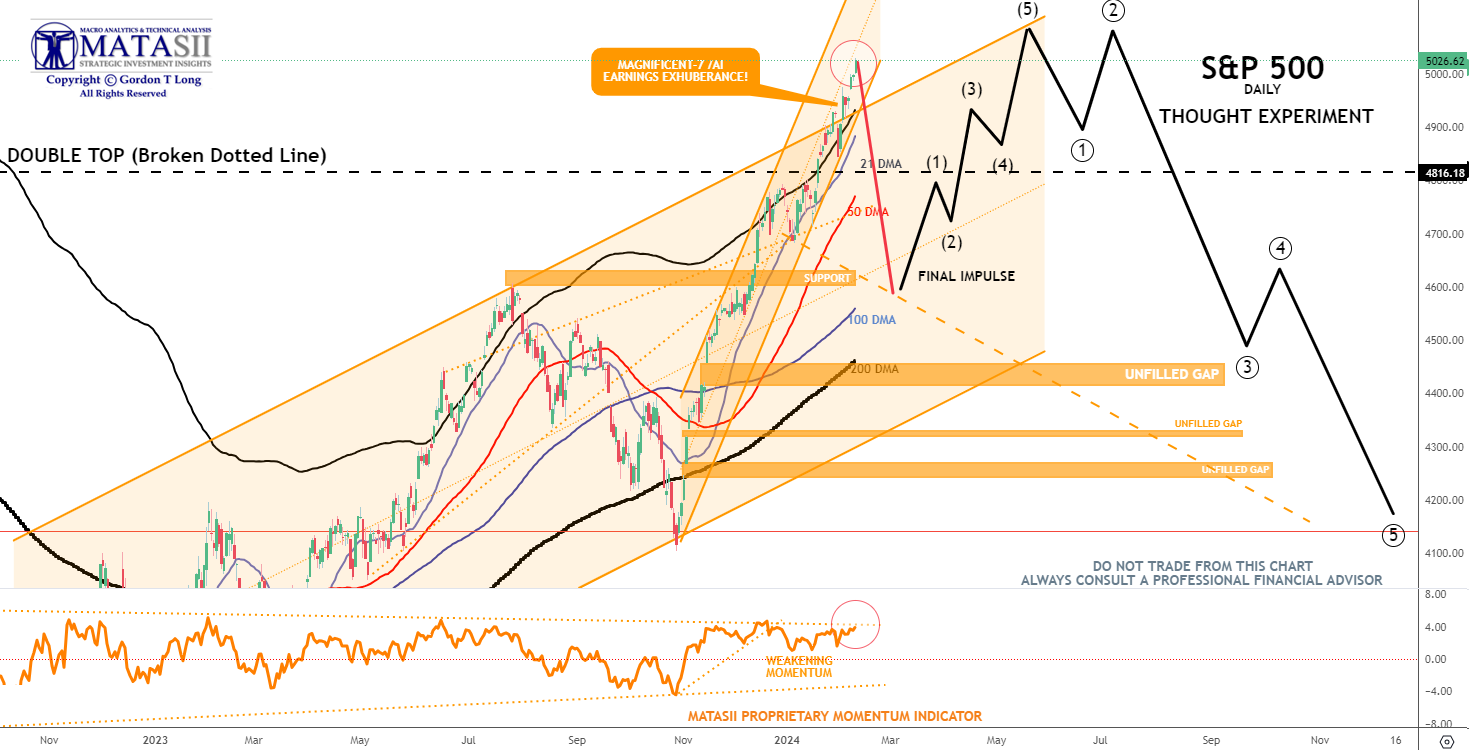
S&P 500 - Daily - Our Though Experiment
Our Though Experiment, which we have discussed previously, suggests we have or are near completing a near term top.
| |
YOUR DESKTOP / TABLET / PHONE ANNOTATED CHART
Macro Analytics Chart Above: SUBSCRIBER LINK
| |
|
MATASII CROSS: SIGNALLING A MAG-7 BUY
A price retracement to "touch" the rising red MATASII CROSS signal would normally be expected!
| |
YOUR DESKTOP / TABLET / PHONE ANNOTATED CHART
Macro Analytics Chart Above: SUBSCRIBER LINK
| |
|
NVDA
The chart below should be seen as a major concern for the markets!
The market may temporarily head higher, but when it tops it will abruptly get ugly!
How lucky do you feel about running for the door when someone yells "Fire"!
| |
|
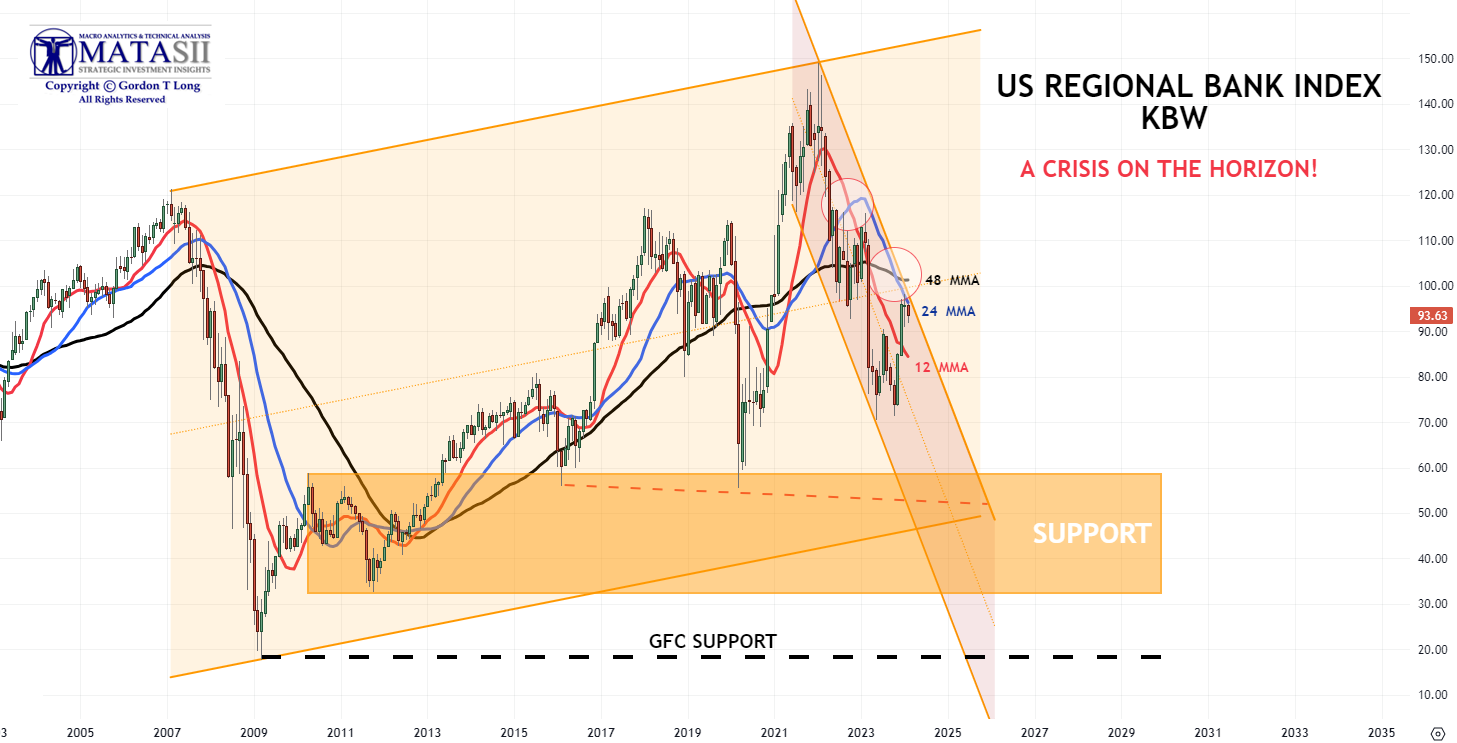
US REGIONAL BANK INDEX - KBW - Monthly
The 12 MMA has crossed below the 48 MMA and the 24 MMA. Meanwhile the 24 MMA has crossed the 48 MMA. Next stop is finding firm support!
| |
YOUR DESKTOP / TABLET / PHONE ANNOTATED CHART
Macro Analytics Chart Above: SUBSCRIBER LINK
| |
|
NOTICE Information on these pages contains forward-looking statements that involve risks and uncertainties. Markets and instruments profiled on this page are for informational purposes only and should not in any way come across as a recommendation to buy or sell in these assets. You should do your own thorough research before making any investment decisions. MATASII.com does not in any way guarantee that this information is free from mistakes, errors, or material misstatements. It also does not guarantee that this information is of a timely nature. Investing in Open Markets involves a great deal of risk, including the loss of all or a portion of your investment, as well as emotional distress. All risks, losses and costs associated with investing, including total loss of principal, are your responsibility.
FAIR USE NOTICE This site contains copyrighted material the use of which has not always been specifically authorized by the copyright owner. We are making such material available in our efforts to advance understanding of environmental, political, human rights, economic, democracy, scientific, and social justice issues, etc. We believe this constitutes a ‘fair use’ of any such copyrighted material as provided for in section 107 of the US Copyright Law. In accordance with Title 17 U.S.C. Section 107, the material on this site is distributed without profit to those who have expressed a prior interest in receiving the included information for research and educational purposes. If you wish to use copyrighted material from this site for purposes of your own that go beyond ‘fair use’, you must obtain permission from the copyright owner.
========
| |
MATASII'S STRATEGIC INVESTMENT INSIGHTS | |
2020 VIDEOS OUTLINING THE COMING RISE IN INFLATION & COMMODITY PRICES | |
IDENTIFICATION OF HIGH PROBABILITY TARGET ZONES | |
Learn the HPTZ Methodology!
Identify areas of High Probability for market movements
Set up your charts with accurate Market Road Maps
Available at Amazon.com
| |
The Most Insightful Macro Analytics On The Web | | | | |