|
LONGWave - JULY 2024
Technical Analysis - 07/15/24
| |
THE COST OF THE REGULATORY STATE
OBSERVATIONS: RIGHT DIRECTION, WRONG STRATEGY, TERRIBLE IMPLEMENTATION
Let me make it perfectly clear that I am a strong believer in Sustainability and Safe Guarding the environment. I believe it is the morally right direction to be taken by a responsible society. I also fully understand that such a decision will come with a cost.
The decision on direction should not be confused with the strategy to achieve it nor the implementation process chosen by the current administration. It is in regard to both that I strongly disagree and have serious concerns about.
THE STRATEGY
The strategy to achieve sustainability has many flaws in it, but the two most egregious are:
- The degree to which government regulation is being taken to attack, restrict and end fossil fuel protection in the name of sustainability.
- The forced regulatory strategy and government spending on the adoption of EV technology.
The crippling of the US fossil fuel industries borders on being economic suicide and minimally brazenly naive and outright stupid. To jeopardize a country's energy self-sufficiency in anyway, rather than through a well thought-out transitional plan that maintains strategic advantage, is simply incompetence. The petroleum industry is central to 72 other industries from cosmetics to plastics which this strategy will place the US at a competitive disadvantage and increase the US cost base.
The forced regulatory strategy of the adoption of EV technology is
flawed from its inception. There is nothing wrong with the adoption of electric cars. The flaw is in both the generation and storage of the electricity required. Putting aside the electric grid and a national charging station requirements, it is the use of batteries to store the electricity where the strategic mistake was made.
Battery dependent technology is the wrong strategy. The strategy has been built by politicians who are predominantly lawyers and not engineers. The strategy should have been built on an initial adoption of Hybrids where early adoption may have used batteries in selective segments, but rather the use of onboard fuel cells for the electric drive motors burning green hydrogen in parallel with IC engines. This introductory transition stage would then have been replaced with Internal Combustion Engines using new technology green fuels - not petroleum carbon based.
Green Fuel technology has already been economically achieved by major foreign manufacturers who in the next 18-24 months will completely end the US role in the automotive and trucking industry. All of this because of a flawed political strategy that is already clearly evident to anyone actually investing in these technologies. The US would have been better off investing in the new fuel cells and green fuel, building on our proven US domestic university research & industrial strength? ===>
| |
 | |
THIS WEEK WE SAW
Exp=Expectations, Rev=Revision, Prev=Previous
US
NY Fed SCE (Jun) 1yr ahead inflation expectations 3.0% (prev. 3.2% M/M), 3yr at 2.9% (prev. 2.8%), 5yr at 2.8% (prev. 3.0%)
US Wholesale Sales MM (May) 0.4% vs. Exp. 0.1% (Prev. 0.1%, Rev. 0.2%)
US Wholesale Inventories MM (May) 0.6% vs. Exp. 0.6% (Prev. 0.6%)
US CPI YY NSA (Jun) 3.0% vs. Exp. 3.1% (Prev. 3.3%)
US Core CPI YY NSA (Jun) 3.3% vs. Exp. 3.4% (Prev. 3.4%)
US Initial Jobless Claims w/e 222.0k vs. Exp. 236.0k (Prev. 238.0k, Rev. 239k)
===>
THE IMPLEMENTATION
If the above wasn't the case, why haven't China, Japan, South Korea and other major automotive manufacturing countries not already installed nationwide electric charging stations?
Meanwhile our administration is currently funding and subsidizing through unprecedented government debt? It all reminds me of France building the Maginot Line before WWII?
The flaw is becoming obvious as EV owners are already frustrated, dealerships and manufacturers are scaling back, while fleet owners like Hertz are suffering massive residual value losses and selling their EV fleets while they still can.
THE CONSEQUENCES
The right direction was taken by politicians (with self serving spending goals) but built on a flawed strategy and an abominable implementation disaster.
Expect (the always implemented) massive government bailouts and financing to be spent to catch-up. Just maybe that spending along with the original trillions already spent was the real strategy?
| |
========================= | |
|
WHAT YOU NEED TO KNOW!
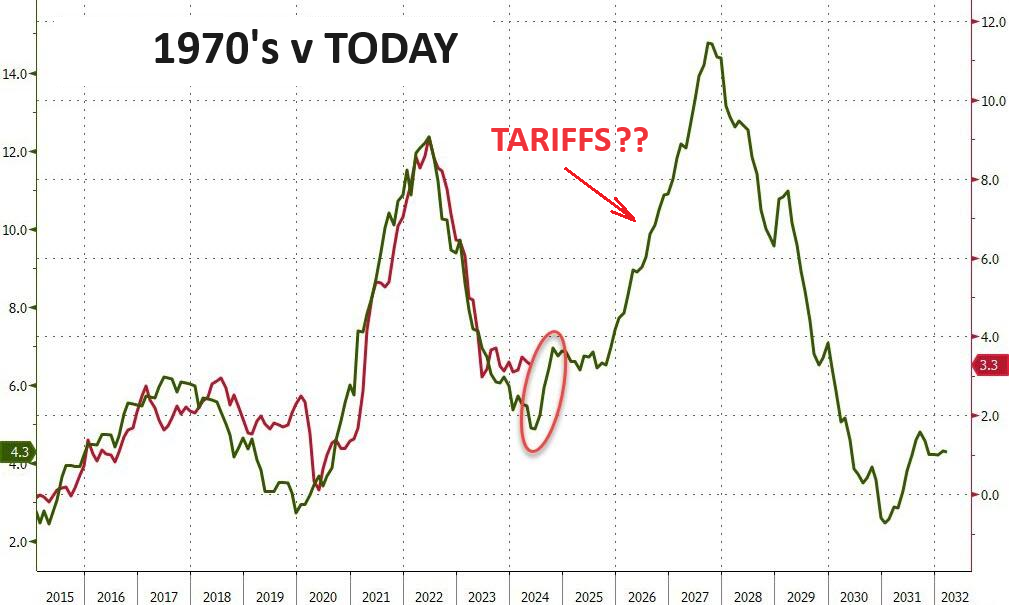
BOTH US PARTIES ARE TALKING TARIFFS!
It is becoming clear that both Biden and Trump see Tariffs as the strategy to combat China. Forget what politicians believe and understand that tariffs will result in higher consumer prices.
In a nearly 70% consumption economy like the US, rising consumer prices is a serious problem. If we learned only one lesson from the 70's, it is that once the inflation genie is let out of the bottle it is nearly impossible to get it back in!
Tariffs will be like pouring gasoline on an already smoldering fire.
RESEARCH
INFLATION & THE INCREASING COSTS OF REGULATIONS
- Federal regulators often underestimate the costs and overestimate the benefits of the rules they issue.
- Regulations tell Americans how to get benefits, how to meet safety standards and how to pay their taxes. There are now over 200,000 pages in the Code of Federal Regulations.
- We all pay for government regulations. Sometimes the corporations regulated pay fees and licensing that go toward regulatory expense. Otherwise it is tax payers.
- Regulatory costs include direct costs of compliance such as costs of paperwork, equipment modifications, and testing procedures. Indirect costs result from the redirection of industrial research and development efforts and from conflicting regulations and goals.
- An average firm spends 1.34 percent of its total labor costs on performing regulation-related tasks, according to the government's own National Bureau of Economic Research .
1- COMPETITIVE DISADVANTAGE
- Regulations can create barriers to entry, which can reduce competition and increase prices for consumers. These barriers can include: i) Startup costs, ii) Licensing procedures, iii) Regulatory compliance, iv) Expensive education, v) Testing, and vi) Fees
- Regulations can also create other challenges for companies, including: I) Timeliness: Regulations can change quickly, and companies may not be aware when new regulations come into effect; ii) Cost: Companies may incur significant costs when monitoring legislative changes; iii) Data: It can be burdensome for companies to stay up-to-date with the changes.
- Other unintended consequences of regulation include: i) Hidden costs: Regulatory costs are often hidden and passed on to consumers, employees, and investors; ii) Capture: Interest groups can use regulation to promote their own interests, such as restricting competition and suppressing innovation; iii) Bureaucracy: The regulatory process can be slow and out of touch with changing needs.
A. Respect market forces and the beneficial effects of competition.
B. Do more good than harm
C. Base decisions on the best available information and transparency.
D. Gather better feedback.
E. Encourage experimentation and learning.
F. Regulatory humility.
G. Address regulatory accumulation.
2- COSTS
- U.S. federal government regulations cost an estimated $3.079 trillion in 2022 (in 2023 dollars), an amount equal to 12% of U.S. GDP.
- Costs fall unevenly on the major sectors of the economy and on firms of different sizes; the findings indicate that compliance costs fall disproportionately on small businesses.
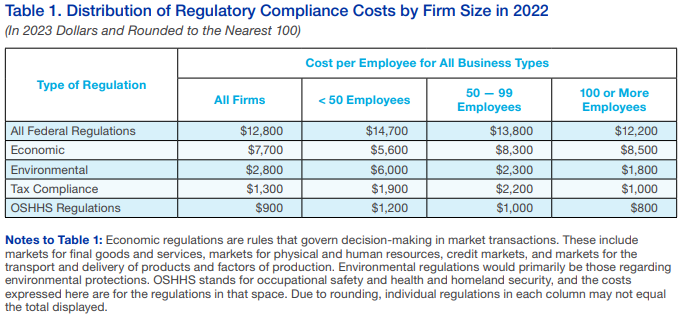
- Federal regulations cost an estimated $12,800 per employee per year in 2022 (in 2023 dollars).
- Small firms with fewer than 50 employees incur regulatory costs of $14,700 per employee per year – 20% greater than the cost per employee in large firms ($12,200).
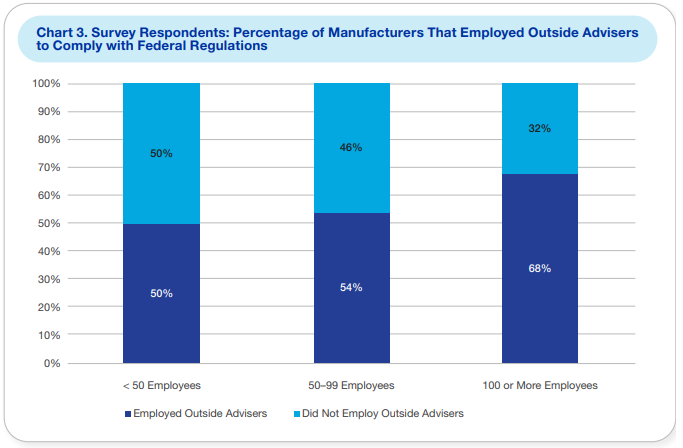
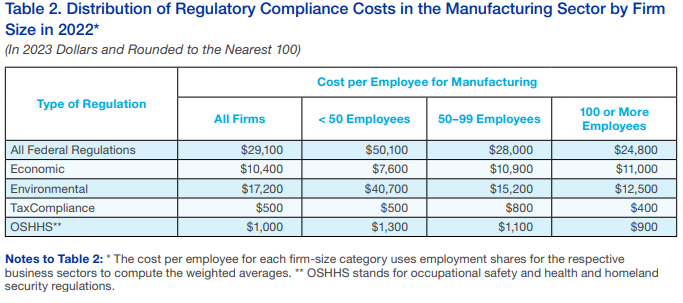
- The regulatory cost disadvantage confronting small firms is amplified greatly in the manufacturing sector, with small manufacturing firms bearing more than double the cost of large manufacturing firms, or $50,100 versus $24,800 per employee.
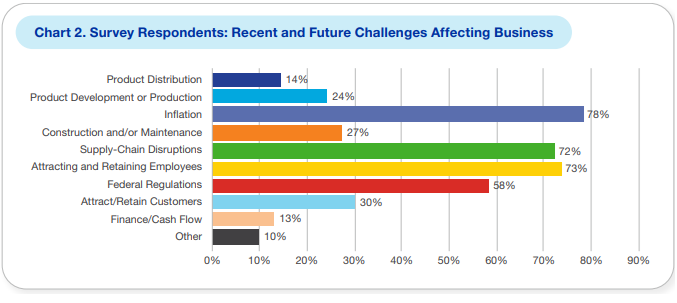
- Fifty-eight percent of survey respondents indicated that federal government regulation was a challenge that had recently affected their firm or that they expected their business to face in the future.
- Using data provided by respondents, the estimated cost of outlays for manufacturing as a whole indicates that expenditures related to regulation in the past year were approximately $350 billion. To put this figure in perspective, it is larger than the individual economies of 29 U.S. states.
3- COMPLIANCE
- Compliance costs are larger than the individual economies of 29 U.S. states.
| |
|
DEVELOPMENTS TO WATCH
1- CHINA - RISING INFLATION PRESSURES
Global excess liquidity remains buoyant, which is supporting an increase in shipping rates, as captured by the Baltic Dry Index.
GLOBAL FREIGHT RATES
==> CHINESE PPI
==> US CPI
- Global Freight Rates are up significantly.
- Chinese PPI leads US CPI by a few months and is following rising global freight rates.
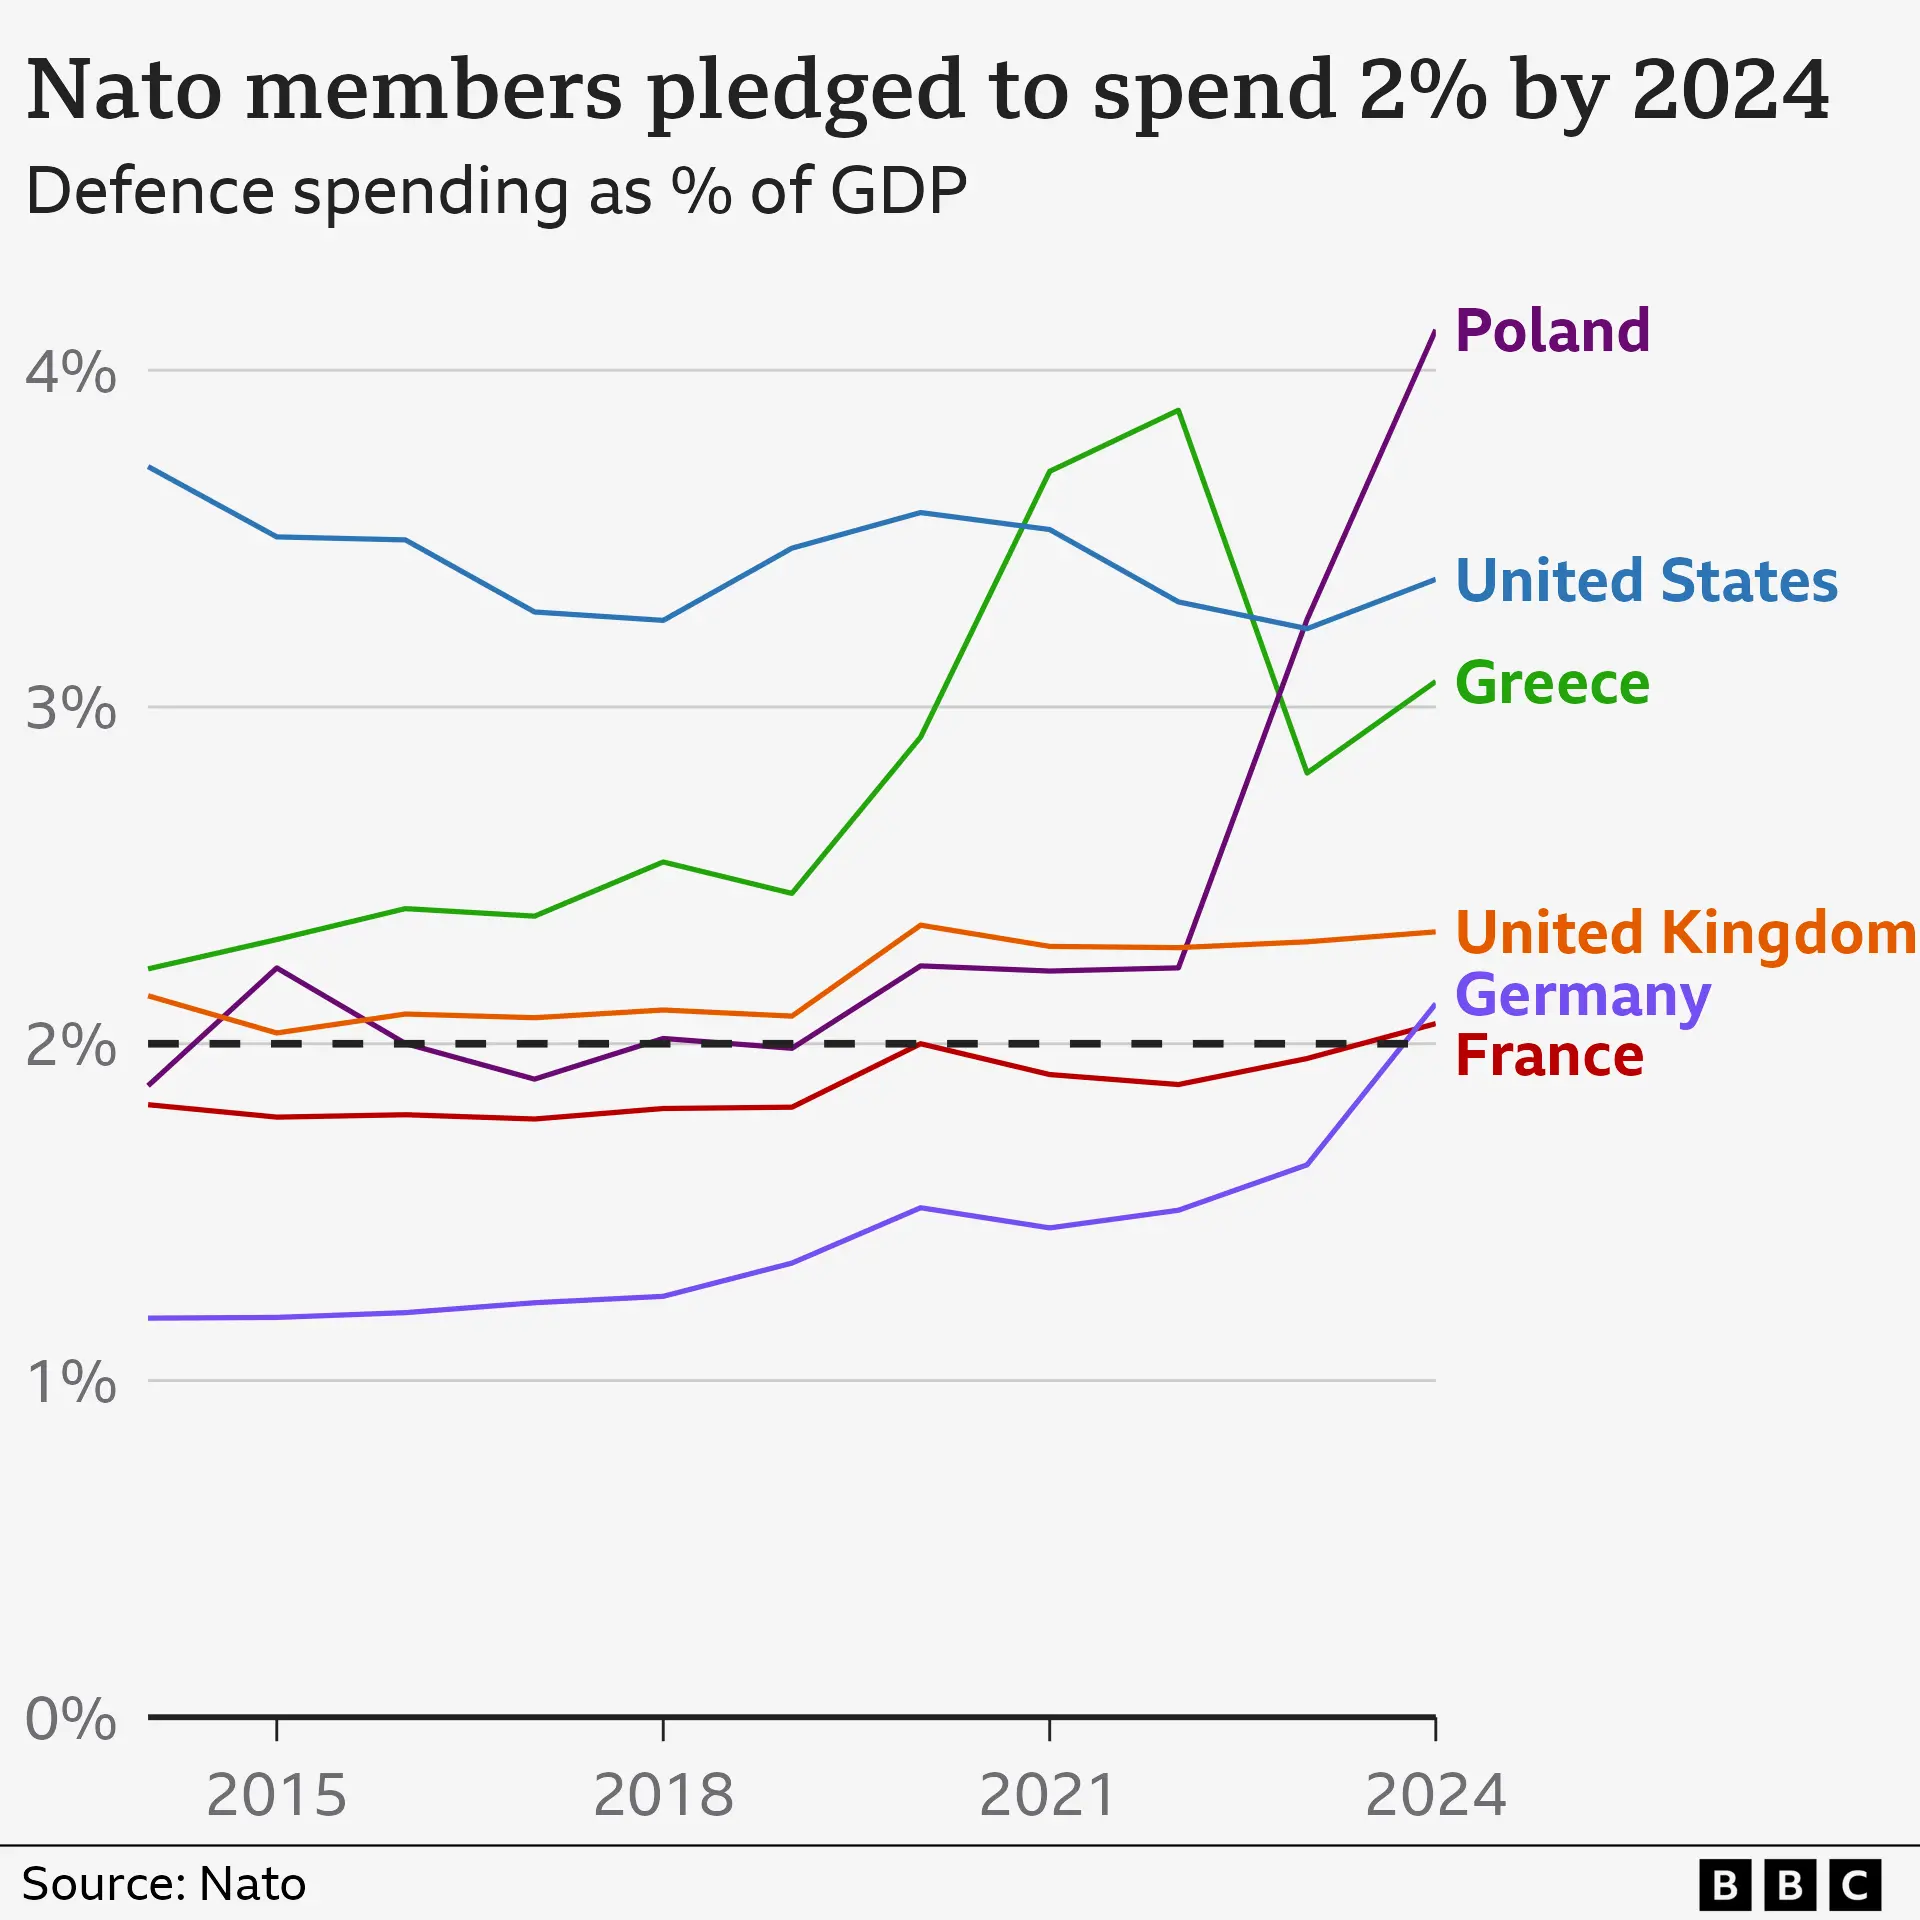
2- NATO - PLACING THE WEST ON A "WAR FOOTING"
EXPANDED PARTNERS, FOCUS & SPENDING
- Expanded partners in the Pacific-Asia and Middle East Theater
- Increased focus to include Cyberwarfare, Disinformation and AI
- Increased membership defense budgets
| |
|
GLOBAL ECONOMIC REPORTING
-
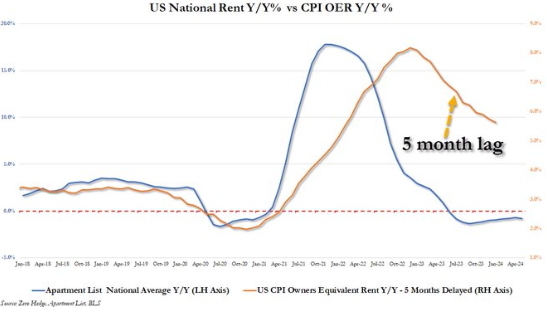
JUNE CPI - A TUMBLING LAGGING OER
- It was only a matter of time before CPI started missing month after month driven by the badly lagging Owner's Equivalent Rent, which will proceed to tumble for the "next 18 months, and since shelter is 36% of the CPI basket, inflation will soon appear low (even though real rents are rising again... so Fed is two cycles behind now".
-
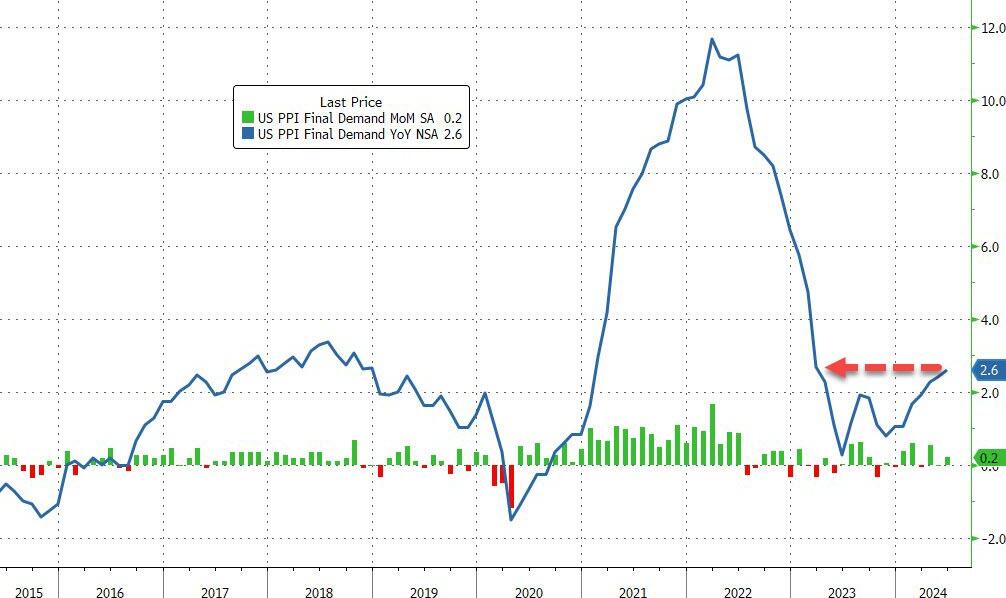
JUNE PPI - CORE PPI ROSE 0.4% (2X 0.2% EXP)
- Headline PPI printed HOT at +0.2% MoM (and May was revised higher), pushing the YoY print up to 2.6% (well above the 2.3% expected).
-
JUNE FISCAL BUDGET SPENDING - DEBT INTEREST 30% OF TAX RECEIPTS
- The $140 billion in gross interest spending in June was just over 30% of all US receipts (mostly taxes) for the month.
- The current $1.114T 2024 outlook is 67% of the expected deficit of $1.7T. This was the single biggest monthly interest outlay on record!
| |
|
In this week's "Current Market Perspectives", we focus on the signals that sentiment, fundamentals and various markets (Credit, Bond and Equity) are currently giving us.
=========
| |
THE COST OF THE REGULATORY STATE | |
|
Federal regulators often underestimate the costs and overestimate the benefits of the rules they issue.
Fortunately, some members of Congress want to make this information public. The Regulatory Right to Know Act of 1999, sponsored by Sens. Fred Thompson, R-Tenn., and John Breaux, D-La., would require OMB to supply data on the cost and intended benefit of proposed regulations. Similar legislation recently passed the House.
It's a small but crucial step. Congress can't even begin to curb regulation until it understands the costs as well as the benefits. As Professor Hopkins told Congress:
"If we want to continue shooting ourselves in the feet, collectively, I think it only fair that we have a count of the bullet holes."
| |
|
Regulations tell Americans how to get benefits, how to meet safety standards and how to pay their taxes. There are now over 200,000 pages in the Code of Federal Regulations.
We all pay for government regulations. Sometimes the corporations regulated pay fees and licensing that go toward regulatory expense. Otherwise it is tax payers.
Regulatory costs include direct costs of compliance such as costs of paperwork, equipment modifications, and testing procedures. Indirect costs result from the redirection of industrial research and development efforts and from conflicting regulations and goals.
An average firm spends 1.34 percent of its total labor costs on performing regulation-related tasks, according to the government's own National Bureau of Economic Research .
| |
1- COMPETITIVE DISADVANTAGE
Regulations can create barriers to entry, which can reduce competition and increase prices for consumers. These barriers can include:
- Startup costs,
- Licensing procedures,
- Regulatory compliance,
- Expensive education, testing, and fees
Regulations can also create other challenges for companies, including:
- Timeliness: Regulations can change quickly, and companies may not be aware when new regulations come into effect.
- Cost: Companies may incur significant costs when monitoring legislative changes.
- Data: It can be burdensome for companies to stay up-to-date with the changes.
Other unintended consequences of regulation include:
- Hidden costs: Regulatory costs are often hidden and passed on to consumers, employees, and investors.
- Capture: Interest groups can use regulation to promote their own interests, such as restricting competition and suppressing innovation.
- Bureaucracy: The regulatory process can be slow and out of touch with changing needs.
The American free enterprise system has been one of the greatest engines for prosperity and liberty in history, and has the potential to deliver a promising future for the United States and the world. Through protecting property rights and fostering healthy competition, democratic capitalism rewards work and ingenuity which improves our lives and has liberated more people from poverty than any other system.
Yet, the United States faces growing challenges in an increasingly competitive global economy. Recent decades have seen a decline in economic growth and innovation, and one important cause is poorly-designed government policies. Large swaths of the American economy are distorted by government mandates and incentives, and the vast majority of binding “laws” are not enacted by our elected representatives in Congress, but are promulgated by agencies as regulations.
Sensible, evidence-based regulations that respect the fundamental role of free-market competition can provide vital public benefits – such as protecting the environment, public health and safety, civil rights, consumers, and investors. Yet, despite the best intentions, government regulation too often disrupts the marketplace or picks winners and losers among companies or technologies. When regulators behave this way, they invariably cause unintended harms. Poorly designed regulations may cause more harm than good; stifle innovation, growth, and job creation; waste limited resources; undermine sustainable development; inadvertently harm the people they are supposed to protect; and erode the public’s confidence in our government.
REQUIRED APPROACH
A. Respect market forces and the beneficial effects of competition.
B. Do more good than harm.
C. Base decisions on the best available information and transparency.
D. Gather better feedback.
E. Encourage experimentation and learning.
F. Regulatory humility.
G. Address regulatory accumulation.
KEY POINTS
- The appropriate goal of regulation is to enhance, not undermine, societal well-being. In other words, regulation should do more good than harm. Without a counterfactual, it is impossible to know what a more disciplined regulatory environment would have meant for economic growth and well-being. However, evidence suggests that a smarter regulatory approach targeted at problems that cannot be solved by other means could have enormous benefits for current and future generations.
- Though difficult to measure, it is widely recognized that the quality and extent of government regulation is “a major determinant of prosperity.” The World Bank conducts annual Doing Business surveys measuring government policies and the ease of doing business in different countries. Over the last decade, the U.S. has dropped from #4 to #8 on the World Bank’s list.
-
The World Bank finds that the highest ranked countries in its survey regulate, but “they do so in less costly and burdensome ways, and they focus their efforts more on protecting property rights than governments in other countries.”5 It observes, “a thriving private sector—with new firms entering the market, creating jobs and developing innovative products—contributes to a more prosperous society,” “promotes growth and expands opportunities for poor people.”
- Empirical studies of deregulated industries in the U.S. demonstrate the impact of regulation on innovation; they consistently find that deregulation enables greater innovation and larger price reductions than economists predicted based on pre-deregulation costs and market conditions.
- A few studies have attempted to quantify the effect of regulation on economic growth, productivity, and innovation. For example, in a classic analysis from the 1980s, Jorgensen & Wilcoxen simulate the long-term growth of the U.S. economy with and without environmental regulation and conclude that “the cost of environmental regulation is a long run reduction of 2.59 percent in the level of the U.S. gross national product.”
- More recently, McGrattan and Prescott find that higher regulatory costs contribute to lower total factor productivity (TFP) and GDP.54 Dawson & Seater estimate that regulations reduced gross domestic product (GDP) growth by 2 percent per year between 1949 and 2005, leading to an accumulative reduction of $38.8 trillion in GDP.55
- A better regulatory system is always in the national interest: With a better regulatory system, we can have more innovative products, higher wages, and upwardly mobile jobs. A smarter regulatory process can ensure that regulations enhance societal well-being, rather than provide an advantage for powerful interest groups. Now more than ever, regulatory reform is essential for both the economic and the political well-being of the nation. The United States faces one of its highest levels of debt to GDP since World War II. The retirement of the baby boomers will only exacerbate this problem. The only solution for reducing the ratio, other than painful tax increases or benefit decreases, is the faster economic growth that regulatory reform can bring.
- The United States is more bitterly divided politically than it has been for decades. If regulations focus on promoting public goods and preventing public bads, rather than serving as a forum for special interests and partisanship, the regulatory system can address the needs we have in common rather than divide us. It also can address widespread social discontent at the ability of insiders to gain at the expense of outsiders. Regulatory reform can blunt the force for division by reducing rent-seeking and unlocking the healthy competition and creativity needed to revive opportunity, prosperity, and freedom in the United States and the world.
| |
2- COSTS
The Cost of Federal Regulation to the U.S. Economy | National Association of Manufacturers
- U.S. federal government regulations cost an estimated $3.079 trillion in 2022 (in 2023 dollars), an amount equal to 12% of U.S. GDP.
- These costs fall unevenly on the major sectors of the economy and on firms of different sizes; the findings indicate that compliance costs fall disproportionately on small businesses.
- Federal regulations cost an estimated $12,800 per employee per year in 2022 (in 2023 dollars).
- Small firms with fewer than 50 employees incur regulatory costs of $14,700 per employee per year – 20% greater than the cost per employee in large firms ($12,200).
- The regulatory cost disadvantage confronting small firms is amplified greatly in the manufacturing sector, with small manufacturing firms bearing more than double the cost of large manufacturing firms, or $50,100 versus $24,800 per employee.
- Overall, small manufacturers incur regulatory costs that are more than three times the costs borne by the average U.S. company. Medium and large manufacturers in the United States face regulatory costs that are double the costs borne by the average U.S. firm.
|  |  |
- Fifty-eight percent of survey respondents indicated that federal government regulation was a challenge that had recently affected their firm or that they expected their business to face in the future.
- Using data provided by respondents, the estimated cost of outlays for manufacturing as a whole indicates that expenditures related to regulation in the past year were approximately $350 billion.
- To put this figure in perspective, it is larger than the individual economies of 29 U.S. states.
- The survey specifically asked for information regarding federal regulation and how it related to the distribution of employees’ time, the use of outside advisers, purchasing and maintaining tangible items, emissions credits or offsets and requirements resulting from federal government compliance-related activities.
-
Respondents discussed other implications of regulation in their open-ended responses, including inefficient planning as a consequence of uncertainty, and federal regulation in:
- the production location calculus
- R&D and capital investment consequences
- reductions in employment and in competitiveness
- Our economy-wide analysis buttresses and extends the cost estimate based on the survey responses.
- The combined direct and indirect costs of federal regulations borne by the manufacturing sector are estimated to be $349 billion based on this economy-wide analysis.
| |
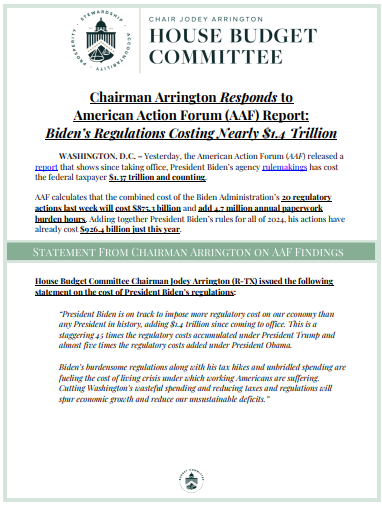
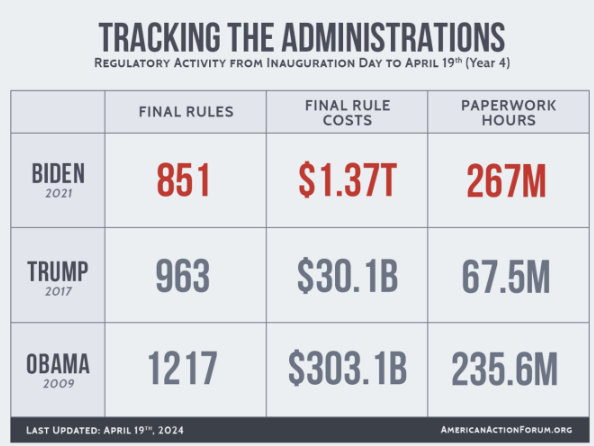
Biden's Regulations Costing Nearly $1.4 Trillion | House Budget Committee Apr 24, 2024
- Chairman Arrington Responds to American Action Forum (AAF) Report: Biden's Regulations Costing Nearly $1.4 Trillion | The U.S. House Committee on the Budget - House Budget Committee. Apr 24, 2024.
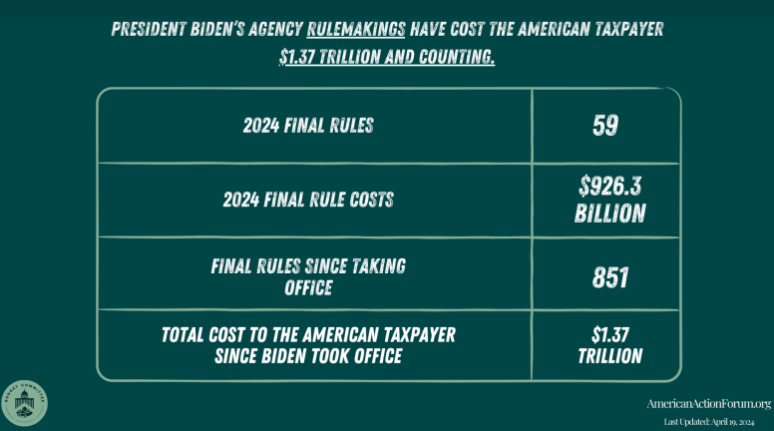
“President Biden is on track to impose more regulatory cost on our economy than any President in history, adding $1.4 trillion since coming to office. This is a staggering 45 times the regulatory costs accumulated under President Trump and almost five times the regulatory costs added under President Obama."
"Biden’s burdensome regulations along with his tax hikes and unbridled spending are fueling the cost of living crisis under which working Americans are suffering."
"Cutting Washington’s wasteful spending and reducing taxes and regulations will spur economic growth and reduce our unsustainable deficits.”
- The most costly of President Biden’s regulations was the Environmental Protection Agency's (EPA) tailpipe vehicle emissions rule, which came in at $870 billion just by itself.
- President Biden increased his regulatory burden by $875.3 billion in just one week. That nearly matches the $890 billion total of President Obama’s regulations during his entire presidency.
- The average cost of one of Biden’s regulations is over $1.5 billion. In comparison, the regulations under Obama averaged $250 million.
- Last week’s regulations alone added more than 4.7 million annual paperwork burden hours.
|  |  | |
The Cost of Federal Regulation | The Heritage Foundation
- The Office of Management and Budget (OMB), the White House's own budgetary agency, puts the price of existing regulations at approximately $300 billion annually.
- Professor Thomas Hopkins of the Rochester Institute of Technology, say it's closer to $700 billion.
- This means regulations cost somewhere between $3,000 and $7,000 per household every year. What the GOP tax cut would give back in 10 years, regulators take away in one.
| |
|
3- COMPLIANCE
The Real Cost of Compliance: Regulatory Expenses | House Budget Committee
Regulatory expenses are the costs a business incurs to comply with relevant laws and regulations. These can range from the cost of hiring compliance officers, investing in compliance software, and training staff to the financial penalties incurred for non-compliance.
The Cost of Regulatory Compliance in the United States | CATO Research
Data on occupational tasks and firms’ wage spending finds that the average US firm spends between 1.3 and 3.3 percent of its total wage bill on regulatory compliance.
93.9 percent of compliance costs in the US financial sector are labor-related and 3.3 percent are equipment-related.
- Survey estimates in 2014 from the National Association of Manufacturers report that 68.4 percent of compliance costs in the US manufacturing sector are labor-related and 13.4 percent equipment-related.
- The measure is made possible by merging occupational task data from O*NET (version 23.0) with the Occupational Employment and Wage Statistics data from the Bureau of Labor Statistics, a large representative survey covering about 1.2 million establishments from all industries for 2002–2014.
An average firm spends 3.33 percent of its total labor costs on performing regulation-related tasks per year. Using our most conservative measure, the average is 1.34 percent. Our research shows that regulatory compliance costs of US businesses have grown by about 1 percent each year from 2002 to 2014 in real terms.
The inclusion of firms’ equipment expenditure related to compliance increases compliance costs by about 20 percent. The total wage bill devoted to regulatory compliance workers in 2014 was between $79 billion and $239 billion, depending on the stringency of the regulatory compliance measure, and up to $289 billion when equipment is included.
| |
|
4- IMPLEMENTATION
CPA GUIDE | Green Growth
Below is a CPA's guide to an understanding of regulatory expenses, compliance costs in taxation, and how to calculate compliance costs.
Regulatory Requirements: The Basics
Regulatory requirements refer to the mandatory rules and standards businesses must follow to comply with local, state, federal, and international laws. These rules cover various areas, such as financial reporting, data protection, environmental standards and employee rights. To keep this article focused, we will concentrate on taxation compliance.
Compliance Costs: An Overview
Compliance cost is a term used to describe all the expenses a business incurs to meet these regulatory requirements. These costs can be direct, such as fees paid to regulatory bodies or the purchase of necessary equipment, or indirect, such as the time employees spend understanding and implementing new regulations.
Regulatory Expenses and Their Impact
Regulatory expenses are the costs a business incurs to comply with relevant laws and regulations. These can range from the cost of hiring compliance officers, investing in compliance software and training staff to the financial penalties incurred for non-compliance. The impact of these expenses can be substantial, affecting a company’s bottom line, operational efficiency, and reputation.
The Rising Cost of Compliance
Over the years, the cost of compliance has been on a steady rise. This increase can be attributed to several factors:
- Increasing Regulatory Requirements: With each passing year, new regulations and existing ones are enacted. This continuous change creates a dynamic regulatory landscape that businesses must navigate, driving up compliance costs.
- Greater Enforcement: Regulators worldwide are becoming more proactive in enforcing compliance, resulting in increased scrutiny and higher penalties for non-compliance.
- Increased Complexity: The complexity of regulations is also growing, requiring businesses to invest more in expert advice, training, and technological solutions to stay compliant.
- Globalization: As businesses expand their operations internationally, they must comply with the regulatory requirements of each country they operate in, adding to the compliance burden.
Compliance Cost in Taxation
One area where the cost of compliance is particularly evident is taxation. Businesses must spend considerable time and resources to understand and comply with complex tax laws and regulations. This includes the cost of preparing and filing tax returns, maintaining required records, and dealing with tax audits and disputes. Despite the rising
compliance costs, studies show that it is more costly not to meet compliance standards. The cost of non-compliance is approximately 2.7 times more than that of compliance.
How to Calculate Compliance Cost
Calculating compliance costs can be complex due to the many factors involved. Here’s a step-by-step guide to help you estimate these costs:
- Direct Expenses: List all immediate costs, including compliance officers’ salaries, training, licensing fees, and compliance-specific technology or software.
- Time Investments: Estimate the hours employees devote to compliance tasks and convert this to monetary value based on their average hourly wage.
- Consultancy and Audits: Factor in costs from external consultants or third-party audits. This includes both regular and unexpected fees.
- Infrastructure Upgrades: Account for costs from technology or equipment required to meet specific regulations.
- Penalties: Include fines or penalties paid for past non-compliance to offer a comprehensive view of compliance’s financial impact.
- Forecasting: Anticipate future compliance costs based on industry trends and expected regulations.
- Total Calculation: Combine all the above factors to determine the annual compliance cost, revisiting this calculation periodically as the business and regulations evolve.
Regularly revisiting and updating this calculation is crucial, especially as regulations evolve and the business grows. This helps in budgeting and strategic decision-making, ensuring compliance becomes an integrated aspect of the business process rather than an afterthought.
Reducing Compliance Costs
While compliance is non-negotiable, there are strategies businesses can employ to manage and reduce compliance costs:
- Invest in Technology: Compliance software can automate many compliance tasks, reducing the time and effort required and minimizing the risk of human error.
-
Outsource Compliance Activities: Consider outsourcing compliance activities to specialized firms can be cost-effective, especially for small and medium-sized businesses that may need more resources to maintain a full-fledged compliance department. Thirty-four percent of businesses outsource all or part of their compliance costs.
- Continuous Training: Regular training can ensure that employees are always updated with the latest regulations, reducing the risk of non-compliance.
- Implement a Compliance Culture: Building a culture of compliance within the organization can help ensure that all employees understand compliance’s importance and role in it. Start by ensuring that everyone in your business understands Standard Operating Procedures.
Conclusion
While compliance is a cost, non-compliance can be even more expensive.
| |
|
5- ENFORCEMENT
- In fiscal year 1998, 53 federal departments and agencies spent $17 billion writing and enforcing regulations.
- The General Accounting Office, the federal government's spending watchdog, estimates that between April 1996 and March 1999 agencies issued 12,925 final rules. Of this total, 188 were "major" rules with an estimated annual cost of $100 million each, saddling the U.S. economy with $18.8 billion in new regulatory costs. And this doesn't account for the other 12,737 "minor" rules.
- During the past three years, Congress has required OMB to report the annual cost of regulation. These reports allow policymakers and the public to see not only the grand total but also an itemized list. As the OMB itself has noted, the "substance is in the details, not in the total." Only by examining regulations line by line can lawmakers determine whether the benefits of a particular rule outweigh its costs.
- Such costs aren't always measured in terms of dollars and cents. For example, the Environmental Protection Agency never performed a cost-benefit analysis before mandating the use of MTBE, a chemical that adds oxygen to gasoline and allegedly reduces air pollution. Now, with MTBE in wide use throughout the United States, it turns out to be a toxic substance that has contaminated groundwater supplies in several regions.
- In 1988, the last year of the Reagan administration, the Federal Register totaled 53,376 pages. By 1997, the official catalog of government rules had hit 64,549 pages-an 11,173-page increase. The frenetic pace at which government produces these regulations strongly suggests the need for accountability and common sense. But efforts by federal regulators to provide the public with even minimal information have been woefully inadequate.
| |
|
DEVELOPMENTS
CHINA - RISING INFLATION PRESSURES
GLOBAL FREIGHT RATES ==> CHINESE PPI ==> US CPI
- Global Freight Rates lead Chinese PPI by 3 months.
- Chinese PPI leads US CPI by a few months.
GLOBAL FREIGHT RATES
- Global excess liquidity remains buoyant, which is supporting an increase in shipping rates, as captured by the Baltic Dry Index.
- Containerized freight prices in Shanghai are now rising at almost 300% year-on-year. They lead PPI in China by about three months, which has already begun to climb off its lows.
- It’s not just China shipping rates that are rising; the Hong Kong to LA container rate - which also leads PPI – is up well over 500% over the last year.
CHINESE PPI
- Input prices in China are also rising, another indication of burgeoning inflation pressures.
- Chinese PPI is following the the expected pattern (chart below).
|  | The market would be blindsided by a China-driven re-increase in inflation, with CPI-fixing swaps anticipating headline inflation falling to only 2.2% in a year’s time. | |
NATO - PLACING THE WEST ON A "WAR FOOTING"
NATO is becoming fully mobilized, in military, political and economic terms, to fight against any Global Majority forces that may destabilize the G7.
The main 2024 NATO Conferences “strategic” trifecta:
- Extra tens of billions of dollars in “assistance” for Ukraine. The overwhelming majority of these funds will be slushing around the industrial-military money laundering complex.
- Forceful imposition of extra military spending on all members.
- Massive hyping up of the “China Threat”.
EXPANDING PARTNERS, FOCUS & SPENDING?
The NATO Summit Conference this week in Washington DC made it extremely clear that the US is leading an effort to place the west on an accelerated GLOBAL war footing using NATO as the vehicle.
- The 32 member North American Treaty Organization was expanded to include a Pacific-Asia region of the world adding:
- Australia
- New Zealand
- Japan
- South Korea
- The opening of a "Liaison Office" in Jordan to coordinate the Middle East Theatre of operation (NATO already operating in Africa)
- The NATO mission was expanded to include:
- Cyberwarfare
- Artificial Intelligence
- Disinformation
- The US in parallel this week announced a China Sea mutual defense group to include:
- South Korea
- Japan
- Philippines
- A great deal of pressure at the conference was placed on delinquent members to meet the minimum while others must increase defense spending - not be decrease it.
DEFENSE SPENDING
NATO's common funds are composed of direct contributions to collective budgets and programs, which equate to only 0.3% of total Allied defense spending (around$4.1 billion for 2024). Since 2005, the U.S.' share of NATO common funding has been set at a concessionary level negotiated with Allies – now over 22%.
Though NATO has been somewhat successful in bringing 20 of the 32 members defense budgets to >2% of GDP in support of NATO, major members are still delinquent:
- SPAIN, PORTUGAL, ITALY, and BELGIUM are larger countries below the 2% threshold level.
- CANADA is contributing only 1.3% to NATO while also limiting its defense spending to ~1.7% of GDP.
A WAR FOOTING
General Sir Patrick Sanders, Chief of the General Staff of the British armed forces until June, claims Russia, China, and Iran are “the new Axis powers,” and arguably more of a threat than the Second World War alliance of Germany, Italy, Japan, and others.
"They are more interdependent and more aligned than the original Axis powers were,” he argues, claiming a Third World War is probable if Britain and the West more generally do not expand their militaries and military production capacity within the next few years.
“Most estimates will tell you that we’ve got somewhere between five and 10 years before Russia recapitalizes and is able to pose the sort of threat that it did before the Ukraine war,” he said.
Reflecting on British military capabilities, Sir Patrick expressed concerns about his country’s readiness to undertake large-scale operations, saying it is no longer capable of fighting a conflict like the Falklands War.
Previously, Sir Patrick said Britain is now in a “pre-war” phase.
The Prime Minister of Poland, Donald Tusk, is using the same language, telling the press, “I know it sounds devastating, especially to people of the younger generation, but we have to mentally get used to a new era. We are in a pre-war era. I don’t exaggerate.
This is becoming more and more apparent every day.” Russian shell manufacturers are currently outproducing the U.S. and Europe by a factor of three to one. Meanwhile, expensive high-tech weaponry sent to Ukraine by the U.S. and its allies is fast becoming obsolete due to Russian jamming technology."
| |
|
GLOBAL ECONOMIC INDICATORS:
What This Week's Key Global Economic Releases Tell Us
| |
JUNE CPI - A TUMBLING LAGGING OER
It was only a matter of time before CPI started missing month after month, driven by the badly lagging Owner's Equivalent Rent, which will proceed to tumble for the "next 18 months, and since shelter is 36% of the CPI basket, inflation will soon appear low (even though real rents are rising again... so Fed is two cycles behind now).
Everyone was expecting the BLS to "collapse" inflation to give the Fed the green light to cut in September and just in time for the election. The next 9-12 months rent/OER inflation (43% of CPI basket) will surprise to the downside as it catches down to stale lagged real-time data, even as rents are actually rising right now... but the BLS won't observe this until early 2025.
THE PROBLEM
- POWELL: "if OER was going to remain as sticky as it had appeared, given the weight even in PCE prices, the FOMC would have little chance of getting inflation back to 2 percent."
- The rub, of course, is that real-time trackers of rental inflation are already rising, and by the time the Fed is cutting rates to reverse the slide in OER (and its 12-18 month lag), rents will be already on their way up, assuring a perfect storm of easier conditions just as housing costs soar to all time highs!
| |
JUNE PPI - CORE PPI ROSE 0.4% (2X 0.2% EXP)
After May's MoM deflationary impulse, (thanks to a plunge in energy costs), June was expected to see a modest 0.1% rise (and we have seen energy prices starting to rise again). Sure enough, headline PPI printed HOT at +0.2% MoM (and May was revised higher), pushing the YoY print up to 2.6% (well above the 2.3% expected).
That is the highest PPI since March 2023.
- Core PPI rose by 0.4% MoM (double the 0.2% exp), sending the YoY price rise up by 3.0% (also the hottest since March 2023).
- The jump in PPI was driven by a resurgence in Services costs as Energy remains deflationary.
- The June rise in the index for final demand can be traced to a 0.6-percent increase in prices for final demand services. In contrast, the index for final demand goods decreased 0.5 percent.
- The pipeline for PPI (intermediate demand) is accelerating.
| |
JUNE FISCAL BUDGET SPENDING - DEBT INTEREST 30% OF TAX RECEIPTS
The US is spending far more than it is generating in tax revenues.
The $140 billion in gross interest spending in June was just over 30% of all US receipts (mostly taxes) for the month.
In the latest Treasury Monthly Statement the US spent a gross $140 billion on debt interest, bringing the YTD total to $868 billion and is on pace to hit $1.144 trillion for the full year OR 67% of the expected deficit ($1.7T). This was the single biggest monthly interest outlay on record!
Clearly the US has a chronic spending problem. However, instead of cutting spending, we will raise taxes which, at the current level according to the Laffer Curve (remember your Reaganomics?), will only makes things worse!! (Chart above).
| |
|
GLOBAL MACRO
WHAT DOES YOUR SCAN OF THE DATA BELOW TELL YOU? - THE MEDIA AVOIDS BAD NEWS!
We present the data in a way you can quickly see what is happening.
THIS WEEK WE SAW
Exp=Expectations, Rev=Revision, Prev=Previous
| |
|
UNITED STATES
- NY Fed SCE (Jun) 1yr ahead inflation expectations 3.0% (prev. 3.2% M/M), 3yr at 2.9% (prev. 2.8%), 5yr at 2.8% (prev. 3.0%)
- US Wholesale Sales MM (May) 0.4% vs. Exp. 0.1% (Prev. 0.1%, Rev. 0.2%)
- US Wholesale Inventories MM (May) 0.6% vs. Exp. 0.6% (Prev. 0.6%)
- US CPI YY NSA (Jun) 3.0% vs. Exp. 3.1% (Prev. 3.3%)
- US Core CPI YY NSA (Jun) 3.3% vs. Exp. 3.4% (Prev. 3.4%)
- US Initial Jobless Claims w/e 222.0k vs. Exp. 236.0k (Prev. 238.0k, Rev. 239k)
- US Continued Jobless Claims w/e 1.852M vs. Exp. 1.86M (Prev. 1.858M, Rev. 1.856M)
- US Cleveland Fed CPI (Jun) 0.2% (Prev. 0.2%)
CHINA
- China FX Reserves (USD)(Jun) 3.222tln (Prev. 3.232tln)
- China Gold Reserves (USD)(Jun) 169.7bln (Prev. 171.0bln)
- Chinese CPI MM (Jun) -0.2% vs. Exp. -0.1% (Prev. -0.1%)
- Chinese CPI YY (Jun) 0.2% vs. Exp. 0.4% (Prev. 0.3%)
- Chinese PPI YY (Jun) -0.8% vs. Exp. -0.8% (Prev. -1.4%)
- Chinese CPI MM (Jun) -0.2% vs. Exp. -0.1% (Prev. -0.1%); YY (Jun) 0.2% vs. Exp. 0.4% (Prev. 0.3%)
- Chinese PPI YY (Jun) -0.8% vs. Exp. -0.8% (Prev. -1.4%)
- Chinese Trade Balance (USD)(Jun) 99.05B vs. Exp. 85.0B (Prev. 82.62B)
- Chinese Exports YY (USD)(Jun) 8.6% vs. Exp. 8.0% (Prev. 7.6%)
- Chinese Imports YY (USD)(Jun) -2.3% vs. Exp. 2.8% (Prev. 1.8%)
- Chinese Trade Balance (CNY)(Jun) 703.7B (Prev. 586.4B)
- Chinese Exports YY (CNY)(Jun) 10.7% (Prev. 11.2%)
- Chinese Imports YY (CNY)(Jun) -0.6% (Prev. 5.2%)
JAPAN
- Japanese Labor Cash Earnings YY (May) 1.9% vs Exp. 2.1% (Prev. 2.1%)
- Japanese Current Account NSA JPY (May) 2849.9B vs. Exp. 2453.9B (Prev. 2050.5B)
- Japanese Bank Lending YY (Jun) 3.2% (Prev. 3.0%, Rev. 2.9%)
- Chinese CPI MM (Jun) -0.2% vs. Exp. -0.1% (Prev. -0.1%)
- Chinese CPI YY (Jun) 0.2% vs. Exp. 0.4% (Prev. 0.3%)
- Chinese PPI YY (Jun) -0.8% vs. Exp. -0.8% (Prev. -1.4%)
- Japanese Corp Goods Price MM (Jun) 0.2% vs. Exp. 0.4% (Prev. 0.7%)
- Japanese Corp Goods Price YY (Jun) 2.9% vs. Exp. 2.9% (Prev. 2.4%, Rev. 2.6%)
- Japanese Machinery Orders MM (May) -3.2% vs. Exp. 0.8% (Prev. -2.9%)
- Japanese Machinery Orders YY (May) 10.8% vs. Exp. 7.2% (Prev. 0.7%)
UK
- UK BRC Retail Sales YY (Jun) -0.5% (Prev. 0.4%)
- UK BRC Total Sales YY (Jun) -0.2% (Prev. 0.7%)
- UK RICS Housing Survey (Jun) -17.0 vs. Exp. -15.0 (Prev. -17.0)
- UK GDP Estimate YY (May) 1.4% vs. Exp. 1.2% (Prev. 0.6%, Rev. 0.7%); GDP Estimate MM (May) 0.4% vs. Exp. 0.2% (Prev. 0.0%); all three main sectors contributed positively to GDP growth in May 2024; Est 3M/3M (May) 0.9% vs. Exp. 0.7% (Prev. 0.7%)
- UK Services MM (May) 0.3% vs. Exp. 0.2% (Prev. 0.2%, Rev. 0.3%); Services YY (May) 1.6% vs. Exp. 1.5% (Prev. 1.1%, Rev. 1.2%)
- UK Industrial Output YY (May) 0.4% vs. Exp. 0.6% (Prev. -0.4%, Rev. -0.7%); Industrial Output MM (May) 0.2% vs. Exp. 0.2% (Prev. -0.9%)
- UK Goods Trade Balance GBP (May) -17.917B GB vs. Exp. -16.8B GB (Prev. -19.607B GB, Rev. -19.442B GB); Goods Trade Bal. Non-EU (May) -6.856B GB (Prev. -7.29B GB, Rev. -6.965B GB)
- UK Construction O/P Vol YY (May) 0.8% vs. Exp. -1.9% (Prev. -3.3%, Rev. -2.1%); Construction O/P Vol MM (May) 1.9% vs. Exp. 1.0% (Prev. -1.4%, Rev. -1.1%)
- UK Manufacturing Output MM (May) 0.4% vs. Exp. 0.4% (Prev. -1.4%, Rev. -1.6%); Manufacturing Output YY (May) 0.6% vs. Exp. 1.2% (Prev. 0.4%, Rev. -0.4%)
- UK RICS Housing Survey (Jun) -17.0 vs. Exp. -15.0 (Prev. -17.0)
| |  |
|
EU
- EU Sentix Index (Jul) -7.3 vs. Exp. 0.0 (Prev. 0.3)
GERMANY
- German Trade Balance, EUR, SA (May) 24.9B vs. Exp. 21.1B (Prev. 22.1B)
- German Trade Balance SA (EUR)(May) 24.9B vs. Exp. 21.1B (Prev. 22.1B)
- German Exports MM SA (May) -3.6% vs. Exp. -1.9% (Prev. 1.6%)
- German Imports MM SA (May) -6.6% vs. Exp. -1.0% (Prev. 2.0%)
- German HICP Final YY (Jun) 2.5% vs. Exp. 2.5% (Prev. 2.5%); HICP Final MM (Jun) 0.2% vs. Exp. 0.2% (Prev. 0.2%); CPI Final YY (Jun) 2.2% vs. Exp. 2.2% (Prev. 2.2%); CPI Final MM (Jun) 0.1% vs. Exp. 0.1% (Prev. 0.1%)
- German Wholesale Price Index YY (Jun) -0.6% (Prev. -0.7%); MM -0.3% (Prev. 0.1%)
ITALY
- Italian Industrial Output YY WDA (May) -3.3% (Prev. -2.9%); Industrial Output MM SA (May) 0.5% vs. Exp. 0.1% (Prev. -1.0%)
FRANCE
- French CPI (EU Norm) Final YY (Jun) 2.5% vs. Exp. 2.5% (Prev. 2.5%); CPI (EU Norm) Final MM (Jun) 0.2% vs. Exp. 0.1% (Prev. 0.1%)
- Spanish CPI MM Final NSA (Jun) 0.4% vs. Exp. 0.3% (Prev. 0.3%); CPI YY Final NSA (Jun) 3.4% vs. Exp. 3.4% (Prev. 3.4%); HICP Final YY (Jun) 3.6% vs. Exp. 3.5% (Prev. 3.5%); HICP Final MM (Jun) 0.4% vs. Exp. 0.3% (Prev. 0.3%)
SPAIN
- Spanish CPI MM Final NSA (Jun) 0.4% vs. Exp. 0.3% (Prev. 0.3%); CPI YY Final NSA (Jun) 3.4% vs. Exp. 3.4% (Prev. 3.4%); HICP Final YY (Jun) 3.6% vs. Exp. 3.5% (Prev. 3.5%); HICP Final MM (Jun) 0.4% vs. Exp. 0.3% (Prev. 0.3%)
AUSTRALIA
- Australian Home Loans MM (May) -1.7% vs Exp. 1.8% (Prev. 4.8%)
- Australian Owner-Occupied Housing Finance MM (May) -2.0% vs Exp. 2.0% (Prev. 4.3%)
- Australian NAB Business Confidence (Jun) 4.0 (Prev. -3.0)
- Australian NAB Business Conditions (Jun) 4.0 (Prev. 6.0)
- Australian Consumer Confidence Index (Jul) 82.7 (Prev. 83.6)
- Australian Consumer Sentiment MM (Jul) -1.1% (Prev. 1.7%)
HUNGARY
- Hungarian Core CPI YY (Jun) 4.1% vs. Exp. 4.0% (Prev. 4.0%); CPI YY (Jun) 3.7% vs. Exp. 4.0% (Prev. 4.0%)
CZECH
- Czech CPI YY (Jun) 2.0% vs. Exp. 2.5% (Prev. 2.6%); CPI MM (Jun) -0.3% vs. Exp. 0.2%
NORWAY
- Norwegian Core Inflation YY (Jun) 3.4% vs. Exp. 3.6% (Prev. 4.1%); Consumer Price Index YY (Jun) 2.6% vs. Exp. 2.9% (Prev. 3.0%)
SWEDEN
- Swedish Money Mkt CPIF Infl 1 Yr (Jul) 2.0% (Prev. 1.9%); Money Mkt CPIF Infl 5 Yrs (Jul) 2.1% (Prev. 2.0%)
- Swedish CPIF YY (Jun) 1.3% vs. Exp. 1.6% (Prev. 2.3%); Ex Energy 2.3% vs. Exp. 2.5% (Prev. 3.0%)
SINGAPORE
- Singapore GDP QQ (Q2 P) 0.4% vs Exp. 0.4% (prev. 0.1%)
- Singapore GDP YY (Q2 P) 2.9% vs Exp. 2.7% (prev. 2.7%)
| |
CURRENT MARKET PERSPECTIVE | |
|
DISTRIBUTION & ROTATION ACCELERATES
WEAKENING TECH - SURGING SMALL CAP
Click All Charts to Enlarge
| |
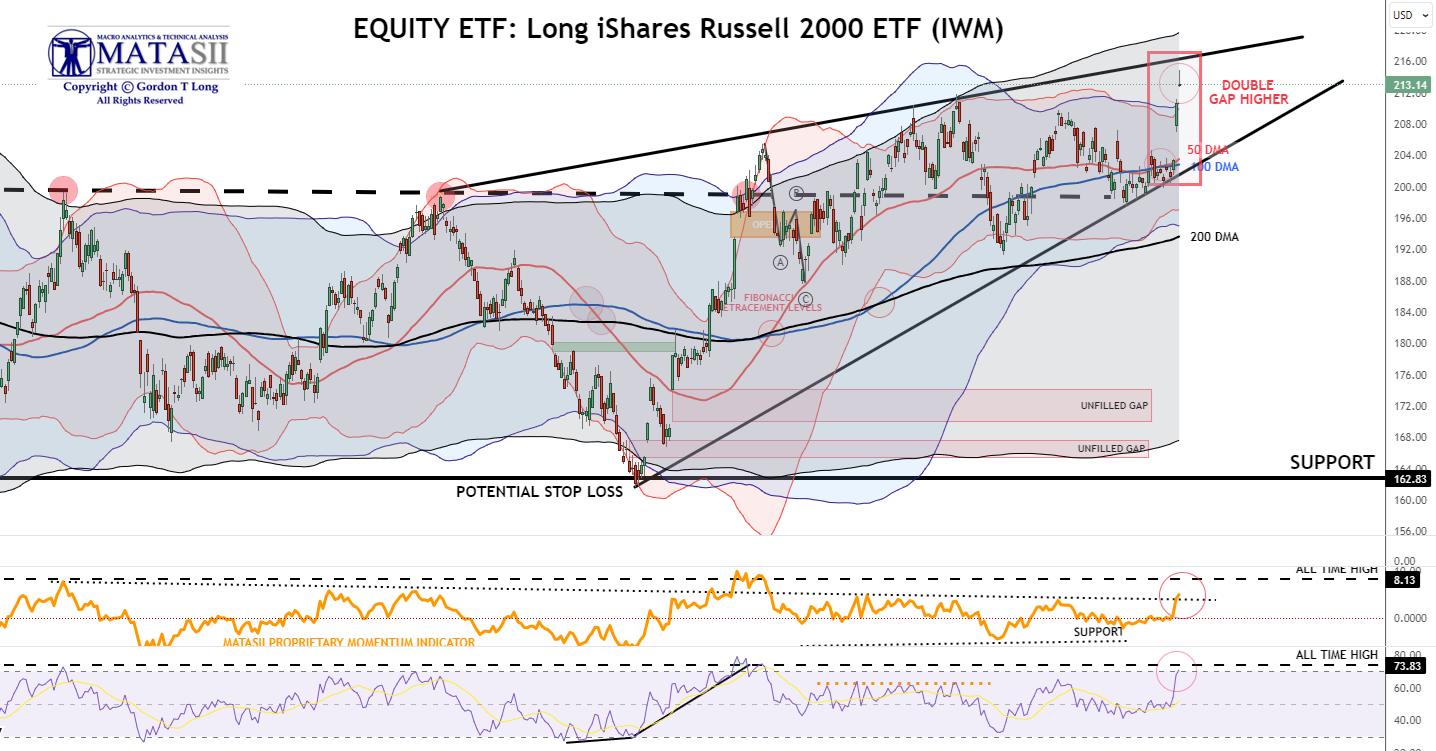
THE RUSSELL SURGES: As earning season gets underway the market chases small caps while distribution in tech and the Mag-7. shows itself. Fund Managers are protecting themselves from possible negative earning surprises. | |
|
1 - SITUATIONAL ANALYSIS
STOCK ROTATION
As we enter the Q2 Earnings Season the market, which has been under quiet distribution made a sudden move out of tech and into small caps.
- Small Caps literally exploding higher - up around 7% on the week!
- The Russell 2000's best week since November and broke it out to its highest since Jan 2022.
- Thursday's outperformance of Russell vs S&P 500 was the 5th largest in 45 years.
CHART RIGHT:
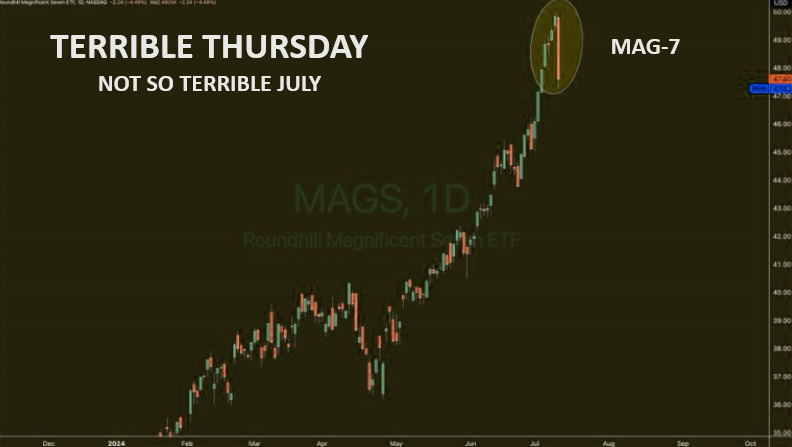
1. The Magnificent 7 erased a combined $600 billion of market cap Thursday.
2. It has been 48 days since all the Mag7 names closed red on the same day, the longest streak in > 10 years.
3. Despite the 3-4% pullbacks in Big Tech stocks today, AMZN, META, GOOGL, MSFT, NVDA are all still up +1-5% in the month of July and NDX up 3%, even after turn-around Thursday.
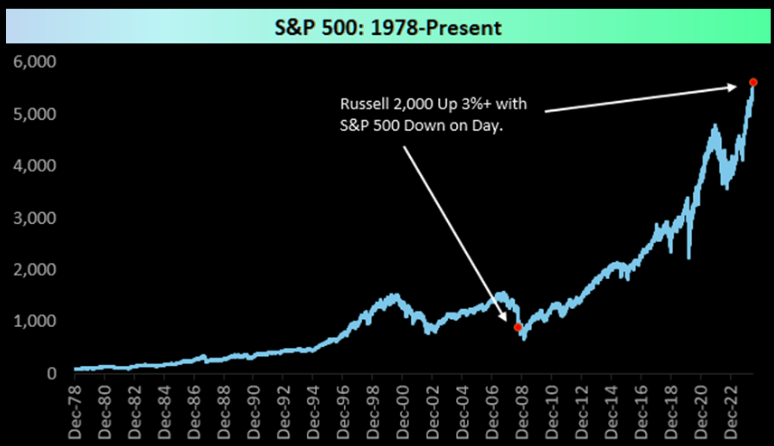
ONLY THE SECOND TIME IN HISTORICAL DATA
It was just the second time in history since inception in 1979 that the small-cap Russell 2,000 gained 3%+ while the S&P 500 fell on the day. The only other day that happened was back on 10/10/2008....very different market to today.
| |
|
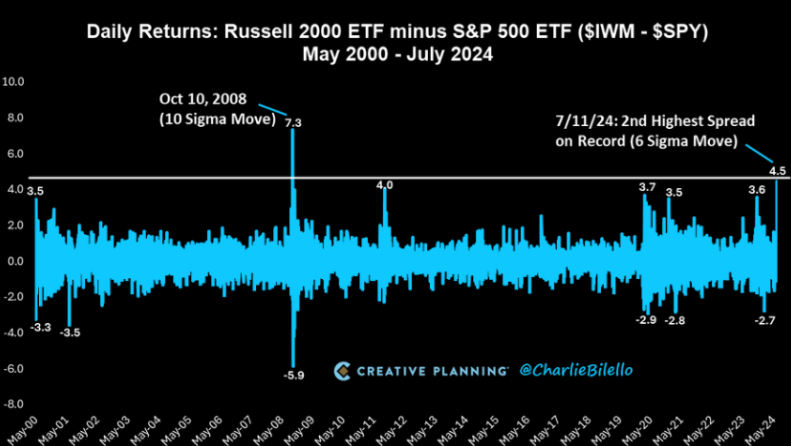
Small caps outperforming Large caps on Thursday was a 6 standard deviation event. The possibility of a specific one happening are one in 506m days BUT the probability of any six sigma event occurring are far far less.
| | |
|
Fun with Factors:
1. Biggest 1 day move in Nasdaq vs Russell since Jan 6th, 2021 driven by small caps rallying.
2. From a factor stand-point this is a very pro-risk on move with beta factor up and Size down 4.2 sigma.
| | |
|
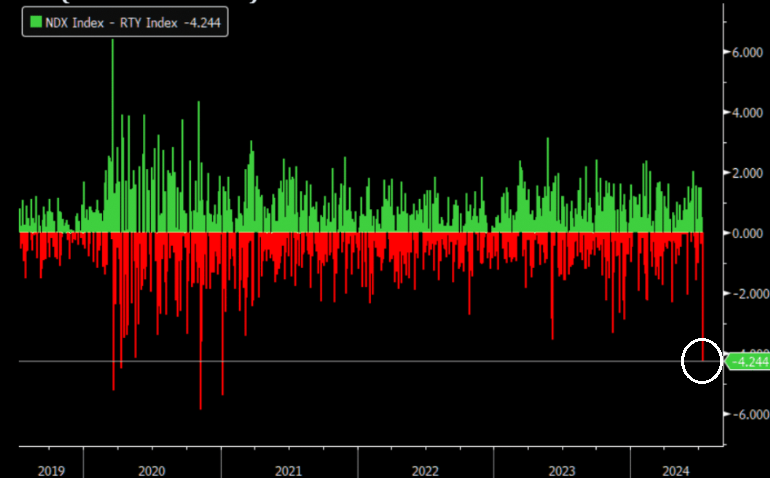
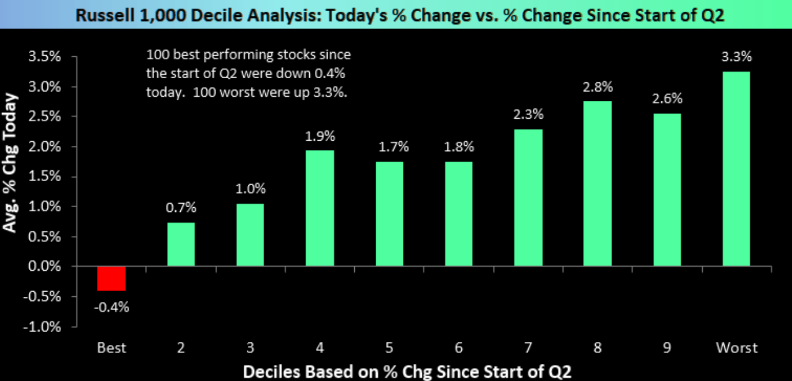
A MEAN REVERSION TO THE EXTREME
Huge reversal from the recent trend. Here's a look at Thursday's performance compared to performance since the start of Q2.
| |
|
FUND MANAGERS CAPITULATING
I have a lot of respect for Dr Ed Yardeni, so when he goes public I pay attention. He is saying:
"This slow-motion melt-up has further to run and could see their 6000 SPX target for 2025 being too conservative.
Eric, Joe, and I aren’t raising our year-end target for the S&P 500 just yet. But we are learning to live with the S&P 500 outpacing even our bullish projections.
It did so last year: Our year-end target of 4600 was reached on July 31, 2023....Now we are rethinking whether our current projections of 6000 by the end of 2025, 6500 by the end of 2026, and 8000 by the end of the decade might be too conservative.
The market may be discounting our Roaring 2020s scenario faster than we expected?"
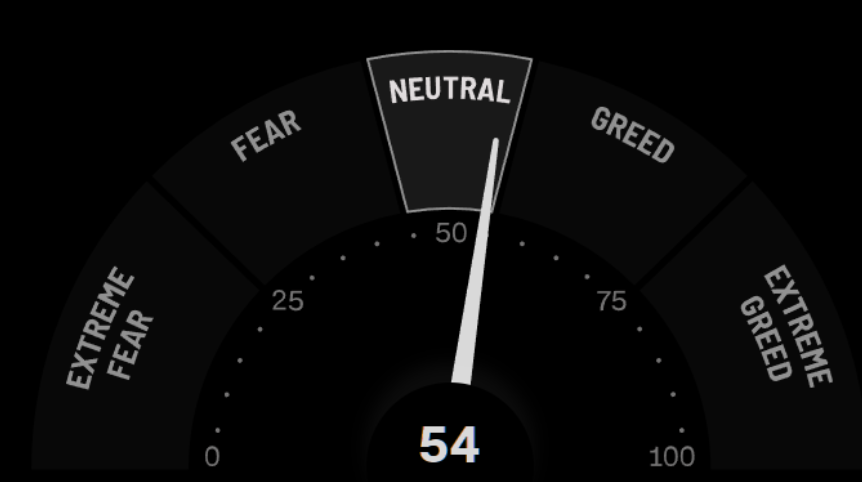
CHART TOP RIGHT: All this bull and still no greed?
CHART MIDDLE TOP RIGHT: The Put call ratio continues imploding.
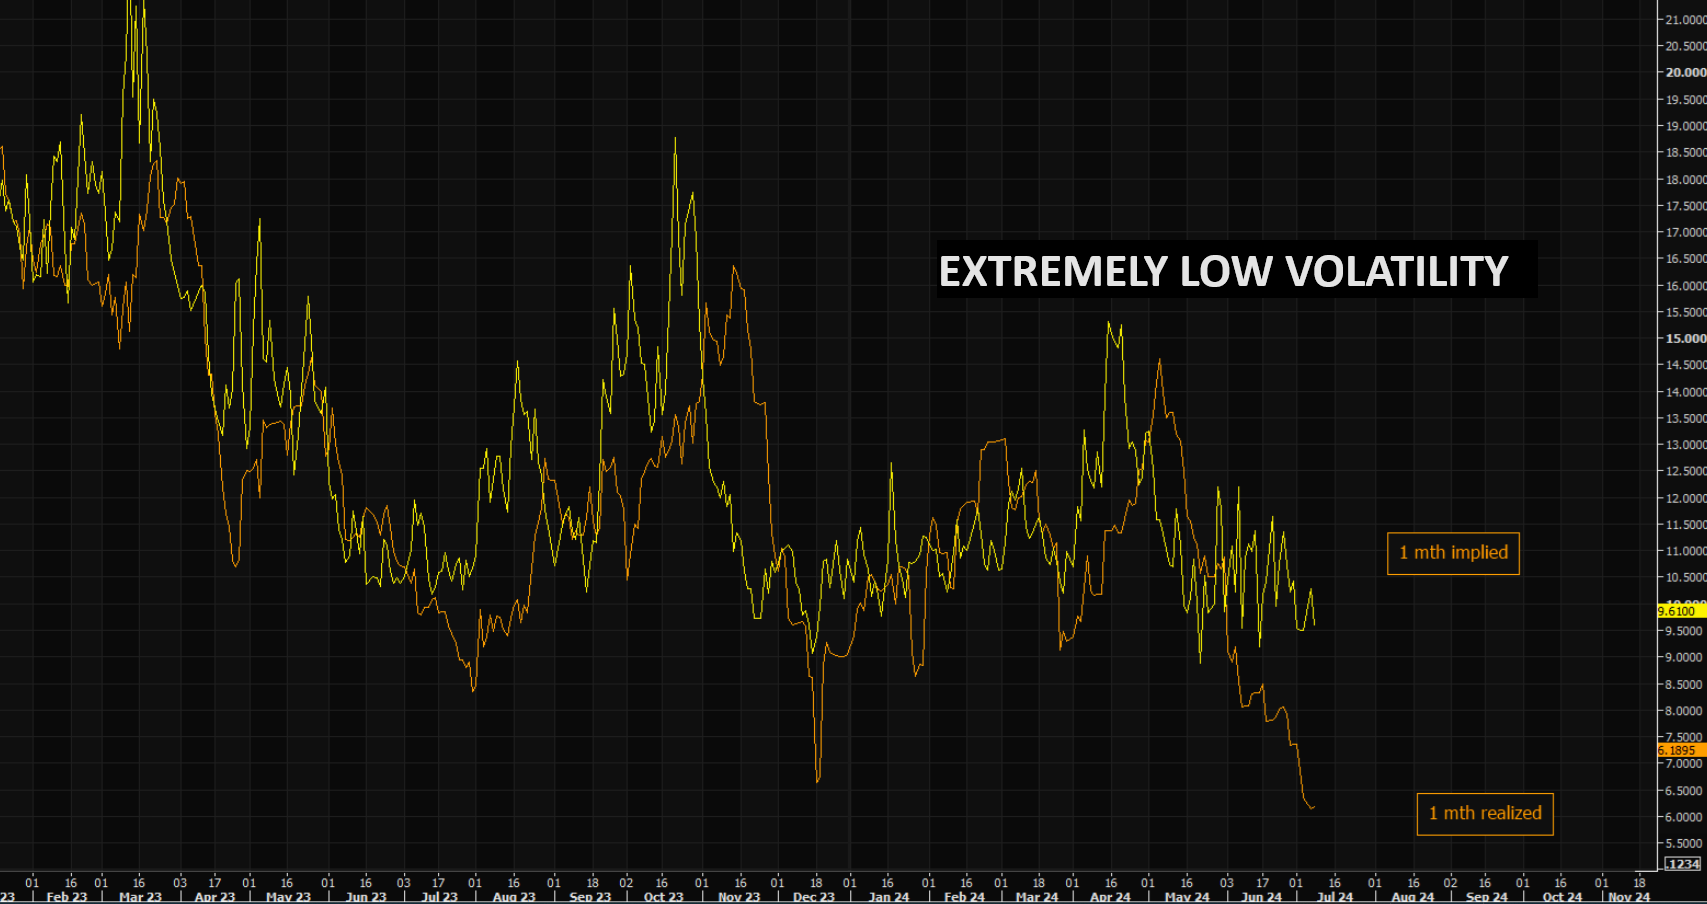
CHART MIDDLE BOTTOM RIGHT: Implied Volatility is low, but since we aren't realizing much at all...things may not be as cheap as they "appear"?
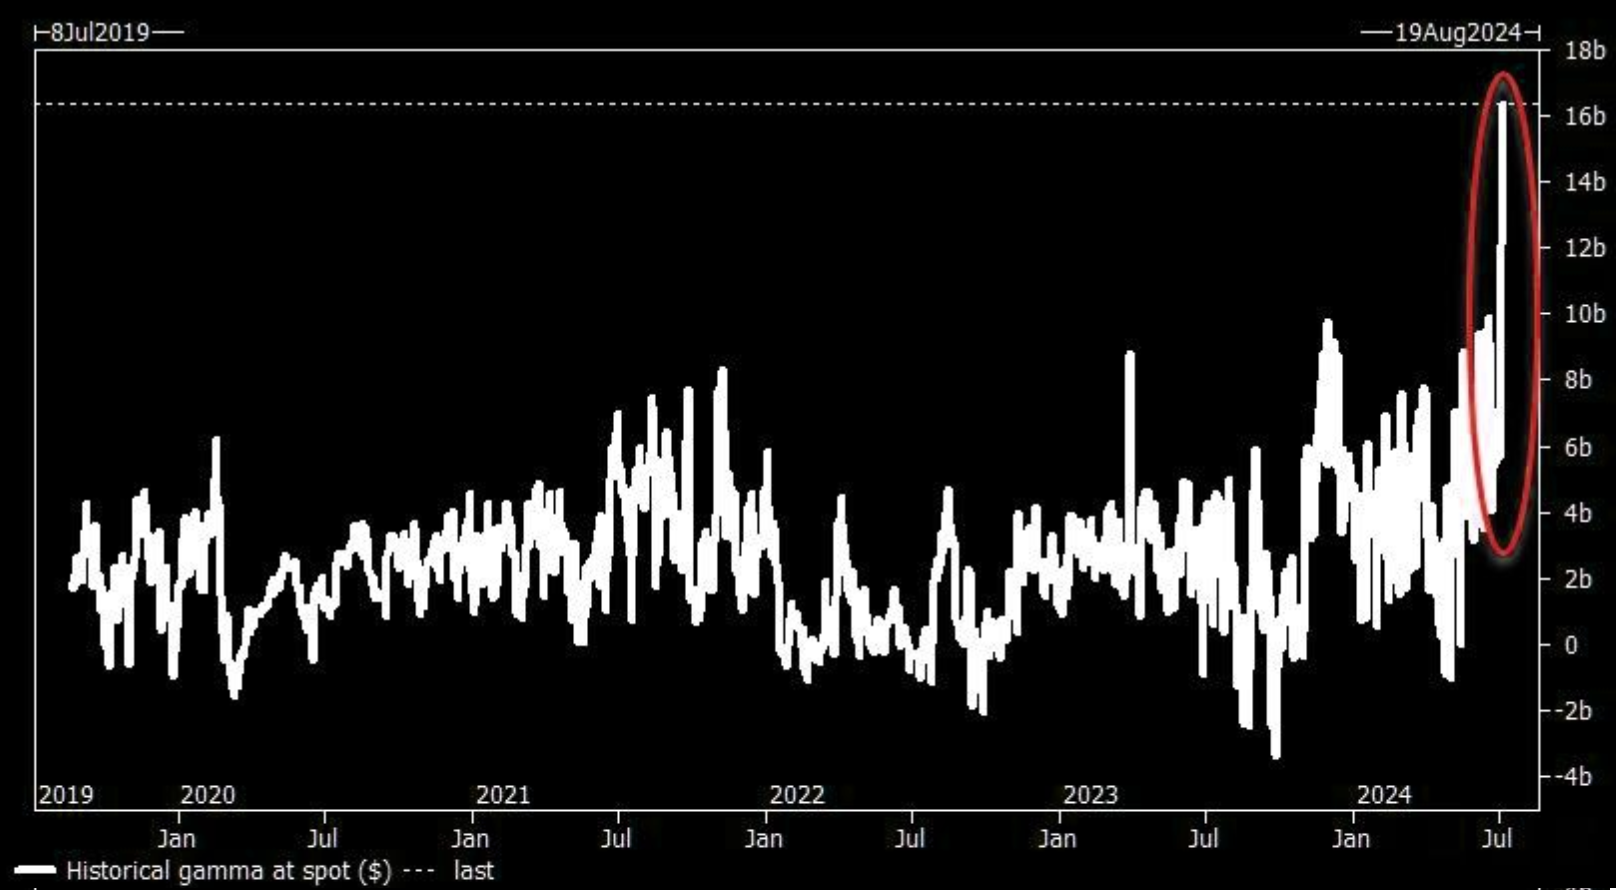
CHART BOTTOM RIGHT: Choking on Theta - Dealers are running massive long gamma here, acting as a huge vol dampener. They have size deltas to sell if markets move up, and size deltas to buy in case we move lower. This is theta agony and everybody that has run big long gamma in dull summer trading knows the "Chinese water torture" feeling...usually a good time to buy vol/hedges, although "most" have already promised not to buy options again.
| | |
| |
|
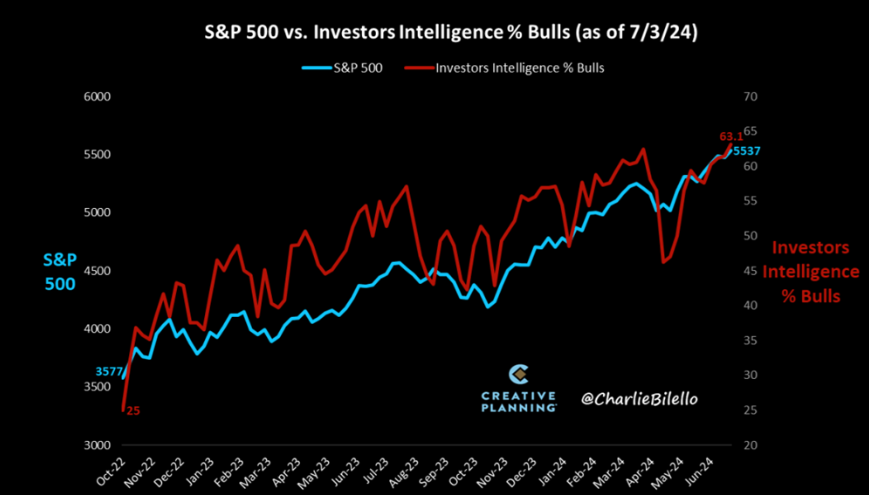
BULLISH SENTIMENT HIGHEST IN OVER 4 YEARS!
The percentage of Bulls in the Investors Intelligence survey has moved up to 63%, the highest we've seen since April 2021. This is above 97% of historical readings.
| |
|
HIGHER RATES??
Fed Chair Powell making it clear to the House Financial Services Committee that:
“The era of super low interest rates that occurred between the 2008 financial crisis and the pandemic is likely over and that the neutral interest rate for hitting 2-percent annual inflation had probably risen.
Central bank interest rate policy was probably not going to return to the near-zero level that held between 2009 and 2017. We have our policy rate over 5 percent now and it feels like policy is restrictive but not intensely restrictive.
That suggests that the neutral rate of interest, at least as of now, will have risen somewhat, which means rates will get a little higher.”
| |
|
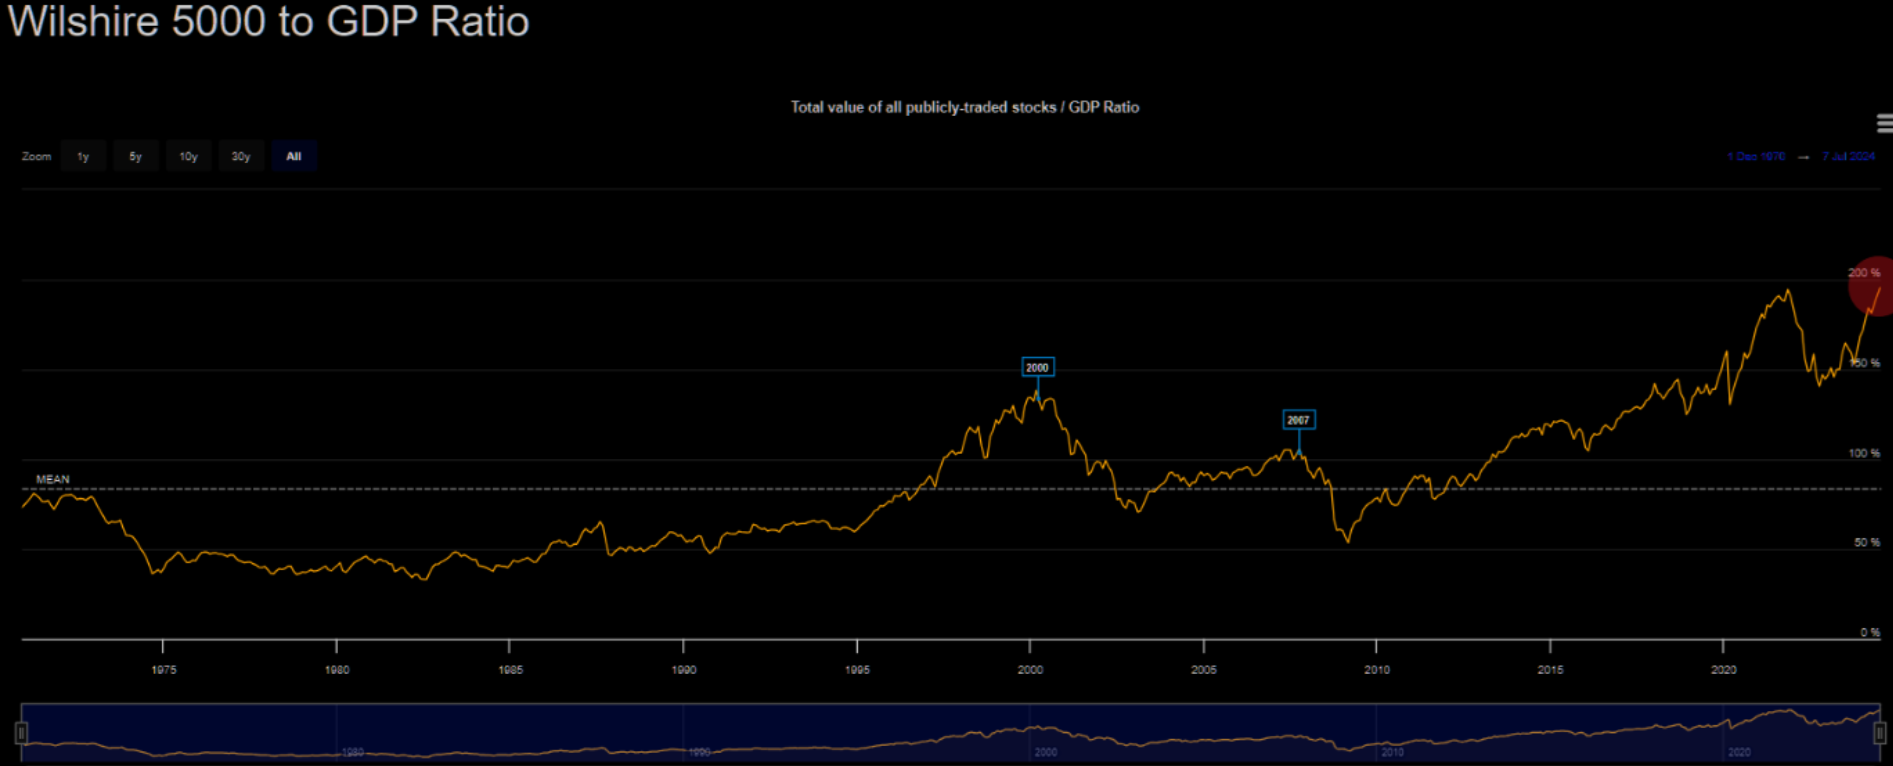
WARREN BUFFETT INDICATOR
Warren Buffett Indicator hits 195%, the highest level in history, surpassing the Dot Com bubble, the Global Financial Crisis, and the 2022 Bear Market
| |
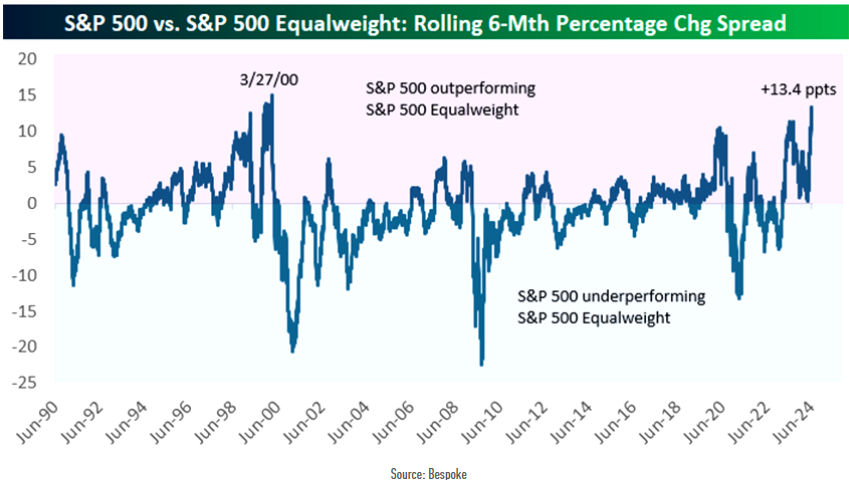
LOOKS LIKE MARCH 2000
The only other time that the S&P 500 (cap-weighted) has outperformed the S&P 500 Equal-weight index by a wider margin over a six-month stretch was in late March 2000.
| |
|
MARKET DRIVERS
"AS GO THE FINANCIALS, SO GO THE BANKS: AS GO THE BANKS, SO GO THE MARKETS."
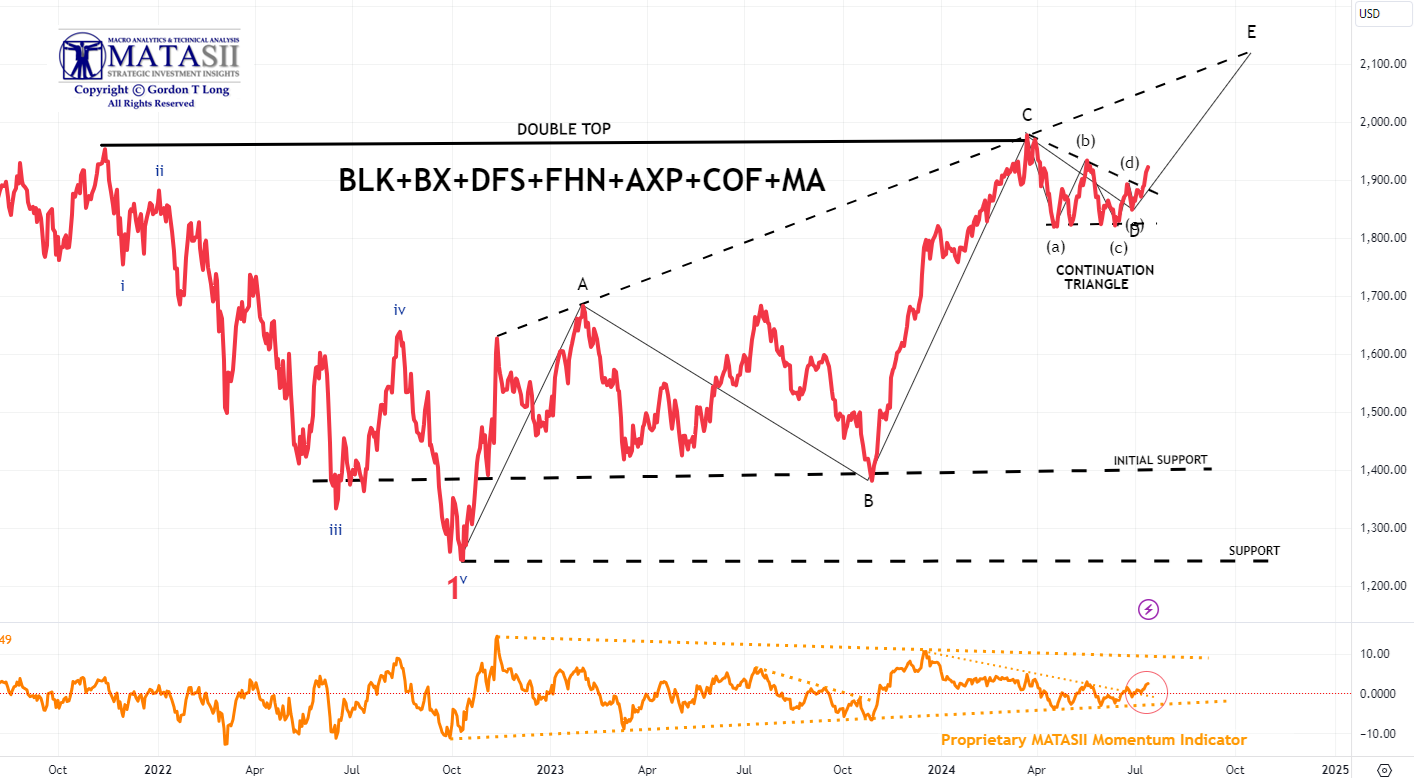
MATASII FINANCIAL STOCK INDEX
We continue to keep an eye on both the Bank and Financial stocks to give us an early signal of market direction. We have been showing the banks over the last few weeks, but the Financials now appear to be giving a clearer signal.
- The MATASII Financial Index is giving a clear sign of a potential break to the upside.
- The Elliott Wave analysis supports an "E" wave higher as part of a potential final ABCDE topping pattern.
- Momentum (bottom pane) has found long term support and it has broken the overhead resistance trend line, shown by a dotted descending orange momentum trend line.
| |
|
YOUR DESKTOP / TABLET / PHONE ANNOTATED CHART
Macro Analytics Chart Above: SUBSCRIBER LINK
| |
|
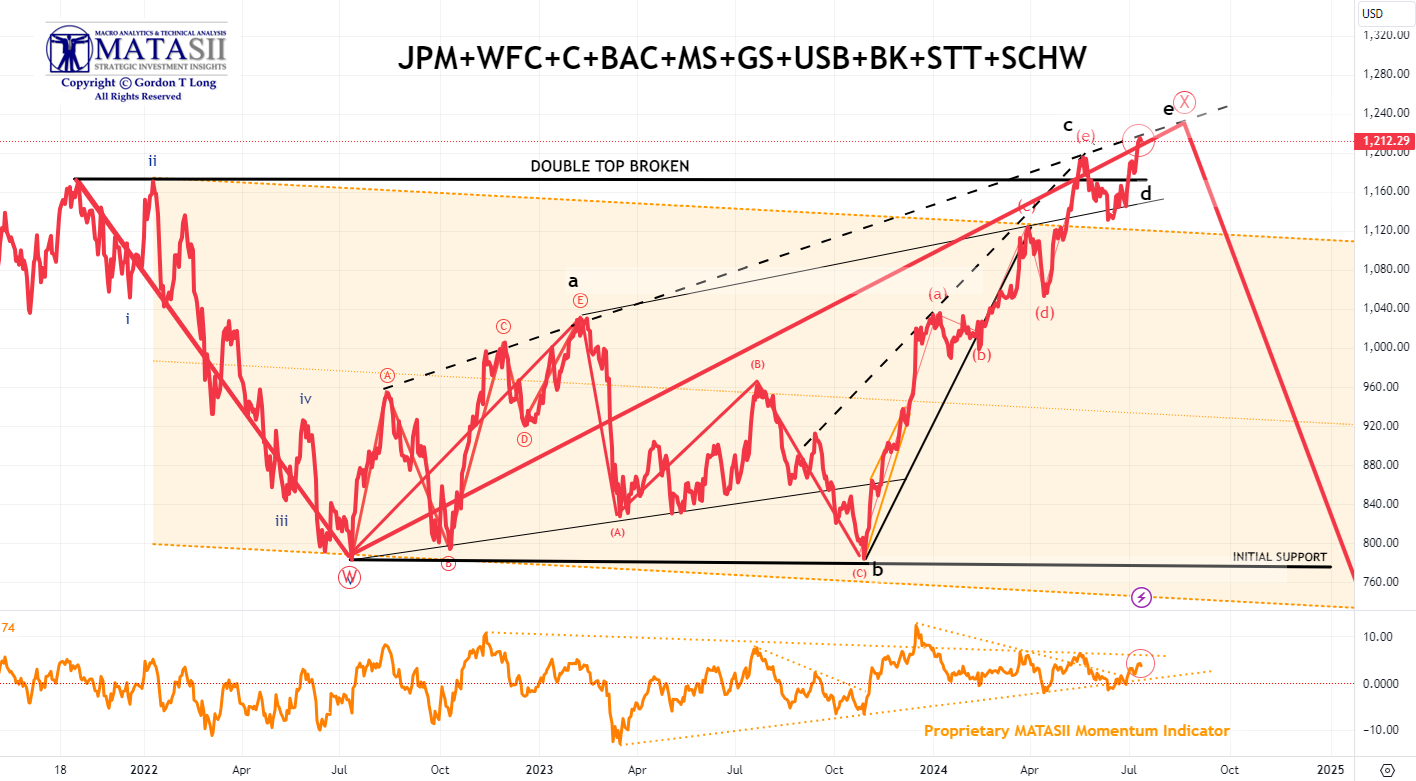
MATASII BANK STOCK INDEX
- The MATASII Bank Index has surged to its upper trend line (black dashed line).
- The "e" Wave may possibly be completed here, short of our original target price.
- Momentum (bottom pane) found long term support and is near potentially breaking the overhead resistance trend line to move higher (shown by a dotted descending orange momentum trend line).
| |
YOUR DESKTOP / TABLET / PHONE ANNOTATED CHART
Macro Analytics Chart Above: SUBSCRIBER LINK
| |
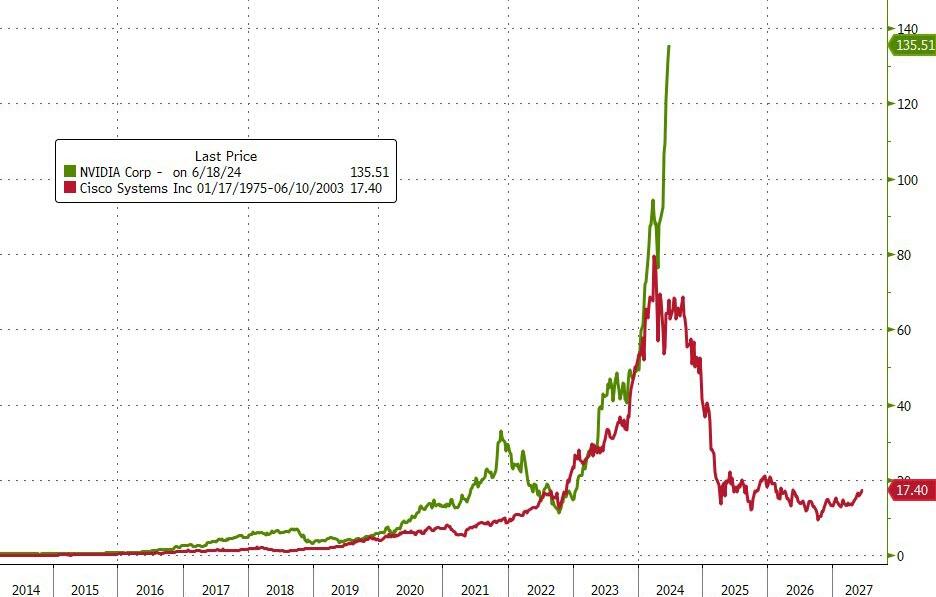
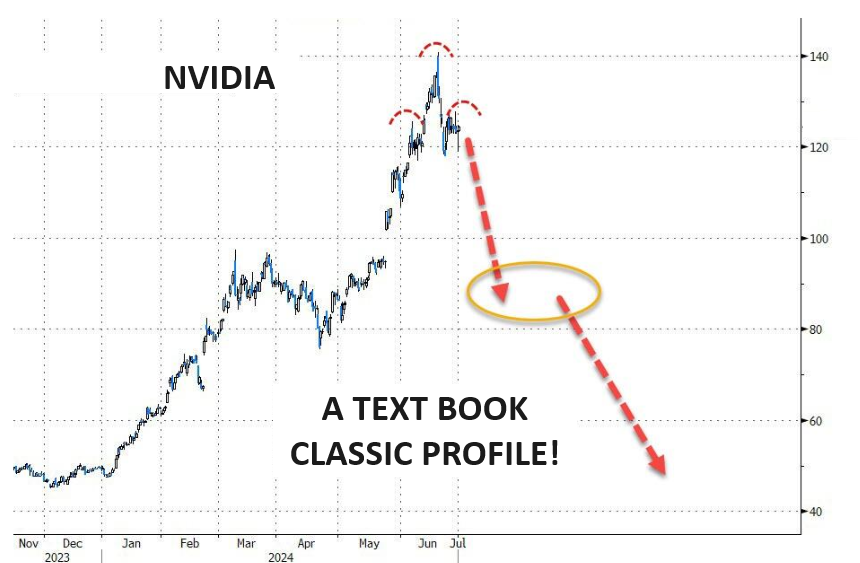
As goes NVDA, so goes the MAG-7, As Goes Mag-7 so goes The Market. | |
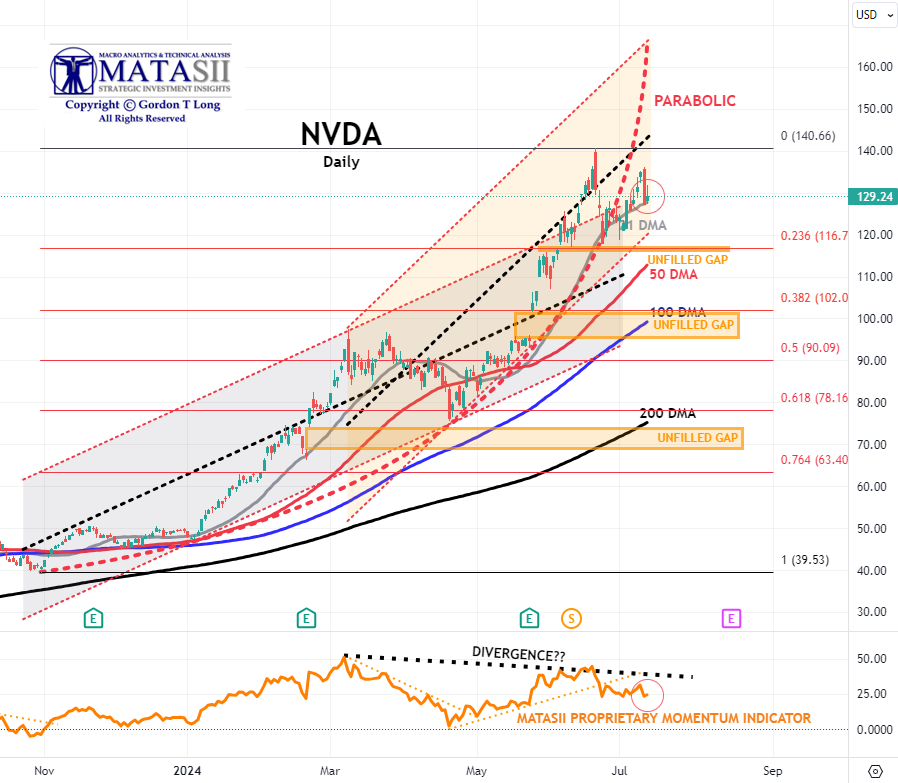
NVDA - Daily
CHART RIGHT: NVDA v the darling of the Dotcom Bubble (for those who recall), CSCO was dominant. It appears that was nothing!
- NVDA sold-off hard on Thursday finding initial support at its 21 DMA.
- Momentum (Lower pane) has also noticeably weakened.
- The Dotted Black Trend line in the MATASII Proprietary Momentum Indicator (lower pane below) continues to show a Divergence.
| |
Divergence is normally seen as a warning to the downside and is still ahead if the Divergence isn't removed by a movement higher in Momentum.
- Until the dotted black Momentum line is decisively broken we can expect NVDA to again look for lower support levels.
- At some point the major unfilled gaps (at much lower levels) must be filled. NVDA therefore may no longer become a Short to Intermediate Long Term hold, but rather a position trading stock as others entering the space and force margins to contract.
| |
YOUR DESKTOP / TABLET / PHONE ANNOTATED CHART
Macro Analytics Chart Above: SUBSCRIBER LINK
| |
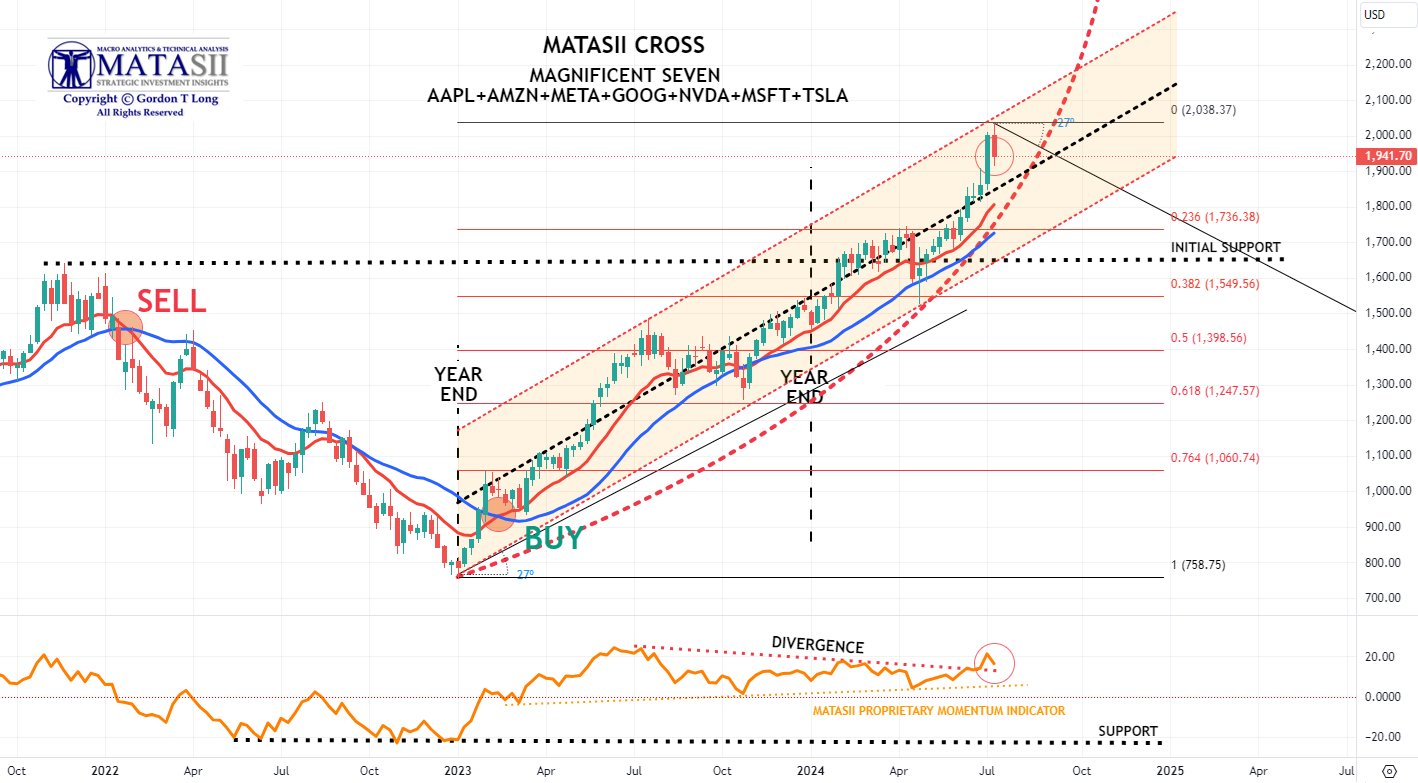
MAGNIFICENT 7
- The basket of 'Magnificent 7' stocks after surging to new highs early this week, sold down on Thursday.
- The momentum Divergence signal has been clearly broken (bottom pane). but is likely to be tested as overhead resistance becomes support.
- Continued caution is advised since major global "Dark Pools" have been identified as presently operating behind the scenes on the Mag-7.
| |
YOUR DESKTOP / TABLET / PHONE ANNOTATED CHART
Macro Analytics Chart Above: SUBSCRIBER LINK
| |
"CURRENCY" MARKET (Currency, Gold, Black Gold (Oil) & Bitcoin) | |
|
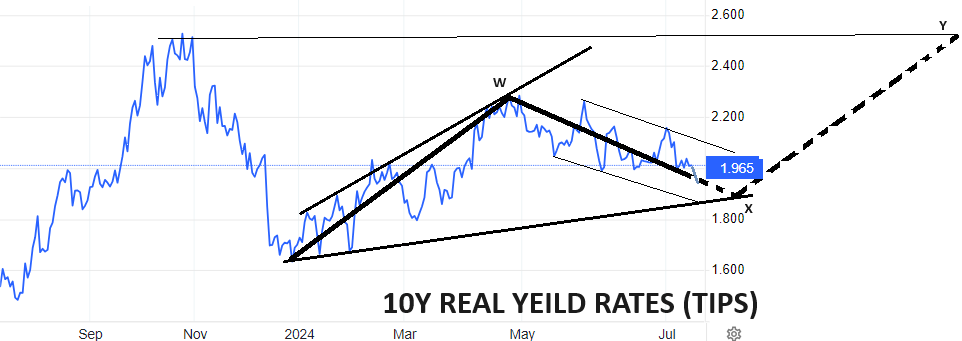
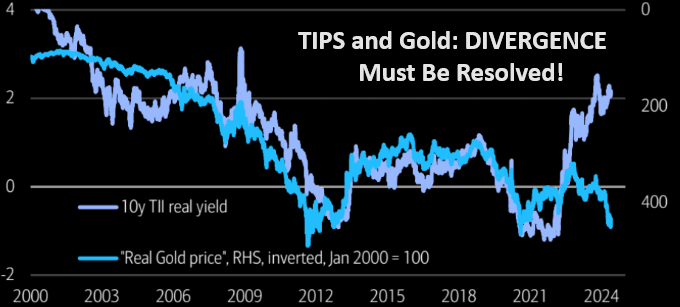
10Y REAL YIELD RATE (TIPS)
Real Rates reached our initial overhead resistance level of 2.25% before falling off hard as part of our expected "x" leg lower (chart right).
We are approaching support and a potential turn upward in yields.
| |
CONTROL PACKAGE
There are TEN charts we have outlined in prior chart packages, which we will continue to watch closely as a CURRENT Control Set:
-
US DOLLAR -DXY - MONTHLY (CHART LINK)
-
US DOLLAR - DXY - DAILY (CHART LINK)
-
GOLD - DAILY (CHART LINK)
-
GOLD cfd's - DAILY (CHART LINK)
-
GOLD - Integrated - Barrick Gold (CHART LINK)
-
SILVER - DAILY (CHART LINK)
-
OIL - XLE - MONTHLY (CHART LINK)
-
OIL - WTIC - MONTHLY - (CHART LINK)
-
BITCOIN - BTCUSD - WEEKLY (CHART LINK)
-
10y TIPS - Real Rates - Daily (CHART LINK)
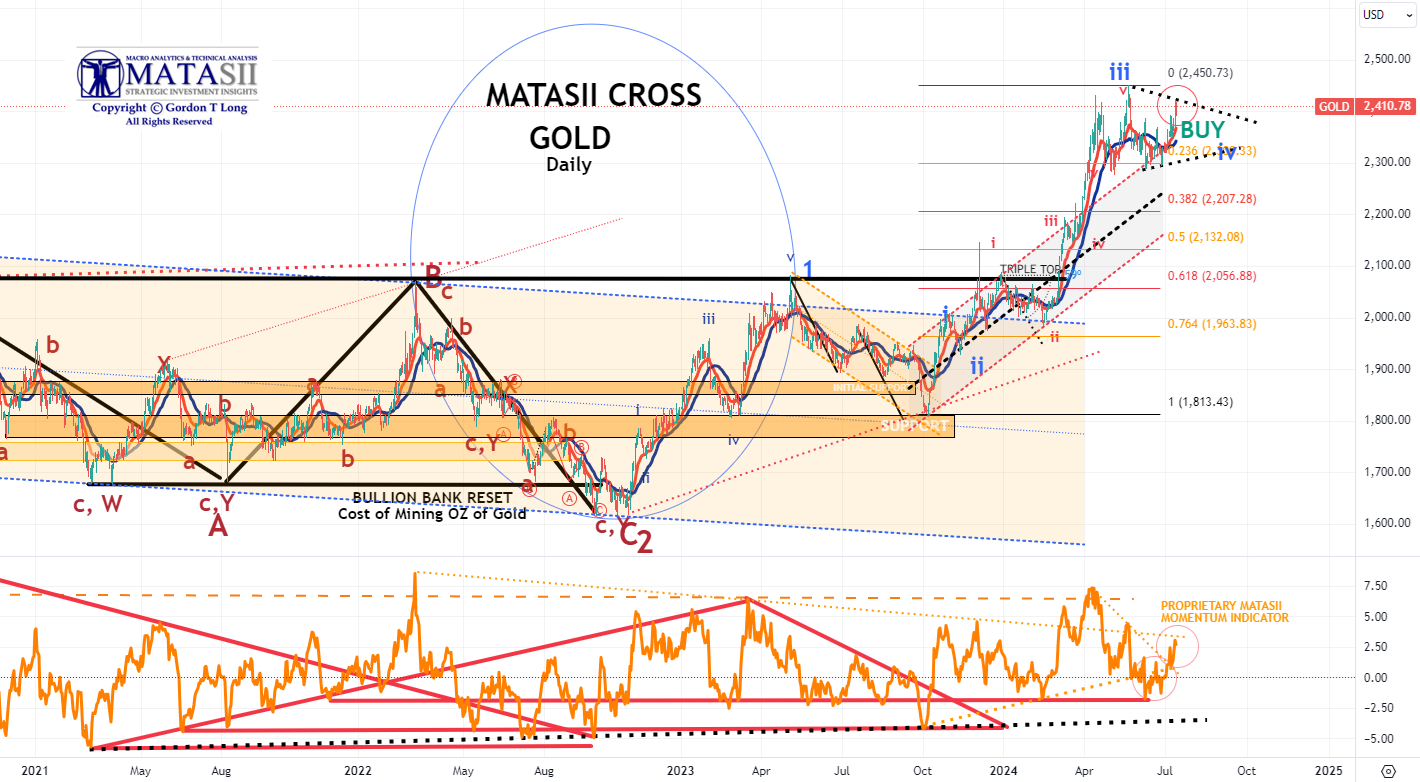
GOLD - DAILY
- Gold is showing increasing strength again and has given us a preliminary BUY signal. We still need to have this confirmed on a weekly basis.
- We do not believe the consolidation Wave "iv" has yet been completed.
- We need to see the momentum (lower pane) break its higher resistance level line (orange dotted trend) as well as a new high to feel strongly that the V wave is underway.
| |
YOUR DESKTOP / TABLET / PHONE ANNOTATED CHART
Macro Analytics Chart Above: SUBSCRIBER LINK
| |
|
CONTROL PACKAGE
There are FIVE charts we have outlined in prior chart packages that we will continue to watch closely as a CURRENT "control set":
-
The S&P 500 (CHART LINK)
-
The DJIA (CHART LINK)
-
The Russell 2000 through the IWM ETF (CHART LINK),
-
The MAGNIFICENT SEVEN (CHART ABOVE WITH MATASII CROSS - LINK)
-
Nvidia (NVDA) (CHART LINK)
| |
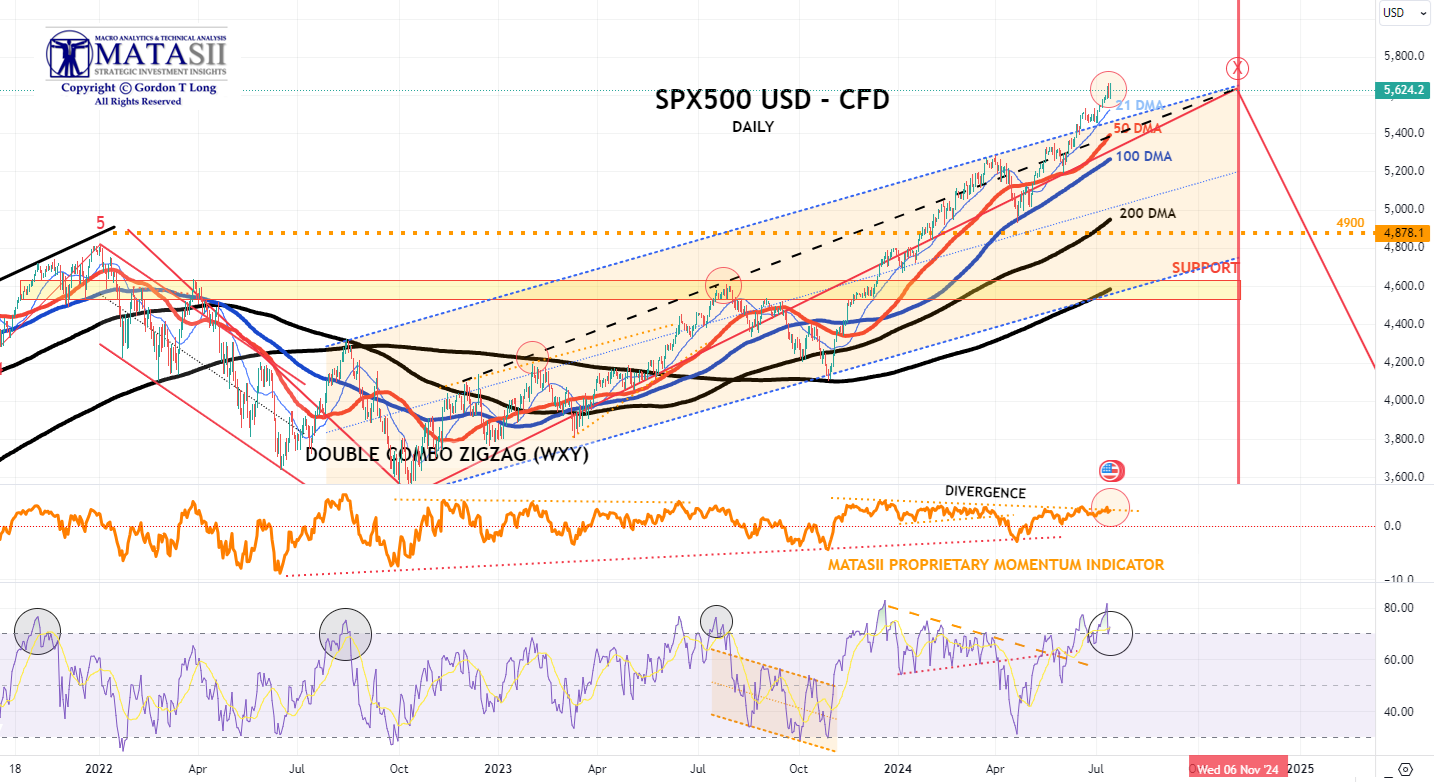
S&P 500 CFD
- The S&P 500 cfd broke to new highs as it broke through its overhead trend channel boundary.
- The MATASII Proprietary Momentum Indicator (middle pane) has not yet broken the concerning Divergence pattern shown by the descending orange dotted trend line.
- There is a strong possibility that this may be a "through over" before retesting the rising trend channel.
| |
YOUR DESKTOP / TABLET / PHONE ANNOTATED CHART
Macro Analytics Chart Above: SUBSCRIBER LINK
| |
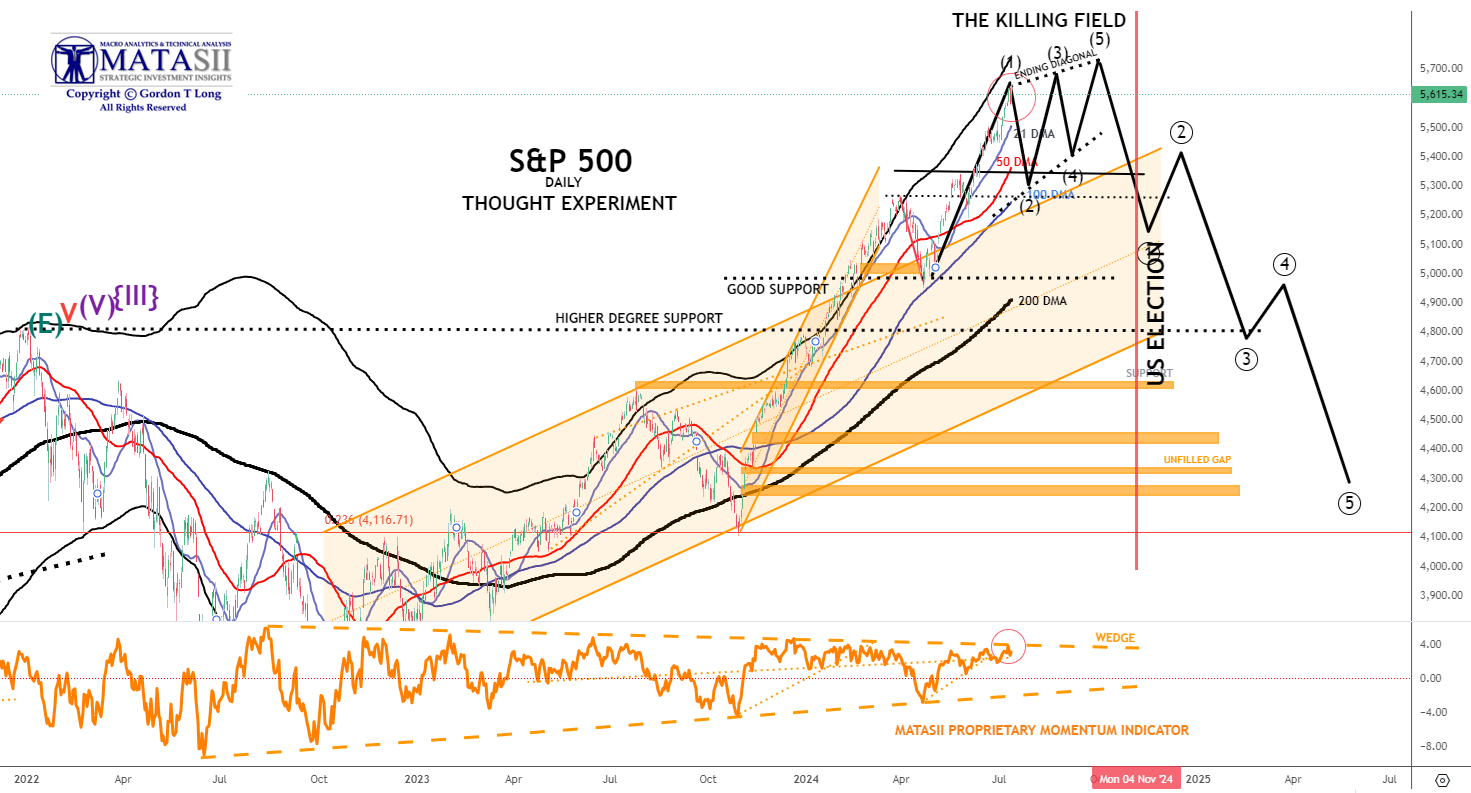
S&P 500 - Daily - Our Thought Experiment
OUR CURRENT ASSESSMENT IS THAT THE INTERMEDIATE TERM IS LIKELY TO LOOK LIKE THE FOLLOWING:
NOTE: To reiterate - "the black labeled activity shown below, between now and July, looks like a "Killing Field", where the algos take Day Traders, "Dip Buyers", the "Gamma Guys" and FOMO's all out on stretchers!"
- The S&P 500 has broken to new highs.
- However, the MATASII Proprietary Momentum Indicator (middle pane) has not yet broken the concerning Divergence pattern shown by the descending orange dotted trend line.
| |
YOUR DESKTOP / TABLET / PHONE ANNOTATED CHART
Macro Analytics Chart Above: SUBSCRIBER LINK
| |
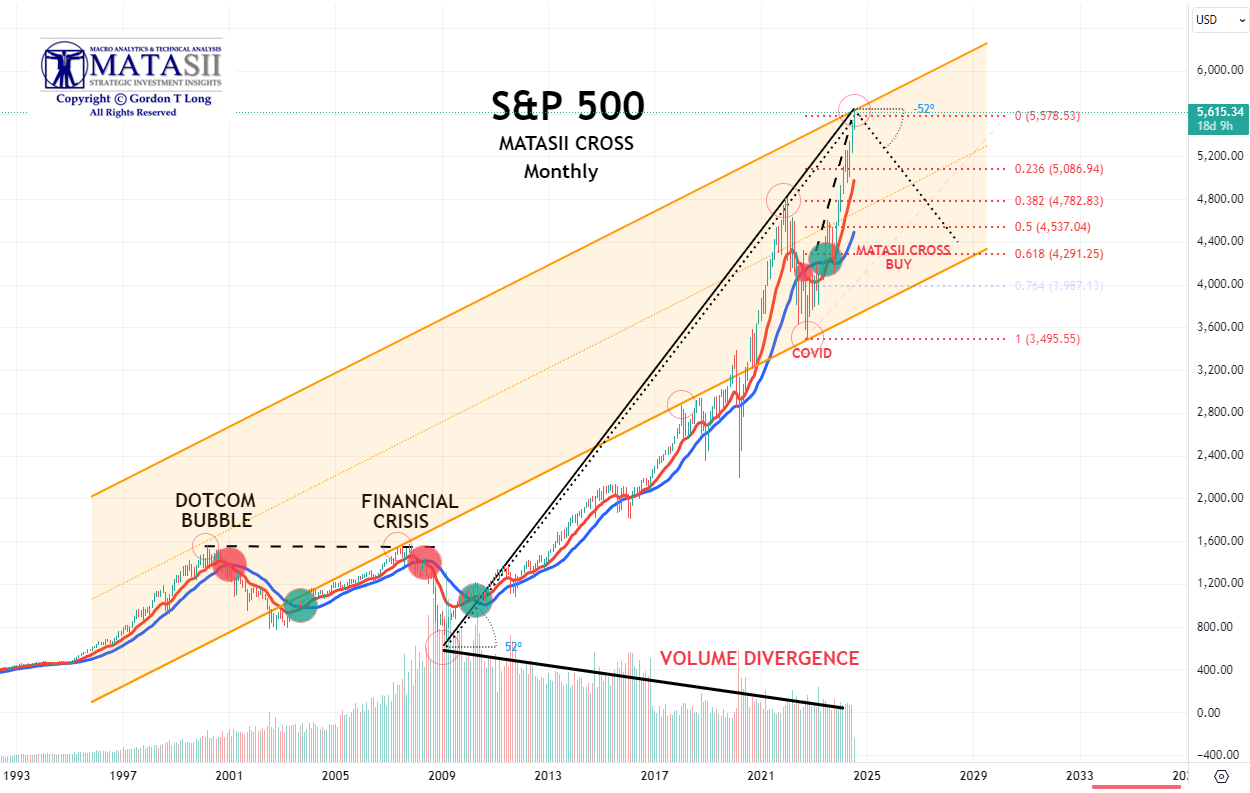
S&P 500 - Monthly - Our Thought Experiment
- We have broken our target of 5566 with a new high of ~ 5656.
|  | |
STOCK MONITOR: What We Spotted
MONDAY
- It was ultimately a rather uneventful session on Monday with the US highlight being mixed inflation expectations from the NY Fed SCE.
- Meanwhile, over the weekend, a surprise French election result initially weighed on the Euro and EGBs, and in sympathy Treasuries, but the moves gradually pared throughout the rest of the session.
- In FX, the DXY was ultimately flat and traded either side of 105.00 while the Yen initially saw strength on rising wages, but the move pared with USD/JPY briefly reclaiming 161.00.
- Gold prices unwound the post-NFP gains on the PBoC refraining from more gold buys for the second consecutive month while oil prices were sold on ceasefire hopes with Hurricane Beryl in focus as it hits Texas.
- Looking ahead, Fed Chair Powell is to testify in the Senate on Tuesday and House on Wednesday, with focus turning to US CPI on Thursday, with US 3, 10, and 30yr supply scheduled throughout the week ahead of the start of the Q2 earnings season on Friday.
INFLATION BREAKEVENS: 5yr BEI -0.5bps at 2.232%, 10yr BEI -0.7bps at 2.268%, 30yr BEI -1.1bps at 2.295%.
REAL RATES: 10Y -- 2.0489%
STOCK SPECIFIC
- Paramount Global (PARA) - Will merge with Skydance Media, ending Redstone family control.
- TSMC (TSM) - Morgan Stanley raised its target on the stock by about 9%, expecting the Co. to raise its FY sales estimate in its earnings next week.
- Corning (GLW) - Expects Q2 core sales to exceed guidance, with core EPS at the high end of the guided range.
- Tesla (TSLA) - China CPCA said Tesla exported 11,746 China-made vehicles in June (prev. 17,358 in May).
- Ford Motor (F) - Barron said Ford's shares were poised for a comeback, making it a good time to buy the stock.
- Morphic (MORF), Eli Lilly (LLY) - Eli Lilly to acquire Morphic for USD 3.2bln or USD 57/shr.
- Grifols (GRFS) - Brookfield and Grifols Family Shareholders reached an agreement to evaluate a possible joint takeover bid to acquire all the share capital of Grifols.
- Boeing (BA) - Will plead guilty to criminal conspiracy to defraud the US over the 737 Max crashes, according to Bloomberg.
- JPMorgan (JPM) - Downgraded at Wolfe as it is more exposed to NII headwinds from lower rates.
- Exxon Mobil (XOM) - Expects changes in oil prices to increase Q2 upstream earnings by USD 300-700mln vs Q1; expects changes in gas prices to decrease quarterly upstream earnings by USD 300-700mln.
TUESDAY
- US indices (SPX +0.1%, NDX +0.1%, DJIA -0.1%) were ultimately little changed on Tuesday, although the small-cap Russell 2000 (-0.5%) was the underperformer.
- Sectors were mixed with Materials and Energy the laggards, as the former was weighed on by slight losses in WTI and Brent amid progress in Cairo hostage deal talks.
- Financials was the distinct outperformed, seemingly buoyed by banks who saw notable upside amid Chair Powell testifying, saying it is a strongly held view of the Fed board that bank regulators should seek additional feedback on their efforts to hike bank capital, a move that the banking industry has been pushing for.
- Elsewhere, Powell largely stuck to the script, repeating that more good data would strengthen the Fed's confidence on inflation and that elevated inflation is not the only risk the Fed faces.
- Nonetheless, despite an initial dovish reaction to Chair Powell's text release, it soon faded and T-Notes were hit on the Chair's testimony but were off lows as Europe left while the US 3yr auction was well received.
- The Dollar eked marginal gains, albeit in very thin ranges, with the Yen the G10 underperformer and the cross back above 161 and reaching a peak of 161.51.
- Precious metals (XAU, XAG) were mildly divergent, as spot silver was flat and spot gold saw slight gains and pared some of the extensive losses seen on Monday.
INFLATION BREAKEVENS: 5yr BEI -0.3bps at 2.232%, 10yr BEI -0.3bps at 2.267%, 30yr BEI -0.7bps at 2.290%.
REAL RATES: 10Y - 1.9924%
STOCK SPECIFIC
- TSMC (TSM) - May revise its 2024 sales growth projection at its upcoming investor conference.
- Nike (NKE) - Rehired Veteran of the company Tom Peddle, to improve retail sales, Bloomberg reports.
- BP (BP) - Expects Q2 upstream production to be flat and realised refining margins to be significantly lower.
- Novo Nordisk (NVO) and Eli Lilly (LLY) - Publication of data analysis showed that Eli Lilly's Mounjaro leads to faster and greater weight loss than Novo's Wegovy.
- Indivior (INDV) - Cut Q2 and FY24 revenue guidance to reflect continued adverse market dynamics impacting the near term.
- Bank of America (BAC) - Upgraded at Piper Sandler, on NII to trough in Q2.
- Nvidia (NVDA) - KeyBanc raised PT to USD 180 from USD 130, amid upbeat commentary from the brokerage.
- Helen of Troy (HELE) - Q1 non-GAAP EPS and revenue missed, alongside lowering FY25 outlook. Sees Q2 sales down 4-7%.
- Oracle (ORCL) - Talks have broken down between the Co, and Elon Musk's xAI regarding their potential USD 10bln deal, according to the Information.
- Fifth Third Bancorp (FITB) - Faces CPFB action for illegal activities and it is to pay USD 20mln over wrongful repos and fake accounts.
WEDNESDAY
- Stocks pushed to fresh record highs again on Wednesday with outperformance in Tech leading the gains.
- Semis were buoyed by strong TSMC (TSM) sales numbers while Apple (AAPL) caught a bid on reports it is to boost its iPhone 16 shipments.
- Fed Chair Powell largely stuck to the script again on Wednesday, stressing the Fed needs more good data to be convinced that inflation is returning to target in a sustainable way, while he also repeated that risks to both sides of the mandate have come back into better balance.
- He also acknowledged the neutral rate has likely moved up a little bit.
- T-notes were little changed but with a flatter bias.
- Early trade tracked EGBs higher before paring from peaks into settlement amid Aramco issuance ahead of the 10yr auction.
- The auction was ultimately stronger than recent averages, but not quite as strong as the stellar June offering.
- Any upside in T-notes after the auction was pared as eyes turn to CPI on Thursday.
- Oil prices were bid on Middle East escalation fears and a chunky crude and gasoline stock draw on the weekly DoE inventory report, but distillates saw a notable build.
- The Dollar was flat with FX focus on the NZD, which underperformed after a dovish RBNZ while GBP outperformed after hawkish commentary from Pill and Mann, adding to the tone of a hawkish Haskel on Monday.
INFLATION BREAKEVENS: 5yr BEI +0.2bps at 2.234%, 10yr BEI +0.6bps at 2.275%, 30yr BEI +0.6bps at 2.295%.
REAL RATES: 10Y - 2.0136%
STOCK SPECIFIC
- Honeywell (HON) - Confirmed reports it has agreed to a USD 1.8bln deal for Air Products's (APD) LNG business, via WSJ citing sources
- TSMC (TSM) - Reported June sales of USD 6.42bln above expectations of 5.73bln and Q2 also beat.
- Microsoft (MSFT), Apple (AAPL) - Microsoft has given up its seat as an observer on the board of Open AI and Apple will not take up a similar position, FT reports.
- Novo Nordisk (NVO), Eli Lilly (LLY) - Only 1/4 US patients prescribed Novo Nordisk's Wegovy or Ozempic for weight loss were still taking the drug two years later, according to an analysis cited by Reuters.
- Cummins (CMI) - Increases its quarterly dividend by 8.3%.
- Chipotle (CMG) - Announced retirement of CFO Jack Hartung in 2025.
- LegalZoom (LZ) - Missed its Q2 revenue view, and cut its FY 24 revenue view well below expectations, Meanwhile, CEO Dan Wernikoff is to depart.
- Intuit (INTU) - To cut 10% of its workforce, impacting 1800 staff, via CNBC.
- Visa (V) and Mastercard (MA) - Downgraded at BofA on limited valuation upside.
- Apple (AAPL) - Aims to ship 10% more new iPhones in 2024 after a bumpy 2023, Bloomberg reports. Moreover, Apple Intelligence AI features are expected to boost iPhone demand, AAPL looks to ship 90mln iPhone 16 units in the latter half of the year.
- Marsh McLennan (MMC) - Raised its quarterly dividend 15% to USD 0.815/shr (prev. 0.710/shr)
- Healthcare names - FTC to sue Unitedhealth (UNH) Opturmx, Cigna Group's(CI) express scripts and CVS Health's (CVS) caremark over insulin prices, according to WSJ.
- Hubspot (HUBS) - Alphabet (GOOGL) is said to have shelved its interest in the Co. according to Bloomberg.
- Tesla (TSLA) - Raised prices of Model 3 in some European countries because of EU tariffs on China-made EVs
THURSDAY
- Stocks were mixed on Thursday as a cooler-than-expected CPI saw a rotation out of large-cap tech stocks into smaller-cap cyclicals with the Nasdaq plummeting but Russell surging.
- The SPX and NDX were consistently pushing record highs before today, and futures extended those levels after the cooler-than-expected CPI report.
- However, those gains were short-lived, perhaps with positioning over-extended after the recent rally.
- The Russell held onto its gains though given its recent underperformance and the index still has a few hundred points before testing the November 2021 record highs of 2,460.
- Looking at the spread between the R2K and NDX, it is currently just shy of 600bps, Goldman Sachs noted it is the largest 1-day spread since November 2020, and it's the second largest day of R2K>NDX performance in 20+ years.
- Meanwhile, the equal-weighted S&P also rallied while sectors were very mixed, with Tech, Communication, and Discretionary lagging, while Real Estate, Utilities, and Materials outperformed.
- The inflation data saw all headline and core M/M and Y/Y components beneath forecasts, which sparked a rally across Treasuries with the curve bull steepening as traders raised their Fed rate cut bets.
- Money markets are now fully pricing a 25bp rate cut in September, and 60bps of easing by year-end, which implies a 100% probability of two rate cuts this year, and a 40% probability of a third.
- The Dollar also took a nose dive to the dovish data with DXY testing 104.00 at the lows from a peak of 104.99.
- The Yen was the clear outperformer following the data, but a quick move 10 minutes after CPI sparked some fresh Yentervention speculation, with reports in TV Asahi and Mainichi later on suggesting Japan did intervene, but officials were reluctant to admit it.
- Elsewhere, DAL and PEP guidance disappointed with focus turning to the big banks on Friday as the Q2 earnings season gets underway.
INFLATION BREAKEVENS: 5yr BEI -5.1bps at 2.190%, 10yr BEI -3.2bps at 2.251%, 30yr BEI -1.9bps at 2.280%.
REAL RATES: 10Y - 1.9254%
STOCK SPECIFIC
- Delta Airlines (DAL) - Missed on Q2 revenue and gave poor EPS guidance as well as a dim Q3 outlook.
- Pepsico (PEP) - Missed on Q2 top line and its FY Core EPS view came under expectations, though did beat on Q2 Core EPS.
- Costco (COST)- Will increase its annual membership fees by USD 5 and executive membership by USD 10. Co. also declared a quarterly cash dividend on its common stock of USD 1.16/shr.
- Conagra Brands (CAG) - Missed on Q4 revenue, and FY 25 EPS view.
- GLP-1 Names (Eli-Lilly (LLY), Novo Nordisk (NVO), Viking Therapeutics (VKTX)) - Pfizer (PFE) advances the development of a once-daily formulation of oral GLP-1 receptor against Danuglipron; ongoing study shows favourable pharmacokinetic profile for Danuglipron.
- MicroStrategy (MSTR) - Announced a 10-for-1 stock split.
- Apple (AAPL) - Settled EU antitrust probe over Tap-and-Pay tech, Co. avoided EU fine.
- Envestnet (ENV) - Confirmed that Bain Capital and Reverence offered USD 4.5bln to take the co. private, equating to USD 63.15/shr, in fitting with earlier Bloomberg sources.
- Alcoa (AA) - Reported a preliminary Q2 beat on revenue and adjusted income.
- Chevron (CVX) and Hess (HES) - Decision reportedly delayed by FTC to after Exxon (XOM) arbitration, according to Bloomberg. Expects the FTC's merger review process to be completed in Q3.
- Tesla (TSLA) - Plans to delay its robotaxi unveiling to October from August, according to Bloomberg, TSLA wants more prototypes before the event.
- Boeing (BA) - Nears deal to sell 20-30 777X jets to Korean Air (003490 KS), according to Reuters sources.
- Nike (NKE) - Moves senior executive to CEO advisor role; Thomas Clarke to advise CEO John Donahoe; John Joke to replace Tom Clarke as innovation head.
- Bunge's (BG) - USD 8bln deal for Viterra said to face risk of delays, according to Bloomberg. Bunge waits for approval from EU, China, and Canada and the acquisition is unlikely to be completed within Bunge's mid-2024 goal.
FRIDAY
- US indices (SPX +0.6%, NDX +0.6%, DJIA +0.6%) ended the day firmer, with outperformance in the small-cap Russell 2000 (+1.1%) which closed out the week with strong gains, although the SPX and NDX saw weakness into the close to settle off best levels.
- In the wake of the US PPI report, which was hot overall, there was a broad-based hawkish reaction, although this swiftly pared as participants digested the details of the report.
- Highlighting this, analysts at Bank of America stated that overall, the components of the PPI report that affect the PCE report, were softer.
- As such, so far analyst forecasts for Core PCE M/M are ranging between 0.15-0.20%.
- Elsewhere on the data footing, prelim UoM for July was weak with headline sentiment falling to the lowest level since November 2023, in addition to both conditions and expectations short of consensus, while both the 1yr and 5yr ahead dipped to 2.9% from 3.0%.
- The Dollar was eventually weaker, despite strength on the aforementioned PPI report, and printed a low of 104.04, keeping its head above the round 104.
- Yen was one of the G10 performers with possible intervention once again touted as USD/JPY hit a low of 157.39 against a peak of 159.44.
- The crude complex ended the day with marginal losses as they saw the first week of losses in four, and T-Notes were sold on hot PPI but pared as PCE components were soft.
- For the record, US earnings season begun on Friday with highlights from:
- JPMorgan (JPM) (-1.2%), who are a little bit more cautious on IB outlook,
- Wells Fargo (WFC) (-6%) NII and NIM coming in light, and
- Citi (C) (-1.8%) missing on IB and FICC sales and trading revenue.
- Looking ahead, participants await Fed Chair Powell at the Economic Club of Washington DC (Mon), Retail Sales (Tues), Waller (Wed), Williams (Fri), and a slew of earnings (all week).
INFLATION BREAKEVENS: 5yr BEI -2.6bps at 2.159%, 10yr BEI -1.4bps at 2.236%, 30yr BEI -0.6bps at 2.273%.
REAL RATES: 10Y - 2.0136%
STOCK SPECIFIC
- JPMorgan (JPM) - Beat on EPS, revenue, and NII with other metrics beating market expectations. In post-earnings commentary, CFO said he is a little more cautious about debt capital markets and IB outlook.
- Wells Fargo (WFC) - NII and NIM disappointed forecasts, with FY NII guidance marginally lower than expected. CFO expects FY NII decline to be in the upper half of the forecast range. CFO said revenue-related expenses drove costs higher and an growth 'weaker than we thought'
- Citigroup (C) - Beat on EPS and revenue, although missed on Investment Banking and FICC sales & trading revenue. Said over the medium term the bank expects net interest income growth; remain confident that the bank will meet medium term ROTCE target
- Bank of New York Mellon Corp (BK) - Surpassed top and bottom line expectations.
- AT&T (T) - Disclosed a massive hack of call data for most mobile users; does not believe the hack is reasonably likely to materially impact the Co's financial condition or results of operations.
- Fastenal (FAST) - EPS was in line with expectations, beat on revenue, and saw 'growth with larger customers' in Q2.
- Tesla (TSLA) - Downgraded at Citi, noting it's increasingly difficult to justify the valuation. Furthermore, Unveiled its Model 3 Long-Range RWD (rear-wheel-drive) in the US, priced at USD 42k.
- Teck Resources (TECK) - Rio Tinto (RIO) is said to have held talks with bankers to 'wargame' a potential USD 32bln offer for the Co., via Sky News.
- Arbor Realty (ABR) - Reportedly probed by DoJ over lending practices and loan book, according to Bloomberg.
- Vertiv Holdings (VRT) - Hedgeye names the Co. a new best short idea with 33% downside.
| |
CONTROL PACKAGE
There are FIVE charts we have outlined in prior chart packages that we will continue to watch closely as a CURRENT "control set":
- The 10Y TREASURY NOTE YIELD - TNX - HOURLY (CHART LINK)
- The 10Y TREASURY NOTE YIELD - TNX - DAILY (CHART LINK)
- The 10Y TREASURY NOTE YIELD - TNX - WEEKLY (CHART LINK)
- The 30Y TREASURY BOND YIELD - TNX - WEEKLY (CHART LINK)
- REAL RATES (CHART LINK)
FISHER'S EQUATION = 10Y Yield = 10Y INFLATION BE% + REAL % = 2.236% + 1.965% = 4.201%
3YR AUCTION:
The US sold USD 58bln of 3yr notes at a high yield of 4.399%, stopping through the 4.407% WI by 0.8bps, an improvement on the prior tail of 1.1bps and the six auction average of a stop through of 0.1bps. The Bid-to-Cover was also strong at 2.67x, vs. the prior 2.43x and above the six auction average of 2.57x. The strong demand was led by an increase in direct demand to 21.3% from 15.9% (above the 17.8% average), while indirect was relatively unchanged at c. 64%, a touch beneath averages. The strong direct demand and relatively unchanged indirect demand saw dealers take home a smaller chunk than average at 14.8%, well beneath the prior 20%.
10YR AUCTION:
Overall the 10yr auction was a strong one vs averages, but not quite as strong as the stellar auction seen in June. The USD 39bln supply of 10yr notes was sold with a high yield of 4.276%, stopping through the When Issued by 1bp, not quite as strong as the 2bp stop through previously, but better than the average tail of 0.4bps. The Bid-to-Cover slipped to 2.58x from 2.67x, but remained above the 2.52x average. Indirect bidders took a step back, taking 67.6% of the auction, down from the 74.6% in June but in line with the six auction average. Although Indirect demand was not as strong, the direct bidders took an above-average 20.86%, rising from the prior 13.8%. Dealers were left with a similar chunk of the supply, taking 11.6% again, beneath the 16% average.
30Y AUCTION
The 30yr bond auction was soft, seeing the USD 22bln offering sold at a high yield of 4.405%, tailing the When Issued by 2.2bps, the largest tail since November. The Bid-to-Cover was also soft at 2.3x, beneath the 2.49x prior and 2.42x average. The breakdown also was not great, with a decline in indirect demand to 60.76% from 68.5%, falling beneath the 67.6% average. There was a slight uptake in direct demand however above averages, but it still left dealers with an above average 15.88%.
| |
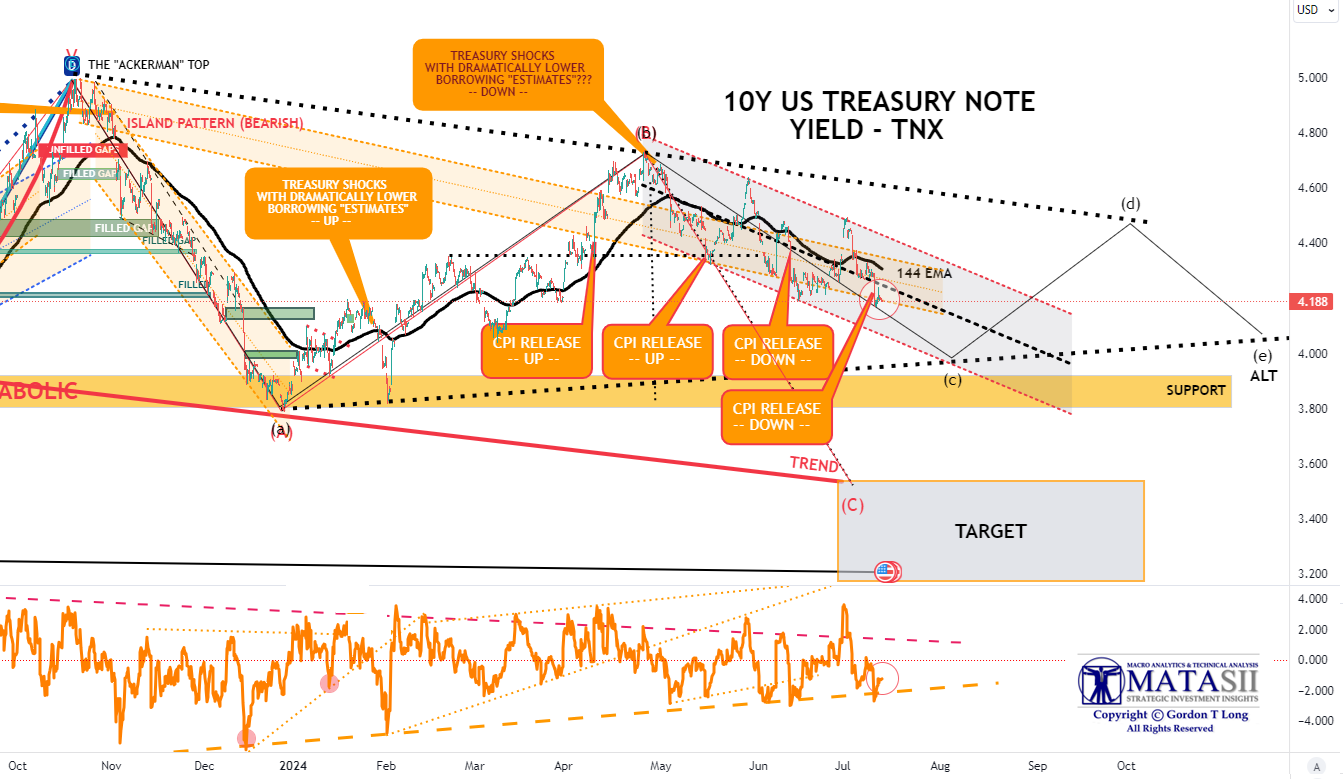
10Y UST - TNX - Hourly
- The TNX Feel strongly this week falling below its144 EMA and finding initial support at a smaller trending lower trend channel.
- Importantly in the near term is that Momentum (lower pane) appears to have reached a longer term resistance level.
- We have labeled an Alternative ALT ABCDE count.
| |
YOUR DESKTOP / TABLET / PHONE ANNOTATED CHART
Macro Analytics Chart Above: SUBSCRIBER LINK
| |
NOTICE Information on these pages contains forward-looking statements that involve risks and uncertainties. Markets and instruments profiled on this page are for informational purposes only and should not in any way come across as a recommendation to buy or sell in these assets. You should do your own thorough research before making any investment decisions. MATASII.com does not in any way guarantee that this information is free from mistakes, errors, or material misstatements. It also does not guarantee that this information is of a timely nature. Investing in Open Markets involves a great deal of risk, including the loss of all or a portion of your investment, as well as emotional distress. All risks, losses and costs associated with investing, including total loss of principal, are your responsibility.
FAIR USE NOTICE This site contains copyrighted material the use of which has not always been specifically authorized by the copyright owner. We are making such material available in our efforts to advance understanding of environmental, political, human rights, economic, democracy, scientific, and social justice issues, etc. We believe this constitutes a ‘fair use’ of any such copyrighted material as provided for in section 107 of the US Copyright Law. In accordance with Title 17 U.S.C. Section 107, the material on this site is distributed without profit to those who have expressed a prior interest in receiving the included information for research and educational purposes. If you wish to use copyrighted material from this site for purposes of your own that go beyond ‘fair use’, you must obtain permission from the copyright owner.
========
| |
MATASII'S STRATEGIC INVESTMENT INSIGHTS | |
2020 VIDEOS OUTLINING THE COMING RISE IN INFLATION, STAGLFLATION & COMMODITY PRICES | |
|
THE REGULATORY STATE
RELEASED - 01-17-24 --- 212 Page Paper
FULL 212 PAGE PDF DOWNLOAD
| |
IDENTIFICATION OF HIGH PROBABILITY TARGET ZONES | |
Learn the HPTZ Methodology!
Identify areas of High Probability for market movements
Set up your charts with accurate Market Road Maps
Available at Amazon.com
| |
The Most Insightful Macro Analytics On The Web | | | | |