|
LONGWave - JUNE 2024
Technical Analysis - 06/24/24
| |
STAGFLATION STEADILY SHOWING
OBSERVATIONS: "THERE IS TOO MUCH MONTH LEFT AT THE END OF THE MONEY!"
I am witnessing young Americans increasingly dissatisfied! For them, like the elderly, the recent surge in prices for goods and services of everything has been devastating.
.
The young are living in a new America where necessities like food and rent have increased in price by more than 20%, while wage growth hasn’t kept up. To try to make ends meet, many have responded by picking up a second or even a third job, which is why a record number of Americans have more than one job. About 1 in 7 Generation Zs have maxed out their credit amid skyrocketing prices and sagging real wages.
What this means is their optimism and dreams are being crushed!
Young adults have been hit particularly hard because they’re less likely to have assets such as housing and stocks that would appreciate rapidly in this time of high inflation. Younger workers also tend to have jobs whose salaries adjust more slowly to inflation. They are therefore unable to save for their future dreams. Most young Americans aren’t saving at all and have stopped trying, adopting the YOLO (You Only Live Once) approach.
They are resigned to going into permanent debt.
Until the next paycheck comes, many Gen Zees are relying on credit cards to get by. As more of them max out their credit cards, however, there’s nowhere left to turn. In just four years, the American standard of living for young people has gone from being enjoyed to endured.
The situation is little better for millennials: 1 in 8 of that generation have maxed out their credit as well. Americans in both generations are abandoning hope of ever achieving long-term goals such as retirement or owning a home—anything that requires saving.
The average American’s hourly wage has risen $4.98 in the last 3 years, but what that larger hourly wage can purchase has dropped by 67 cents. The hourly loss from inflation is a whopping $5.65, which is more than the average worker loses per hour to federal income tax.
Even if a young family today does squirrel away the money for a down payment on a house, it’s impossible for most of them to afford the monthly payment. For just a median-price home, that payment has more than doubled in the last 3 years to about $2,100 per month.
That means it now costs over $13,000 more per year for the same house. If young Americans have to put groceries on a credit card, chances are they don’t have thousands of dollars lying around for a down payment on a house. ===>
| |
 | |
THIS WEEK WE SAW
Exp=Expectations, Rev=Revision, Prev=Previous
US
US NY Fed Manufacturing (Jun) -6.0 vs. Exp. -9.0 (Prev. -15.6)
US Retail Sales MM (May) 0.1% vs. Exp. 0.3% (Prev. 0.0%, Rev. -0.2%)
US Industrial Production MM (May) 0.9% vs. Exp. 0.3% (Prev. 0.0%)
US Philly Fed Business Index (Jun) 1.3 vs. Exp. 5.0 (Prev. 4.5)
US Philly Fed Prices Paid (Jun) 22.5 (Prev. 18.7)
US Initial Jobless Claims w/e 238.0k vs. Exp. 235.0k (Prev. 242.0k, Rev. 243k)
US Continued Jobless Claims w/e 1.828M vs. Exp. 1.805M (Prev. 1.82M, Rev. 1.813M)
US Building Permits: Number (May) 1.386M vs. Exp. 1.45M (Prev. 1.44M)
US Housing Starts Number (May) 1.277M vs. Exp. 1.37M (Prev. 1.36M, Rev. 1.352M)
===> Likewise, many Gen Zees and plenty of millennials have stopped saving for retirement since things like 401(k) contributions don’t make much sense when you can’t make your car payment. And it’s no coincidence that auto-loan defaults for young Americans are rising at the fastest rate since the global financial crisis of 2007-2009.
They are completely tapped out.
Financially crushed Gen Zees, hit by this one-two punch, need to understand what is to blame for their troubles: the big-government agenda defined by multitrillion-dollar federal budgets and a burdensome regulatory state. If the leviathan isn’t turned back, younger generations will become a reflection of their government—perpetually in debt.
| |
========================= | |
|
WHAT YOU NEED TO KNOW!
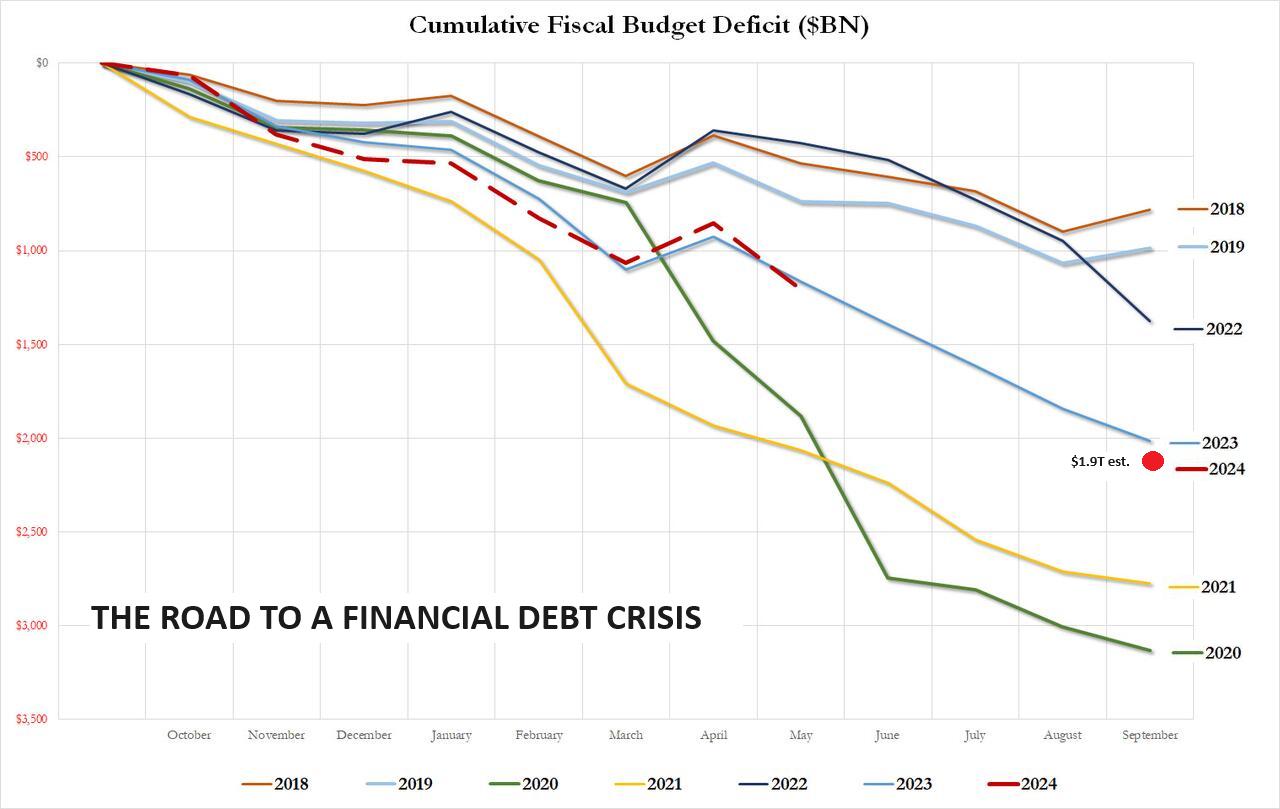
THE ROAD TO A FINANCIAL DEBT CRISIS
The US Fiscal Deficit is now estimated by the CBO to be $1.9T for 2024 (Fiscal Year ending September 2024).
Chronic spending, more than you make year after year, can lead to only one result when the interest on the debt at 6-8% of GDP crowds out both discretionary and mandatory budget items.
US spending has truly reached the point of being "out-of-control". The fact that neither Congress nor the Administration cares or has a solution may be even more of a concern?
RESEARCH
MID YEAR UPDATES TO LAST YEAR'S ANNUAL THESIS PAPER
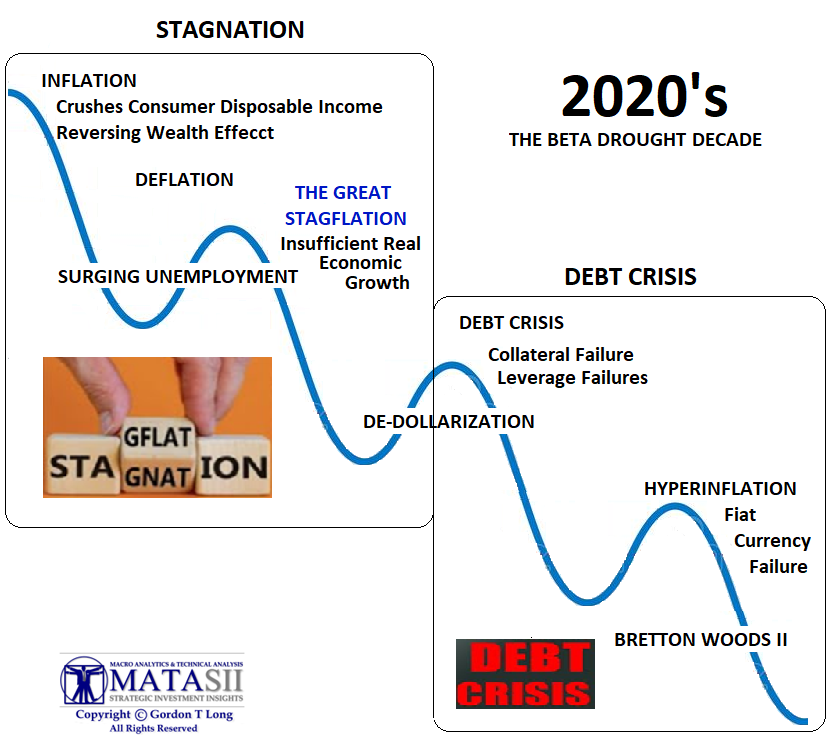
THE GREAT STAGFLATION
RELEASED - 01-15-23 --- 88 Page Paper
THE 2% INFLATION TAX - Soon to be 3%
- To understand modern inflation is to first under the Fiat Currency it is measured against. That is because inflation is the lost purchasing power of that currency.
- A Fiat Currency is inherently inflationary, gradually losing its purchasing power over time.
- This phenomenon disproportionately benefits a select few at the expense of the broader population.
- Fiat Currencies have a crucial vulnerability which lies in its dependence on the demand for the currency. Essentially, it reflects users' desire to hold the currency, influenced by a multitude of factors.
THE 2% INFLATION IS A HIDDEN GOVERNMENT TAX.
- It is collected through Reduced Purchasing Power and the Time Value of Money Usage (i.e. the government spends it first at a higher Purchasing Power before Users finally spending it through Velocity of Money at lower levels of Purchasing Power).
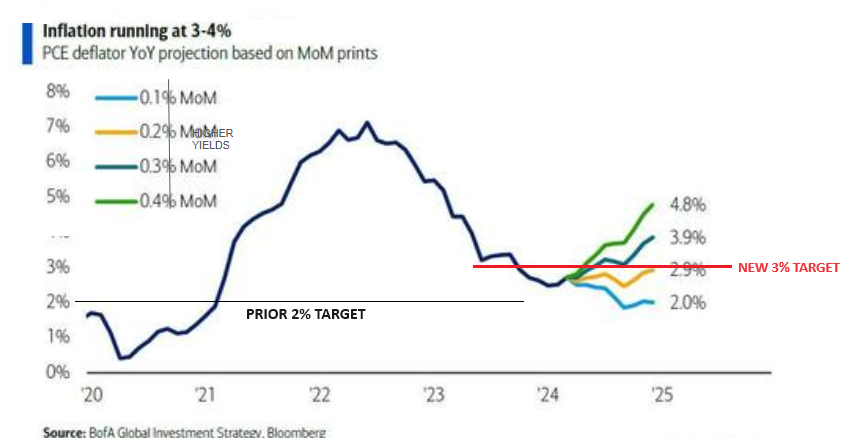
THE 3% INFLATION TARGET
- Expect central banks to soon be increasingly talking about 3% Inflation as the New "Neutral Rate".
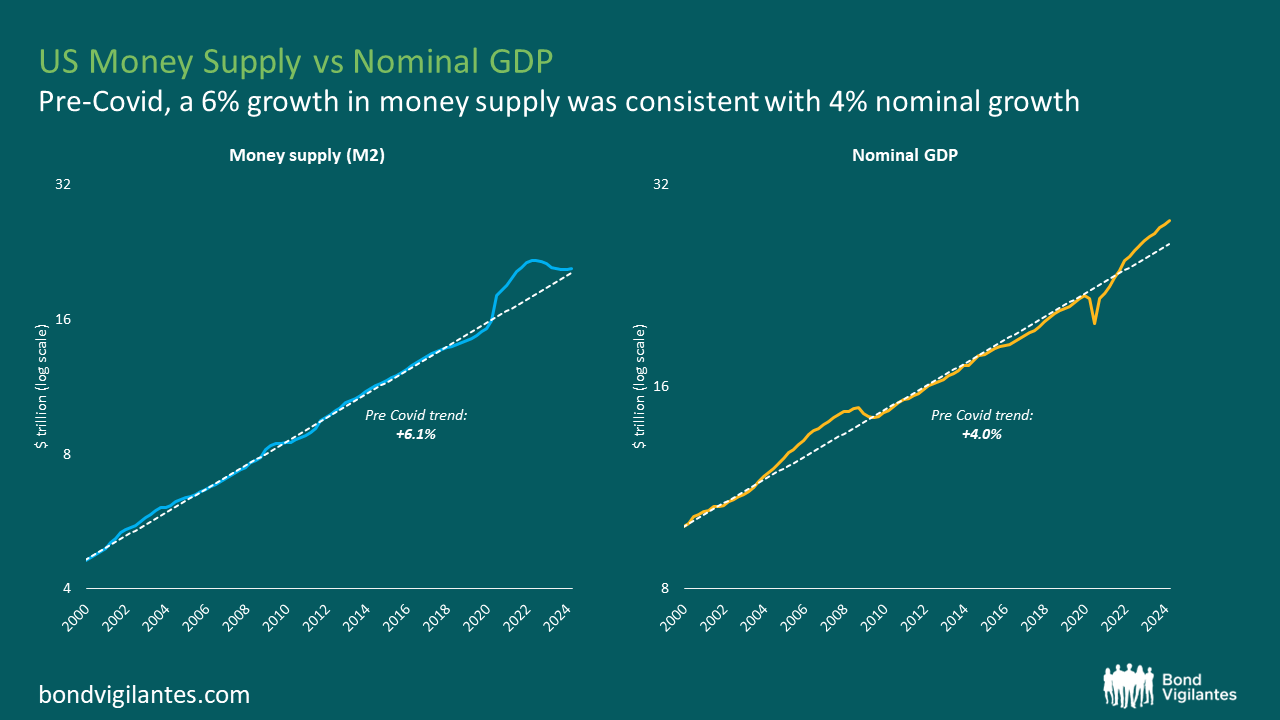
- The reason for this is because the US Central Bank normally pursues a 6 percent annual growth in money supply to achieve 4 percent growth in nominal GDP. It is likely now to be composed on average of 1 percent of real growth and 3 percent of inflation (called Stagflation).
TIME VALUE OF MONEY v TIME VALUE OF MONEY USAGE
- The first user of the money (the government) has a higher purchasing power than the downstream users (you and I) as part of the flow and Velocity of Money.
- Increases in money supply set in motion an exchange of nothing for something. This diverts real savings from wealth generators to non-wealth generators. Consequently, this weakens the wealth-generation process and in turn the pace of economic activity.
- When money enters goods markets, it means that we have more money per good. This means that the price of goods has risen.
- What we have here is the increase in goods prices and a weakening in economic growth. This is what stagflation is all about.
- The outcome of the monetary pumping is always stagflation.
- It is not always visible, though. As the pool of real savings comes under pressure, the phenomenon of stagflation becomes more visible.
THE CONSEQUENCES WILL BE STAGFLATION
- Stagflation is the ultimate result of monetary pumping. Therefore, whenever the central bank adopts an easy monetary stance, it also sets stagflation in motion in the months ahead.
- The severity of stagflation depends on the state of the pool of real savings.
- If this pool is declining, then a visible decline in economic activity will likely ensue.
- On account of past monetary pumping and the consequent increase in price inflation, we will have a visible stagflation. Conversely, if the pool of real savings is still growing, economic activity is likely to follow suit.
- Given the rising momentum of prices, we will have positive correlation between economic activity and price inflation.
- We can conclude that if, on account of past monetary pumping, we do not observe the symptoms of stagflation, this raises the likelihood that the pool of real savings is still growing. Conversely, if we can observe the symptoms of stagflation, then most likely the pool of real savings is declining.
- As the pool of real savings comes under pressure, the phenomenon of stagflation becomes more visible.
| |
|
DEVELOPMENTS TO WATCH
LIQUIDATION BEGINS - THE FIRST OUT WINS!
1- THE US COMMERCIAL OFFICE SPACE FIRESALE BEGINS
- Related Banks/CIBC and Blackstone CRE sales shows US banks have begun selling their best assets, because they can receive prices at least equal to what they are carrying in loans on their balance sheets. There is no other reason to sell good loans but to generate liquidity.
2- JAPANESE US TREASURY FIRESALE LOOMS
-
Japan's 5th largest bank, Norinchukin Bank has announced it will sell more than $63 billion of its holdings of U.S. and European government bonds during the year ending March 2025, as it aims to stem its losses from bets on low-yield foreign bonds, a main cause of its deteriorating balance sheet, and to lower the risks associated with holding foreign government bonds.
- Once Nochu begins selling, others are highly likely to join the club! Assuming comparable liquidation, this could potentially amount to (5X) $315B in US and EU sovereign bonds. This is the long relied upon Carry Trade in reverse!
TOGETHER THE ABOVE IS GOING TO POTENTIALLY PLACE UPWARD PRESSURE ON US TREASURY RATES.
THERE IS A POTENTIAL FOR A VICIOUS DEATH SPIRAL TO DEVELOP?
| |
|
GLOBAL ECONOMIC REPORTING
POWELL ADMITS THE BIDEN ADMIN IS "OVERSTATING JOBS"
"THERE IS AN ARGUMENT THAT PAYROLLS MAY BE A BIT OVERSTATED" - Jerome Powell
RETAIL SALES
- The headline M/M rose just 0.1%, up from the prior -0.2% (initially 0.0%) read, but beneath the 0.3% forecast, matching the most pessimistic estimates too.
- The core measure (ex-autos & parts) declined by 0.1%, despite expectations for a 0.2% gain, matching the pace of last month's decline (initially 0.2%).
INDUSTRIAL PRODUCTION / CAPACITY UTILIZATION
- The Institute for Supply Management’s latest measure of factory activity shrank in May at a faster pace, as a gauge of output came close to stagnating.
| |
|
In this week's "Current Market Perspectives", we focus on the signals that sentiment, fundamentals and various markets (Credit, Bond and Equity) are currently giving us.
=========
| |
|
The Fed's immediate task is straightforward - cut the funds rate or at least signal cuts WHEN economic data indicate it's necessary. However, the longer-term impact of this action is complex.
- The resulting surge in liquidity will boost the economy and prices, leading to a larger deficit.
- Renewed TCJA tax cuts and increased spending will further contribute to inflation, regardless of the election outcome.
- If Trump wins, his plan to raise tariffs to 10% will add to domestic price increases, effectively taxing US consumers.
These factors point to significant inflationary pressures in 2025, with the Fed having less capacity to counteract these forces than it has had in the past 40 years.
| |
1- THE 2% INFLATION TAX - Soon to be 3%
A FIAT CURRENCY
To understand modern inflation is to first under the Fiat Currency it is measured against. That is because inflation is the lost purchasing power of that currency.
A Fiat Currency is inherently inflationary, gradually losing its purchasing power over time.
This phenomenon disproportionately benefits a select few at the expense of the broader population.
- Fiat Currencies cause economic instability by perpetuating cycles of boom and bust that disrupt market equilibria and create societal inequalities.
- Fiat Currencies drive excessive indebtedness within economies and fuel the unchecked expansion of the state, often at the expense of citizens’ and companies’ freedoms.
- Fiat Currency is dishonest money, and engaging with fiat money, daily erodes the morals and values of the people involved in its circulation.
- Fiat Currencies foster “collective corruption,” wherein many people become proverbially ensnared by the structures that fiat currencies establish. This fosters dependency and entrenches its influence.
- Fiat Currencies act as catalysts for the expansion of the state, making it bigger and more powerful. Companies receive new orders from the state, prompting adjustments in production and employment to meet artificial demand.
- Users of Fiat Currencies keep their life savings in fiat money.
- Users invest, directly or indirectly, in government bonds and bank debentures and maintain time and savings deposits.
- Gradually the users become profoundly reliant on the perpetuation of the fiat money system, consenting to nearly any measure proposed by the state (and the special interest groups taking advantage of it) to keep the fiat money system going.
THE ACHILLES HEEL
-
Fiat Currencies have a crucial vulnerability which lies in its dependence on the demand for the currency. Essentially, it reflects users' desire to hold the currency, influenced by a multitude of factors.
- Users tend to maintain money balances relative to their income.
- As income rises, so does the desire to hold money.
- The demand for money typically diminishes when interest rates rise.
- This is because holding onto money entails opportunity costs when higher returns could be earned through, say, bank deposits and bonds.
- History demonstrates that the demand for money remains relatively steady when there is a high level of trust in the currency, meaning people are not worried that the purchasing power of their money will decline or be destroyed.
-
States and their central banks seek to handle the Fiat currency system in their favor. Their primary strategy involves creating illusions and deceiving the populace to maintain control and influence.
| |
A 2% INFLATION TARGET
Fiat Currency users are often sold the narrative that inflation of 2 percent equates to “stable money”—a claim that is, of course, inherently false. In reality, a 2 percent inflation rate destroys the purchasing power of money by 2 percent every year.
The reason for this is because the US Central Bank normally pursues a 6 percent annual growth in money supply to achieve 4 percent growth in nominal GDP, composed on average of 2 percent of real growth and 2 percent of inflation.
THE 2% INFLATION IS A HIDDEN GOVERNMENT TAX
It is collected through Reduced Purchasing Power and the Time Value of Money Usage (i.e. the government spends it first at a higher Purchasing Power before Users finally spending it through Velocity of Money at lower levels of Purchasing Power.
|  | |
INFLATION MEASUREMENT FLAWS
1- STATISTICAL GAMES - CPI is a Measure of Inflation. It Isn't Inflation. Lost Purchasing Power is Inflation.
Statistical goods price indices are often cobbled together to present a lower inflation rate than experienced in the market. This manipulation serves to downplay the true extent of monetary debasement. (Example: Hedonics, Imputation, Substitution, Basket Modification et. al.)
2- DEFLECTION
Central bank officials and mainstream economists frequently attribute inflation to various external factors, such as alleged price gouging by greedy businesses or supply disruptions by oil-producing nations, while vehemently rejecting the notion that inflation is a monetary phenomenon resulting from the central banks’ fiat money printing. In fact, central banks are determined to avert a permanent drop in the demand for money at all costs. When the demand for money falls, people tend to exchange their money for alternative assets, such as stocks, real estate, precious metals, etc.
Consequently, the prices of these goods surge—further exacerbating the decline in the demand for money. In extreme scenarios, this can trigger a widespread flight from money, predicting a collapse of the financial and economic system.
To maintain the fiat money system, central banks meticulously adjust the level of inflation to firstly ensure a gradual and ongoing erosion of the value of money, subtle enough to either go unnoticed or be reluctantly accepted.
3- CONTROLLED INFLATIONARY PRESSURES
Controlled inflationary pressures act as a defense against episodes of goods price deflation, which have the potential to make the fiat money system come crashing down. Central banks aim to prevent situations where inflation spirals out of control, where hyperinflation destroys people’s demand of fiat money entirely.
AN INEVITABLE TIPPING POINT
The primary concern is the enormous accumulation of debt within the fiat money system, eventually reaching a tipping point of unsustainability.
At that juncture, people will be confronted with the question: Should the fiat money system collapse under the weight of deflationary pressures, or should the outstanding debt be financed by creating new money? Unfortunately, history suggests that in a time of “existential crises", people consider expanding the money supply as the lesser of two evils.
Once initiated, a deliberate inflation policy becomes incredibly challenging to contain, let alone reverse. It has the propensity to spiral out of control, potentially culminating in high inflation or even hyperinflation, thereby precipitating a collapse in the demand for money and eroding the very foundations of the fiat money system.
However, in such a dire scenario, one must reckon with the state’s determination to avert the demise of its fiat money regime at all costs. The state, (as we know it today), can be expected to exhaust all available measures to safeguard the continuity of its monetary system.
| |
In response to a crisis, the state can be expected to resort to drastic measures,
such as:
- Imposing price and capital controls,
- Nationalizing banks and large corporations, and
- Transforming the economy into a highly regulated command economy.
THE 3% INFLATION TARGET
Expect central banks to soon be increasingly talking about 3% Inflation as the New "Neutral Rate".
The reason for this is because, as we showed earlier, the US Central Bank normally pursues a 6 percent annual growth in money supply to achieve 4 percent growth in nominal GDP. It is likely now to be composed on average of 1 percent of real growth and 3 percent of inflation (called Stagflation - more on that below).
| |
Under such circumstances, the state assumes unprecedented control over production, dictating what goods will be produced, how much, when and by whom, even regulating who will be allowed to consume how much and when. In other words, the economies end in a form of fascism. A bleak outcome indeed!
FIAT CURRENCY DEMAND MUST BE REDUCED
To mitigate the damage caused by the fiat money system, or even dismantle it altogether, the first step must be to target its Achilles’ heel, weakening the demand for fiat money. The less fiat money people demand, the smaller the damage inflicted by the fiat money system will be.
- First and foremost, it can be accomplished by educating the populace about all the significant harm perpetuated by the continued existence of fiat money and the consequences it has.
- This entails, as a first step, highlighting the adverse impacts it has on individuals and their communities, and encouraging people to use fiat money for transactions rather than for savings.
- This can be through discouraging investments in government bonds or time or savings deposits in banks, while encouraging investments in tangible assets such as stocks, precious metals, land and property.
- Further actions can include ceasing the support for governments or politicians who endorse the fiat money system and fail to take actions to dismantle it.
- Ultimately, of course, it is crucial to inform people that sound money is indeed possible. This involves advocating for people’s freedom to choose their preferred money, whether it be gold, silver, bitcoin, or any other alternative.
By allowing individuals the autonomy to select their preferred currency, we effectively target the Achilles’ heel of the fiat money system, ultimately benefiting the vast majority of people.
| |
2- TIME VALUE OF MONEY v TIME VALUE OF MONEY USAGE
EVOLUTION OF THE FIAT CURRENCY SYSTEM
Banks played a central role in the creation and adoption of the shift from Sound Money (backed by Gold) to Fiat Currencies.
Bank mentality at the time of adoption of Fiat Currencies was focused on the Time Value of Money. The "Float" was a critical element of banking and the importance of the time value of the money within the float.
It was a logical step to adopt the sister of this or the Time Value of the Usage of Money for Government financing.
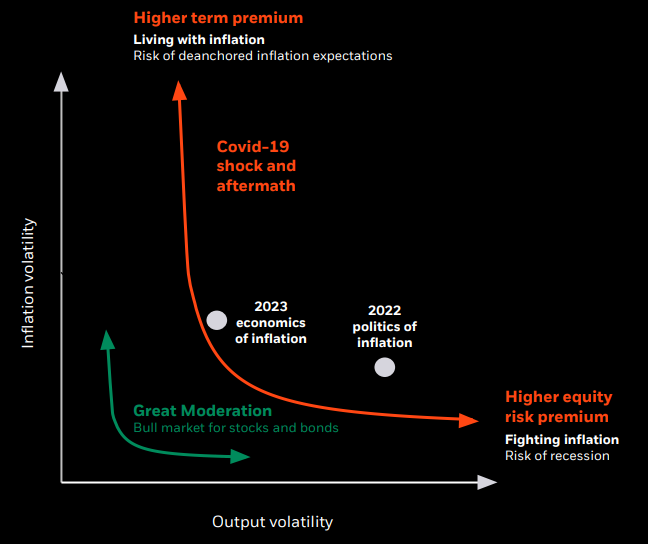
The first user of the money (the government) has a higher purchasing power than the downstream users (you and I) as part of the flow and Velocity of Money.
This also results in higher term premiums and equity risk premiums (chart above).
Fundamentally, increases in money supply set in motion an exchange of nothing for something. This diverts real savings from wealth generators to non-wealth generators. Consequently, this weakens the wealth-generation process and in turn the pace of economic activity. Now, when money enters goods markets, it means that we have more money per good, that is the price of goods has risen.
Hence, what we have here is the increase in goods prices and a weakening in economic growth. This is what stagflation is all about. The outcome of the monetary pumping is always stagflation. It is not always visible, though. As the pool of real savings comes under pressure, the phenomenon of stagflation becomes more visible.
| |
|
3- THE CONSEQUENCES WILL BE STAGFLATION
THE INFLATION PROCESS
- Starting from a situation of equality between the current and the expected rate of inflation, the central bank decides to boost the rate of economic growth by raising the growth rate of money supply. As a result, a greater supply of money enters the economy and each individual now has more money at his disposal.
- Because of this increase, every individual believes he has become wealthier. This raises the demand for goods and services, which in turn sets in motion an increase in the production of goods and services.
- All this, in turn, increases producers’ demand for workers, and subsequently, the unemployment rate falls below the equilibrium rate (the natural rate).
- Once the unemployment rate falls below the equilibrium rate, this starts to exert an upward pressure on price inflation.
- Consequently, individuals come to realize that monetary policy has loosened. People begin to understand that their previous increase in money purchasing power is dwindling, so they form higher inflation expectations.
- All this diminishes the overall demand for goods and services. A dwindling in overall demand slows down production of goods and services, which, in turn, pushes the unemployment rate higher.
- At this point, we are where we were prior to the central bank’s decision to loosen its monetary stance, but with a much higher rate of inflation.
ONLY A PRECURSOR TO HIGHER INFLATION AND STAGFLATION
- At this point, we have a decline in the production of goods and services, rising unemployment and an increase in price inflation, or stagflation.
- From this, if the increase in the money supply growth rate is unexpected, the central bank can engineer an increase in economic growth.
- However, once individuals learn about the increase in the money supply and assess the implications of this increase, they adjust their conduct accordingly. Consequently, the boost to the economy from the increase in the money supply growth rate disappears.
- In order to overcome this hurdle and strengthen the rate of economic growth, the central bank would have to surprise individuals through a much higher rate of monetary pumping.
- However, after some time, people will learn about this increase and adjust their conduct accordingly.
- Consequently, the effect of the higher growth rate of money supply on the economy is likely to vanish again, and all that is going to remain is a much higher inflation rate.
Loose monetary policies of the central bank can only temporarily generate economic growth. Over time, however, such policies will cause higher price inflation. Hence there is no long-term trade-off between inflation and unemployment.
INCREASES IN MONEY SUPPLY ALWAYS UNDERMINES ECONOMC GROWTH
In a market economy, a producer exchanges his product for money and then exchanges the received money for the products of other producers. Alternatively, we can say that an exchange of something for something takes place by means of money.
Things are, however, not quite the same once money is generated out of “thin air” because of loose central bank policies.
Once that happens, it enables an exchange of nothing for something, a diversion of wealth from wealth generators to the holders of the newly generated money.
The holder of money out of “thin air” obtains goods without contributing to the pool of consumer goods or to the pool of real savings. This means that real savings are diverted from wealth producers to those money holders. In the process, wealth generators are left with fewer consumer goods at their disposal, which weakens their ability to expand the real economy.
An exchange of nothing for something diverts real savings and will take place regardless of whether the increase in money supply is expected or unexpected. This means that contrary to Mr. Phelps and Friedman, even if monetary increases are expected, they will undermine economic growth.
STAGFLATION
Increases in money supply create exchanges of nothing for something, diverting real savings from wealth generators to non-wealth generators. Consequently, this weakens the real savings formation process and weakens the economic growth. Also, note that the price of a good is the amount of money paid for the good, so when this money enters a particular market, more money is paid for the good in this market, increasing the prices of goods.
We then have a situation whereby increases in money supply undermine the process of wealth generation, thus stifling economic growth. At the same time, we have more money per good, which increases their prices. Hence, we have both the increase in goods prices and a diminishing of economic growth, which we call stagflation.
Stagflation is the ultimate result of monetary pumping. Therefore, whenever the central bank adopts an easy monetary stance, it also sets stagflation in motion in the months ahead. The fact that over time a strengthening in the monetary growth may not always manifest through a visible stagflation, it does not refute what we have concluded. What matters for the state of an economy is not the manifestation of stagflation, but rather its causes.
The severity of stagflation depends on the state of the pool of real savings.
If this pool is declining, then a visible decline in economic activity will likely ensue. Moreover, on account of past monetary pumping and the consequent increase in price inflation, we will have a visible stagflation. Conversely, if the pool of real savings is still growing, economic activity is likely to follow suit. Given the rising momentum of prices, we will have positive correlation between economic activity and price inflation. Note that the symptoms of stagflation are not visible here because of a growing pool of real savings. We can conclude that if, on account of past monetary pumping, we do not observe the symptoms of stagflation, this raises the likelihood that the pool of real savings is still growing. Conversely, if we can observe the symptoms of stagflation, then most likely the pool of real savings is declining.
As the pool of real savings comes under pressure, the phenomenon of stagflation becomes more visible.
| |
|
LIQUIDATION BEGINS - FIRST OUT WINS!
When Liquidation Begins, the First Out Win! This is a cardinal rule of survival for lenders in trouble.
When Lenders are in trouble their first response is to buy time for their troubled assets to recover or possibly "Regress-to-the-Mean" before exiting. Minimize potential loan losses.
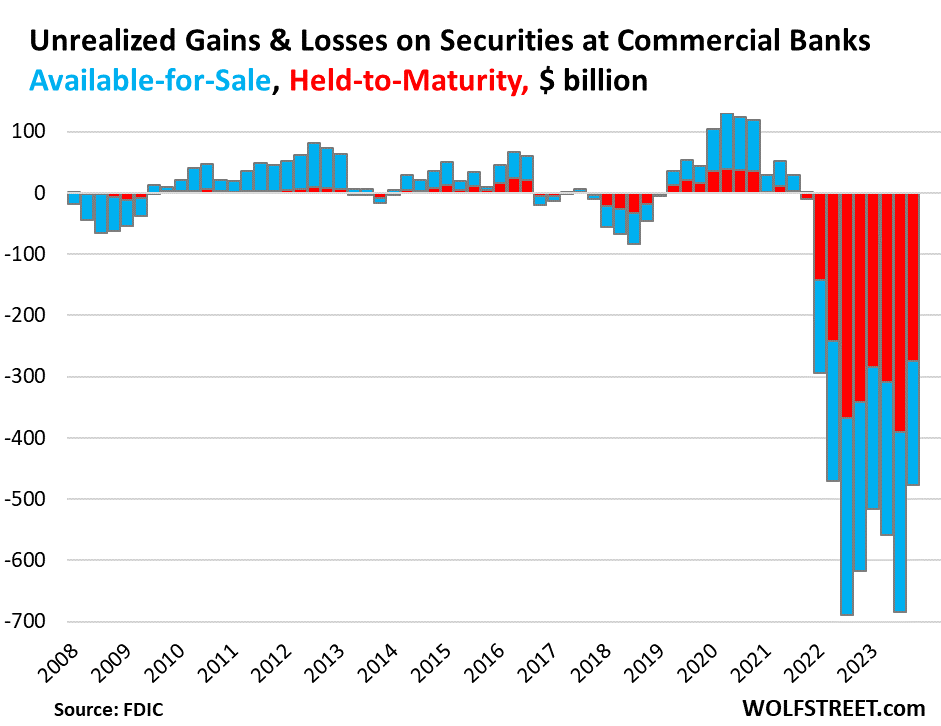
That is the essence of what is going on in the US Banking Sector with over $525B in Unrealized losses in their US Treasury Holdings. The banks are treading water with the assistance of the BTFP (until recently) until the Fed Pivots and reduces their potential losses. Now that the Fed is saying "higher for longer" the sweating begins. Troubled US Regional banks are left trying to run a competitive race carrying a $525B load on its back. It's tough to Zig and Zag in the game when you are also facing collapsing US Commercial Office Real Estate where you have major non-performing and troubled loans outstanding. Your Investment Assets are in trouble in addition to your Lending Assets. Everyone holds their breadth until someone yells fire and getting out of these assets is the number one priority.
That is the state of the US Regional Banking sector.
1- THE US COMMERCIAL OFFICE SPACE FIRESALE BEGINS
RELATED COMPANIES & CIBC: Real estate giant Related Companies has unloaded the property at 321 W. 44th St., New York City, for less than $50 million, reports Bloomberg.
- Not only is that a 67 percent discount from the nearly $153 million that Related Fund Management paid for it in 2018, but also, the lenders, including Canadian Imperial Bank of Commerce, agreed to a “short sale.”
- NOTE: For those who have forgotten 2008 or were too young, a “short sale” is when the lender agrees to a property sale for less than the outstanding amount on the mortgage. The owner loses everything, and the lender takes a large loss. In this case, the repayment to the lenders was more than cut in half as the property’s mortgage exceeded $100 million.
BLACKSTONE: Another recent office building sale had Blackstone and its lender agreeing to sell 1740 Broadway for $186 million. Blackstone Inc. bought the building in 2014 for $605 million.
- Pacific Investment Management Company (Pimco) expects more regional bank failures due to a “very high” concentration of troubled commercial real estate (CRE) loans on their books, Bloomberg reports. John Murray, the head of Pimco’s global private commercial real estate team, told Bloomberg’s Laura Benitez that “the real wave of distress is just starting” for lenders to everything from malls to offices. Ms. Benitez writes, “Contrary to some market expectations, larger banks have been disposing of some of their higher quality assets first to avoid deeper losses, according to Murray.”
That means banks are selling their best assets because they can receive prices at least equal to what they are carrying in loans on their balance sheets. There is no other reason to sell good loans but to generate liquidity.
| |
|
2- JAPANESE US TREASURY FIRESALE LOOMS
Norinchukin is Japan's 5th largest bank with $840 billion in assets.
According to Nikkei:
"Norinchukin Bank will sell more than $63 billion of its holdings of U.S. and European government bonds during the year ending March 2025 as it aims to stem its losses from bets on low-yield foreign bonds, a main cause of its deteriorating balance sheet, and lower the risks associated with holding foreign government bonds."
Since rates are also rising in Japan, Japanese Banks are seeing similar unrealized loss problems as US banks are facing on their domestic JGB holdings.
For perspective, according to the Bank of Japan, outstanding foreign bonds held by depositary financial institutions amounted to 117 trillion yen as of the end of March. Norinchukin, which is a major institutional investor in Japan, holds as much as 20% of the total on its own! Once Nochu begins selling, others are highly likely to join the club! Assuming comparable liquidation, this could potentially amount to (5X) $315B in US and EU sovereign bonds.
Norinchukin's US Treasury sales and the other 80% are likely to react quickly while liquidity is available and prices are elevated.
As problematic as Selling US Treasuries is, the fact there will be reduced demand for new purchases with US debt growth exploding higher is a recipe for panic selling!
THIS IS GOING TO POTENTIALLY PLACE UPWARD PRESSURE ON US TREASURY RATES.
COULD WE SEE A VICIOUS DEATH SPIRAL DEVELOP?
| |
|
GLOBAL ECONOMIC INDICATORS:
What This Week's Key Global Economic Releases Tell Us
|  | |
I have been screaming about this for 18 months - now it officially comes out:
"THERE IS AN ARGUMENT THAT PAYROLLS MAY BE A BIT OVERSTATED." Jerome Powell
In response to a question from a Bloomberg journalist during the post-FOMC presser, asking the Fed chair to comment on the state of the labor market, the Fed Chair said that two years ago the labor market was "overheated" and has since gotten back to "normal", largely thanks to "supply from to immigration" - translation: illegal aliens have been the main reasons for the increase in employment and the drop in wages and thus, overall inflation, which as we discussed recently, is the narrative that is being pushed out to mitigate demands by most Americans to halt illegal immigration.
Where things got very interesting, however, is when Powell was discussing the demand-side of the labor market: here, he addressed the dropping quits level, the decline in job openings and wages, but more importantly, the rising unemployment rate - from 3.4% to 4.0% which clearly goes against the narrative of red hot payrolls - all of which the Fed chair summarized as strong job creation, yet caveated by saying that "there is an argument that [payrolls] may be a bit overstated."
Note: he didn't say "understated" because the "-stating" always goes in just one direction: the one that makes the President of the White House look good.
In other words, the jobs - like so many things about this Potemkin economy - are a lie, and while Powell immediately realized what he had said, and tried to couch it by adding that payrolls are "still strong", suddenly the entire narrative of a strong labor market imploded in front of our eyes, because if the Biden admin will lie about a "bit" of the jobs report, it will lie about any part of it.
And, as we have shown above and every month this year, lie is precisely what the Biden administration has been doing, month after month, year after year.
And the biggest stunner, as Edward Snowden put it so eloquently, is that he's "not sure I've ever seen the chairman of the Federal Reserve publicly accuse the White House of cooking the books on employment numbers, but here we are."
|
RETAIL SALES
- US Retail Sales MM (May) 0.1% vs. Exp. 0.3% (Prev. 0.0%, Rev. -0.2%)
CHART RIGHT: Real Retail Sales (adjusted by the CPI)
Nominal Retail sales was softer than expected with downward revisions to the prior month.
- The headline M/M rose just 0.1%, up from the prior -0.2% (initially 0.0%) read, but beneath the 0.3% forecast, matching the most pessimistic estimates too.
- The core measure (ex-autos & parts) declined by 0.1% despite expectations for a 0.2% gain, matching the pace of last month's decline (initially 0.2%).
- The super core metric (ex gas, autos and parts) rose 0.1%, vs. the prior decline of 0.3% (initially -0.1%).
- The control metric however rose 0.4%, in line with expectations, but the prior was revised down to -0.5% from -0.3%.
- Looking within the report, the upside was led by Sporting goods, hobby, musical instrument, & book stores, rising 2.8%, Clothing & clothing accessories stores rose by 0.9%, while Non-store retailers rose by 0.8%, as did motor vehicle and parts dealers.
- On the flipside, the largest decline was seen in Gasoline stations, -2.2%, while Furniture and home furniture stores declined by 1.1%, with Building material & garden equipment & supplies' dealers dipping 0.8%.
- The overall soft retail sales number adds to more evidence of a softening consumer. Although do note the Q2 24 Atlanta Fed GDPNow tracker was unchanged at 3.1% post-data, while perhaps the control group was not as soft as the rest of the data.
| |
|
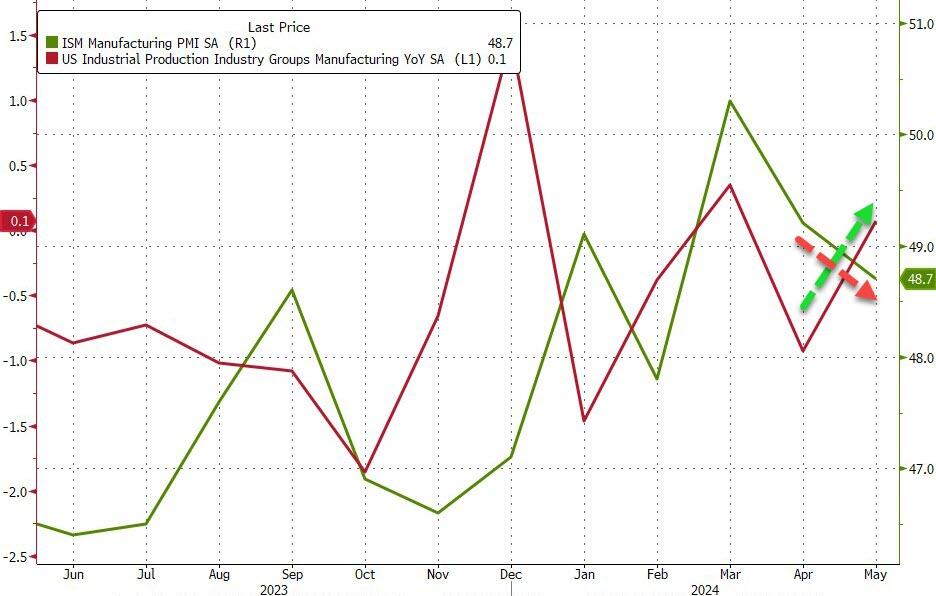
INDUSTRIAL PRODUCTION / CAPACITY UTILIZATION
- US Industrial Production MM (May) 0.9% vs. Exp. 0.3% (Prev. 0.0%)
- US Manufacturing Output MM (May) 0.9% vs. Exp. 0.3% (Prev. -0.3%, Rev. -0.4%)
CHART RIGHT: The Institute for Supply Management’s latest measure of factory activity shrank in May at a faster pace as a gauge of output came close to stagnating.
Industrial production rose 0.9% in May (prev. 0.0%), above the expected 0.3% and the top end of the forecast range of 0.7%.
- Manufacturing output also lifted 0.9% (prev. -0.4%, exp. +0.3%), with capacity utilization ticking higher to 78.7% (exp. 78.6%) from 78.2%.
- After the data set, Oxford Economics notes IP is forecasted to remain unchanged this year after inching 0.2% higher in 2023, but the better-than-expected May reading creates upside risk to its near-term forecast.
- Moreover, the consultancy adds, “After an uneven start to the year, IP will edge higher during the remainder of 2024.
- However, it won't take off meaningfully until next year after the Federal Reserve's rate-cutting cycle gets underway.”
- Oxford adds manufacturing led May's sharp uptick in industrial production, while warmer than usual weather boosted utilities output. Mining output inched higher, but still hasn't returned to levels prevailing before severe winter storms disrupted the sector in January.
| |
|
GLOBAL MACRO
WHAT DOES YOUR SCAN OF THE DATA BELOW TELL YOU? - THE MEDIA AVOIDS BAD NEWS!
We present the data in a way you can quickly see what is happening.
THIS WEEK WE SAW
Exp=Expectations, Rev=Revision, Prev=Previous
| |
|
UNITED STATES
- US NY Fed Manufacturing (Jun) -6.0 vs. Exp. -9.0 (Prev. -15.6)
- US Retail Sales MM (May) 0.1% vs. Exp. 0.3% (Prev. 0.0%, Rev. -0.2%)
- US Industrial Production MM (May) 0.9% vs. Exp. 0.3% (Prev. 0.0%)
- US Manufacturing Output MM (May) 0.9% vs. Exp. 0.3% (Prev. -0.3%, Rev. -0.4%)
- US Philly Fed Business Index (Jun) 1.3 vs. Exp. 5.0 (Prev. 4.5)
- US Philly Fed Prices Paid (Jun) 22.5 (Prev. 18.7)
- US Initial Jobless Claims w/e 238.0k vs. Exp. 235.0k (Prev. 242.0k, Rev. 243k)
- US Continued Jobless Claims w/e 1.828M vs. Exp. 1.805M (Prev. 1.82M, Rev. 1.813M)
- US Building Permits: Number (May) 1.386M vs. Exp. 1.45M (Prev. 1.44M)
- US Housing Starts Number (May) 1.277M vs. Exp. 1.37M (Prev. 1.36M, Rev. 1.352M)
CHINA
- Chinese Industrial Output YY (May) 5.6% vs. Exp. 6.0% (Prev. 6.7%)
- Chinese Retail Sales YY (May) 3.7% vs. Exp. 3.0% (Prev. 2.3%)
- Chinese Urban Investment (YTD) YY (May) 4.0% vs. Exp. 4.2% (Prev. 4.2%)
- Chinese China House Prices MM (May) -0.71% (Prev. -0.58%)
- Chinese China House Prices YY (May) -3.9% (Prev. -3.1%)
JAPAN
- Japanese Machinery Orders MM (Apr) -2.9% vs. Exp. -3.1% (Prev. 2.9%)
- Japanese Machinery Orders YY (Apr) 0.7% vs. Exp. -0.1% (Prev. 2.7%)
- Japanese Trade Balance Total (JPY)(May) -1221.3B vs. Exp. -1313.7B (Prev. -462.5B, Rev. -465.6B)
- Japanese Exports YY (JPY)(May) 13.5% vs. Exp. 13.0% (Prev. 8.3%)
- Japanese Imports YY (JPY)(May) 9.5% vs. Exp. 10.4% (Prev. 8.3%)
- Japanese National CPI YY (May) 2.8% vs. Exp. 2.9% (Prev. 2.5%)
- Japanese National CPI Ex. Fresh Food YY (May) 2.5% vs. Exp. 2.6% (Prev. 2.2%)
- Japanese National CPI Ex. Fresh Food & Energy YY (May) 2.1% vs. Exp. 2.2% (Prev. 2.4%)
- Japanese JibunBK Manufacturing PMI Flash SA (Jun) 50.1 (Prev. 50.4)
- Japanese JibunBK Services PMI Flash SA (Jun) 49.8 (Prev. 53.8)
UK
- UK Rightmove House Price Index MM (Jun) 0.0% (Prev. 0.8%); YY (Jun) 0.6% (Prev. 0.6%)
- UK Rightmove House Price Index MM (Jun) 0.0% (Prev. 0.8%); YY (Jun) 0.6% (Prev. 0.6%)
- Italian Consumer Prices Final MM (May) 0.2% vs. Exp. 0.2% (Prev. 0.2%); YY (May) 0.8% vs. Exp. 0.8% (Prev. 0.8%); unrevised.
- UK GfK Consumer Confidence (Jun) -14.0 vs. Exp. -16.0 (Prev. -17.0)
- UK Flash Manufacturing PMI (Jun) 51.4 vs. Exp. 51.3 (Prev. 51.2); Flash Services PMI (Jun) 51.2 vs. Exp. 53.0 (Prev. 52.9); Flash Composite PMI (Jun) 51.7 vs. Exp. 53.1 (Prev. 53.0). "Meanwhile, from an inflation perspective, stubbornly persistent service sector inflation – a major barrier to lower interest rates – remains evident in the survey, but should at least cool further from the current 5.7% pace in coming months. However, companies' costs are rising, most notably in manufacturing, where shipping costs in particular are spiking again and adding to a renewed rise in inflationary pressures from goods."
- UK Retail Sales MM (May) 2.9% vs. Exp. 1.5% (Prev. -2.3%, Rev. -1.8%); UK Retail Sales YY (May) 1.3% vs. Exp. -0.9% (Prev. -2.7%, Rev. -2.3%); Retail Sales Ex-Fuel YY (May) 1.2% vs. Exp. -0.8% (Prev. -3.0%, Rev. -2.5%); Retail Sales Ex-Fuel MM (May) 2.9% vs. Exp. 1.3% (Prev. -2.0%, Rev. -1.4%)
- UK PSNB Ex Banks GBP (May) 15.024B GB vs. Exp. 15.7B GB (Prev. 20.514B GB, Rev. 18.444B GB); PSNB, GBP (May) 14.1B GB (Prev. 19.59B GB, Rev. 17.520B GB); PSNCR, GBP (May) 18.135B GB (Prev. -5.217B GB, Rev. -5.249B GB)
- UK GfK Consumer Confidence (Jun) -14.0 vs. Exp. -16.0 (Prev. -17.0)
| |  |
|
EU
- EU Wages In Euro Zone (Q1) 5.3% (Prev. 3.1%, Rev. 3.2%); Labor Costs YY (Q1) 5.1% (Prev. 3.4%)
- EU Wages In Euro Zone (Q1) 5.3% (Prev. 3.1%, Rev. 3.2%)
- EU Labor Costs YY (Q1) 5.1% (Prev. 3.4%)
- EU ZEW Survey Expectations (Jun) 51.3 (Prev. 47.0)
- EU HICP Final YY (May) 2.6% vs. Exp. 2.6% (Prev. 2.6%)
- EU Consumer Confidence Flash (Jun) -14.0 vs. Exp. -13.6 (Prev. -14.3)
- EU HCOB Composite Flash PMI (Jun) 50.8 vs. Exp. 52.5 (Prev. 52.2); HCOB Manufacturing Flash PMI (Jun) 45.6 vs. Exp. 47.9 (Prev. 47.3); HCOB Services Flash PMI (Jun) 52.6 vs. Exp. 53.5 (Prev. 53.2)
GERMANY
- German ZEW Economic Sentiment (Jun) 47.5 vs. Exp. 50.0 (Prev. 47.1)
- German ZEW Current Conditions (Jun) -73.8 vs. Exp. -65.0 (Prev. -72.3)
- German Producer Prices YY (May) -2.2% vs. Exp. -2.0% (Prev. -3.3%); MM (May) 0.0% vs. Exp. 0.3% (Prev. 0.2%)
- German Producer Prices MM (May) 0.0% vs. Exp. 0.3% (Prev. 0.2%)
- German Producer Prices YY (May) -2.2% vs. Exp. -2.0% (Prev. -3.3%)
- German HCOB Composite Flash PMI (Jun) 50.6 vs. Exp. 52.7 (Prev. 52.4); HCOB Services Flash PMI (Jun) 53.5 vs. Exp. 54.4 (Prev. 54.2); HCOB Manufacturing Flash PMI (Jun) 43.4 vs. Exp. 46.4 (Prev. 45.4). "This should be a further reason for the ECB to proceed cautiously with interest rate cuts."
FRANCE
- French HCOB Composite Flash PMI (Jun) 48.2 vs. Exp. 49.5 (Prev. 48.9); HCOB Services Flash PMI (Jun) 48.8 vs. Exp. 50.0 (Prev. 49.3); HCOB Manufacturing Flash PMI (Jun) 45.3 vs. Exp. 46.8 (Prev. 46.4)
- French Business Climate Mfg (Jun) 99.0 vs. Exp. 100.0 (Prev. 99.0)
ITALY
- Italian Consumer Prices Final MM (May) 0.2% vs. Exp. 0.2% (Prev. 0.2%); YY (May) 0.8% vs. Exp. 0.8% (Prev. 0.8%); unrevised.
SINGAPORE
- Singapore Non-Oil Exports MM (May) -0.1% vs. Exp. 1.7% (Prev. 7.6%, Rev. 7.3%); YY (May) -0.1% vs. Exp. -1.0% (Prev. -9.3%, Rev. -9.6%)
AUSTRALIA
- Australian Judo Bank Composite PMI Flash (Jun) 50.6 (Prev. 52.1)
- Australian Judo Bank Manufacturing PMI Flash (Jun) 47.5 (Prev. 49.7)
- Australian Judo Bank Services PMI Flash (Jun) 51.0 (Prev. 52.5)
NEW ZEALAND
- New Zealand GDP QQ (Q1) 0.2% vs. Exp. 0.1% (Prev. -0.1%)
- New Zealand GDP YY (Q1) 0.3% vs. Exp. 0.2% (Prev. -0.3%, Rev. -0.2%)
SWITZERLAND
- Swiss Trade (May) 5.811B CH (Prev. 4.316B, Rev. 4.339B); Swiss Watch exports -2.2% (prev. +4.5%) - on watch exports says "USA (-0.5%) remained at the previous year’s level, while China (-18.0%) and Hong Kong (-22.7%) recorded further major declines."
| |
|
CURRENT MARKET PERSPECTIVE
(NOTE: You missed our Subscriber Mid-Week Update - You Are working with only half the info!)
| |
|
FUNDS SEEING RECORD PUBLIC INFLOWS
FUND MANAGERS FORCED TO "CHASE" PERFORMANCE
Click All Charts to Enlarge
| |
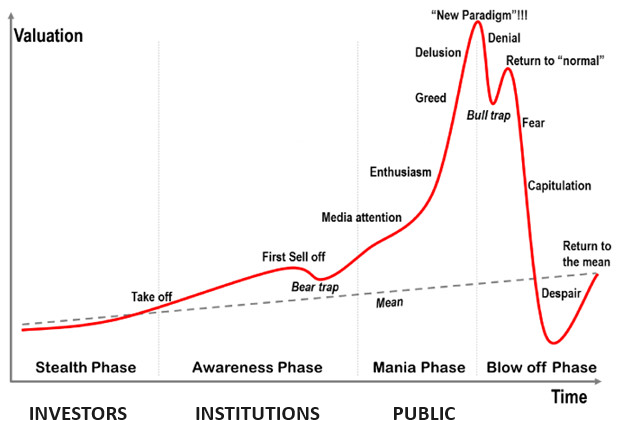
THE NEW PARADIGM: This time its AI and the Mag-7 Adoption of it! Meanwhile public inflows into the market have reached historic levels as they don't want to miss out while institutions are forced to "chase" performance through historic narrow breadth - What could possibly go wrong? (see below section: "WHAT IS GOING ON? - REMEMBER WE HAVE SEEN THIS BEFORE!") | |
|
1 - SITUATIONAL ANALYSIS
THE BIGGEST QUADRUPLE WITCH ON RECORD
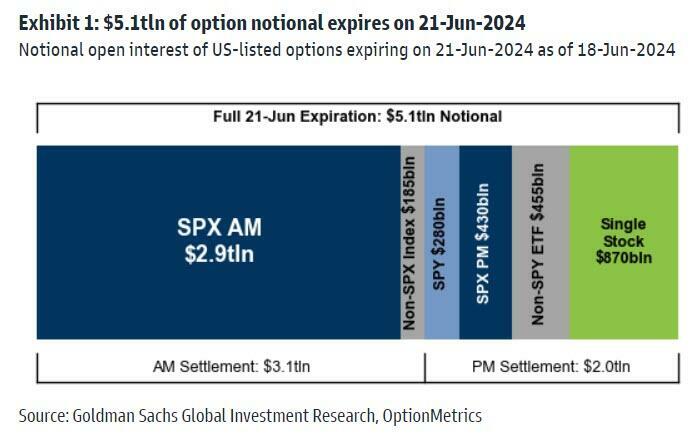
The biggest 'quadruple witch' ever, saw a tight trading range outside of the open and the close.
It was a chaotic start as $3 trillion notional options expired on the open, then left stocks to tread water for much of the day, (even as bond markets suddenly gave a shit about flash PMIs), until the volume exploded into the close.
CHART TOP RIGHT: Wall Street was braced for the biggest triple witching option expiration day on record, where some $5.1 trillion worth of options tied to indexes, stocks, and ETFs matured. Had the potential to "unclench" a record $10 billion in dealer gamma and spark sharp market moves as "pins" expired.
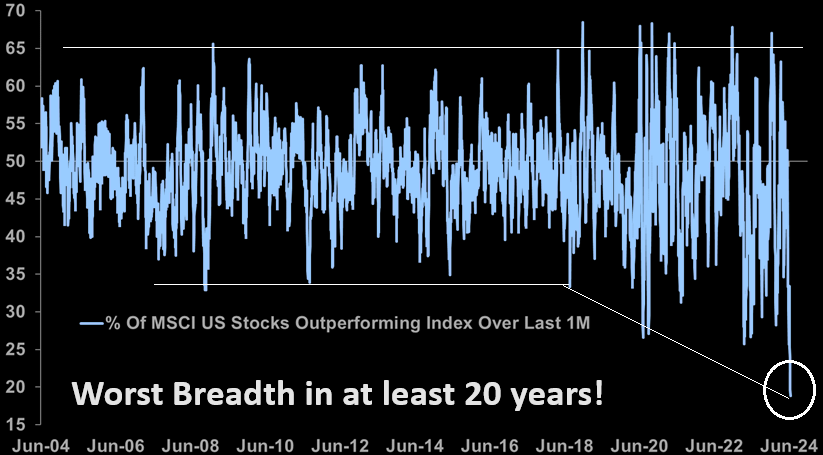
CHART RIGHT: Worst breadth in at least 20 years. Just 19% of US stocks have managed to outperform the wider market in the last month, the worst breadth in at least 20 years.
| | |
| |
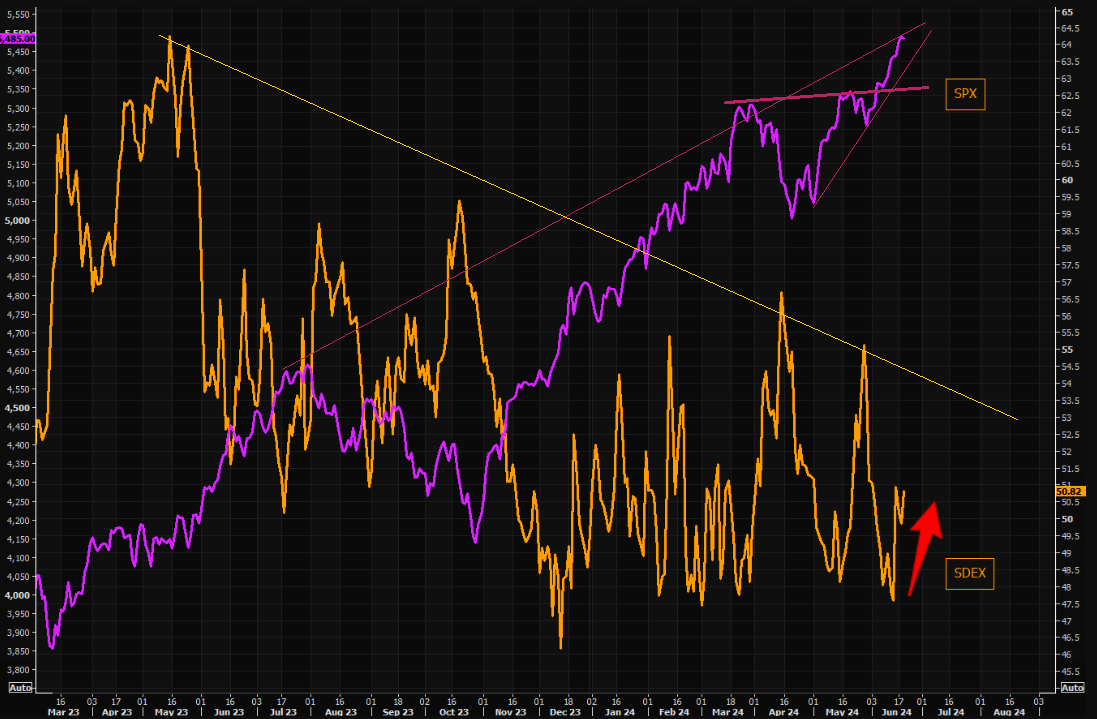
The crowd is long, and they have started bidding for that downside protection. The SDEX measures the pricing of downside protection on a relative volatility basis. It does not tell you about the demand itself. | | |
|
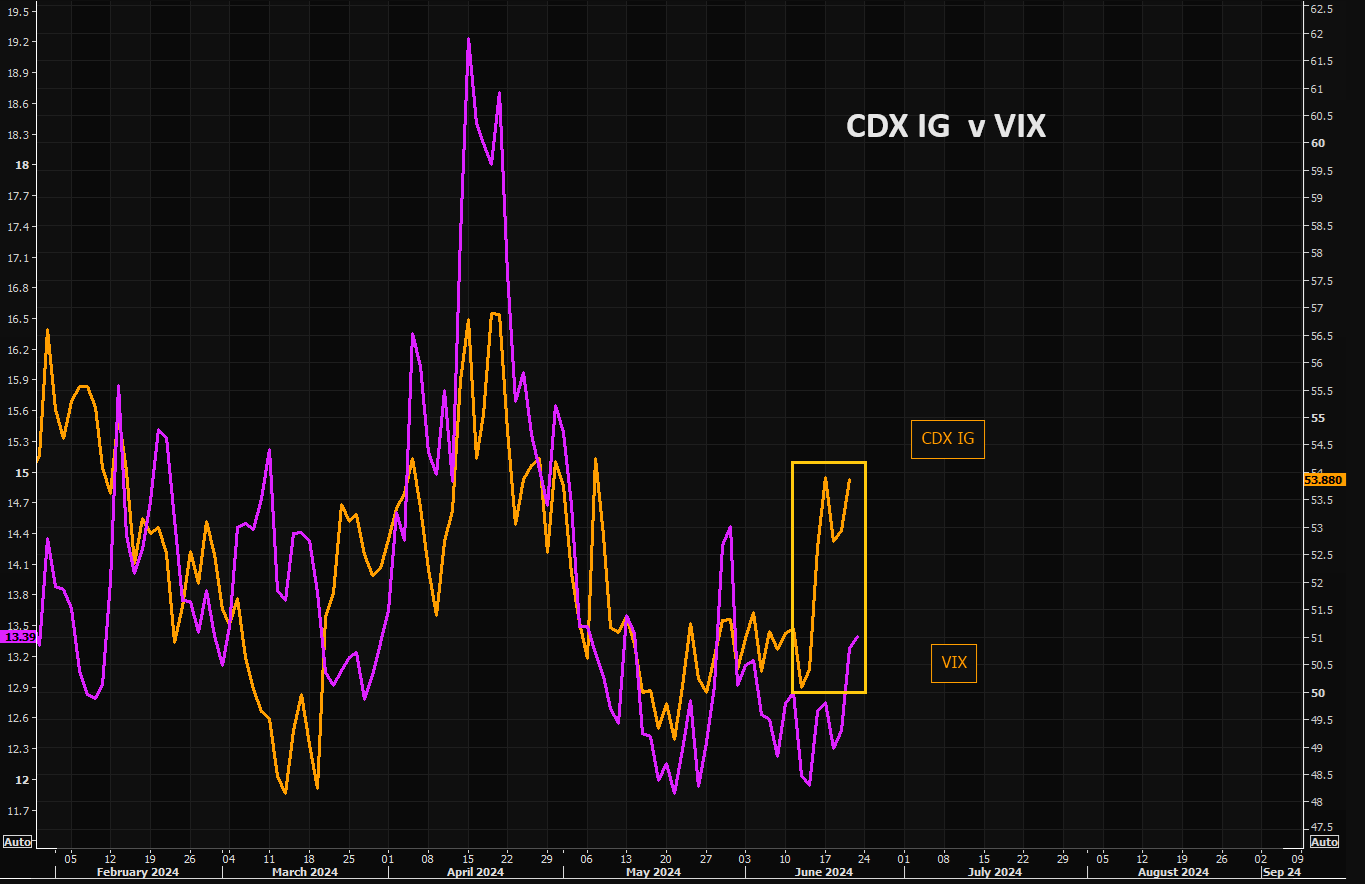
US credit protection
The CDX IG has also caught some bids lately. Chart shows CDX IG vs VIX.
| | |
|
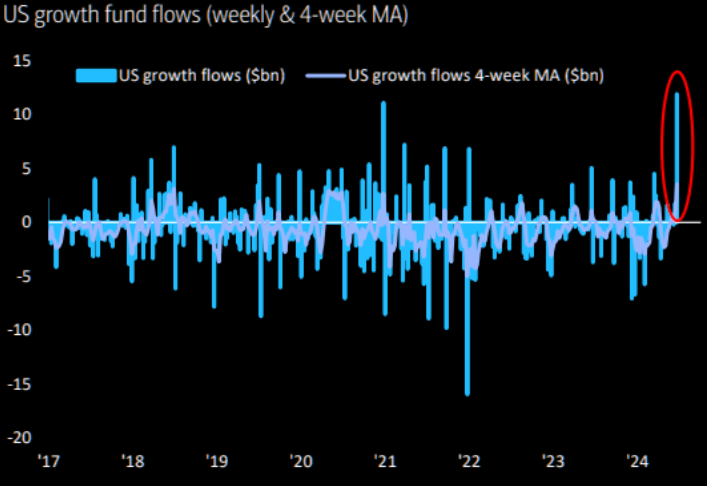
FUND FLOWS
The largest weekly inflow to US Growth funds...EVER!.
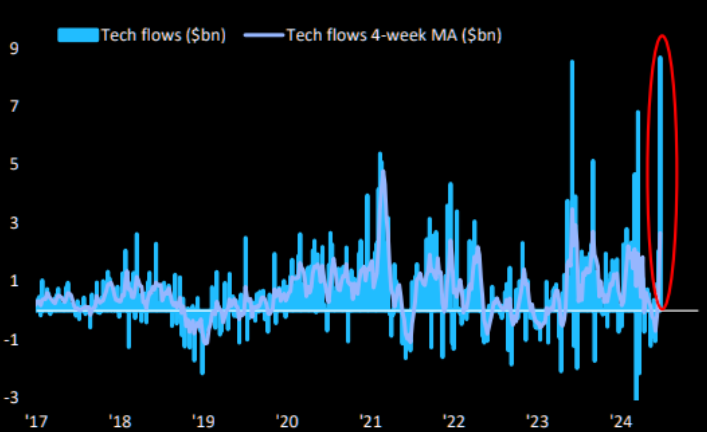
| |
The largest weekly inflow to US Tech funds...EVER!. | |
|
WHAT IS GOING ON? - REMEMBER WE HAVE SEEN THIS BEFORE!
The following three charts best describe what is going on. We have been in this game since before the1987 market crash and have seen this before. It is fundamentally about Financial Institutions and Investment managers being forced to take positions because they are both paid and measured against the market. If they are not on-board they lose performance, clients and money!
The situation only worsens and goes to the ridiculous, when breath narrows significantly (currently at historic levels) and the public enters the markets because of the great returns they are being told about (see chart three).
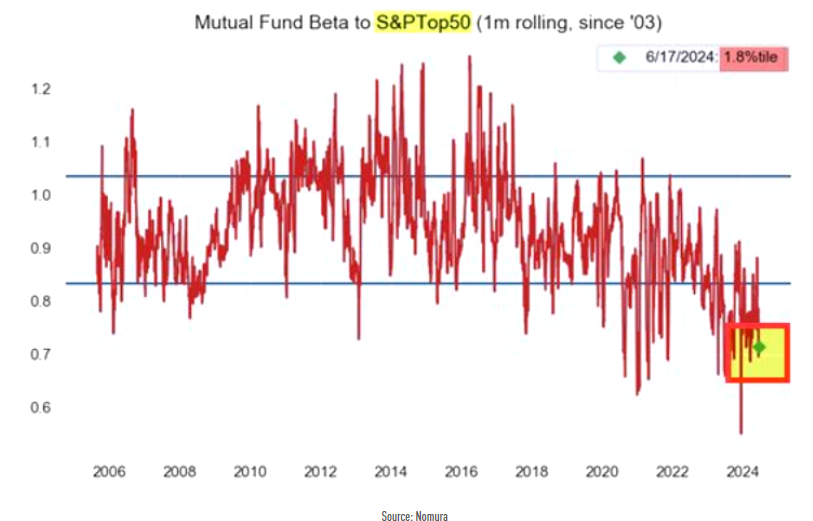
CHART 1 - PROFESSIONALS, FUNDS AND INSTITUTIONS "CHASING"
The chart shows the "forced chasing" of the Top 50 when markets have been melting up since 2003.
| |
|
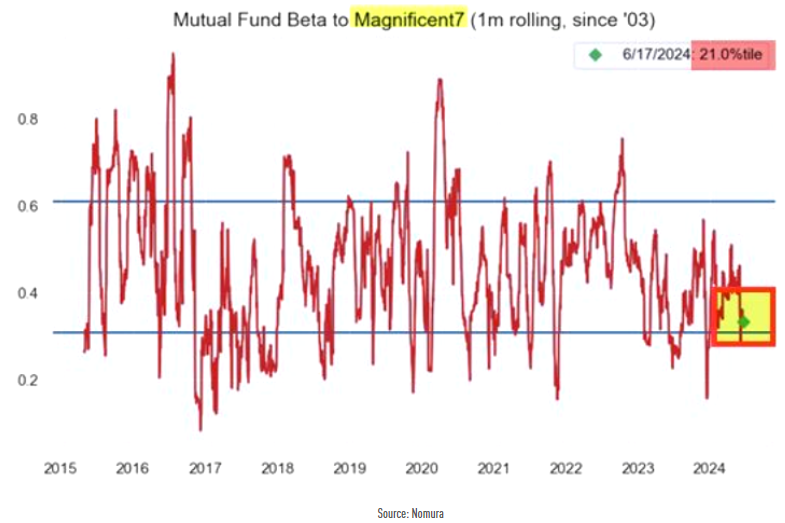
CHART 2 - PROFESSIONALS, FUNDS AND INSTITUTIONS "CHASING"
They must chase the Magnificent -7 because they simply can’t own enough of the handful of names powering benchmark indices higher.
| |
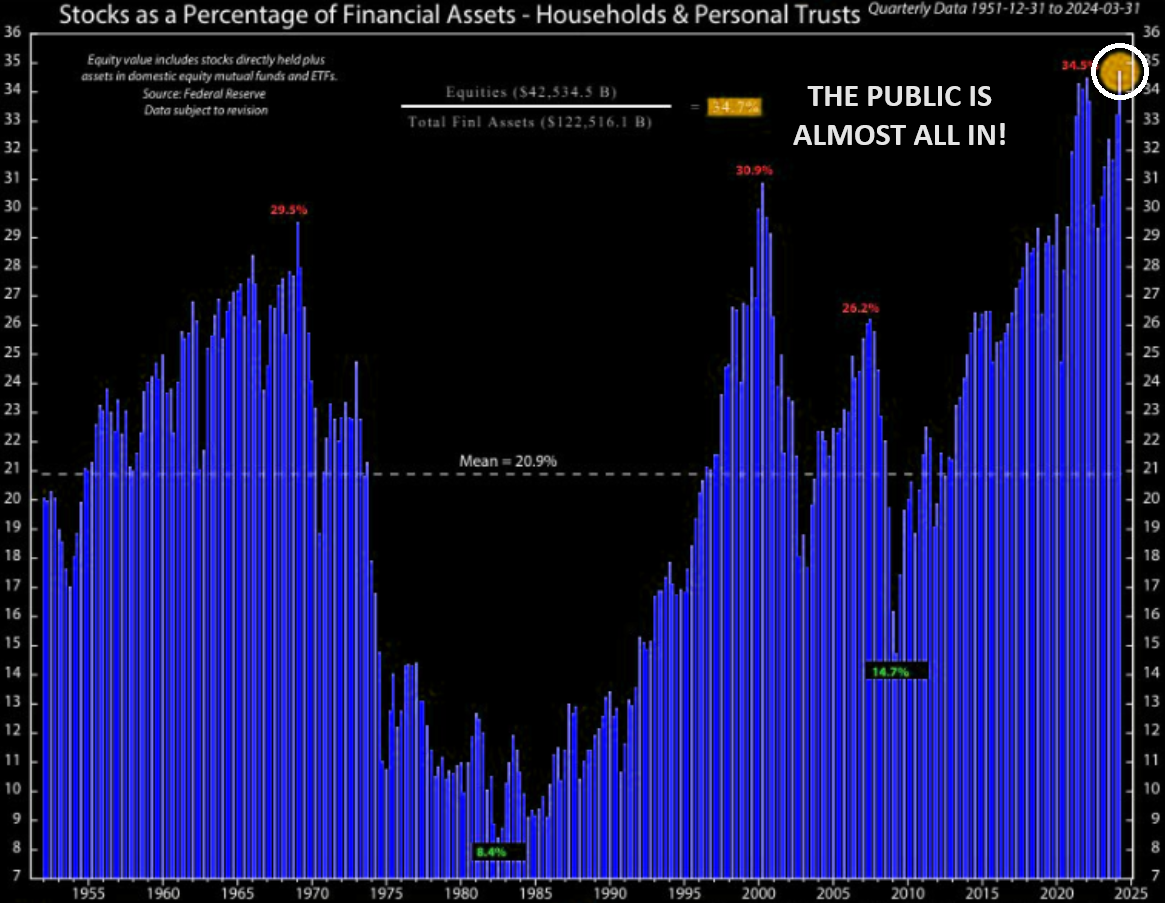
CHART 3 - THE PUBLIC IS NOW ALMOST ALL IN! | |
|
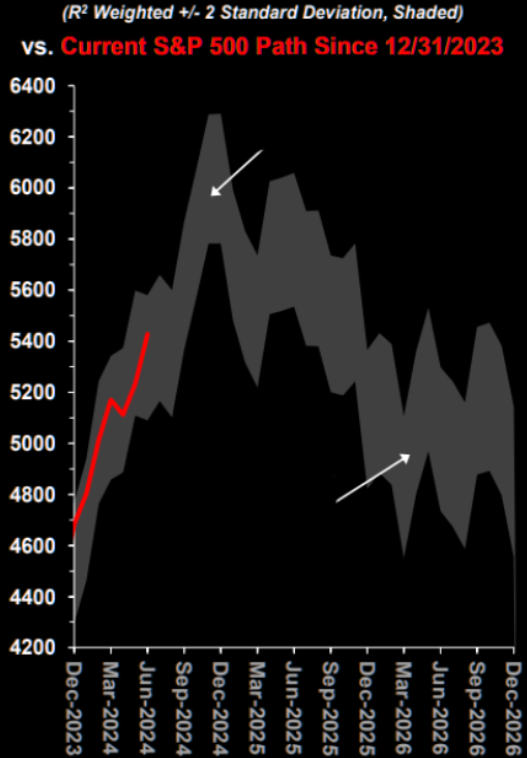
THE GREATER FOOL THEORY
There is always the greater fool who will buy the stock when you want to get out. The Greater Fool Theory is showing here in a scenario where the mania could take us to SPX 6k before the blow off top...and then all the way down to 4800 in q1 2026.
| |
|
... SOME FURTHER FOOD FOR THOUGHT....
Stifel’s Barry Bannister says the US stock benchmark has a shot at reaching the 6,000 mark before the end of 2024 as investors keep piling in, up from just below 5,500 Thursday. But by mid-2026, he expects the gauge to sink back to where it began this year — around the 4,800 level — erasing a fifth of its value.
To be clear, the forecaster says risk assets, and equity markets in particular, are due for a correction much sooner. His official year-end S&P 500 target stands at 4,750, implying a drop of some 13% from today. The index retreated after touching all-time highs Thursday as technology shares came under pressure. Still, the euphoria among investors that’s powered the market for months is set to propel shares higher before they eventually plunge, he says.
“Timing is everything,” Bannister and his team wrote Wednesday in a note to clients, “and we are aware that investors may be in full-fledged bubble/mania mode which looks past our concerns.”
Bannister is not alone as Mark Spitznagel, the founder and chief of Universa Investments, said:
"I've been saying this for a year and a half because people got 2022 so incredibly wrong (we're not in the 70s!). The Fed recklessly popped the greatest credit bubble in human history and now as people realize that the Fed needs to about-face, they're going to get increasingly juked the other way in a face-ripping rally. At the point of euphoria — which is coming — the high will be in and the market will crash worse than the global financial crisis."
"What matters more than my views on this are how Universa's clients are positioned for it — for both a face-ripping rally and for the worst crash since 1929.
| |
|
DIVERGENCES ABOUND!
The short term gap between copper and SPX has become very wide. Dr Copper IS trying to tell us something!
| |
|
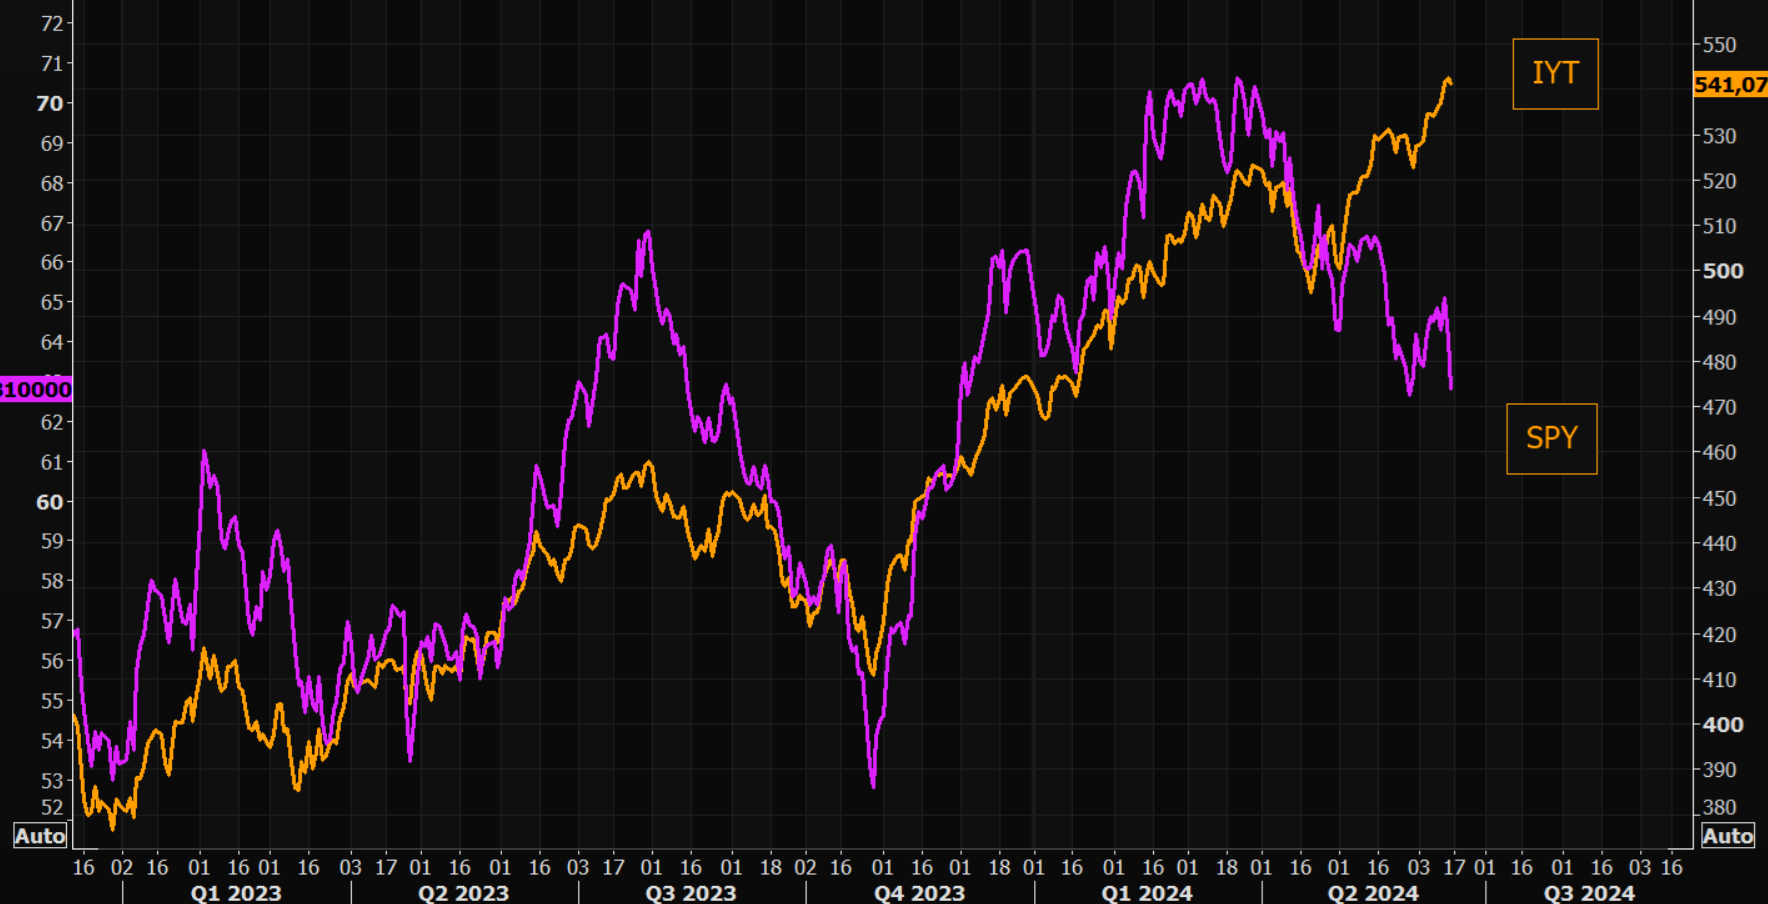
DOW THEORY
In last week's Newsletter we outlined our growing concerns with the Trannies within the DOW Theory (LINK). The gap between Transports and SPY is only getting wider and wider. Is tech so powerful that we can dismiss from "all" PROVEN old relationships? NOTE: More Divergence!
| |
|
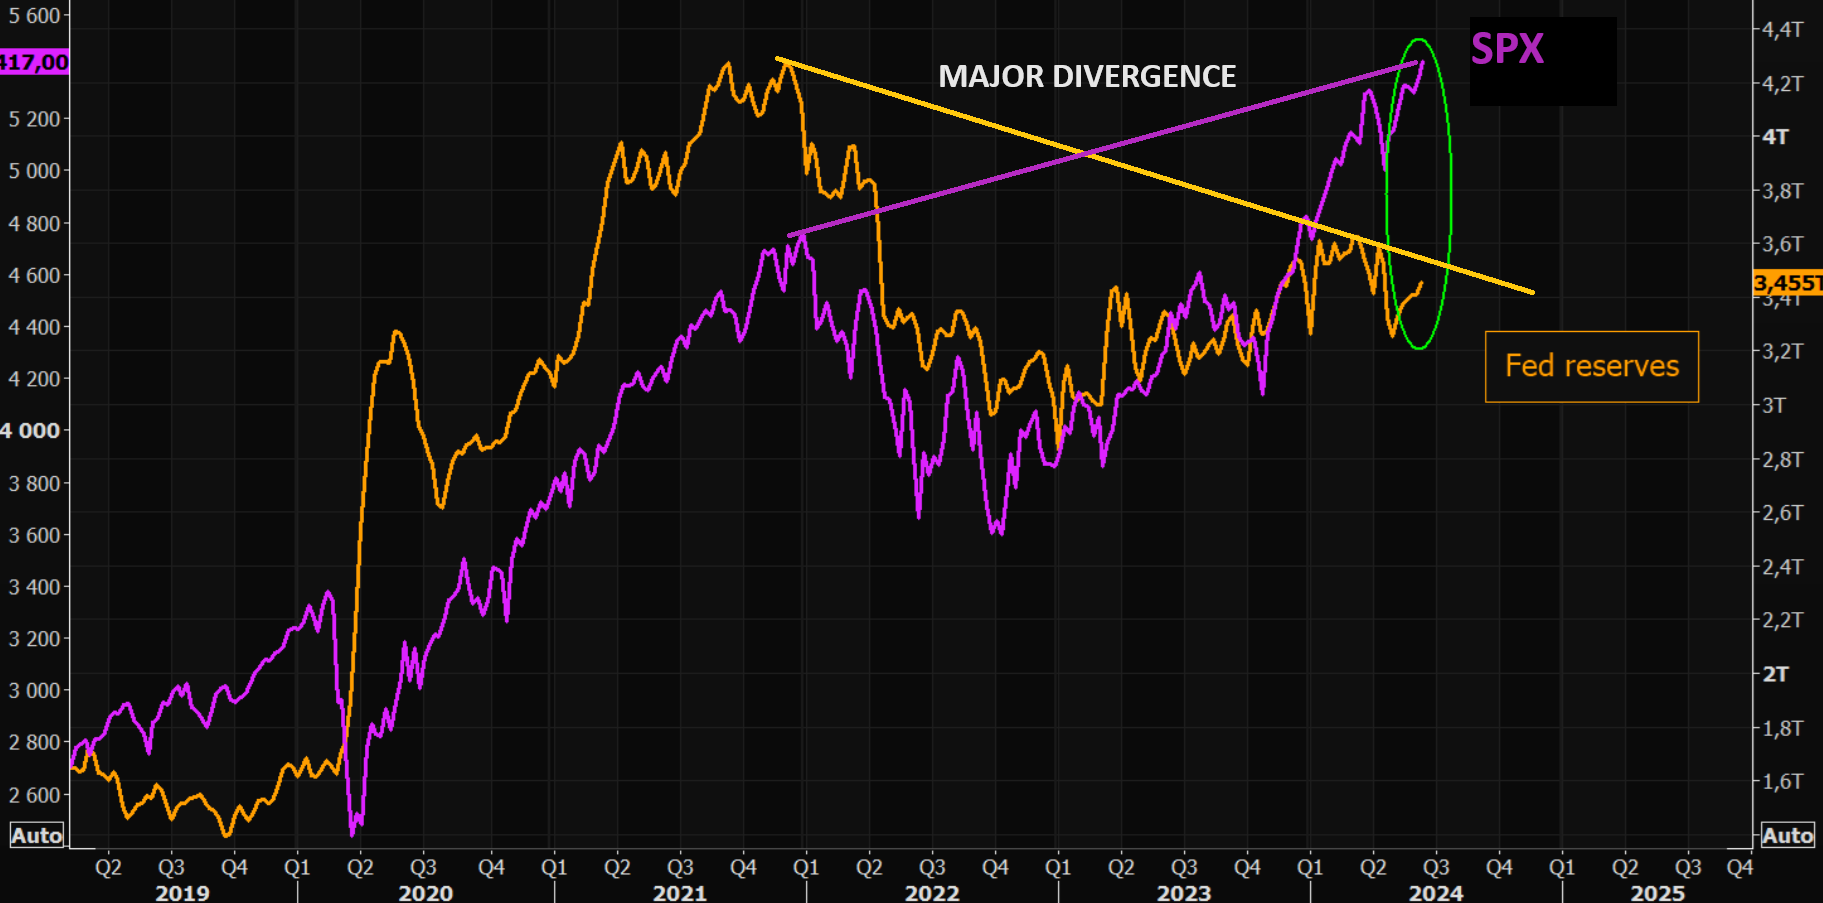
S&P 500 vs FED BANK RESERVES
There are two glaring problems with the chart below:
- The "Jaws-of-Death" will be closed at some point.
- We have a major Divergence which is always a warning to be taken seriously!
| |
|
OTHER MAJOR DIVERGENCES
- Nasdaq 100 & Industrials
- S&P 500 and Industrials
- S&P 500 and the NYSE 10 day average Advance/Decline Line Indicator.
- Small cap Russell 2000 and its 10 day average Advance/Decline Line Indicator
| |
|
MARKET DRIVERS
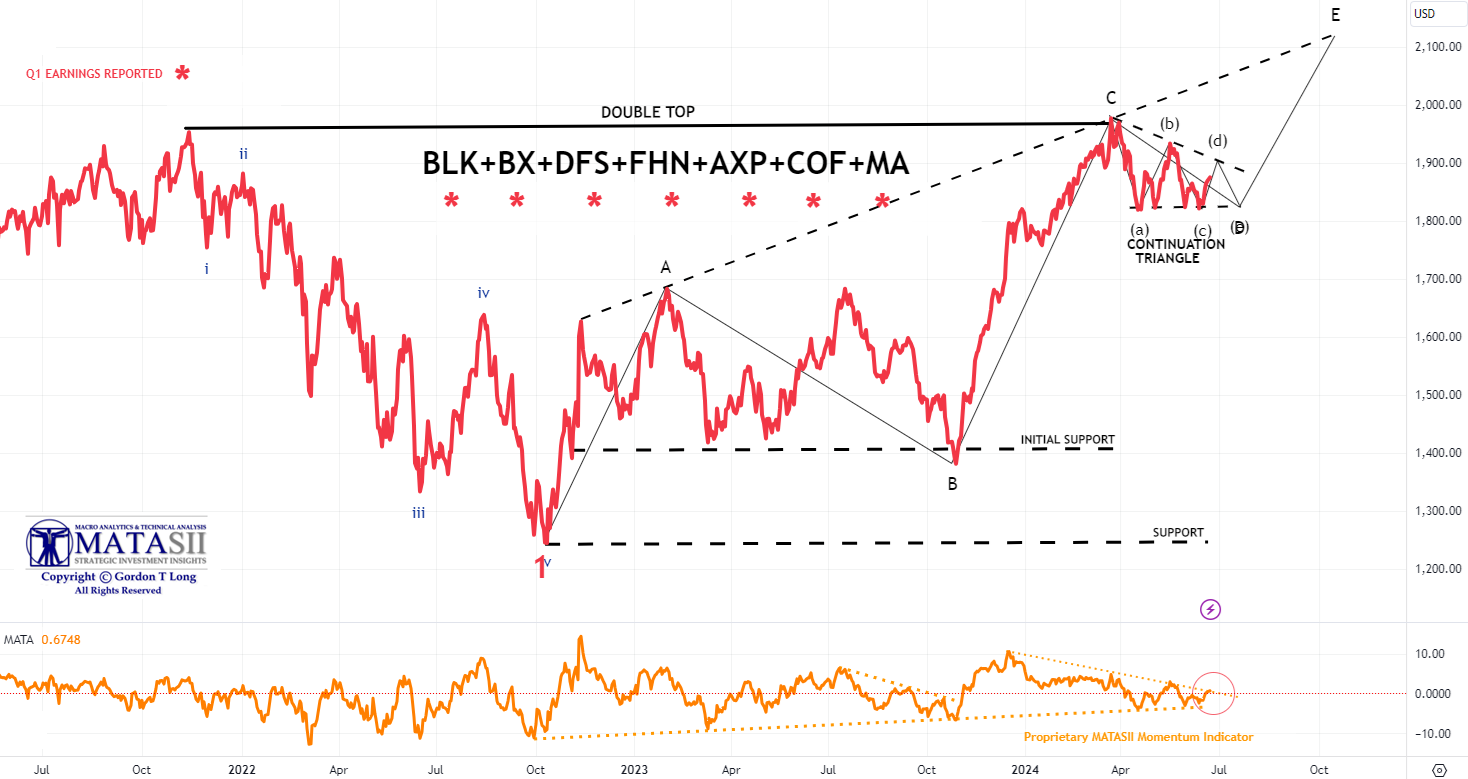
"AS GO THE FINANCIALS, SO GO THE BANKS: AS GO THE BANKS, SO GO THE MARKETS."
MATASII FINANCIAL STOCK INDEX
We continue to keep an eye on both the Bank and Financial stocks to give us an early signal of market direction. We have been showing the banks over the last few weeks, but the Financials now appear to be giving a clearer signal.
- The MATASII Financial Index stocks has begun to exhibit a potential continuation triangle pattern.
- The Elliott Wave analysis supports an "E" wave higher as part of a potential ABCDE pattern.
- Momentum (bottom pane) has found long term support and needs to be watched to see if it breaks shorter term overhead resistance, shown by a dotted descending orange momentum trend line.
| |
|
YOUR DESKTOP / TABLET / PHONE ANNOTATED CHART
Macro Analytics Chart Above: SUBSCRIBER LINK
| |
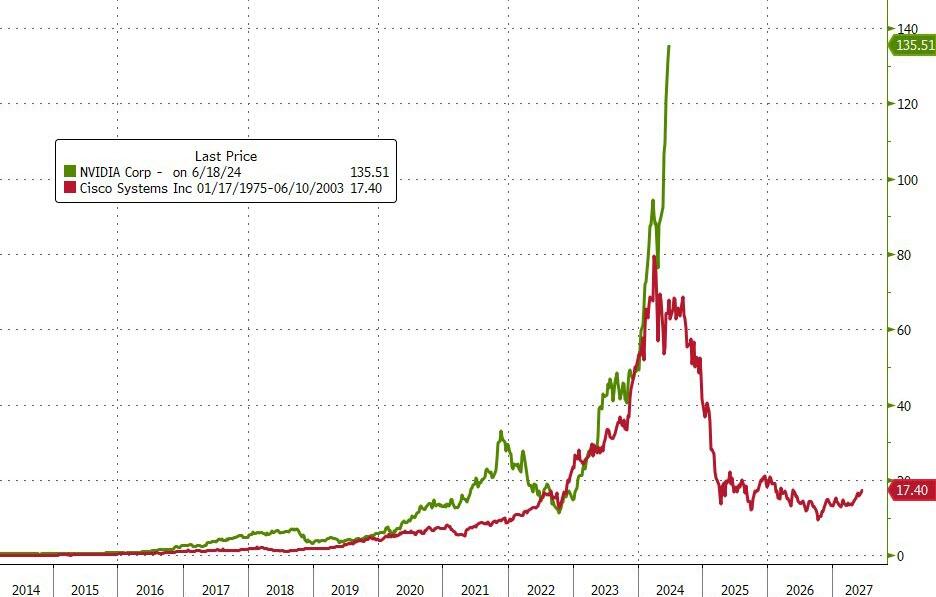
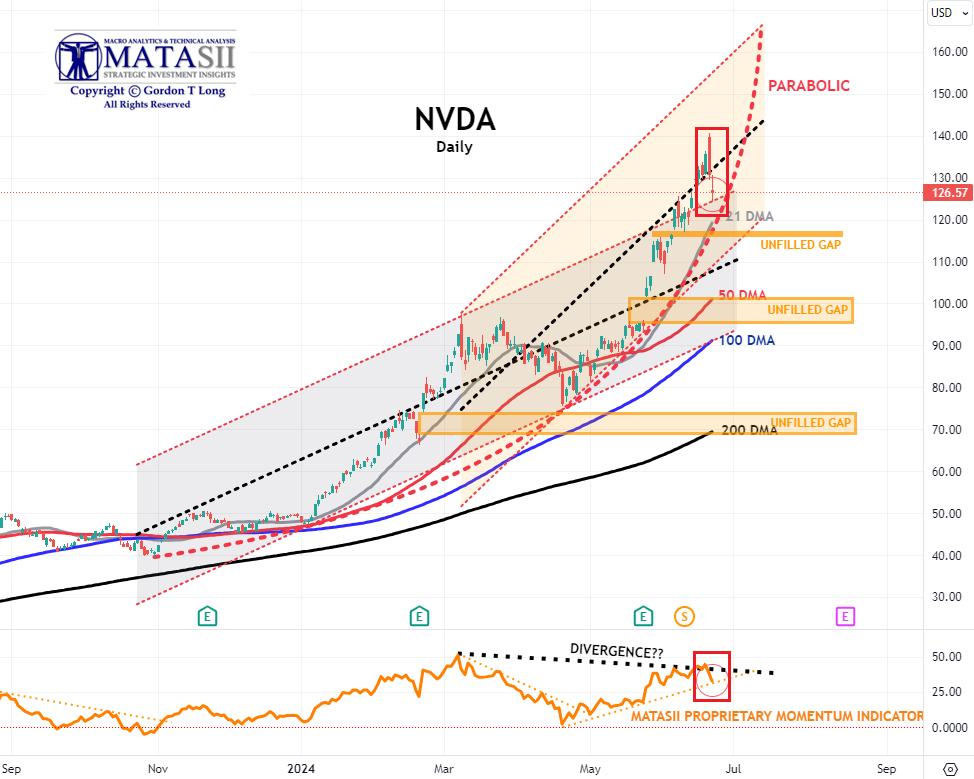
As goes NVDA, so goes the MAG-7, As Goes Mag-7 so goes The Market. | |
NVDA - Daily
CHART RIGHT: NVDA v the darling of the Dotcom Bubble (for those who recall). CSCO was dominant. It appears that was nothing!
- NVDA suffers its first down-week in two months.
- NVDA found initial support from Quad-Witch selling at the upper trend line of the previous control channel. This is just above the rising 21 DMA (in grey).
- Momentum (Lower pane) found support at the rising momentum trend line.
- The Dotted Black Trend line in the MATASII Proprietary Momentum Indicator (lower pane below) is suggesting a potential Divergence has been set up. This is normally seen as a warning to the downside that is ahead if the Divergence isn't removed by a movement higher in Momentum.
- Unless the dotted black Momentum line is decisively broken we can expect NVDA to look for lower support levels.
- At some point the major unfilled gaps (at much lower levels) must be filled. NVDA therefore may no longer become a Short to Intermediate Long Term hold, but rather a position trading stock as others entering the space and force margins to contract.
|  | |
YOUR DESKTOP / TABLET / PHONE ANNOTATED CHART
Macro Analytics Chart Above: SUBSCRIBER LINK
| |
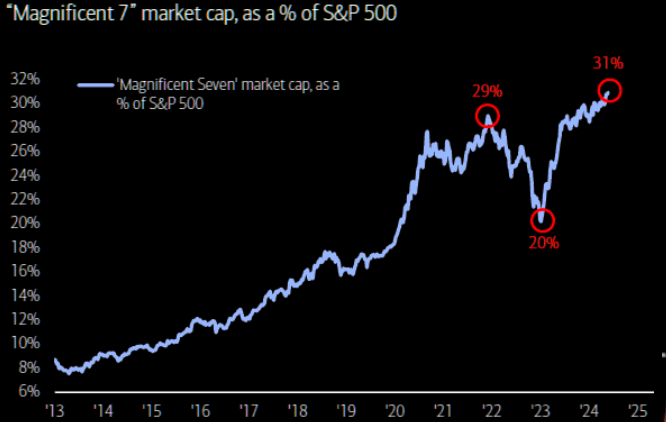
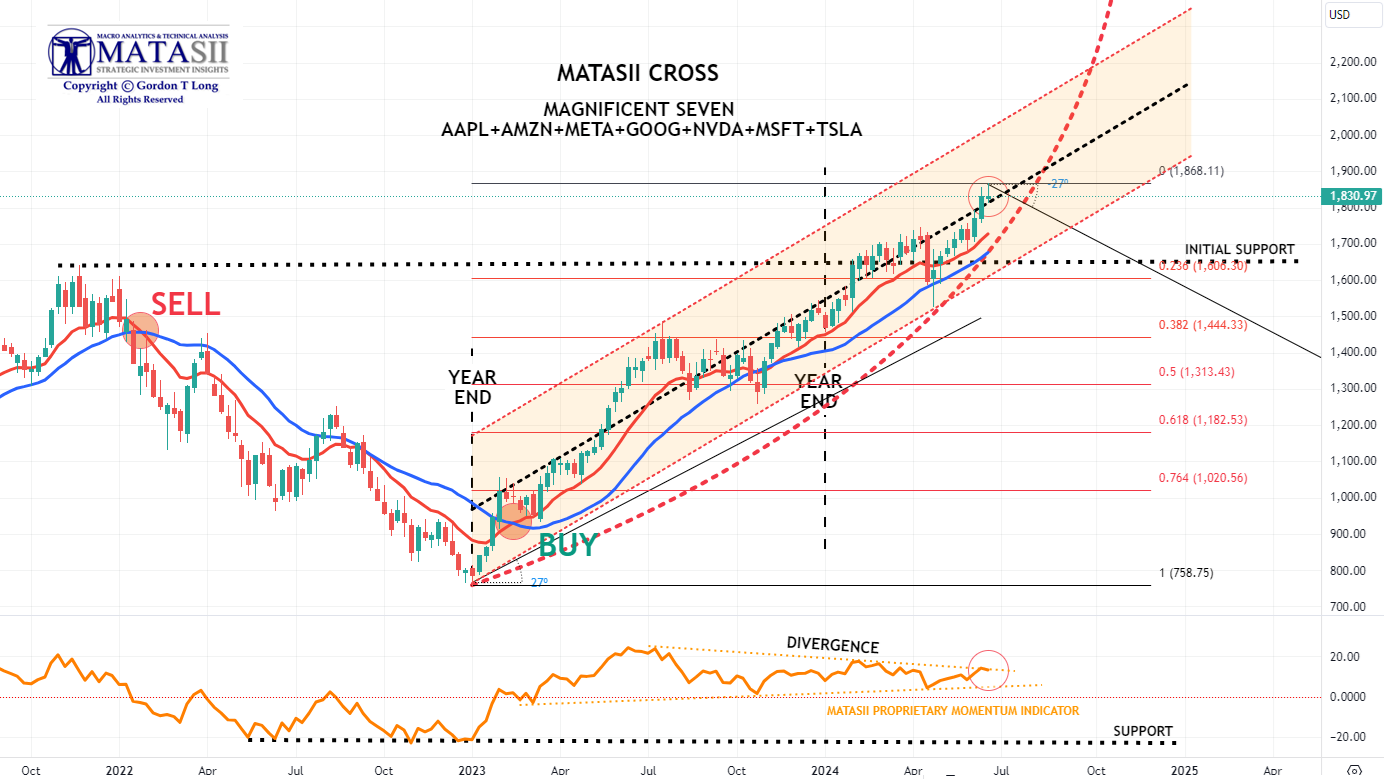
MAGNIFICENT 7
Magnificent 7 is up a magnificent 24% YTD (chart right), contributing >50% of SPX return (NVDA alone = 25%) as monopolistic mega tech monopolizes performance..
Total CAPEX + R&D for the Magnificent Seven this year is expected to total $348bn. (Think about that for a second.)
Here’s another way to frame it - the Magnificent 7 is reinvesting 61% of their operating free cash flow back into
CAPEX + R&D!
- The basket of 'Magnificent 7' stocks pulled back with June Option's "Quad-Witch" to find initial support at the black dotted mid-line of the current rising control channel.
- We continue to be concerned about the momentum Divergence signal that has been occurring for some time (bottom pane). The Momentum trend line acted as overhead resistance this week. Continued caution advised.
| |
YOUR DESKTOP / TABLET / PHONE ANNOTATED CHART
Macro Analytics Chart Above: SUBSCRIBER LINK
| |
"CURRENCY" MARKET (Currency, Gold, Black Gold (Oil) & Bitcoin) | |
|
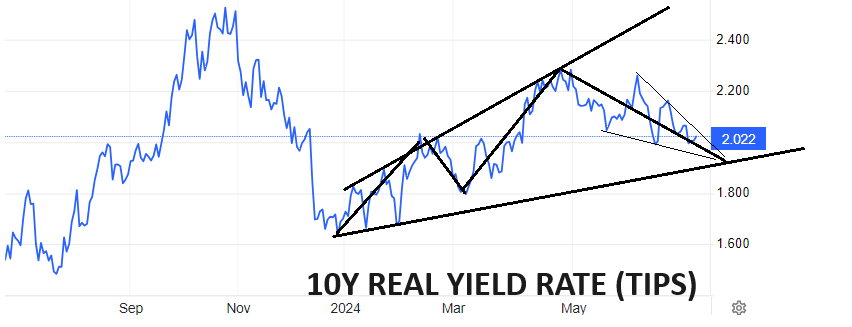
10Y REAL YIELD RATE (TIPS)
Real Rates reached our initial overhead resistance level of 2.25% before falling off hard as part of our expected leg lower (chart right).
We are approaching support and a potential turn upward in Yields.
| |
CONTROL PACKAGE
There are TEN charts we have outlined in prior chart packages, which we will continue to watch closely as a CURRENT Control Set:
-
US DOLLAR -DXY - MONTHLY (CHART LINK)
-
US DOLLAR - DXY - DAILY (CHART LINK)
-
GOLD - DAILY (CHART LINK)
-
GOLD cfd's - DAILY (CHART LINK)
-
GOLD - Integrated - Barrick Gold (CHART LINK)
-
SILVER - DAILY (CHART LINK)
-
OIL - XLE - MONTHLY (CHART LINK)
-
OIL - WTIC - MONTHLY - (CHART LINK)
-
BITCOIN - BTCUSD - WEEKLY (CHART LINK)
-
10y TIPS - Real Rates - Daily (CHART LINK)
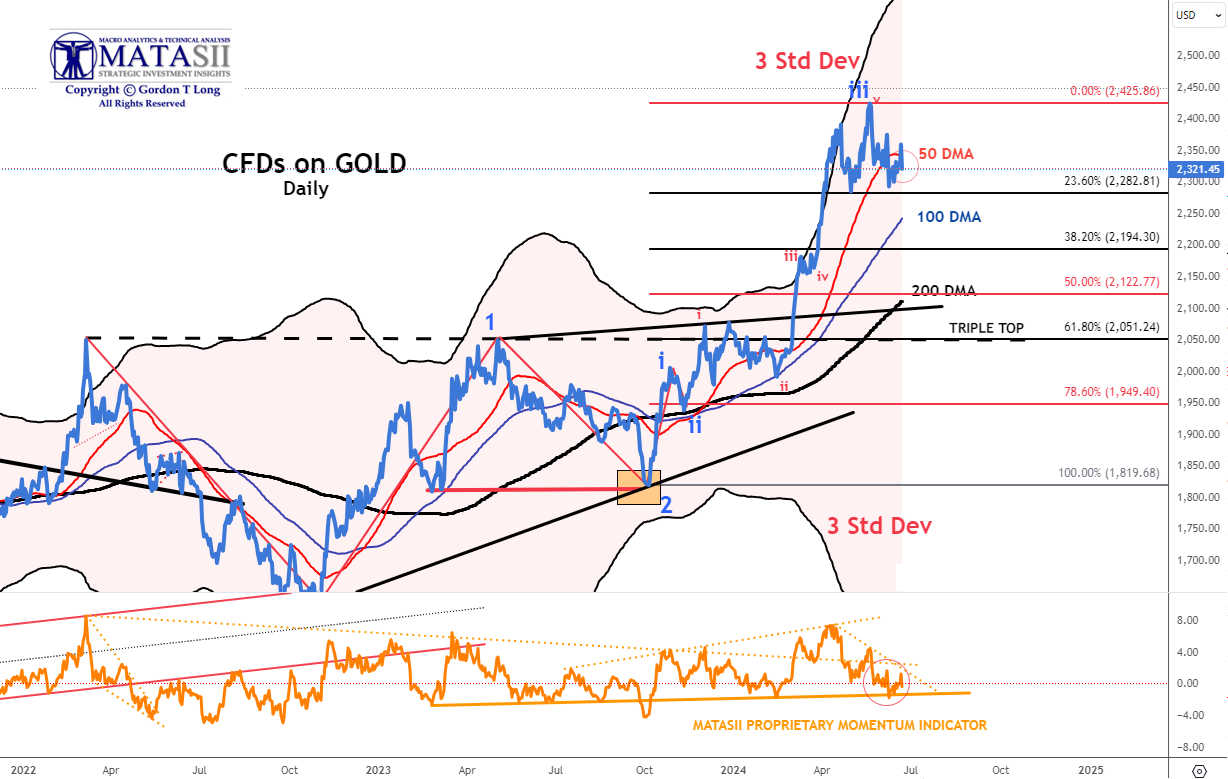
GOLD - cfd - DAILY
- Gold cfd's continue to weaken as inflation pressures weaken and yields fall.
- The Gold cfd's have broken through the 50 DMA.
- The 100 DMA is slightly above a 38.2% Fibonacci Retracement and is the likely next stop in finding support.
- The Elliott Wave count still suggests a strong likelihood of a minimum retracement of 38.2% and the 100 DMA.
- Momentum support (lower pane) shows gold has found an important near term support line.
- Though the MATASII CROSS has given an initial SELL signal on the Daily chart, (which we showed in the weekend report), we caution it may be short lived!
|  | |
YOUR DESKTOP / TABLET / PHONE ANNOTATED CHART
Macro Analytics Chart Above: SUBSCRIBER LINK
| |
|
US EQUITY MARKETS
TIME TO HEDGE?
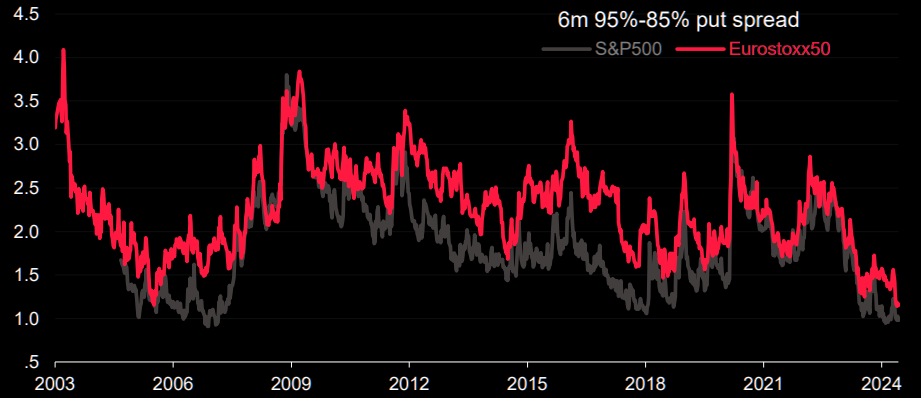
Soc Gen have been very accurate in their volatility predictions. They are out pushing the "hedge" logic:
- Several leading indicators are pointing to elevated risk over the next few months.
- Volatility, rates and cost of financing all are contributing to low hedging costs.
- Elevated political uncertainty is the latest spanner in the works.
- IDEA: They like put spreads on SPX and EuroStoxx 50 indices. In SPX they look at the December 5050/4500 put spread, max pay off 9.77x. Chart above shows the 6 months 95%/85% put spreads.
| |
|
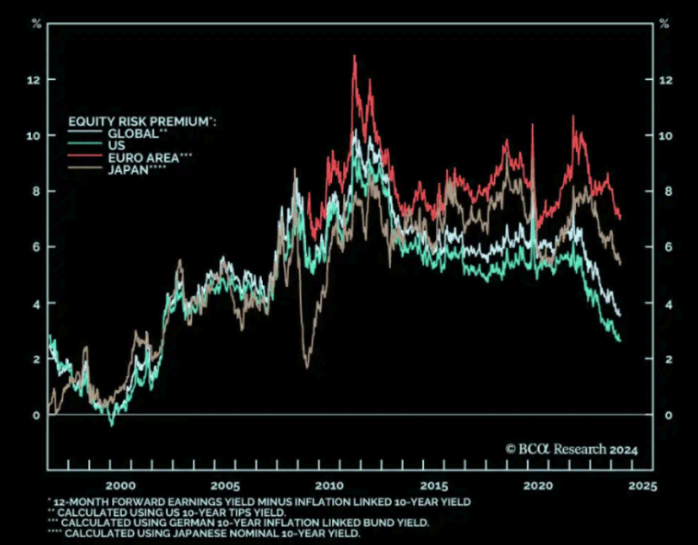
CHART RIGHT: The trend of falling ERP has been going on for some time. It is basically telling us we should underweight stocks on a 1 year horizon.
CONTROL PACKAGE
There are FIVE charts we have outlined in prior chart packages that we will continue to watch closely as a CURRENT "control set":
-
The S&P 500 (CHART LINK)
-
The DJIA (CHART LINK)
-
The Russell 2000 through the IWM ETF (CHART LINK),
-
The MAGNIFICENT SEVEN (CHART ABOVE WITH MATASII CROSS - LINK)
-
Nvidia (NVDA) (CHART LINK)
| |
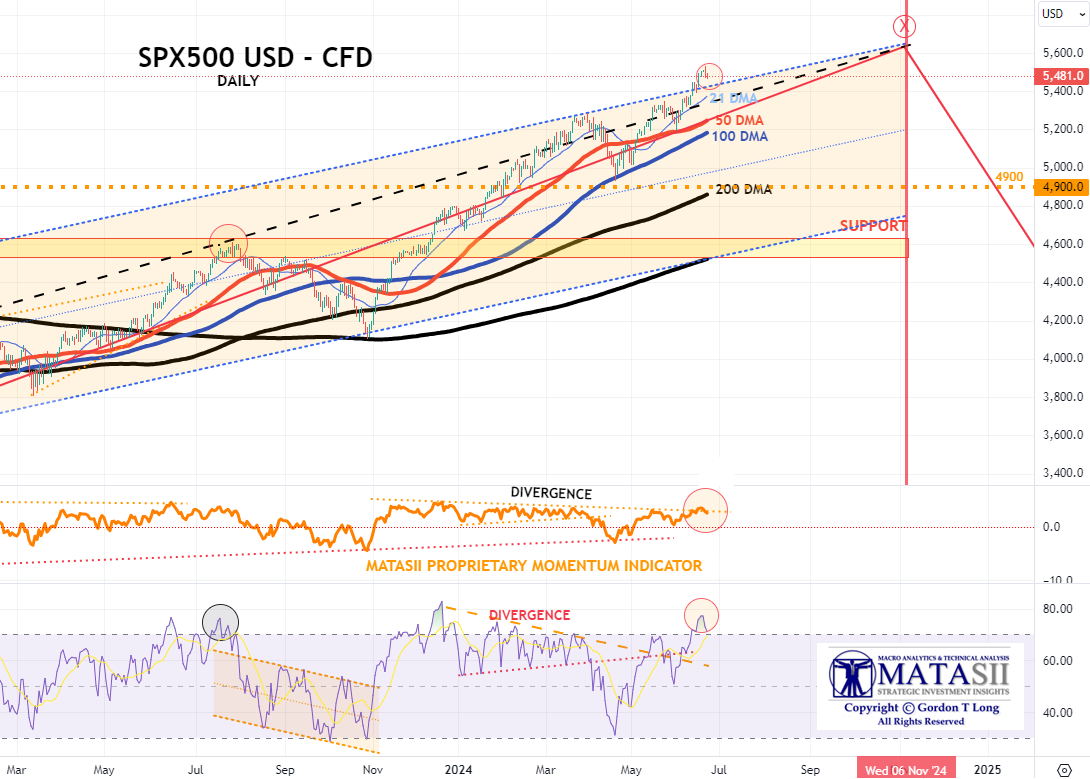
S&P 500 CFD
- The S&P 500 cfd rose aggressively this week before falling off with June Option's "Quadruple-Witch".
- The MATASII Proprietary Momentum Indicator (middle pane) appears to be showing signs of weakening within a Divergence pattern with price and stopped by its overhead momentum resistance trend line.
- We also have an extreme RSI level.
- A likely test of the 21 DMA may occur next week.
| |
YOUR DESKTOP / TABLET / PHONE ANNOTATED CHART
Macro Analytics Chart Above: SUBSCRIBER LINK
| |
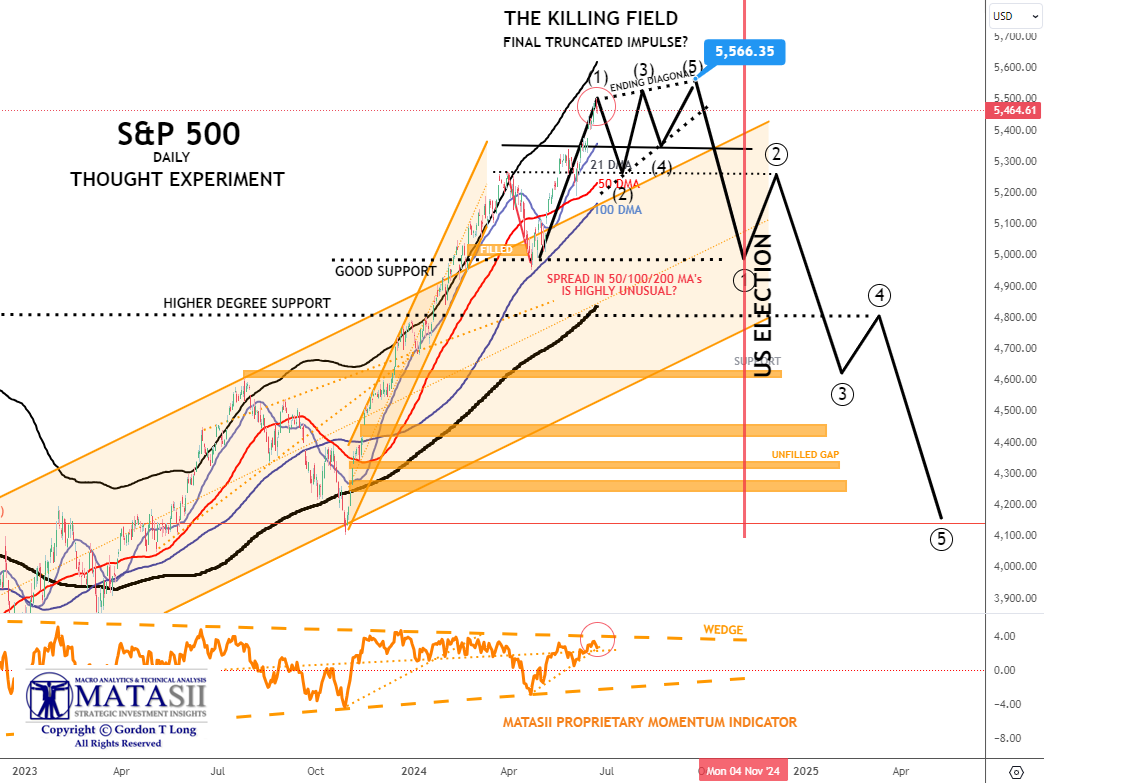
S&P 500 - Daily - Our Thought Experiment
OUR CURRENT ASSESSMENT IS THAT THE INTERMEDIATE TERM IS LIKELY TO LOOK LIKE THE FOLLOWING:
NOTE: To reiterate - "the black labeled activity shown below, between now and July, looks like a "Killing Field", where the algos take Day Traders, "Dip Buyers", the "Gamma Guys" and FOMO's all out on stretchers!"
- The S&P just hit a new all time high this week before pulling back with June Option's "Quadruple-Witch".
- The MATASII Proprietary Momentum Indicator appears to be showing signs of weakening (lower pane) with firm support quite a bit lower. The Friday pull back did find support at a shorter term Momentum trend line (dotted orange line).
- The Divergence in Momentum (lower pane) needs to be noted along with a clear long term ending wedge.
| |
YOUR DESKTOP / TABLET / PHONE ANNOTATED CHART
Macro Analytics Chart Above: SUBSCRIBER LINK
| |
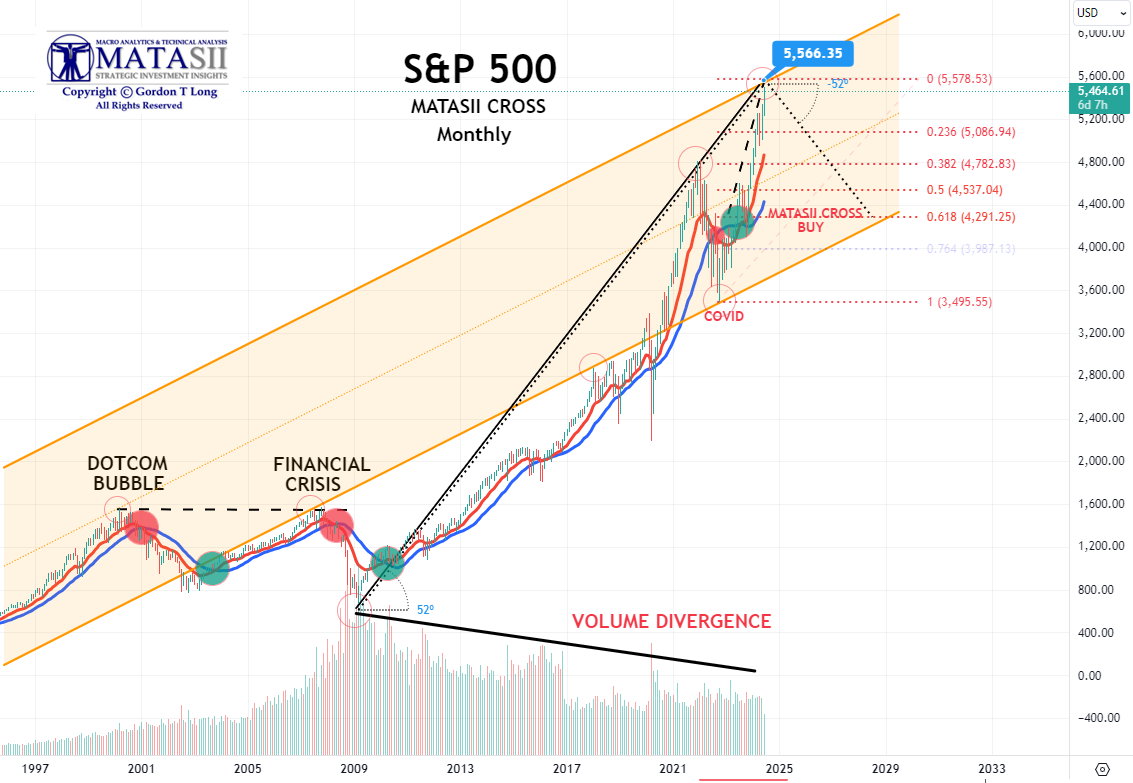
S&P 500 - Monthly - Our Thought Experiment
- We continue to move towards our target of 5566 shown here and on our daily chart (above). We are only 102 points below our target level.
|  | |
STOCK MONITOR: What We Spotted
MONDAY
- US indices were firmer to start the week (SPX +0.8%, NDX +0.9%, RUT +0.8%) with outperformance in the large-cap sectors of Consumer Discretionary and Technology as the latter was buoyed by Micron (MU) (+4.5%) after BofA and Susquehanna raised PT's of the stock ahead of earnings next week.
- Utilities, Real Estate, and Health were the only ones in the red.
- Indices were buoyed by the turnaround in risk sentiment, albeit off no headline driver, as the Dollar saw slight losses and reversed from earlier highs of 105.640 to lows of 105.30.
- As such, the crude complex was also firmer and buoyed by the aforementioned softer Dollar after initial geopolitical tailwinds, as Israeli PM Netanyahu dissolved his war cabinet.
- Despite saying this, precious metals (XAU, XAG) saw slight losses and Treasuries began the week on the backfoot, after last weeks strength, amid consolidation ahead of Fed Speak.
- On Fed speak, Harker (2026 voter) said if his economic forecast plays out, he thinks one rate cut would be appropriate by years end, meanwhile two cuts or none are also quite possible, but it depends on data.
- For the record, NY Fed Manufacturing was better than feared, with the inflationary gauges of prices paid and received encouragingly dipping, although little market reaction was seen.
- Looking ahead, there is a plethora of Fed Speak ahead, with US Retail Sales also on Tuesday, with RBA rate decision overnight.
INFLATION BREAKEVENS: 5yr BEI +4.6bps at 2.181%, 10yr BEI +3.5bps at 2.223%, 30yr BEI +2.8bps at 2.261%.
REAL RATES: 10Y -- 2.0700%
STOCK SPECIFIC
- Autodesk (ADSK): Starboard Value said it has a current stake in the Co., valued at more than USD 500mln.
- TSMC (TSM): Planning to raise prices for 3nm manufacturing by 5% and advanced packaging by 10%-20% starting next year, amid a capacity shortage expected to last through 2026.
- Disney (DIS): 'Inside Out' sees strong debut.
- Tesla (TSLA): Reduced the price of its Model 3 Long-Range AWD vehicles.
- Micron (MU): Ahead of earnings next week, BofA and Susquehanna raised its PT of the stock.
- Steel Dynamics (STLD): Q2 guidance short of expectations.
- BioNTech (BNTX): US FDA placed partial clinical hold on multicenter and first-in-human phase 1 clinical trial sponsored by Medilink.
- Amazon (AMZN): Prime Video has disrupted the streaming ad market, prompting Netflix (NFLX) to lower ad rates and adopt product placement to sustain its ad business amidst rising competition, WSJ reports.
- Adobe (ADBE): FTC said it has taken action against ADBE and executives for hiding fees and preventing consumers from easily cancelling software subscriptions. ADBE said in a statement that it will refute the FTC's claims in court.
- Citigroup (C): FDIC is to vote on Thursday to downgrade C's rating on its data-management systems to a deficiency, according to the WSJ.
- Apple (AAPL): To end in-house Apply Pay Later installment service, according to Bloomberg. AAPL announced Affirm (AFRM) installment integration last week, and will no longer offer new Apple Pay-later loans to users.
- Qualcomm (QCOM): Could be the exclusive SoC supplier of Samsung Galaxy S25 (vs. S24 accounts for about 40%), according to TF International Securities analyst Ming-Chi Kuo.#
TUESDAY
- Indices were contained on Tuesday but edged higher (SPX +0.3%, NDX flat, DJIA +0.2%, RUT +0.2%) as SPX climbed to another record high with Nvidia topping Microsoft's market cap.
- Sectors were largely in the green with Financials and Tech sitting atop of the pile and Communication Services, Consumer Discretionary, and Materials the only ones in the red.
- On the day, there was a deluge of Fed speak (reviews below), although they garnered little market reaction as they ultimately toed a similar line to Fed Chair Powell, while on the data footing US retail sales were softer than expected, but on the contrary industrial production was better than forecasted.
- Moreover, after the aforementioned retail sales T-Notes were bid across the curve, and saw even further impetus after a stellar US 20yr bond auction.
- In FX, the Dollar was choppy but climbed off retail sales-induced lows with the Swissy and Aussie the clear G10 outperformers with the latter buoyed by a hawkish language from the RBA.
- The crude complex was firmer, continuing on Monday's extensive gains, in thin energy-specific news flow as geopolitical headlines took a back seat. Looking ahead,
- it is Juneteenth market holiday in the US on Wednesday so US players will be out for the day, and as such the calendar docket is very thin with only NAHB housing market index scheduled.
INFLATION BREAKEVENS: 5yr BEI +0.2bps at 2.194%, 10yr BEI -0.1bps at 2.228%, 30yr BEI -0.4bps at 2.261%.
REAL RATES: 10Y - 2.0207%
STOCK SPECIFIC
- Boeing (BA) - CEO said in a Senate hearing that the Alaska Airlines door plug incident was a result of a manufacturing defect; Titanium from suppliers has met standards, and here was a very discreet miss with a lack of paperwork for the removal of the door plug in Alaska Airlines January 5th flight. US Senator Blumenthal says there is overwhelming evidence that the Justice Department should pursue prosecution against Boeing. Meanwhile, NASA delayed BA's Starliner spacecraft's return to earth again and is now targeting June 26th.
- Lennar (LEN) - Guidance for next quarter: new orders and deliveries missed expectations. Co. did beat on earnings and revenue. Expects Q3 profit to be between USD 3.50-3.65/shr (exp. 3.93); Exec says given the cost of living expenses and inflation rates, the consumer is definitely feeling a little bit more distress.
- Super Micro Computer (SMCI) - Adding three new manufacturing facilities in Silicon Valley and globally.
- Phillip Morris International (PM) - Swedish Match North America (PM affiliate) is taking steps to immediately ban online sales on ZYN.com after receiving a subpoena from the District of Columbia.
- NextEra Energy (NEE) - Plans to sell USD 2.0bln of equity units, each valued at USD 50.00.
- Silk Road Medicals (SILK) - To be acquired by by Boston Scientific (BSX) for USD 27.50/shr in cash. Note, SILK closed Monday at USD 21.67/shr.
- Citigroup (C) - Said it is confident in its ability to achieve medium-term targets; and it remains on track to meet 2024 guidance. CFO expects net interest income excluding markets to be modestly down this quarter; he expects markets to be down or flat-ish for Q2.
- Apple (AAPL) - EU antitrust regulators have accepted several measures from Apple regarding its tap-and-go payments system and an associated probe, according to FT citing sources. Elsewhere, the Co. suspended work on the next high-end headset and focused on releasing a cheaper model in late 2025, according to The Information.
- Occidental Petroleum (OXY) - Berkshire Hathaway has acquired another 2.95mln shares in the Co. bringing his stake to nearly 29%.
- Chip names - Lawmakers reportedly look to bar Chips Act winners from using Chinese tools, according to Bloomberg; Intel (INTC) and TSMC (TSM) would be unable to buy Chinese gear for US plants.
- Dollar Tree (DLTR) - Was cited by the FDA for selling lead-tainted Apple Sauce; DLTR reportedly kept selling apple sauce after the lead recall.
- Hewlett Packard Enterprise (HPE) and Nvidia (NVDA) - Announced "Nvidia AI computing by HPE" to accelerate the generative AI industrial revolution.
- Embraer (ERJ) - CEO says Co. is confident in meeting 2024 production guidance of 72-80 commercial jets, is eyeing output of 80-90 jets next year. Believes it will be able to return to production of 100 commercial jets per year by 2026 at the latest.
- Nvidia (NVDA) - To reach a deal to buy software startup Shoreline.
WEDNESDAY
US MARKETS CLOSED - JUNETEENTH
THURSDAY
- Stocks were predominantly lower on Thursday with downside led by the Nasdaq with weakness led by AI-darling Nvidia (NVDA) paring from all-time highs despite gains seen in the pre-market.
- SMCI and DELL also pared their pre-market gains (Musk confirmed the two companies' tech is to be used for xAI, but the two stocks failed to hold onto the initial gains).
- Tech was the clear laggard with the majority of sectors green, outperformance was seen in Energy, Utilities and Financials.
- Despite a lack of news explaining the tech downside, it is worth noting it is quad-witching on Friday with Goldman estimating Friday's OpEx will be the largest ever with over USD 5.1tln of notional options set to expire.
- The macro highlights saw a plethora of CB activity and several US data points.
- On the former, the BoE held rates in a 7-2 vote split but the dovish reaction was seen on remarks in the minutes that the decision to hold or cut was "finely balanced" for some.
- The SNB cut rates by 25bps earlier, in line with the consensus, but a third of analysts surveyed expected a hold. Norges Bank left rates unchanged but with hawkish rate guidance.
- Meanwhile, the PBoC maintained its LPR rates as expected overnight. On US data, Initial Jobless Claims fell, but not as much as expected, while Continuing Claims for the week prior saw a notable rise, similar to what was seen in last week's Initial Claims.
- The Housing data surprised to the downside, while the Philly Fed also disappointed, although the Prices Paid rose. T-notes initially spiked on the data before quickly paring in what appears to be preparation for supply next week, as well as entering month/quarter end next week.
- The Dollar was supported by the gains in US yields, which in turn weighed on the Yen but the Franc underperformed after the SNB rate cut.
- Crude prices rallied through the session as geopolitical tensions remained rife despite a larger-than-expected crude stock draw.
INFLATION BREAKEVENS: 5yr BEI +4.2bps at 2.233%, 10yr BEI +3.4bps at 2.256%, 30yr BEI +1.7bps at 2.273%.
REAL RATES: 10Y -- 2.0171%
STOCK SPECIFIC
- Advanced Micro Devices (AMD) - Incurred a data breach involving sensitive information of future products. The company believes the breach will not have a material impact. In addition, Piper Sandler names it a top pick citing “bright prospects” entering H2.
- Apple (AAPL) - A notorious hacker, thought to be behind many recent breaches of large tech companies, has added Apple to the list, according to Forbes.
- Hewlett Packard Enterprise (HPE) - Continues to expect to close the Juniper Networks (JNPR) deal by the end of 2024 or early 2025, in response to the CMA probe.
- Toyota Motor (TM) - To halt six production lines at five plants in Japan from Thursday evening amid parts shortages, according to Chunichi.
- Boeing (BA) - CEO Calhoun faced calls for immediate resignation during a Senate hearing on Boeing's safety culture. Co. is shifting engineers away from X-66A development, according to Air Current
- DELL (DELL) and Super Micro (SMCI): Tesla (TSLA) CEO Musk said in a post on X that Dell and Super Micro Computer will be building the supercomputer for xAI.
- Oracle (ORCL) - To invest over USD 1bln in AI and cloud computing in Spain.ByteDanc and TikTok - Urged US court of appeals to block a law that would compel divestiture or impose ban app on the app in US by January 19th, in a court filing.
- United Airlines (UAL) - Expects 2024 July 4th weekend to be the busiest on record with over 5mln passengers expected to fly with UAL between June 28th and July 8th. Forecasts summer 2024 travel season will be 5% higher than 2023.
- Boyd Gaming (BYD) - Made an acquisition approach to Penn Entertainment (PENN), according to Reuters citing sources. BYD would also need to win over Walt Disney (DIS), which through its sports network ESPN has a partnership with PENN. Sources said there was no certainty PENN would engage in negotiations with Boyd.
EARNINGS
- Accenture (ACN) - Raised its revenue growth forecasts and reaffirmed its FY24 cash flow. Note, the company missed on EPS and revenue in its Q1 report.
- Kroger (KR) - Beat on Q1 top and bottom line. Exec said Q1's better-than-expected performance from the grocery business helped offset results in the health and wellness business and spending from premium and mainstream customers continue to be strong.
- KB Home (KBH) - EPS, revenue, and deliveries surpassed expectations alongside raising FY housing revenue view.
FRIDAY
- Stocks ultimately finished with a downside bias on quad witching with some notable chop into the closing bell, particularly in AAPL and AMZN shares while NVDA were lower throughout the majority of the session, adding to the losses seen Thursday.
- The main macroeconomic highlight was the flash PMI data from the US which came in hotter than expectations but alongside some optimistic commentary on inflation.
- The European PMI data however was largely disappointing across the board.
- Fixed income settled flat across the curve with morning upside in wake of the European PMIs offset by the downside seen after the hot US data.
- Crude prices were lower throughout the session with the hot PMI data weighing.
- The Dollar saw mild gains, while the Yen lagged to see USD/JPY back above 159.00 with participants cautious of intervention c. 160.
- Attention next week turns to Treasury supply as well as US PCE and GDP data.
INFLATION BREAKEVENS: 5yr BEI -3.3bps at 2.205%, 10yr BEI -2.1bps at 2.237%, 30yr BEI -2.4bps at 2.252%
REAL RATES: 10Y -- 2.022%
STOCK SPECIFIC
- Spirit AeroSystems (SPR): Boeing (BA) is close to a deal to buy back the Co, as BA aims to stabilize its supply chain after its 737 MAX woes.
- Boeing (BA): DoJ expected to allow Boeing to escape criminal prosecution for violating terms of 2021 settlement related to problems with 737 MAX 8, according to the New York Times. However, DoJ later said they have not made a decision.
- Apple (AAPL): Will not roll out AI features in the EU this year because of the Digital Marketing Act (DMA), according to Bloomberg.
- Amazon (AMZN): Mulling a USD 5-10/month fee for Alexa with revamped AI, according to Reuters sources.
- Sarepta Therapeutics (SRPT): FDA approved the expansion of Elevidys' indication for Duchenne muscular dystrophy to include patients aged 4 and older with confirmed DMD gene mutations.
- Visa (V), Mastercard (MA): China is urging Visa and Mastercard to reduce bank card transaction fees for foreign visitors to facilitate payments, Bloomberg reported.
- Chevron (CVX), Hess (HES), Exxon Mobil (XOM): Arbitration panel deciding on Chevron's USD 53bln purchase of Hess remains incomplete, stalling a decision on whether Exxon has a right of first refusal over Hess' Guyana operations.
- Nike (NKE): Upgraded at Oppenheimer. Asana (ASAN): Announced a USD 150mln share buyback, and affirmed Q2 and FY25 guidance.
- Delta Air Lines (DAL): Raised quarterly dividend by 50% to USD 0.15/shr (prev. 0.10/shr).
- Eli Lilly (LLY): Cos. tirzepatide reduced obstructive sleep apnea (OSA) severity, with up to 51.5% of participants meeting the criteria for disease resolution. LLY submitted tirzepatide for the treatment of moderate-to-severe OSA and obesity to the US FDA and will initiate submissions for other global regulatory agencies in the coming weeks. In both studies, tirzepatide achieved all primary and secondary endpoints.
- Tesla (TSLA): Downsized by at least 14% this year after CEO Musk said layoffs would exceed 10%, according to CNBC.
| |
CONTROL PACKAGE
There are FIVE charts we have outlined in prior chart packages that we will continue to watch closely as a CURRENT "control set":
- The 10Y TREASURY NOTE YIELD - TNX - HOURLY (CHART LINK)
- The 10Y TREASURY NOTE YIELD - TNX - DAILY (CHART LINK)
- The 10Y TREASURY NOTE YIELD - TNX - WEEKLY (CHART LINK)
- The 30Y TREASURY BOND YIELD - TNX - WEEKLY (CHART LINK)
- REAL RATES (CHART LINK)
FISHER'S EQUATION = 10Y Yield = 10Y INFLATION BE% +REAL % = 2.235% + 2.022% = 4.257%
20YR: The USD 13bln auction of 20yr bonds was ultimately very strong. The auction saw a high yield of 4.452%, stopping through the when issued by 2.8bps, the largest stop-through since November 2022, and much larger than the prior stop-through of 0.2bps and the six auction average of a tail of 0.1bps. The B/C ratio was also strong at 2.74x, above the prior 2.51x and average of 2.6x. The strong demand was led by Indirect bidders, which took 77.9% of the auction, well above the prior 70.8% and average of 67.8%. Direct demand saw a step back to 16.4% from 19.2%, beneath the 18.9% average, although the sizable increase from indirect bidders saw dealers, forced surplus buyers, take just 5.8% of the auction, down from the prior 10.1% and average of 13.3%.
| |
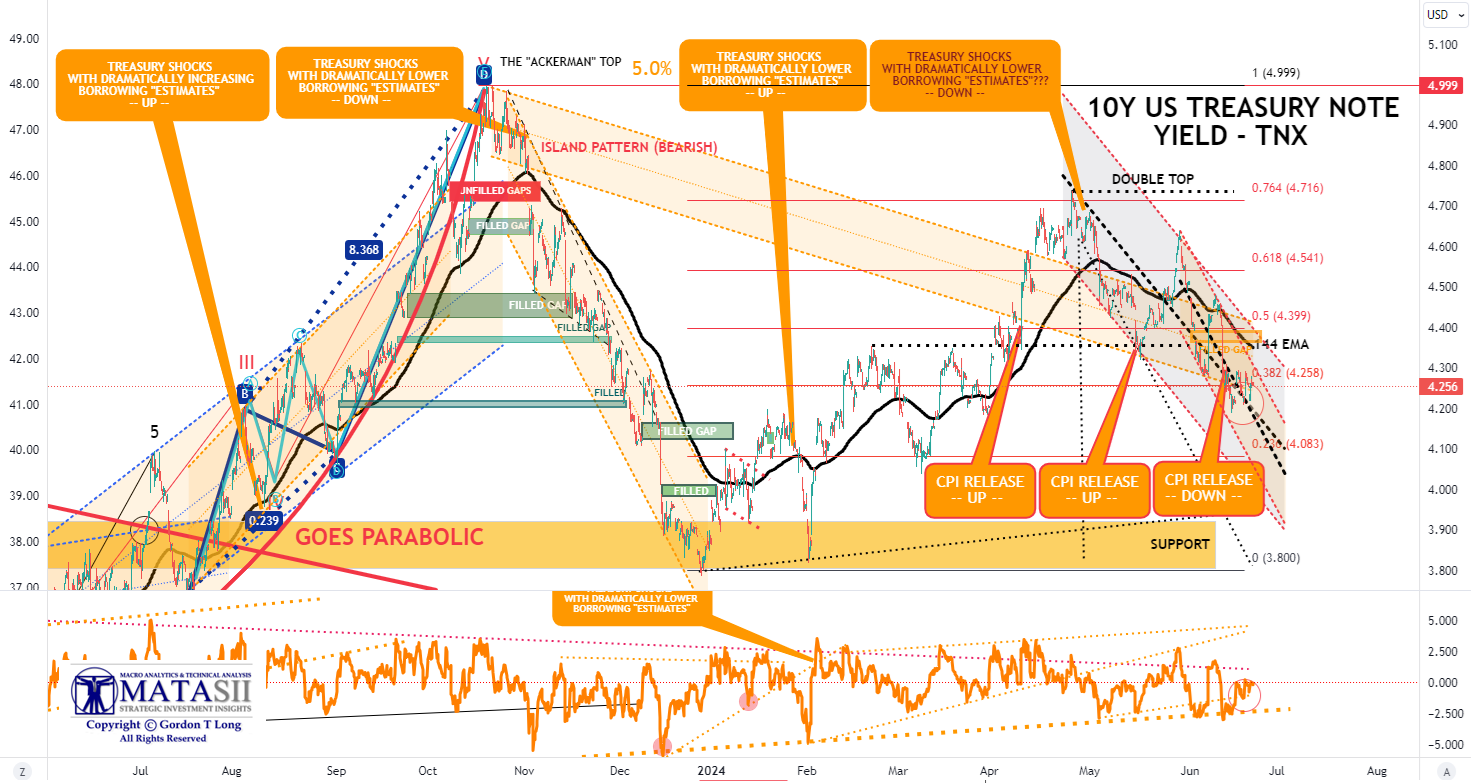
10Y UST - TNX - Hourly
- The TNX plunged on the release of the May CPI finding support again at the descending long term trend channel's lower boundary line before beginning a retracement lift.
- Importantly in the near term is that Momentum (lower pane) appears to have reached a longer term support level and appears to be trying to rise. This suggests a test of the 144 EMA is likely ahead next week.
| |
YOUR DESKTOP / TABLET / PHONE ANNOTATED CHART
Macro Analytics Chart Above: SUBSCRIBER LINK
| |
NOTICE Information on these pages contains forward-looking statements that involve risks and uncertainties. Markets and instruments profiled on this page are for informational purposes only and should not in any way come across as a recommendation to buy or sell in these assets. You should do your own thorough research before making any investment decisions. MATASII.com does not in any way guarantee that this information is free from mistakes, errors, or material misstatements. It also does not guarantee that this information is of a timely nature. Investing in Open Markets involves a great deal of risk, including the loss of all or a portion of your investment, as well as emotional distress. All risks, losses and costs associated with investing, including total loss of principal, are your responsibility.
FAIR USE NOTICE This site contains copyrighted material the use of which has not always been specifically authorized by the copyright owner. We are making such material available in our efforts to advance understanding of environmental, political, human rights, economic, democracy, scientific, and social justice issues, etc. We believe this constitutes a ‘fair use’ of any such copyrighted material as provided for in section 107 of the US Copyright Law. In accordance with Title 17 U.S.C. Section 107, the material on this site is distributed without profit to those who have expressed a prior interest in receiving the included information for research and educational purposes. If you wish to use copyrighted material from this site for purposes of your own that go beyond ‘fair use’, you must obtain permission from the copyright owner.
========
| |
MATASII'S STRATEGIC INVESTMENT INSIGHTS | |
2020 VIDEOS OUTLINING THE COMING RISE IN INFLATION, STAGLFLATION & COMMODITY PRICES | |
|
THE REGULATORY STATE
RELEASED - 01-17-24 --- 212 Page Paper
FULL 212 PAGE PDF DOWNLOAD
| |
IDENTIFICATION OF HIGH PROBABILITY TARGET ZONES | |
Learn the HPTZ Methodology!
Identify areas of High Probability for market movements
Set up your charts with accurate Market Road Maps
Available at Amazon.com
| |
The Most Insightful Macro Analytics On The Web | | | | |