|
UnderTheLens - MAY 2024
Macro Analytics - 04/29/24
| |
THE US GOVERNMENT NOW OFFICIALLY A "ZOMBIE"!
OBSERVATIONS: US GOVERNMENT NOW REQUIRED TO BORROW TO PAY DEBT INTEREST!
A Corporation is classified as a "Zombie" corporation when its interest payments are larger than its profits and it must borrow to pay the interest on its debt.
The US has now crossed that Minsky Moment and is presently forced to issue debt just to pay the interest on its existing debt. You don't have to be an accountant to understand this is a problem. You are now "borrowing from Peter to pay Paul"!
We are actually being kind in classifying the US Government as a "Zombie" entity versus labelling it what some some would simply call a Ponzi Scheme. In a Ponzi scheme you must attract new buyer money to pay the existing buyers expected or promised returns. In this case isn't that really the same thing??
- This year's deficit is on track to be +6-7% of GDP or ~$1.8 - 2.1T.
- This year's interest on the debt is expected to be a matching amount of ~1.8T - 2.1T.
- The Current 12m cumulative spending is $1.7T.
- The US Treasury has spent $1T in the last 100 days.
- The US budget deficit has averaged 9% over last 4 years.
The interest on the US debt now dwarfs the spending on the US Military and even the US Military-Surveillance Complex. How can this be sustained?
Last week Congress passed and Biden excitedly signed off on an unbudgeted additional $95B spending bill which includes:
- $61 billion to Ukraine
- $26 billion to Israel and
- $8 billion for Taiwan
Why is the US borrowing money, then paying interest on the loan to then give the money away? Why doesn't the receiving country borrow the money directly? Israel and Taiwan aren't broke with better Debt-to-GDP lending credit than us?? Minimally, why doesn't the UN or IMF guarantee the loan? Why doesn't the US guarantee the loan as part of foreign aid? No - we prefer to ===>
| |
 | |
THIS WEEK WE SAW
Exp=Expectations, Rev=Revision, Prev=Previous
US
US GDP Advance (Q1) 1.6% vs. Exp. 2.4% (Prev. 3.4%)
US Core PCE Prices Advance (Q1) 3.7% vs. Exp. 3.4% (Prev. 2.0%)
US S&P Global Manufacturing Flash PMI (Apr) 49.9 vs. Exp. 52.0 (Prev. 51.9)
US S&P Global Services Flash PMI (Apr) 50.9 vs. Exp. 52.0 (Prev. 51.7)
US Durable Goods (Mar) 2.6% vs. Exp. 2.5% (Prev. 1.3%, Rev. 0.7%)
===> add debt payments to the treasury auction market handled by the US money center banks. (We will save that discussion for another day!)
For the sake of full disclosure, if anyone cared enough to actually read the bill (you pay me to do that), you will find $3.5 billion buried in the Israel detail for "Migration and Refugee Assistance" for the State Department to "address humanitarian needs of vulnerable populations and communities." This is what the State Department uses to pay the NGOs coordinating the illegal invasion at our southern border, and providing all the freebies once there in the US. All part of the $1.3T cost of illegal immigration I outlined in your last newsletter.
Does any of this pass your common sense test or have we all become just mental "Zombies"?
| |
========================= | |
|
WHAT YOU NEED TO KNOW!
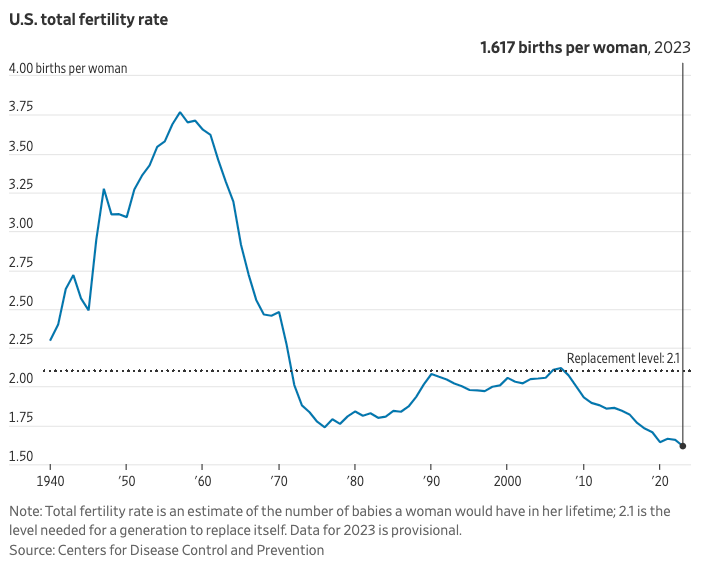
IS THIS THE REASON WHY MASS IMMIGRATION IS A PREOCCUPATION OF THE LEFT??
America's declining total fertility rate peaked at 3.75 births per woman after World War II and has since collapsed to about 1.617, well below the replacement rate of 2.1.
A nation without children is a nation without a future. The intersection of deaths exceeding births per year now appears imminent.
With the total birth rate well under the level of replacement since 2007, it might be argued this is why the Biden administration has facilitated the greatest illegal alien invasion the US nation has ever seen? We can only hope?
RESEARCH
YELLEN'S ELECTION YEAR BAZOOKA
- Yellen faces the rising need to:
- Offset the Fed's need for rates to be "higher for longer" to enable ongoing fight against inflation, while at the same time -
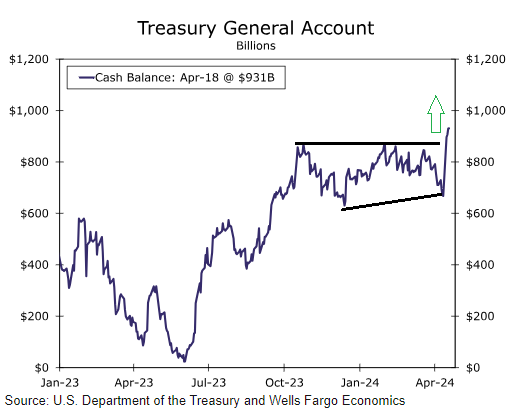
- Pump liquidity into the system through the Treasury General Account.
- Yellen now has nearly $1 trillion in the TGA, but minimally $208B additional cash available as a potential “risk-on” catalyst for equities and broad assets to bridge markets fighting higher rates until the election ballots are cast.
- THIS IS POTENTIALLY LARGE ENOUGH TO TRIGGER A SHORT SQUEEZE IN THE BOND MARKETS (Falling Bond Yields, Rising Bond Prices, Rising Dollar, Weaker Precious Metals).
2024 Q1 EARNINGS
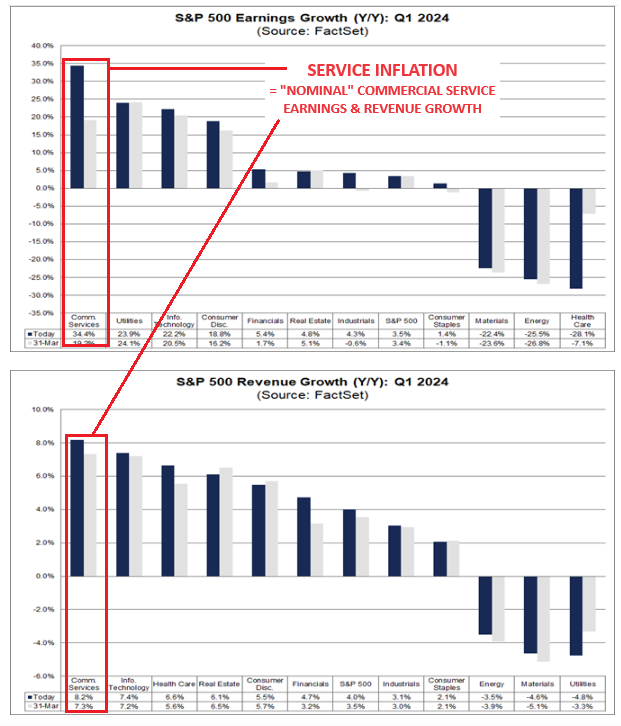
- When Commercial Services becomes the Earnings & Revenue Leader, it confirms what you need to know about Earnings Season. Both are measured in Nominal versus Real terms. The largest increase currently in Inflation is SERVICES.
- NOMINAL RESULTS = REPORTED RESULTS.
- Real results are not reported BUT that is what you get to spend (after taxation payments) on the investment risk you took!
- On a risk adjusted basis, after tax and then adjusted for inflation - are you really getting the return you think??
| |
|
DEVELOPMENTS TO WATCH
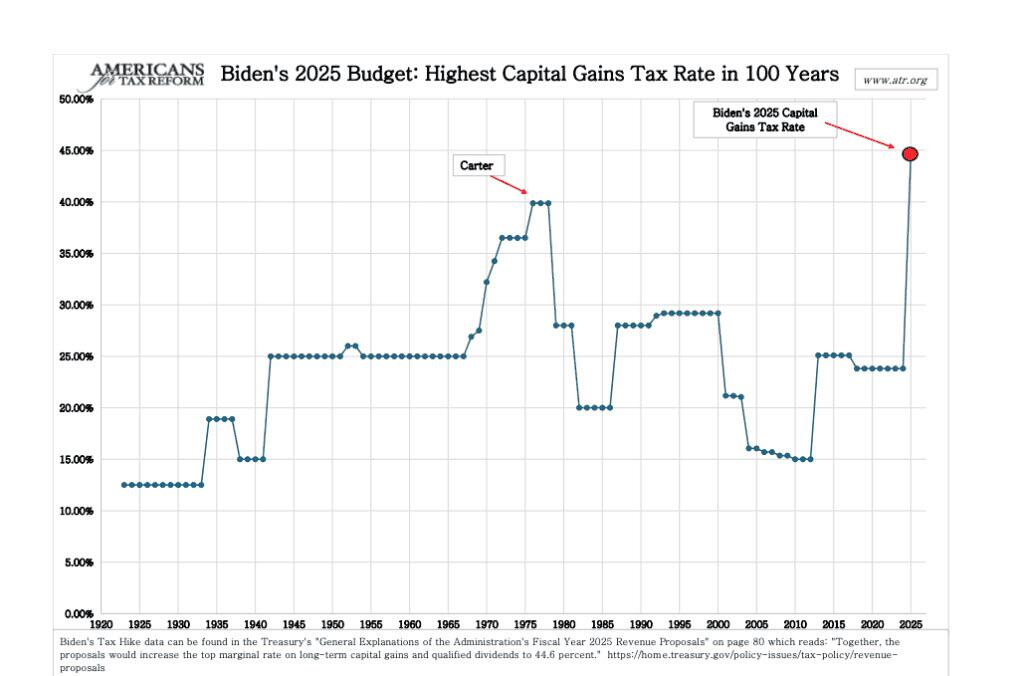
44.6% CAPITAL GAINS PLUS TAXING UNEARNED CAPITAL GAINS?
Biden’s 2025 budget calls for about $5 trillion in tax increases over the next decade. Here are a few of the ways:
- Increase Capital Gains Tax to 44.6%
- Increase Corporate Tax Rate to 28%
- Tax Unrealized Capital Gains for the first time in US history
- Repeal President Trump’s 2017 Tax Cuts and Jobs Act
YELLEN'S OWN US TREASURY BUYBACK PROGRAM??
- Why rely on the Fed for a QE Program? Yellen sees the US Treasury having its own program!!
- The first Treasury buyback program in more than 20 years has already conducted limited buyback tests this month and indicated that it will announce the date of its first regular operation as part of next Wednesday's quarterly refunding announcement.
- "Dealers have noted that they expect robust participation in operations that occur in the late morning or early afternoon, with several suggesting that timing of auctions should be taken into account and conducting buybacks leading [up to] an auction would be helpful."
| |
|
GLOBAL ECONOMIC REPORTING
-
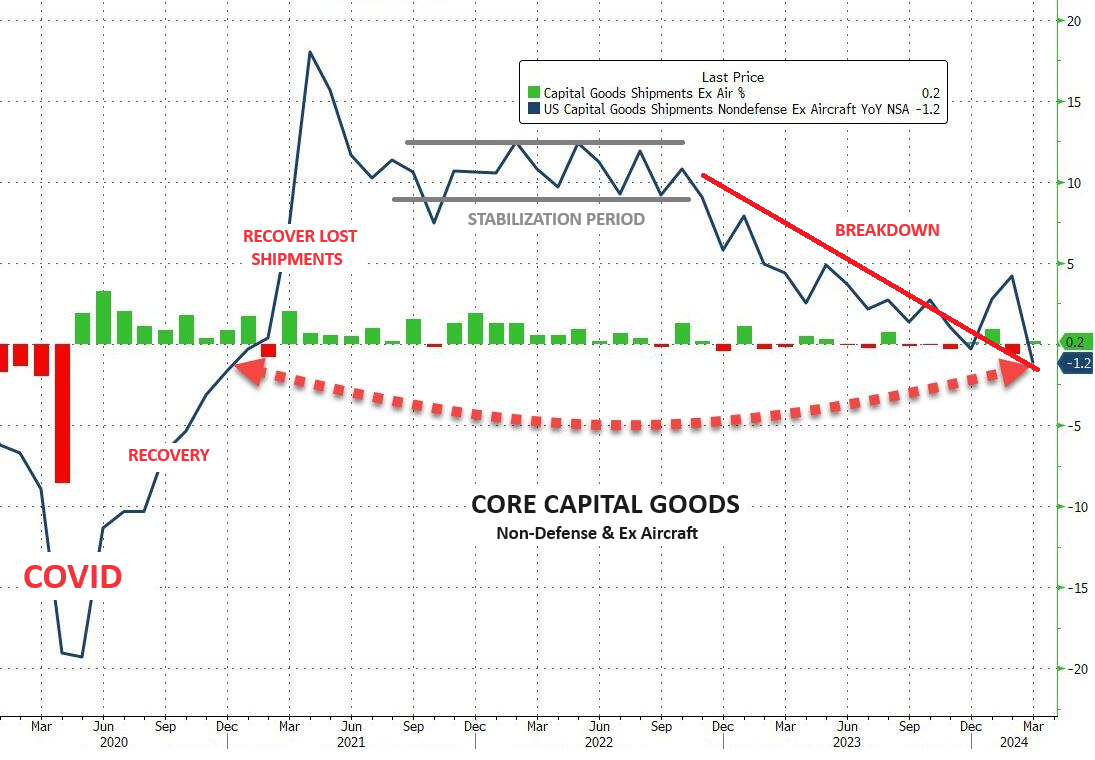
DURABLE GOODS ORDERS - Watching the Core!
- Below the headline number and quite problematic is Core Capital Goods Shipments. This is used to help calculate equipment investment in the government’s gross domestic product report. It saw only a small 0.2% MoM rise. This left core shipments down 1.2% YoY - the biggest YoY drop since the COVID lockdowns.
-
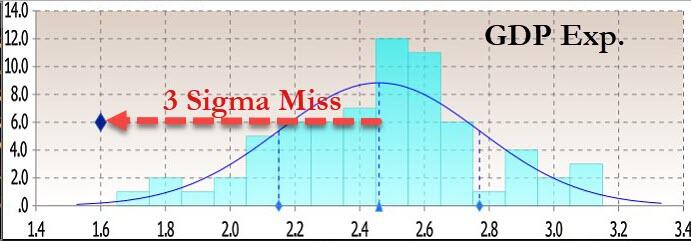
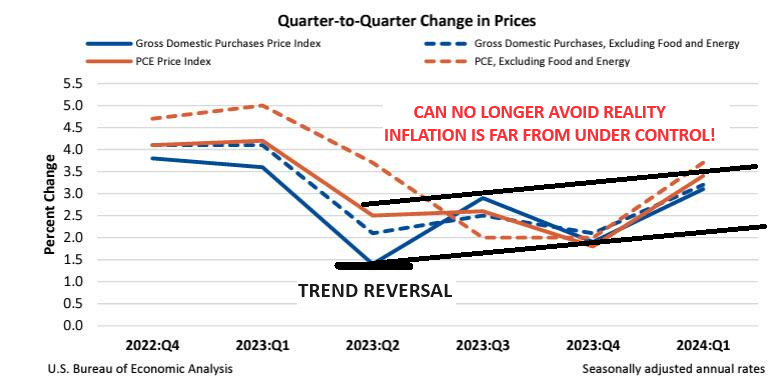
Q1 GDP - 3 Sigma Miss With Lowest Print In 2 years
- US GDP unexpectedly collapsed to just 1.6%, down more than 50% from the Q4 print of 3.4%, the lowest print since Q2 2022 when the US underwent a brief technical recession.
- The GDP Deflator (price index) came in at 3.1%, hotter than the 3.0% expected and almost double the 1.6% in Q4.
- Worse, the all important core PCE for Q1 soared from 2.0% to 3.7%, blowing away estimates of 3.4%, (we will get a more accurate core PCE print tomorrow for the month of March) and suggesting that the US is about to not only not pass go and overshoot soft-landing island completely, but crash-land straight into a stagflationary recession.
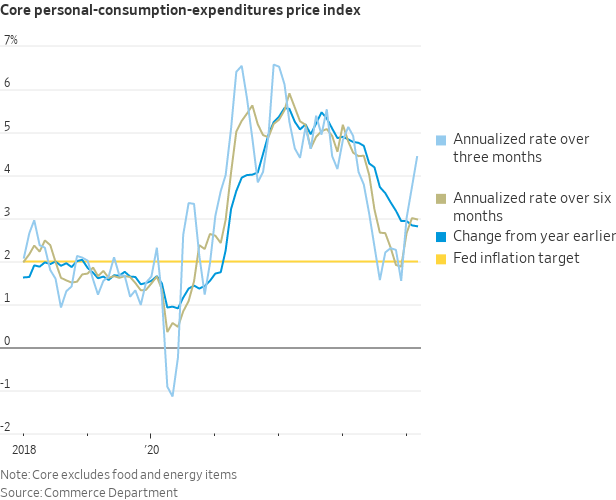
- CORE PCE PRICE INDEX
- The closely watched 3-Month annualized core PCE jumped to 4.4%.
| |
|
In this week's "Current Market Perspectives", we focus on the signals that sentiment, fundamentals and various markets (Credit, Bond and Equity) are currently giving us.
=========
| |
|
YELLEN'S ELECTION YEAR BAZOOKA
My recent UnderTheLens subscriber video entitled: "Yellen's China Showdown" (video right) outlined the funding problems facing Yellen's Treasury. I said:
"We have watched Yellen closely for a few years now and the one thing we are certain of is that she is a master manipulator and can be counted on to come up with a devious way to achieve what she needs."
We then predicted how one of the plans she had devised was to alter the banks' Supplementary Leverage ration (SLR) to unleash the banks to increase holding of US Treasury securities.
Yellen faces the rising need to:
- Offset the Fed's need for rates to be "higher for longer" to enable ongoing fight against inflation, while at the same time -
-
Pump liquidity into the system through the Treasury General Account.
With the $1 trillion increase in government debt every 3 months and suddenly a less pressing need to issue Bills, to drain the Reverse Repo facility, and generally to empty US systemic liquidity to a precarious level where bank reserves could spark another code red and/or bank crisis, an additional venue was needed.
YELLEN HAS ALSO LOADED "THE ELECTION BAZOOKA"
- The Treasury projected a cash balance of $750BN at March 31 and then again at June 30 in its most recent quarterly Sources and Uses of funds forecast published in late January.
- Treasury cash soars by $173BN on April 15 to $897BN, as taxes come in; this is the highest in two years and gives TSY $150BN in stimmy dry powder (less Bill issuance, less RRP drain).
-
As of 04/25/24, there was some $955 billion in the Treasury's General Account (i.e. how much cash the Treasury has at hand), or $205 billion more than the Treasury had expected.
Yellen now has nearly $1 trillion in the TGA, but minimally $208B additional cash available as a potential “risk-on” catalyst for equities and broad assets to bridge markets fighting higher rates until the election ballots are cast.
THIS IS POTENTIALLY LARGE ENOUGH TO TRIGGER A SHORT SQUEEZE IN THE BOND MARKETS
(Falling Bond Yields, Rising Bond Prices, Rising Dollar, Weaker Precious Metals).
According to the well followed Nomura strategist, Charlie McElligott and reported by Tyler Durden,..
In theory, the realization - as soon as next week's Quarterly Refunding - is that the Treasury would need far less debt issuance and could in fact provide substantial liquidity to offset any near-term QT, would be a “surprise,” but he has "high conviction" it will happen, and is therefore "of the view that it’s again being grossly underpriced."
"... get ready for the potential that Janet Yellen’s Treasury could see them again attempting to pump the breaks on the Rates move, similar to last Fall, through another QRA refunding surprise (and White House fiscal spending spree via the rebuilt TGA in the months ahead)....intervening in order to facilitate actions which will help to offset the Fed having to
delay / postpone rate cuts."
ADDITIONAL RESEARCH: Wells Fargo - Treasury Refunding Preview: Taking a Breather
| |
|
2024 Q1 EARNINGS
KEY METRICS
Earnings Scorecard: For Q1 2024 (with 46% of S&P 500 companies reporting actual results), 77% of S&P 500 companies have reported a positive EPS surprise and 60% of S&P 500 companies have reported a positive revenue surprise.
Earnings Growth: For Q1 2024, the blended (year-over-year) earnings growth rate for the S&P 500 is 3.5%. If 3.5% is the actual growth rate for the quarter, it will mark the third straight quarter of year-over-year earnings growth
for the index.
Earnings Revisions: On March 31, the estimated (year-over-year) earnings growth rate for the S&P 500 for Q1
2024 was 3.4%. Eight sectors are reporting higher earnings today (compared to March 31) due to positive EPS
surprises.
Earnings Guidance: For Q2 2024, 19 S&P 500 companies have issued negative EPS guidance and 20 S&P 500
companies have issued positive EPS guidance.
Valuation: The forward 12-month P/E ratio for o for the S&P 500 is 20.0. This P/E ratio is above the 5-year average
(19.1) and above the 10-year average (17.8).
Q1 EARNINGS & REVENUE LEADER - Commercial Services
When Commercial Services becomes the Earnings & Revenue Leader, it confirms what you need to know about Earnings Season. Both are measured in Nominal versus Real terms. The largest increase currently in Inflation is SERVICES.
NOMINAL RESULTS = REPORTED RESULTS
Real results are not reported BUT that is what you get to spend (after taxation payments) on the investment risk you took!
On a risk adjusted basis, after tax and then adjusted for inflation - are you really getting the return you think??
|  | |
MISSES v BEATS
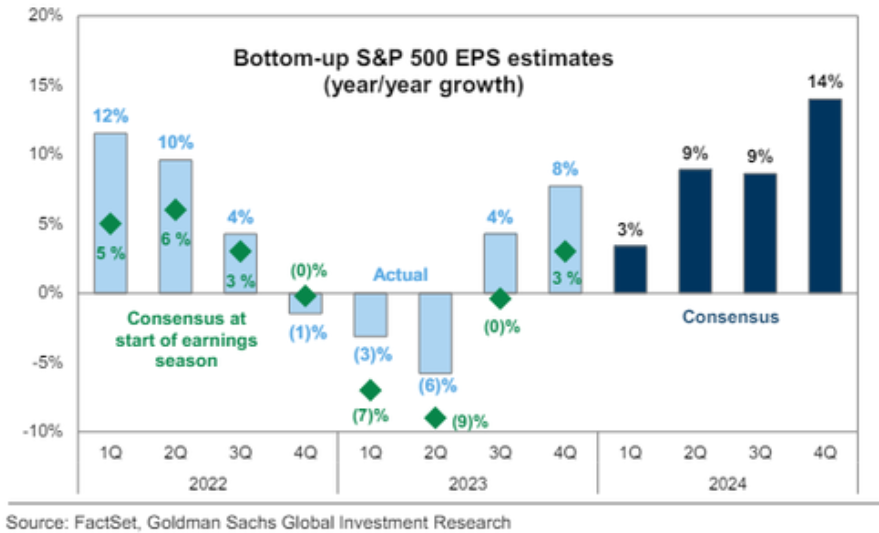
Consensus estimates for Q1 earnings are a very low bar, with S&P 500 YoY growth of 3% vs 8% realized in 4Q23. (chart right)
As a result, significantly more companies are beating consensus estimates by at least 1 std dev, and fewer are missing (when compared to historical averages). However beats are not being rewarded and misses are getting severely punished.
- 228 S&P 500 companies have reported Q1 results (55% of total market cap, with 24% of cap reporting next week).
- Of these reporters, 63% have beat consensus earnings estimates by >1SD, (significantly higher than historical avg of 48%), and only 10% of companies have missed estimates by >1SD, (less than historical avg of 13%).
- Firms beating earnings estimates by at least 1SD have only outperformed the S&P 500 by +16bps on the trading session directly after reporting (vs historical avg of +101bps of outperformance).
- Meanwhile, companies missing earnings estimates by at least 1 SD have underperformed the S&P 500 by -362bps (vs historical avg of -211bps of underperformance), which makes Q1 the most punitive earnings season since 2019.
While the market had low expectations of earnings entering Q1 season, even when companies beat - and in many cases they beat by a lot - the market is barely rewarding them, while it is dramatically punishing the misses.
It is almost as if any growth/margin upside is taken for granted while those companies which disappoint are viewed as
the avant-garde of the coming recession, and traded accordingly.
| |
META
Meta stock may have gotten battered worse (chart below) if it was not for its AI commitment (chart right).
Meta's top- and bottom-line beat expectations in Q1:
- META PLATFORMS 1Q REV. $28.65B, EST. $27.67B
- META PLATFORMS 1Q EPS $2.20, EST. $2.01
Under the hood, Ad Revenue beat:
- META PLATFORMS 1Q AD REV. $28.10B, EST. $26.76B
- META 1Q FAMILY OF APPS OPER INCOME $11.22B, EST. $10.32B
However, Meta's outlook came in at the lowest end of expectations:
- META PLATFORMS SEES 2Q REV. $29.5B TO $32B, EST. $29.48B.
But Zuckerberg remains optimistic, of course...
"We had a good quarter and our community continues to grow," said Mark Zuckerberg, Meta founder and CEO.
"Our AI work is driving good results across our apps and business. We're also becoming more efficient so we can build better products faster and put ourselves in a stronger position to deliver our long term vision."
But Reality Labs (the Metaverse builders) saw a smaller revenue than expected and a larger than expected operating loss:
- META PLATFORMS 1Q REALITY LABS REV. $339M, EST. $613.1M
- META 1Q REALITY LABS OPER LOSS $3.99B, EST. LOSS $3.8B
| 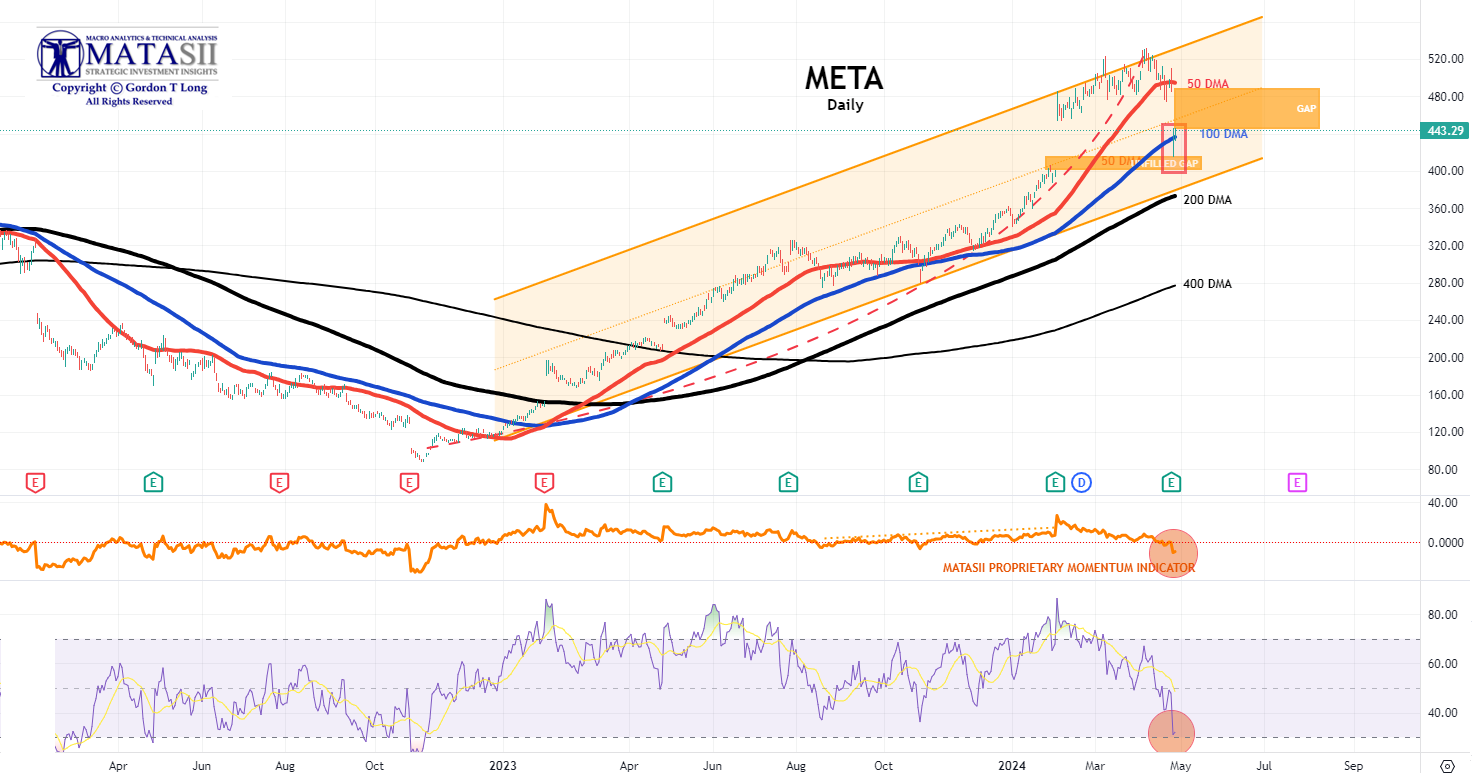 | |
YOUR DESKTOP / TABLET / PHONE ANNOTATED CHART
Macro Analytics Chart Above: SUBSCRIBER LINK
| |
GOOGLE - ALPHABET
- EPS $1.89, beating estimate $1.53, and up more than 50% vs the $1.17 a year ago
- Q1 Revenue $80.54 billion, beating the estimate of $79.04 billion, and up 15% YoY
- Google advertising revenue $61.66 billion, beating the estimate $60.18 billion
- YouTube ads revenue $8.09 billion, beating the estimate $7.73 billion
- Google Services revenue $70.40 billion, beating the estimate $69.06 billion
- Google Cloud revenue $9.57 billion, beating the estimate $9.37 billion
- Other Bets revenue $495 million, beating estimate $372.4 million
- Operating income $25.47 billion, beating estimate $22.4 billion
- Google Services operating income $27.90 billion, beating the estimate $24.3 billion
- Google Cloud operating income $900 million, beating the estimate $672.4 million
- Other Bets operating loss $1.02 billion, beating the estimate loss $1.12 billion
- Operating margin 32%, beating the estimate 28.6%
- Capital expenditure $12.01 billion, beating the estimate $10.32 billion
- Number of employees 180,895, down from 190,711
- A quick point on YouTube: it was bought by Google in 2006 for $1.65 billion; YouTube now generates $1.65 billion of revenue every 18 days.
| 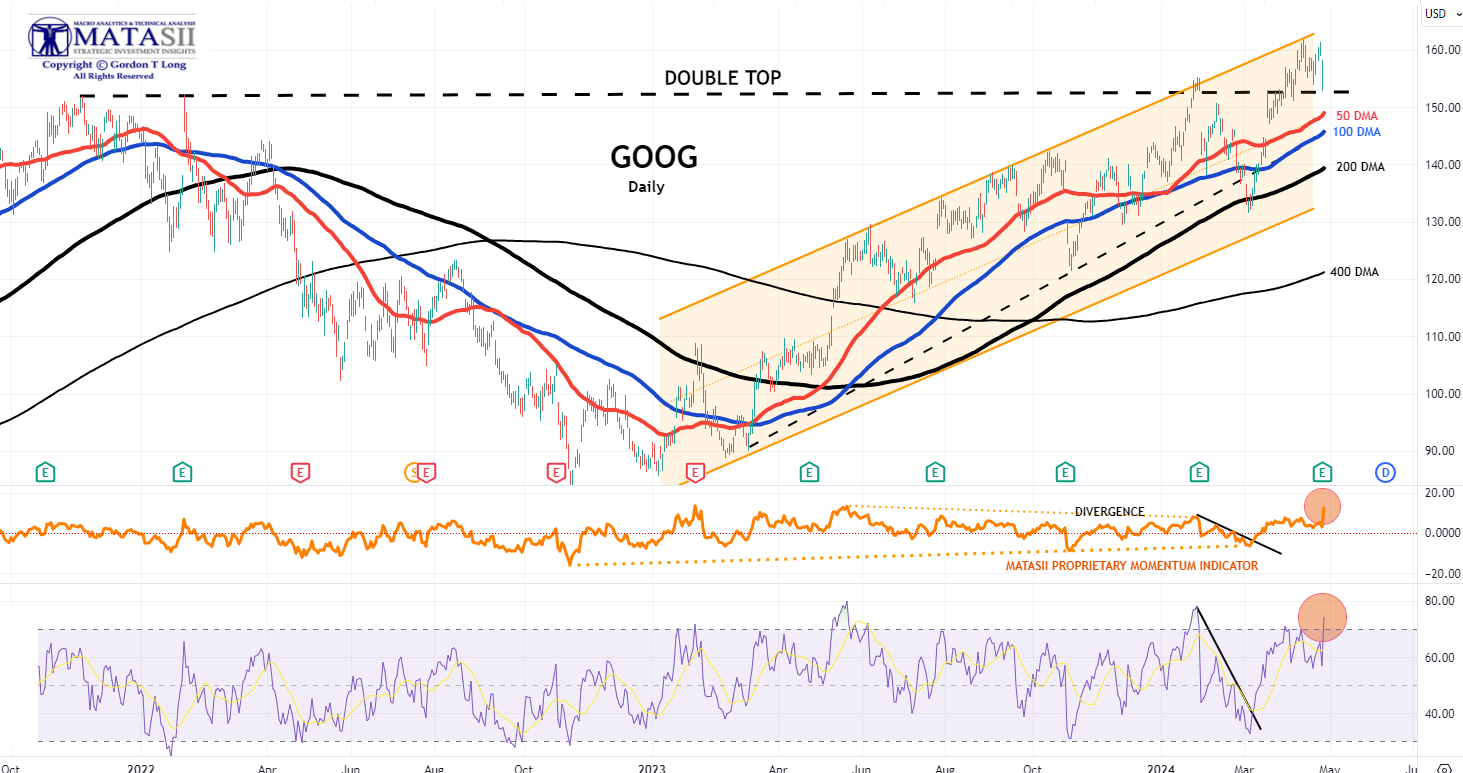 | |
YOUR DESKTOP / TABLET / PHONE ANNOTATED CHART
Macro Analytics Chart Above: SUBSCRIBER LINK
| |
REPORTING THIS WEEK
TUESDAY
EUROPE
- Nucor Corp (NUE) Q1 2024 (USD): EPS 3.46 (exp. 3.66), Revenue 8.14bln (exp. 8.26bln). Expects earnings to decrease in Q2 vs Q1 due to decreased earnings in the steel mills segment. Average scrap and scrap substitute cost per gross ton USD 421 (exp. 399.58). Sales tons to outside customers 6.22mln (exp. 6.41mln).
- SAP (SAP GY) Q1 24 (EUR): Adj. EPS 0.81 (exp. 0.89), adj. revenue 8.04bln (exp. 8.03bln). Adj. cloud and software revenue EUR 6.96bln (exp. 6.93bln). Adj. cloud revenue EUR 3.93bln (exp. 3.94bln). Adj. cloud revenue in constant currencies +25% (exp. +24.5%). Adj. operating profit EUR 1.53bln (exp. 1.7bln). GUIDANCE: Cloud revenue view between 17.0-17.3bln (prev. 13.66bln in 2023). Cloud and software revenue view at EUR 29.0-29.5bln (prev. 26.92bln in 2023) Adj. Operating profit view EUR 7.6-7.9bln (prev. 6.51bln in 2023). Raises 2023 dividend 7% to EUR 2.20/shr vs 2022 dividend. (Newswires) SAP ADR (SAP) rose 2.1% in the US after-hours. Index Weightings: DAX 40 (10.9% - largest), Euro Stoxx 50 (5% - third largest), Stoxx 600 (1.3%).
- Renault (RNO FP) Q1 (EUR): Revenue 11.71bln (exp. 11.7bln). Sales +2.6% Y/Y. Strong order book in Europe, reflecting a very good start to the year. Co. is progressing well toward its target of cost reduction to lower EV costs by 40%. The EV market is a bit slower than had expected a few years ago. Talks with Geely and Aramco on the ICE powertrain JV are at an advanced stage.
- Novartis (NOVN SW) Q1 (USD): Revenue 11.8bln (exp. 11.5bln). Core EPS 1.80 (exp. 1.73); Raises FY24 Net Sales and Core Operating Income guidance. Strong sales momentum in Entresto (+36% cc), Cosentyx (+25% cc), Kesimpta (+66% cc), Kisqali (+54% cc), Pluvicto (+47% cc) and Leqvio (+139% cc). Free cash flow 2.0bln (-24%) - declined due to a prior-year one-timer and timing of payments. Novartis proposes Dr. Giovanni Caforio as Chair of the Board of Directors at AGM 2025. Index Weightings: SMI (15.9% - second largest), Stoxx 600 (2%). Net Sales are expected to grow high-single to low double-digit digits. Core operating income is expected to grow low double-digit to mid-teens.
US
- Apple (AAPL) iPhone sales in China -19% in Q1 and down 24% Y/Y in the first six weeks of the year, according to Bloomberg citing Counterpoint Research.
- Cadence Design Systems (CDNS) -1%: Next quarter's guidance was very light.
- In the industrials space, Lockheed Martin (LMT) (-0.5%) earnings topped but closed lower while General Electric (GE) (+8.5%) profit beat with a strong FY guidance. However, JetBlue (JBLU) (-19%) FY outlook disappointed as it now sees FY revenue down low single digits.
- In Materials, Sherwin-Williams (SHW) (-2.5%), Cleveland-Cliffs (CLF) (-11%), and Nucor (NUE) (-9%) all missed on EPS and revenue, and while Packaging Corporation of America (PKG) (-5%) Q1 metrics topped, next quarter profit view was light.
- Spotify (SPOT) +11.5%: Surpassed Wall St. expectations on both EPS and revenue.
- For Discretionary names, General Motors (GM) (+4.5%) report impressed accompanied by lifting FY guidance. In the housing space, PulteGroup (PHM) (+4.5%) EPS and revenue exceeded expectations. However, LKQ Corp (LKQ) (-15%) missed on the top and bottom line alongside lowering its FY revenue growth view.
- Kimberly-Clark (KMB) +5.5%: Metrics topped and raised FY revenue and profit view.
- Health Care names Danaher (DHR) (+7%) and Quest Diagnostics (DGX) (+5%) both beat on top and bottom line, with the latter lifting outlook.
WEDNESDAY
-
Tesla (TSLA) +12%: Metrics disappointed but CEO Musk's promise of 'more affordable' cars seemingly eases growth fears as he said production plans to begin by early 2025.
- Texas Instruments (TXN) +6%: Profit and revenue topped expectations.
- TE Connectivity (TEL) -2%: Next quarter outlook was poor.
- Enphase Energy (ENPH) -5.5% and Teledyne (TDY) -11%: Q1 metrics underwhelmed, with outlook short of expectations.
- AT&T (T) +2%: Wireless postpaid phone net additions and FCF topped Wall St. consensus.
- Boeing (BA) -2.5%: Shallower loss per share, beat on revenue, and negative FCF was not as bad as feared. Boeing's credit rating was later cut to Baa3 from Baa2 by Moody's; outlook negative.
- Visa (V) +0.5%: Major metrics surpassed Wall St. expectations.
- Humana (HUM) -3%: Q1 metrics exceeded St. expectations but revised FY24 EPS view lower.
- Thermo Fisher Scientific (TMO) +0.5% and Biogen (BIIB) +5%: Profit beat with the former raising FY outlook to reflect stronger operational performance.
- Boston Scientific (BSX) +6%: Impressed as EPS and revenue beat as did Q2 guidance.
- Meta Platforms Inc (META) Q1 2024 (USD): EPS 4.71 (exp. 4.32), Revenue 36.46bln (exp. 36.16bln), Q2 24 revenue view 36.5-39bln (exp. 38.38bln), FY24 capex view 35-40bln (exp. 34.73bln), also expects capex to increase in FY25 (exp. 37.73bln). Shares were down 15% after-hours.
- International Business Machines Corp (IBM) Q1 2024 (USD): Adj. EPS 1.68 (exp. 1.60), Revenue 14.46bln (exp. 14.55bln). Shares were down 8.5% after-hours.
- Ford Motor Co (F) Q1 2024 (USD): Adj. EPS 0.49 (exp. 0.42), Revenue 42.8bln (exp. 40.1bln). Shares were up 2.4% after-hours.
- META -12% … conf call @ 5pm ET .. 1Q revenues $36.46bn (+27% y/y) vs cons ~$36.1bn (+26% y/y) vs guide $34.5-37bn … EPS $4.71 vs cons ~$4.55 .. repurchased stepped up to ~$14.64bn in qtr (vs ~$6.32bn last qtr) .. headcount grew q/q to 69,329 (vs 67,317 last qtr) …. 2Q Revenues guided $36.5-39bn or $37.75bn at midpt (includes 1pt HEADWIND from FX) vs consensus ~$38.2bn (or +19.5% y/y).
- FY Expenses RAISED to $96-99bn (vs prior $94-99bn) “due to higher infrastructure and legal costs” and FY Capex RAISED to $35-40bn (vs prior $30-37bn) as we continue to accelerate our infrastructure investments to support our artificial intelligence (AI) roadmap. .. “ … “While we are not providing guidance for years beyond 2024, we expect capital expenditures will continue to increase next year as we invest aggressively to support our ambitious AI research and product development efforts.”
- LRCX -3% .. beat and guide Inline .. 5pm conf call .. F3Q Revs $3.79bn vs cons $3.72bn …. GMs 48.7% vs cons ~48% .. non-GAAP EPS $7.79bn vs cons $7.31 … China = 42% of revs in qtr (vs 40% last qtr) .. F4Q Revs guided $3.5-4.1bn (or ~$3.8bn at midpt) vs cons 3.8bn (+2% q/q) .. non-GAAP EPS guided $6.75-8.25 vs cons $7.33 ..
- NOW -5% .. .. conf call @ 5pm ET … 1Q cRPO +21% y/y cc or a ~1pt beat vs guide of 20% y/y cc (vs last qtr +23% y/y cc) – recall, NOW called out a ~1.5pt headwind here from Fed mix in 1Q … Subscription Revs $2.523bn (+24.5% y/y cc) vs guide $2.51-2.515bn (+23.5-24% y/y cc) .. 2Q cRPO guided +20.5% y/y cc (last qtr, NOW had called out the ~2pt headwind from Fed mix in 2Q … Reiterates FY Subs Revs guide of +21.5% y/y cc and FCF margins guide of ~31% … “ServiceNow is off to a fast start with an outstanding first quarter,” .. “As leaders seek significant productivity improvements, ServiceNow has first mover advantage with years of investment in AI technology and talent"
- MXL -4% .. beats on 1Q . in PR , notes: “We believe our revenue has bottomed and is now poised for sequential growth throughout 2024.”
- PLXS .. beats but guides below … F2Q Revs $967mn vs cons $951mn .. guides 3Q revenues $960mn-1bn vs cons $1.02bn .. "We believe our revenue growth is in the early stages of inflecting higher, benefiting from robust demand within our Aerospace and Defense market sector, gradually recovering semiconductor capital equipment demand and new program ramps that are mitigating inventory correction headwinds in our Healthcare/Lifesciences and Industrial market sectors
- IBM -6% ... headline revenues below street (Software slight miss .. Red Hat Revs +9% y/y) and reaffirms FY FCF (~$12bn) and FY Revs in MSDs y/y cc ..
- WU .. beat and raise ..
- PI +12% .. beat on 1Q revs at ~$77mn vs cosn ~$73.6mn .. guides 2Q Revs well above street to $96-99mn vs cons $79mn [though, from PR: “The outlook for our revenue and related results for the second quarter ended June 30, 2024 includes $15 million related to recognition of an annual license fee for use of our intellectual property.”]. conf call @ 5pm ET .
THURSDAY
- Meta (META) -10.5%: Although Q1 earnings metrics surpassed expectations, tumbles on increased spending outlook largely due to increased investments in AI. To see full sell-side commentary post-earnings, please click here.
- IBM (IBM) -8.5%: Revenue missed and confirmed it has entered into an agreement to acquire HashiCorp (HCP) for USD 35/shr or around USD 6.4bln.
- Merck & Co (MRK) +3%: EPS, revenue, and Keytruda rev. all beat alongside lifting FY outlook.
- Ford (F) +0.5%: EPS and revenue topped, although offered cautious commentary on the EV space.
- Royal Caribbean Cruises (RCL) +0.5%: Profit and revenue exceeded consensus, alongside strong Q2 and FY EPS outlook.
- Southwest Airlines (LUV) -7%: Deeper loss per share than expected, revenue light, and cut FY ASM and revenue growth view amid challenges presented by Boeing aircraft delivery delays. Also, expects less than half of the new aircraft deliveries previously expected from BA.
- Caterpillar (CAT) -7%: Revenue missed and sees Q2 revenue and operating margins lower Y/Y.
- Union Pacific (UNP) +5%: Earnings impressed, resuming share buybacks in Q2 and noted its profitability outlook for 2024 is gaining momentum.
- Bristol-Myers Squibb (BMY) -8.5%: Lowered FY EPS guidance.
- S&P Global (SPGI) +0.5%: Strong report; Top and bottom line exceeded expectations accompanied by raising FY24 guidance.
- Hertz (HTZ) -19.5%: Much deeper loss per share than expected and it now plans to sell 30k EVs in 2024 as part of a disposition plan, an increase of 10,000 vehicles from its original target.
- Alphabet Inc (GOOGL) Q1 2024 (USD): EPS 1.89 (exp. 1.51), Revenue 80.54bln (exp. 78.59bln); board authorized Co. to repurchase up to an additional 70bln and declared a cash dividend of 0.20/shr.
- Microsoft Corp (MSFT) Q3 2024 (USD): EPS 2.94 (exp. 2.82), Revenue 61.86bln (exp. 60.8bln).
- Intel Corp (INTC) Q1 2024 (USD): Adj. EPS 0.18 (exp. 0.14), Revenue 12.70bln (exp. 12.78bln).
- Snap Inc (SNAP) Q1 2024 (USD): Adj. EPS 0.03 (exp. -0.05), Revenue 1.19bln (exp. 1.12bln).
- Western Digital Corp (WDC) Q3 2024 (USD): Adj. EPS 0.63 (exp. 0.21), Revenue 3.46bln (exp. 3.36bln).
- DATA RECAP
- TotalEnergies (TTE FP) Q1 (USD): Adj. Net 5.11bln (exp. 5bln). Adj. EBITDA 11.5bln (exp. 11.1bln). Plans a USD 2bln share buyback Q2; Cash flow from operating activities 2.2bln (prev. 5.1bln Y/Y); Dividend +7% Y/Y
- Airbus (AIR FP) Q1 24 (USD): Adj. EBIT 600mln (exp. 789mln), Revenue 12.80bln (exp. 12.87bln), Gross Orders 170 (prev. 156), Net Orders 170 (prev. 142), Deliveries 142. Reaffirms 2024 guidance.
FRIDAY
- Alphabet (GOOGL) +10%: Stellar report - all major metrics beat alongside a new USD 70bln share buyback program and its first ever dividend of USD 0.20/shr. Above forecast capital spending (positive for semiconductors).
- Microsoft (MSFT) +2%: EPS, revenue, and key revenue segments (cloud) topped, accompanied by upbeat commentary from the CFO. Note, Q4 guidance was actually slightly light, although the key Azure guidance impressed.
- Intel (INTC) -9%: Revenue missed with next quarter guidance short. CFO said it could have sold more AI PC processors and H1 was softer than had been expected.
- Snap (SNAP) +27.5%: EBITDA and EPS a surprise profit, while revenue, DAUs, and ARPU all beat. Q2 revenue guidance was also strong.
- T-Mobile US (TMUS) flat: Top and bottom line beat, but internals were slightly more mixed.
- Western Digital (WDC) +3%: EPS and revenue topped Wall St. expectations, with Q4 guidance also impressing.
- Exxon (XOM) -3%: Missed on profit with lower national gas prices a headwind.
- Atlassian (TEAM) -9.5%: Q1 results were solid but weighed on after co-CEO decided to step down.
- AbbVie (ABBV) -4.5%: EPS, revenue and Humira exceeded expectations alongside raising FY profit view.
- Skechers (SKX) +11%: Strong Q1 earnings in addition to lifting FY outlook.
- ResMed (RMD) +19%: Top and bottom line topped Wall St. consensus.
- Charter Communications (CHTR) -1.5%: Earnings missed as did most of the key internal metrics.
- Roku (ROKU) -10.5%: Whilst the Q1 report was decent, the Co. warned of “difficult Y/Y growth rate comparisons” within its stream service distribution activities, citing past price hikes and a shift toward ad-supported streamers.
| |
|
DEVELOPMENTS TO WATCH
44.6% CAPITAL GAINS PLUS TAXING UNEARNED CAPITAL GAINS?
Now we have more insight into why the Biden Administration's budget called for the hiring of 84,000 new IRS Agents. It wasn't to chase the rich. There are big tax changes planned for after the election.
Biden’s 2025 budget calls for about $5 trillion in tax increases over the next decade. Here are a few of the ways:
1- A DOUBLING OF CAPITAL GAINS
President Biden has formally proposed the highest top capital gains tax in over 100 years. Here is a direct quote from the Biden 2025 budget proposal:
“Together, the proposals would increase the top marginal rate on long-term capital gains and qualified dividends to
44.6 percent.”
.
Under the Biden proposal, the combined federal-state capital gains tax exceeds 50% in many states. California will face a combined federal-state rate of 59%, New Jersey 55.3%, Oregon at 54.5%, Minnesota at 54.4%, and New York state at 53.4%.
Biggest impact will be on but not exclusive to:
- All Investors
- Small Family owned Businesses, Farms and Ranches
- Inheritance
- Elderly home owners selling their home for retirement home care
2- CORPORATE TAX RATE TO 28%
- Increase Corporate Tax Rate from 21% to 28%
3- TAXING UNEARNED INCOME
Additionally the Biden administration is trying to raise an addition $4.3 trillion over 10 years in the worst way possible, imposing a minimum tax equal to 25% of a taxpayer’s taxable income and unrealized capital gains less the sum of their regular tax, for taxpayers with wealth over $100 million.
4- TRUMP'S TAX REDUCTION ACT ENDS NEXT YEAR
Repeal President Trump’s 2017 Tax Cuts and Jobs Act – a law that turbocharged American job growth and U.S. national competitiveness.
So much for only taxing "the rich making over $400,00 per year".
| |
YELLEN'S OWN US TREASURY BUYBACK PROGRAM
Why rely on the Fed for a QE Program? Yellen sees the US Treasury having its own program!!
The first Treasury buyback program in more than 20 years is scheduled to be reintroduced next week, according to a number of news sources. The program touted to make the Treasury market more liquid and resilient is expected to get off the ground almost immediately. The U.S. Treasury has already conducted limited buyback tests this month and indicated that it will announce the date of its first regular operation as part of next Wednesday's quarterly refunding announcement.
- The goal of the program is to support liquidity in the world's largest market for government securities.
- Concerns about the U.S.'s growing debt pile is being seen by traders and strategists as one of the largest catalysts for a prolonged period of volatility inside the $27.5 trillion Treasury market.
The Treasury Department has undertaken only two previous series of buybacks in the past century. The first took place during the 1920s. More recently, Treasury bought back $67.5 billion of outstanding debt via 45 operations held between March 2000 and April 2002, according to Josh Frost, assistant secretary for financial markets.
In a speech delivered last September, Frost said that reintroducing buybacks would not only help to make the Treasury market more liquid and resilient, but would also help the department achieve its debt-management objectives.
Barclays strategists Anshul Pradhan and Andres Mok said that they are expecting the Treasury to unveil a schedule of purchase operations shortly.
"As to when the Treasury should conduct these operations, we believe it should avoid major data releases," they said. "Dealers have noted that they expect robust participation in operations that occur in the late morning or early afternoon, with several suggesting that timing of auctions should be taken into account and conducting buybacks leading [up to] an auction would be helpful."
| |
|
GLOBAL ECONOMIC INDICATORS: What This Week's Key Global Economic Releases Tell Us
DURABLE GOODS ORDERS
- US Durable Goods (Mar) 2.6% vs. Exp. 2.5% (Prev. 1.3%, Rev. 0.7%)
THE REAL STORY
Below the headline number and quite problematic is Core Capital Goods Shipments. This is used to help calculate equipment investment in the government’s gross domestic product report. It saw only a small 0.2% MoM rise. This left core shipments down 1.2% YoY - the biggest YoY drop since the COVID lockdowns. (chart right)
| |
Q1 GDP - 3 Sigma Miss With Lowest Print In 2 years
- US GDP Advance (Q1) 1.6% vs. Exp. 2.4% (Prev. 3.4%)
MAJOR GDP SURPRISE
US GDP unexpectedly collapsed to just 1.6%, down more than 50% from the Q4 print of 3.4%, the lowest print since Q2 2022 when the US underwent a brief technical recession, (one which the NBER never admitted of course), and a huge miss to the 2.5% estimate.
CORE PCE THE BIG STORY
While a collapse in the US economy is just what the "soft landers" wanted, the huge GDP miss was just half the story because at the same time, the BEA reported that the GDP Deflator (price index) came in at 3.1%, hotter than the 3.0% expected and almost double the 1.6% in Q4.
Worse, the all important core PCE for Q1 soared from 2.0% to 3.7%, blowing away estimates of 3.4%, (we will get a more accurate core PCE print tomorrow for the month of March), and suggesting that the US is about to not pass go and overshoot soft-landing island completely, but crash-land straight into a stagflationary recession.
|  | |
|
CORE PCE INDEX
The closely watched 3-Month annualized core PCE jumped to 4.4%.
| |
|
GLOBAL MACRO
WHAT DOES YOUR SCAN OF THE DATA BELOW TELL YOU? - THE MEDIA AVOIDS BAD NEWS!
We present the data in a way you can quickly see what is happening.
THIS WEEK WE SAW
Exp=Expectations, Rev=Revision, Prev=Previous
| |
|
UNITED STATES
- US National Activity Index (Mar) 0.15 (Prev. 0.05, Rev. 0.09)
- US S&P Global Manufacturing Flash PMI (Apr) 49.9 vs. Exp. 52.0 (Prev. 51.9)
- US S&P Global Services Flash PMI (Apr) 50.9 vs. Exp. 52.0 (Prev. 51.7)
- US S&P Global Composite Flash PMI (Apr) 50.9 (Prev. 52.1)
- US Richmond Fed Composite Index (Apr) -7.0 (Prev. -11.0)
- US Richmond Fed Manufacturing Shipments (Apr) -10.0 (Prev. -14.0)
- US Richmond Fed Services Index (Apr) -13.0 (Prev. -7.0)
- US Philadelphia Fed Non-Manufacturing Survey (April) Regional Business Activity -12.4 (prev. -18.3 M/M)
- US New Home Sales-Units (Mar) 0.69M vs. Exp. 0.67M (Prev. 0.66M, Rev. 0.64M)
- US Durable Goods (Mar) 2.6% vs. Exp. 2.5% (Prev. 1.3%, Rev. 0.7%)
- US GDP Advance (Q1) 1.6% vs. Exp. 2.4% (Prev. 3.4%)
- US Core PCE Prices Advance (Q1) 3.7% vs. Exp. 3.4% (Prev. 2.0%)
- US Pending Sales Change MM (Mar) 3.4% vs. Exp. 0.8% (Prev. 1.6%)
- US Initial Jobless Claims w/e 207.0k vs. Exp. 215.0k (Prev. 212.0k)
- US Continued Jobless Claims w/e 1.781M vs. Exp. 1.805M (Prev. 1.812M, Rev. 1.796M)
- US KC Fed Composite Index (Apr) -8.0 (Prev. -7.0)
- US KC Fed Manufacturing (Apr) -13.0 (Prev. -9.0)
JAPAN
- Japanese Manufacturing PMI Flash (Apr) 49.9 (Prev. 48.2)
- Japanese Services PMI Flash (Apr) 54.6 (Prev. 54.1)
- Japanese Composite Flash (Apr) 52.6 (Prev. 51.7)
- Japanese Services PPI (Mar) 2.30% (Prev. 2.10%)
- Tokyo CPI YY (Apr) 1.8% vs. Exp. 2.6% (Prev. 2.6%)
- Tokyo CPI Ex. Fresh Food YY (Apr) 1.6% vs. Exp. 2.2% (Prev. 2.4%)
- Tokyo CPI Ex. Fresh Food & Energy YY (Apr) 1.8% vs. Exp. 2.7% (Prev. 2.9%)
UK
- UK Rightmove House Price Index MM (Apr) 1.1% (Prev. 1.5%)
- UK Rightmove House Price Index YY (Apr) 1.7% (Prev. 0.8%)
- UK Flash Services PMI (Apr) 54.9 vs. Exp. 53.0 (Prev. 53.1); Flash Manufacturing PMI (Apr) 48.7 vs. Exp. 50.4 (Prev. 50.3); Flash Composite PMI (Apr) 54.0 vs. Exp. 52.7 (Prev. 52.8)
- UK Manufacturing Flash PMI (Apr) 48.7 vs. Exp. 50.4 (Prev. 50.3)
- UK Services Flash PMI (Apr) 54.9 vs. Exp. 53.0 (Prev. 53.1)
- UK Composite Flash PMI (Apr) 54.0 vs. Exp. 52.7 (Prev. 52.8)
- UK GfK Consumer Confidence (Apr) -19.0 vs. Exp. -20.0 (Prev. -21.0)
AUSTRALIA
- Australian Manufacturing PMI Flash (Apr) 49.9 (Prev. 47.3)
- Australian Services PMI Flash (Apr) 54.2 (Prev. 54.4)
- Australian Composite PMI Flash (Apr) 53.6 (Prev. 53.3)
- Australian CPI QQ (Q1) 1.0% vs. Exp. 0.8% (Prev. 0.6%)
- Australian CPI YY (Q1) 3.6% vs. Exp. 3.5% (Prev. 4.1%)
- Australian Weighted CPI YY (Mar) 3.5% vs. Exp. 3.4% (Prev. 3.4%)
| |  |
|
EU
- EU Consumer Confidence Flash (Apr) -14.7 vs. Exp. -14.4 (Prev. -14.9)
- EU HCOB Services Flash PMI (Apr) 52.9 vs. Exp. 51.8 (Prev. 51.5); HCOB Manufacturing Flash PMI (Apr) 45.6 vs. Exp. 46.6 (Prev. 46.1); HCOB Composite Flash PMI (Apr) 51.4 vs. Exp. 50.8 (Prev. 50.3); "Considering various factors including the HCOB PMIs, our GDP forecast suggests a 0.3% expansion in the second quarter".
- EU HCOB Manufacturing Flash PMI (Apr) 45.6 vs. Exp. 46.6 (Prev. 46.1)
- EU HCOB Services Flash PMI (Apr) 52.9 vs. Exp. 51.8 (Prev. 51.5)
- EU HCOB Composite Flash PMI (Apr) 51.4 vs. Exp. 50.8 (Prev. 50.3)
- EU Money-M3 Annual Growth (Mar) 0.9% vs. Exp. 0.6% (Prev. 0.4%); Loans to Non-Fin (Mar) 0.4% (Prev. 0.4%); Loans to Households (Mar) 0.2% (Prev. 0.3%)
GERMANY
- German HCOB Manufacturing Flash PMI (Apr) 42.2 vs. Exp. 42.9 (Prev. 41.9); HCOB Services Flash PMI (Apr) 53.3 vs. Exp. 50.5 (Prev. 50.1); HCOB Composite Flash PMI (Apr) 50.5 vs. Exp. 48.6 (Prev. 47.7); "Factoring in the PMI numbers into our GDP Nowcast, we estimate that GDP may expand by 0.2%".
- German HCOB Manufacturing Flash PMI (Apr) 42.2 vs. Exp. 42.9 (Prev. 41.9)
- German HCOB Services Flash PMI (Apr) 53.3 vs. Exp. 50.5 (Prev. 50.1)
- German HCOB Composite Flash PMI (Apr) 50.5 vs. Exp. 48.6 (Prev. 47.7)
- German Ifo Curr Conditions New (Apr) 88.9 vs. Exp. 88.7 (Prev. 88.1); Ifo Expectations New (Apr) 89.9 vs. Exp. 88.7 (Prev. 87.5, Rev. 87.7);
- Ifo Business Climate New (Apr) 89.4 vs. Exp. 88.8 (Prev. 87.8, Rev. 87.9); German ifo Institute President is more optimistic about the German economy in Q2; manufacturing companies lacking orders but positive consumption, via Bloomberg
- German Ifo Expectations New (Apr) 89.9 vs. Exp. 88.7 (Prev. 87.5, Rev. 87.7)
- German Ifo Business Climate New (Apr) 89.4 vs. Exp. 88.8 (Prev. 87.8, Rev. 87.9)
- German Ifo Curr Conditions New (Apr) 88.9 vs. Exp. 88.7 (Prev. 88.1)
ITALY
- Italy's Economy Minister expects a gradual easing in monetary policy, likely to take place in the second part of this year.
FRANCE
- French HCOB Services Flash PMI (Apr) 50.5 vs. Exp. 49.0 (Prev. 48.3); HCOB Manufacturing Flash PMI (Apr) 44.9 vs. Exp. 47.0 (Prev. 46.2); HCOB Composite Flash PMI (Apr) 49.9 vs. Exp. 48.8 (Prev. 48.3); "Overall, our HCOB nowcast model for the second quarter points to a recovery of the French economy, driven by the services sector".
SPAIN
- Spanish Retail Sales YY (Mar) 0.6% (Prev. 1.9%); Unemployment Rate (Q1) 12.29% (Prev. 11.76%, Rev. 11.80%)
SOUTH KOREA
- South Korean GDP QQ Advance (Q1) 1.3% vs. Exp. 0.6% (Prev. 0.6%)
- South Korean GDP YY Advance (Q1) 3.4% vs. Exp. 2.4% (Prev. 2.2%)
| |
CURRENT MARKET PERSPECTIVE | |
|
EYES ON THE US TREASURY REFUNDING THIS COMING WEEK
EQUITIES TO TRADE ON YIELDS, EARNINGS & TREASURY SIGNALS
Click All Charts to Enlarge
| |
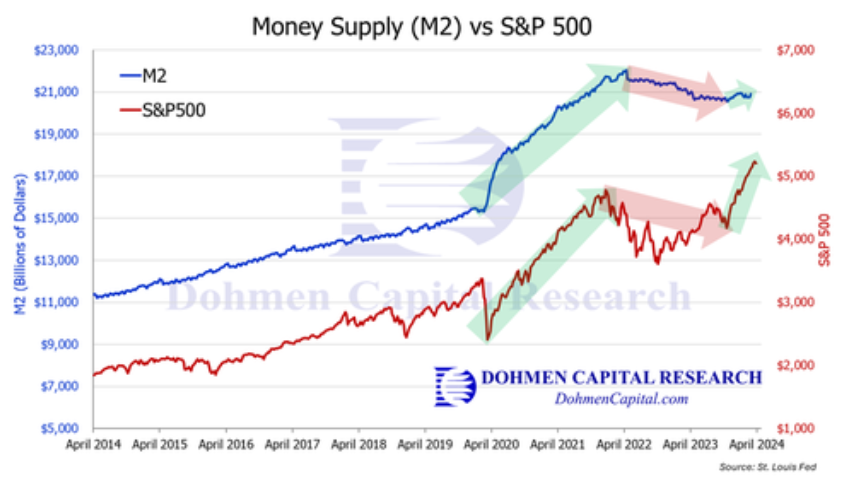
M2 MONEY SUPPLY TURNS: Late last year the Fed started stimulating again, contrary to what Fed officials said publicly. The chart of M2 vs the S&P 500 above confirms that money supply is growing again. The rate of change turned nicely positive. That is the green light for reflating markets….and inflation!! | |
|
1 - SITUATIONAL ANALYSIS
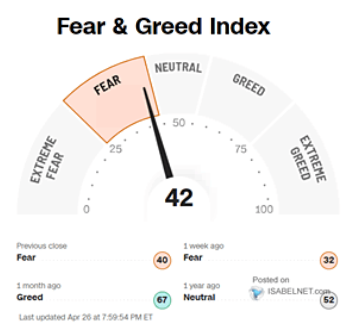
Stock Market remains in fear for the 8th consecutive trading day. The Fear Index has been gradually lessening. It was 31 last week and now registers 42 (chart right).
In terms of market volatility the VVIX has collapsed and is trading at lower levels than prior to this latest mini panic move. The VIX is also significantly down. Both indicate that worry is subsiding though intra day volatility is causing a lot of trading frustration.
So far this is just a "normal" bounce post the sell off.
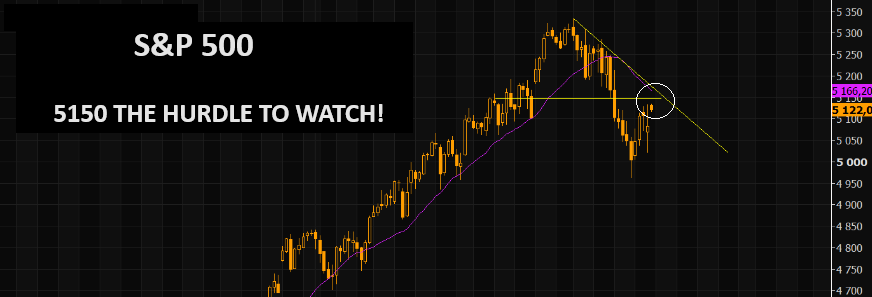
5150 appears to be the key in SPX to the upside. The short term negative trend line comes in there, as well as the 21 day moving average, sloping negatively.
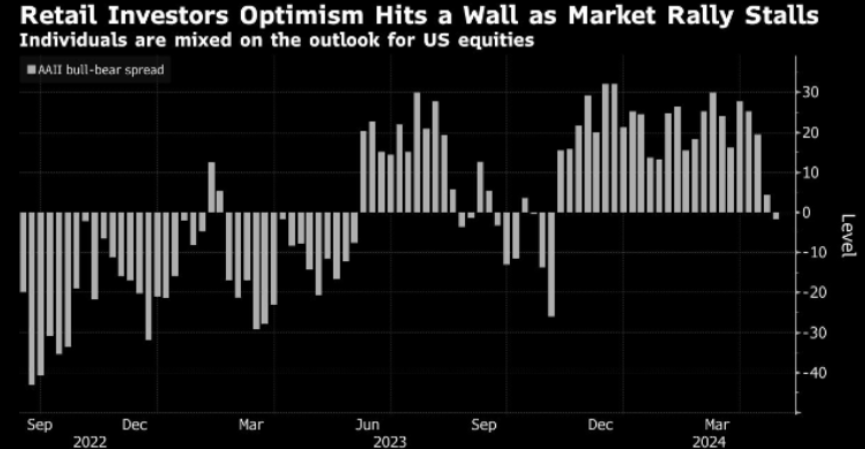
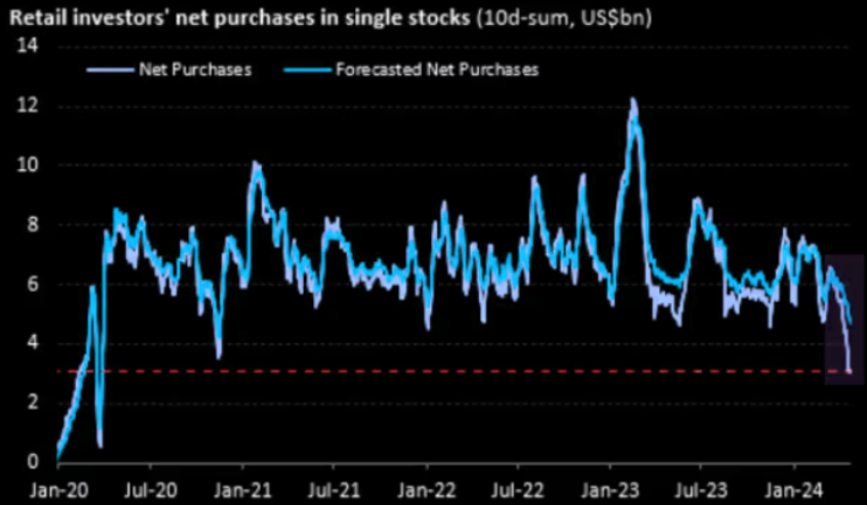
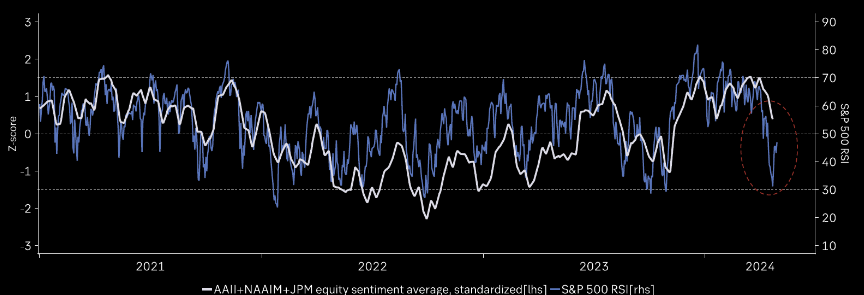
CHART BELOW: Retail Investors are now the most pessimistic / least optimistic about stocks since November.
| |
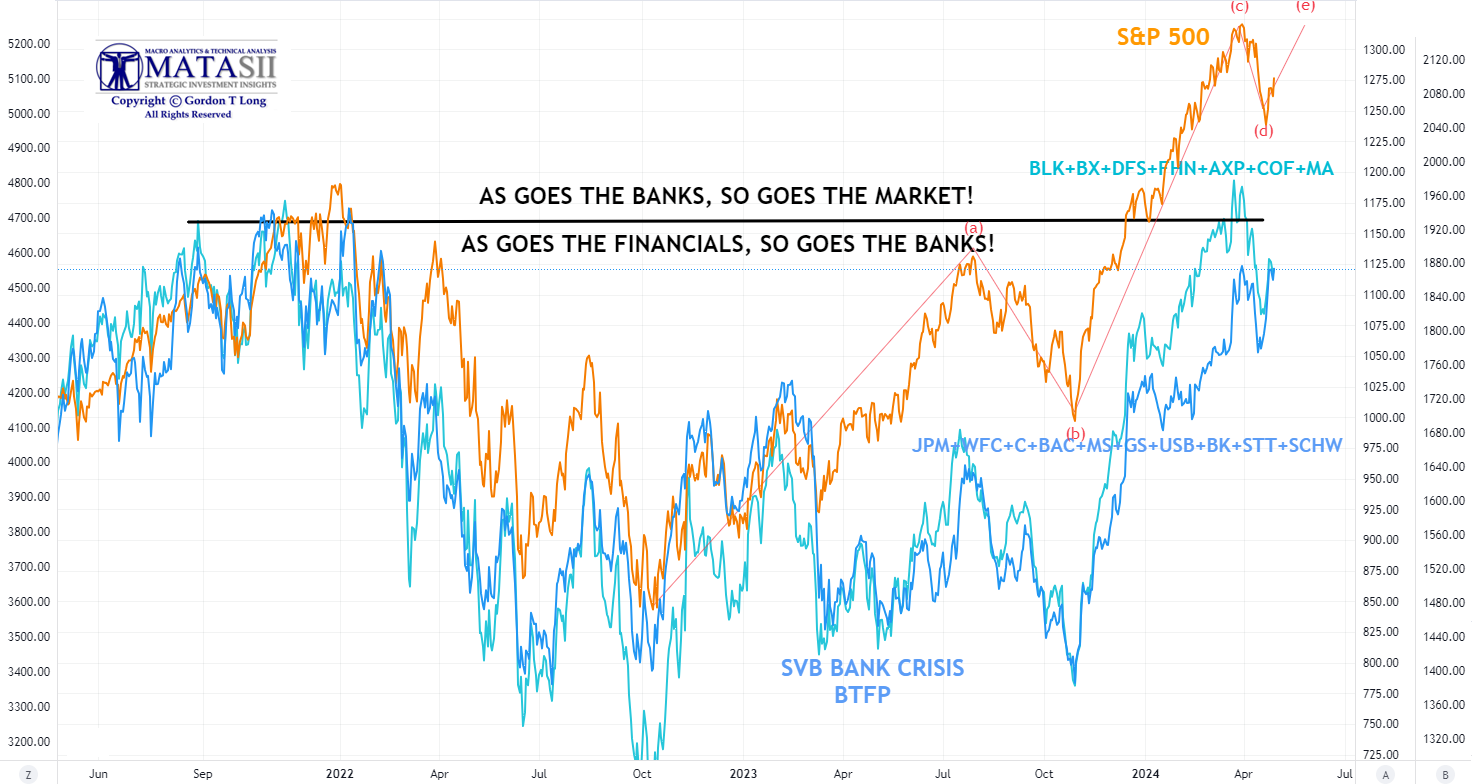
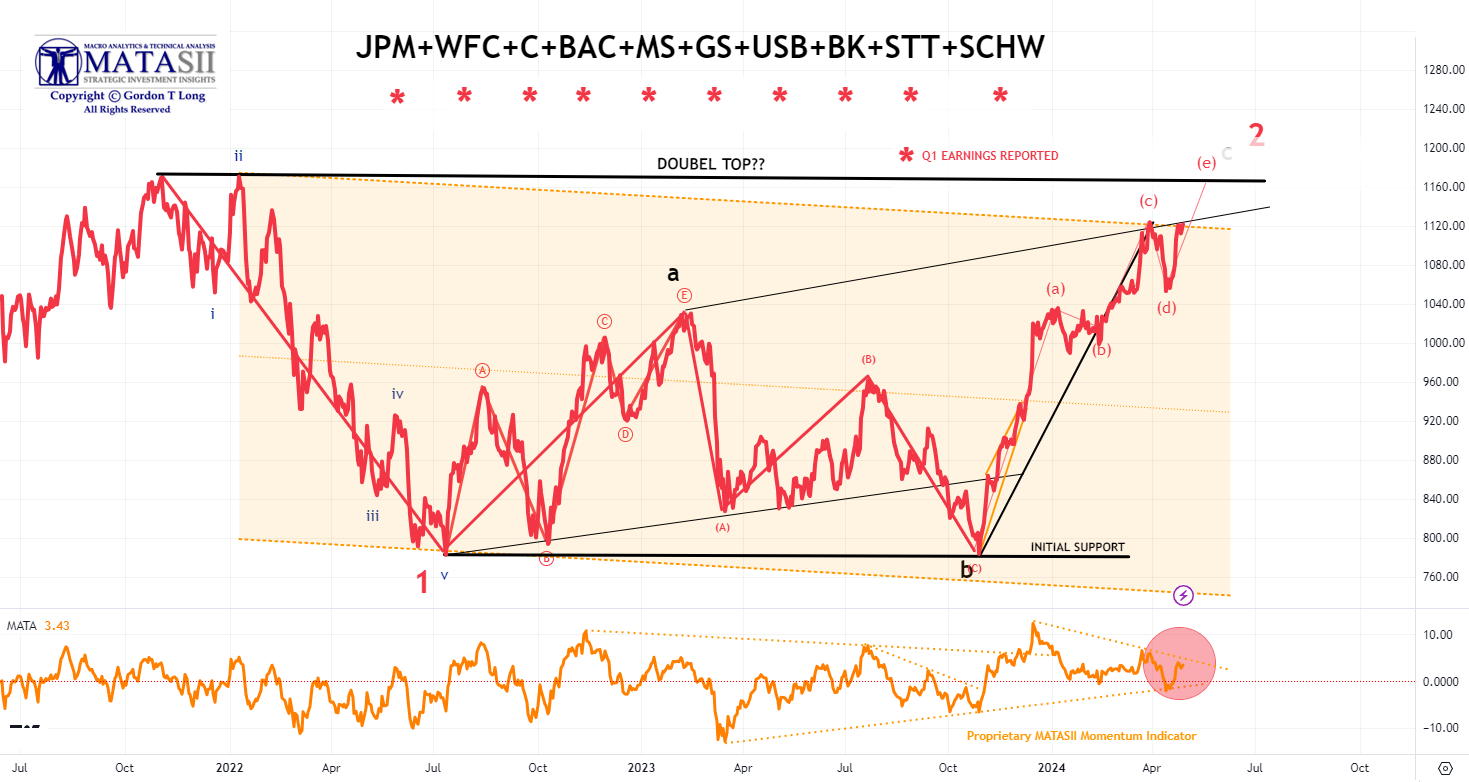
AS GO THE BANKS, SO GO THE MARKETS - AS GO THE FINANCIALS, SO GO THE BANKS! | |
|
1- BANKING STOCKS
Bank stocks, though initially weak on earnings release, have been trending up ever since, while the overall market weakened until recently rising along with Bank stocks.
| |
|
YOUR DESKTOP / TABLET / PHONE ANNOTATED CHART
Macro Analytics Chart Above: SUBSCRIBER LINK
| |
|
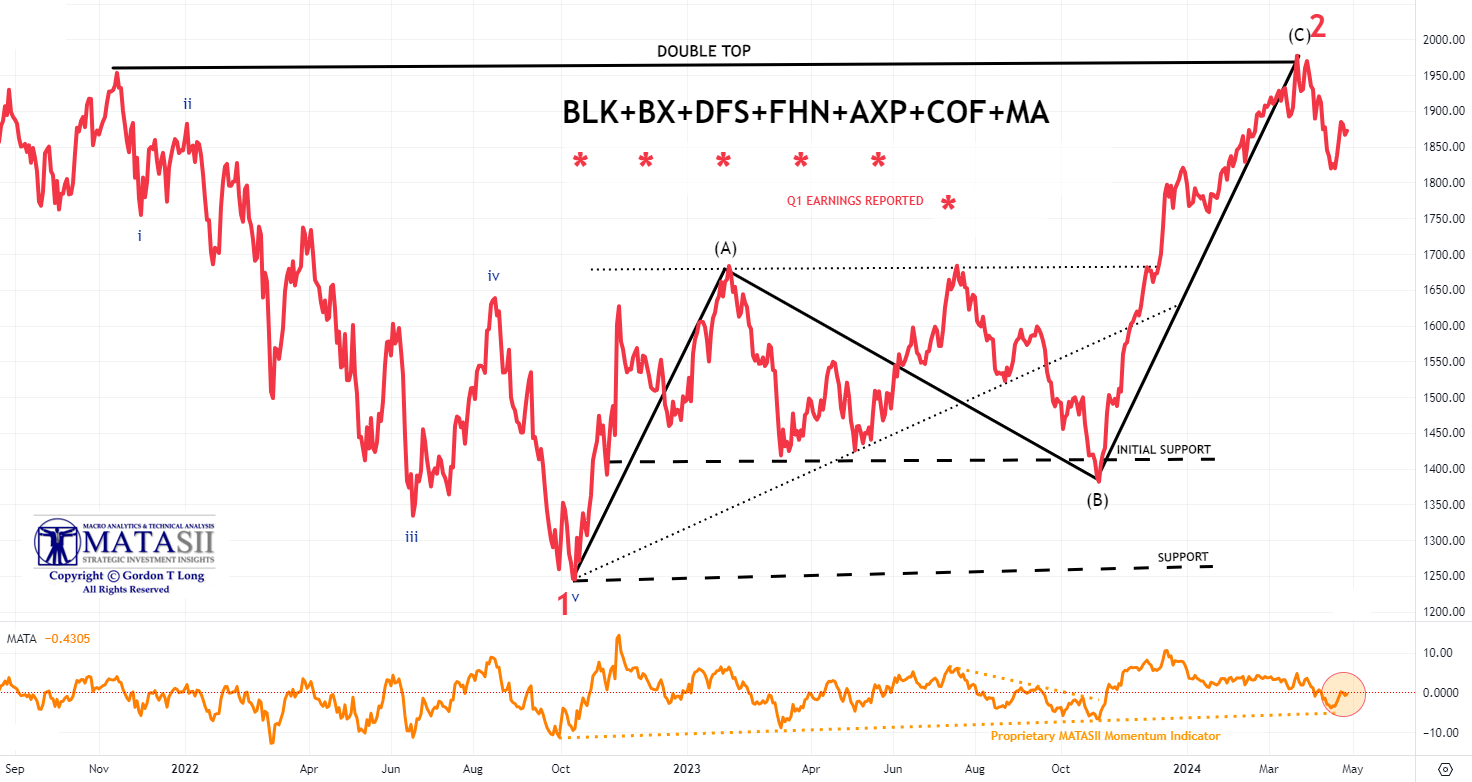
2- FINANCIAL STOCKS
The Financials appear to be trying to follow the Banking stocks higher against the overall trend of the market.
The MATASII Financial Index has reached overhead momentum resistance (lower pane).
| |
|
YOUR DESKTOP / TABLET / PHONE ANNOTATED CHART
Macro Analytics Chart Above: SUBSCRIBER LINK
| |
|
YOUR DESKTOP / TABLET / PHONE ANNOTATED CHART
Macro Analytics Chart Above: SUBSCRIBER LINK
| |
|
2 - FUNDAMENTAL ANALYSIS
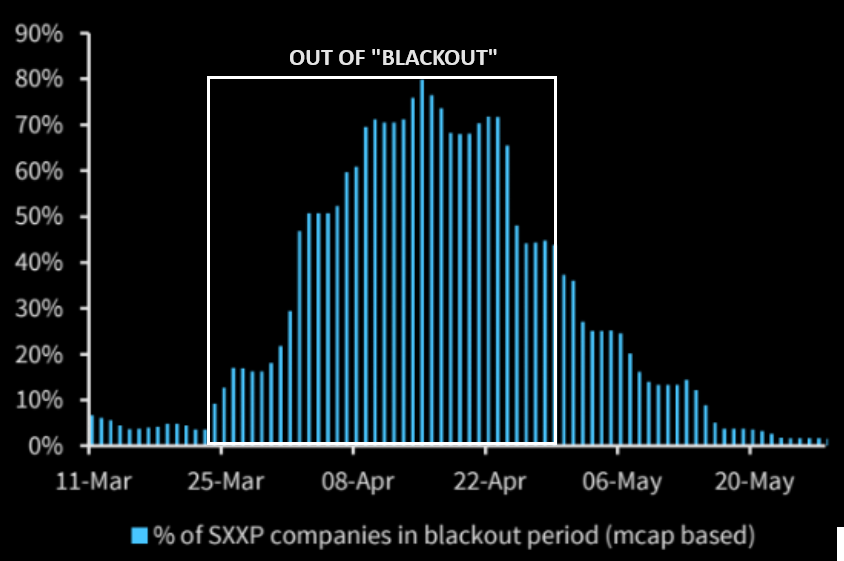
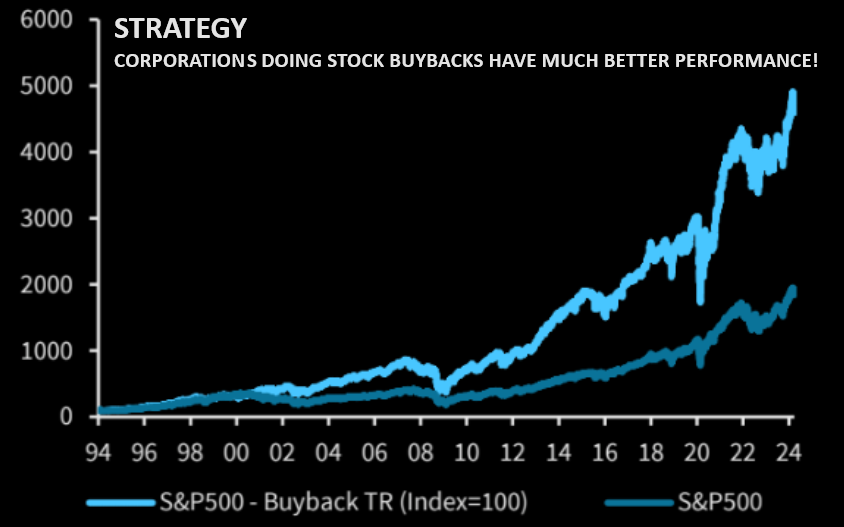
CORPORATE BUYBACKS
On the authorization front, 2024 YTD authorizations stand at $317.4B vs $377.0B 2023 YTD authorizations. Expectations are that authorizations this year will finish higher. Estimates for 2024 authorizations are to finish $1.15T (up ~16%), according to Goldman Sachs.
CHART RIGHT: Buyback blackout window ending.
CHART BELOW
Buyback yield strategy has outperformed in the US, where buybacks and therefore compounding have been part of the equity culture for a long time.
| |
|
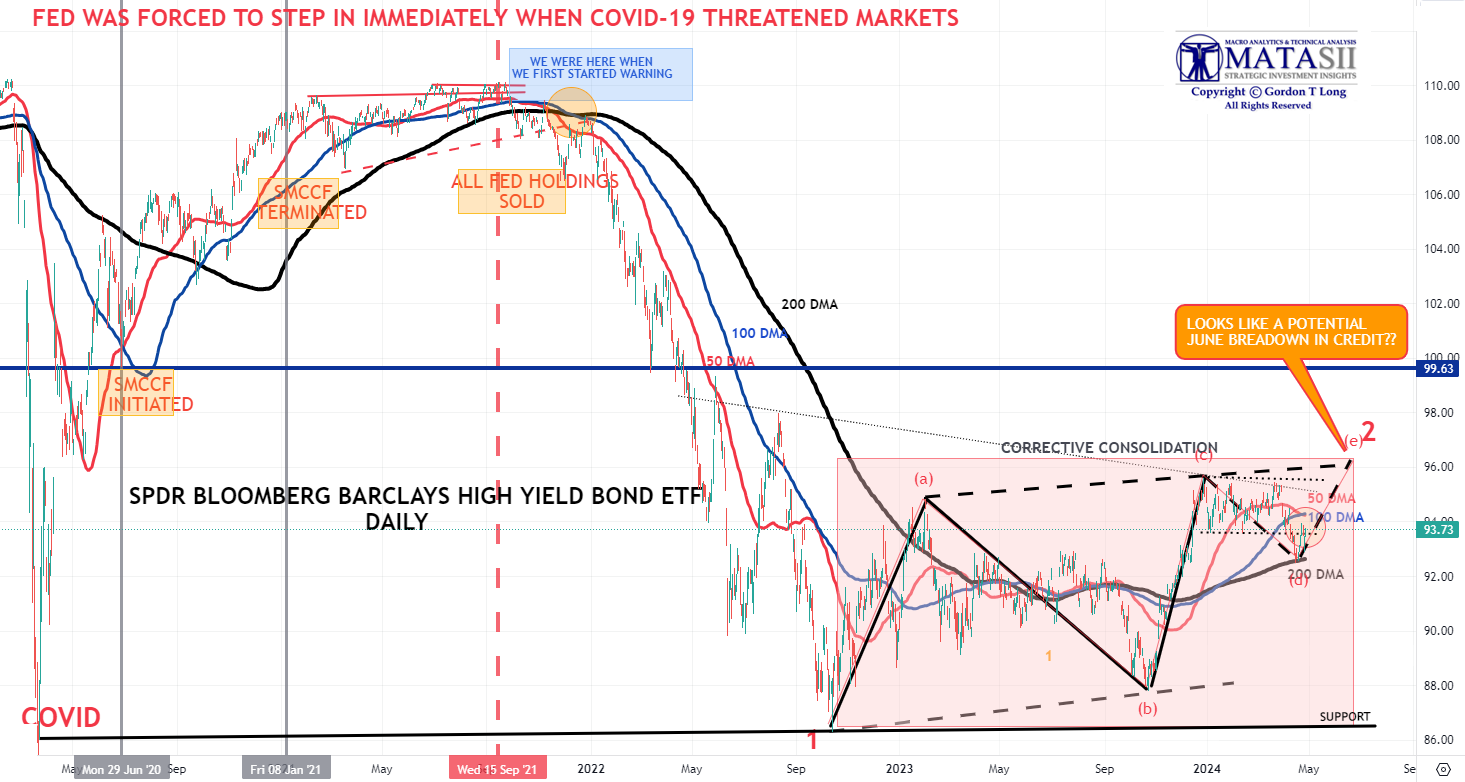
CREDIT LEADS
The High Yield Credit sector, as represented by the "JNK", is currently reflecting nothing more than a consolidation to the 200 DMA, then completing a potential final leg up. Though expected to be of short duration this is normally good for the equity markets.
| |
|
YOUR DESKTOP / TABLET / PHONE ANNOTATED CHART
Macro Analytics Chart Above: SUBSCRIBER LINK
| |
3 - TECHNICAL ANALYSIS
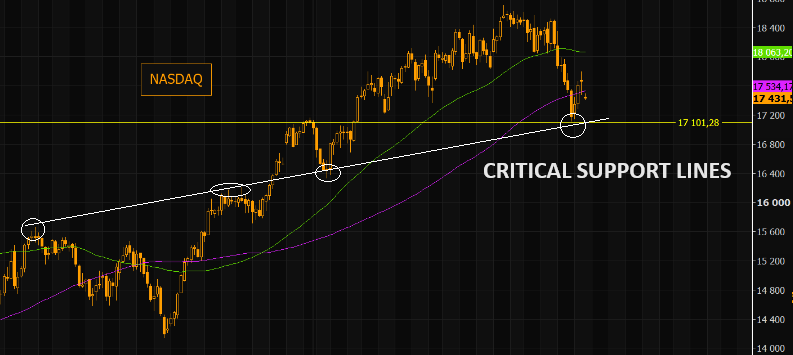
OVERALL EQUITY MARKET
We are just above critical support lines in the Nasdaq.
Nasdaq's short term must hold is down around the 17100 area. We are presently falling below the 100 day .
The 50 day is reversing and has just started sloping negatively - indicating we are slowly rolling over.
MAGNIFICENT 7
- We are reaching the vertical lift part of the parabolic (geometric) lift shown by the dashed red line.
- We have intermediate term Divergence with momentum (bottom pane).
- In the short term, Momentum has rolled over but hasn't yet decisively broken the Momentum trend line support.
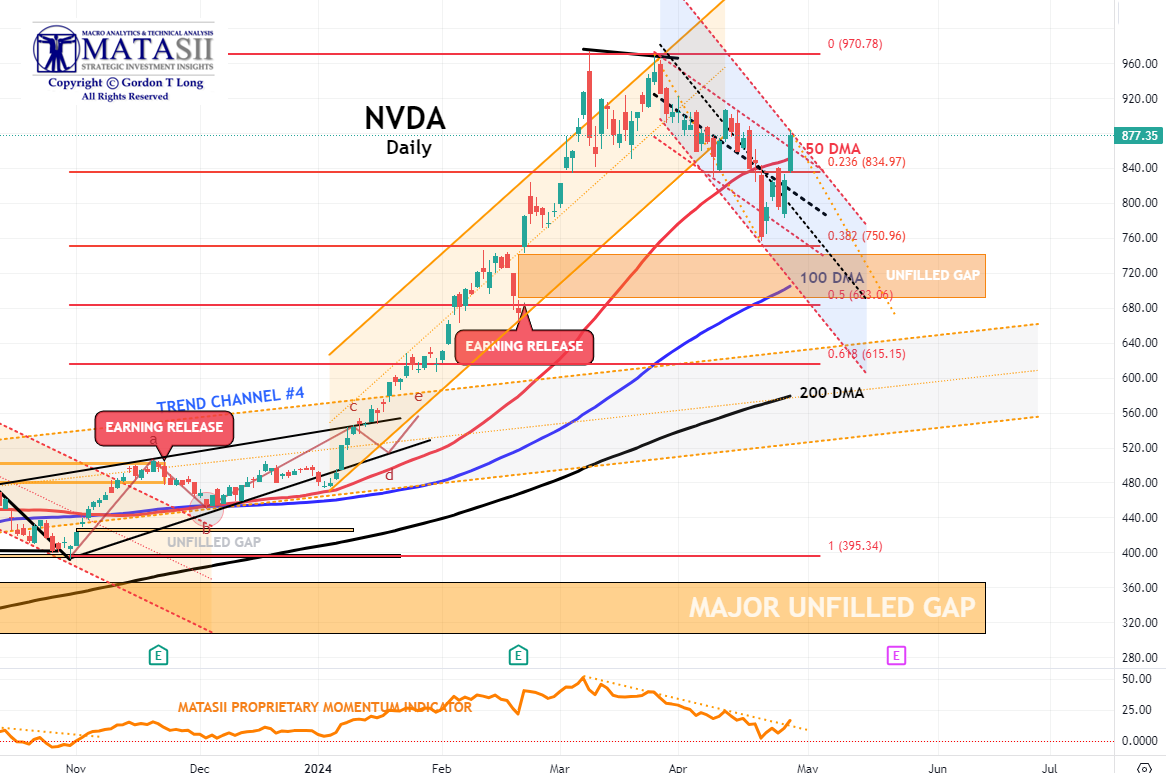
NVDA - Daily
- NVDA broke through the overhead 50 DMA on a retest.
- NVDA Momentum (lower pane) has also broken through its overhead resistance trend line.
- This counter rally is noticeably strong for NVDA and may lead the market higher - at least in the short term.
| |
YOUR DESKTOP / TABLET / PHONE ANNOTATED CHART
Macro Analytics Chart Above: SUBSCRIBER LINK
| |
|
"CURRENCY" MARKET (Currency, Gold, Black Gold (Oil) & Bitcoin)
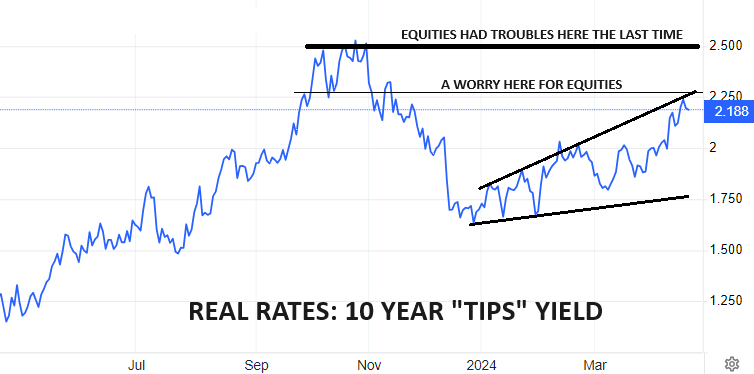
CHART RIGHT: As gold pushes to higher & higher record highs (in USD terms), Real yields have so far refused to play along (right)?? Normally Gold falls when real yields rise and are historically negatively correlated.
What we believe is that we are seeing Gold aggressively discounting a coming collapse in Real Rates, which we expect between
2.25% - 2.5%.
CONTROL PACKAGE
There are NINE charts we have outlined in prior chart packages, which we will continue to watch closely as a CURRENT "control set".
-
US DOLLAR -DXY - MONTHLY (CHART LINK)
-
US DOLLAR - DXY - DAILY (CHART LINK)
-
GOLD - DAILY (CHART LINK)
-
GOLD cfd's - DAILY (CHART LINK)
-
GOLD - Integrated - Barrick Gold (CHART LINK)
-
OIL - XLE - MONTHLY (CHART LINK)
-
OIL - WTIC - MONTHLY - (CHART LINK)
-
BITCOIN - BTCUSD - WEEKLY (CHART LINK)
-
10y TIPS - Real Rates - Daily (CHART LINK)
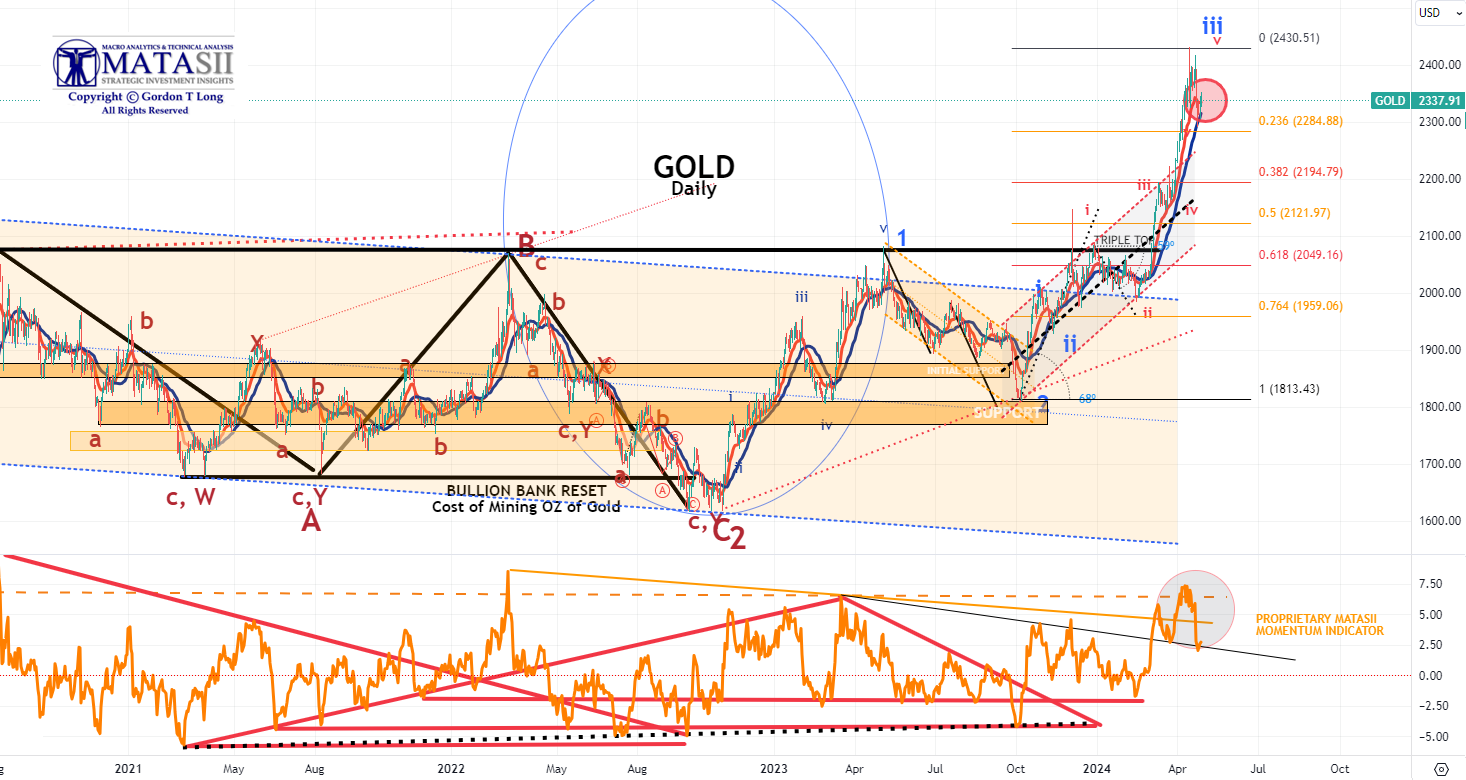
GOLD - DAILY
- Gold pulled back on Monday finding initial support at the 23.6% Fibonacci Retracement level.
- Gold Momentum (lower pane) also found support (dotted black trend line).
- It appears that this initial corrective leg is an "A" wave of an ABC corrective pattern before heading higher when completed. The "C" down leg of the ABC is likely to find firm support at the 38.2% Fibonacci Retracement level.
|  | |
YOUR DESKTOP / TABLET / PHONE ANNOTATED CHART
Macro Analytics Chart Above: SUBSCRIBER LINK
| |
INTEGRATED GOLD MINERS
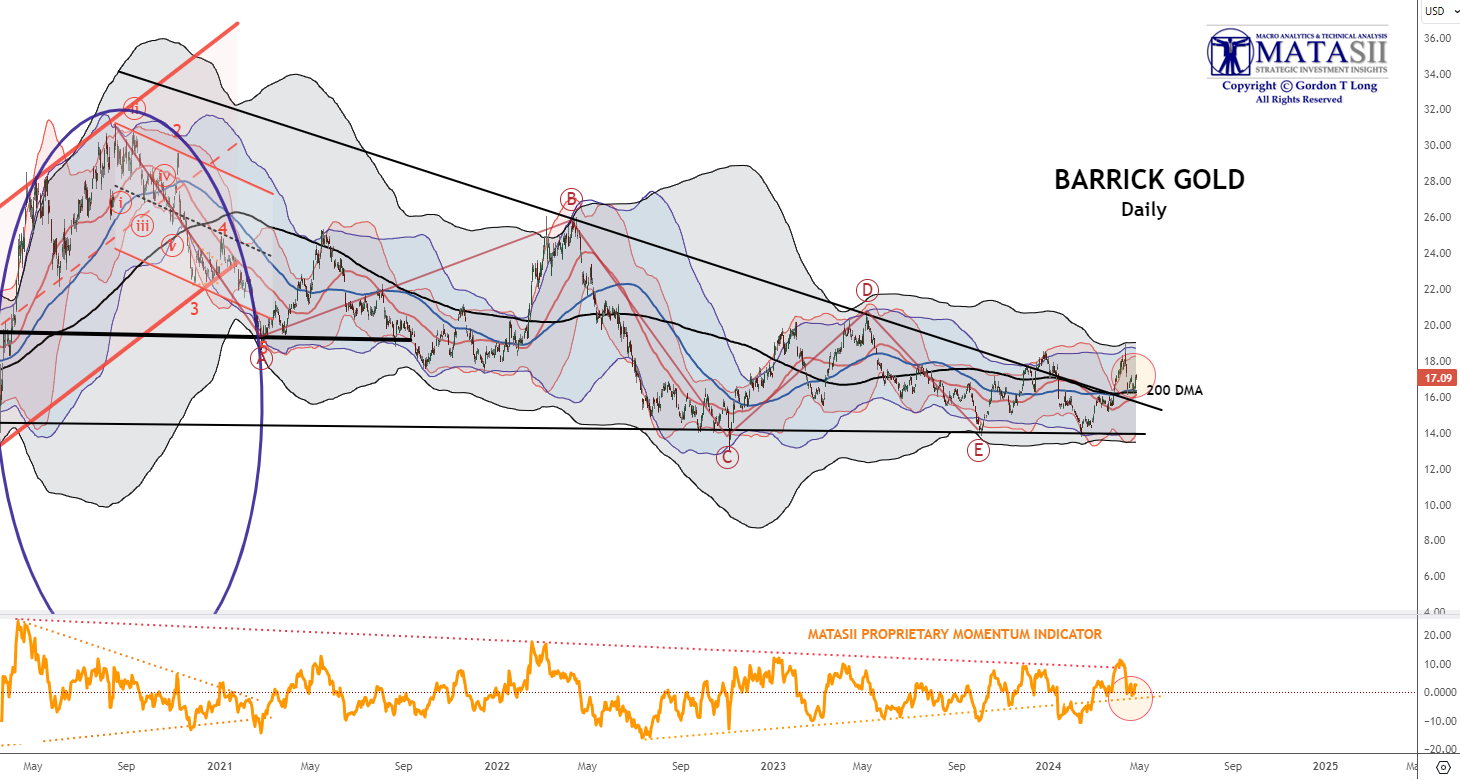
We continue to have a close eye on Gold and the INTEGRATED GOLD MINERS, as represented by Barrick Gold.
Barrick has broken out of its long term declining overhead resistance trend.
Barrick has been pulling back this week as Gold Bullion has. It may be a good opportunity to be adding to your Gold and Silver positions on any further pullbacks.
| |
|
YOUR DESKTOP / TABLET / PHONE ANNOTATED CHART
Macro Analytics Chart Above: SUBSCRIBER LINK
| |
|
US EQUITY MARKETS
If this is a mild 5-10% correction, investor sentiment should bottom soon around neutral. (Chart Right)
CONTROL PACKAGE
There have FIVE charts we have outlined in prior chart packages that we will continue to watch closely as a CURRENT "control set".
-
The S&P 500 (CHART LINK)
-
The DJIA (CHART LINK)
-
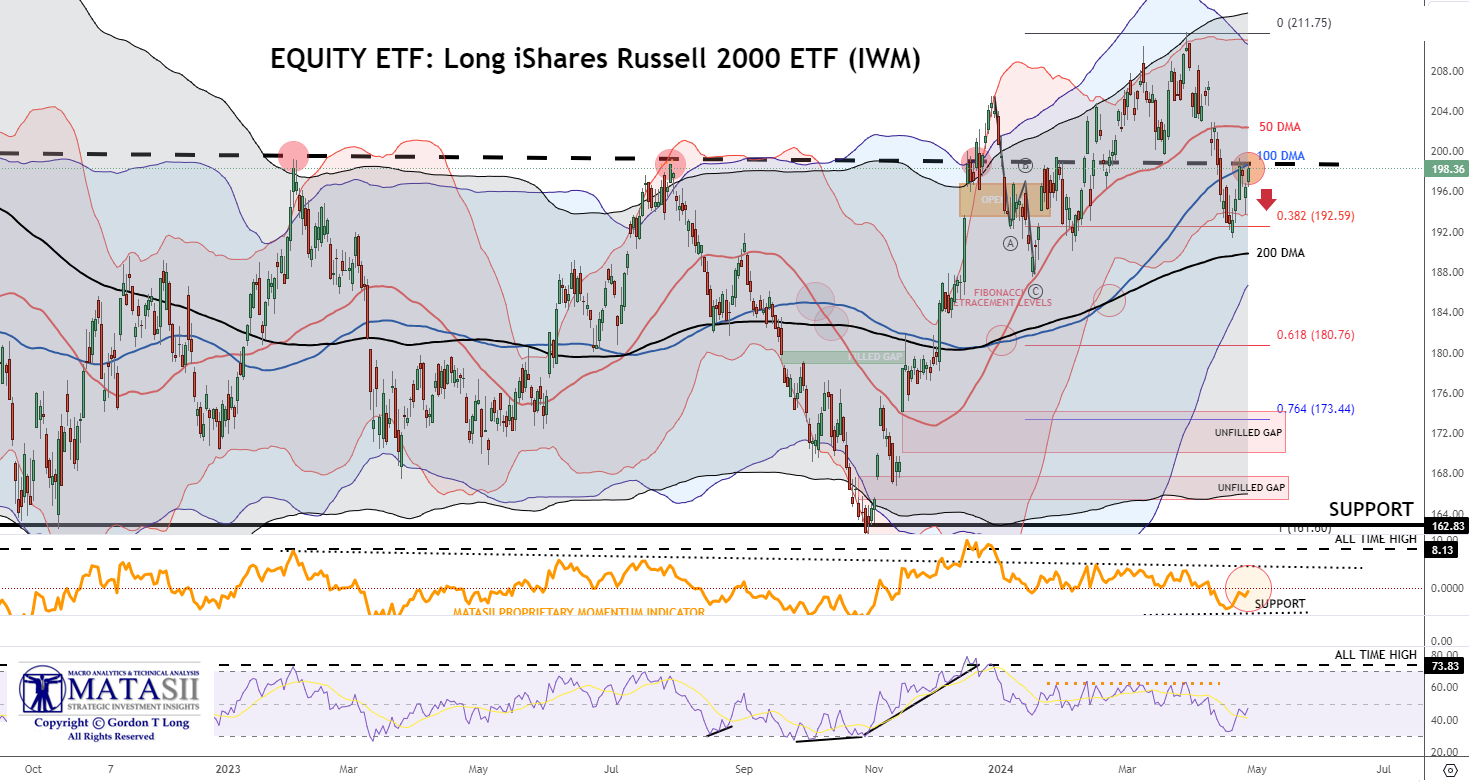
The Russell 2000 through the IWM ETF (CHART LINK),
-
The MAGNIFICENT SEVEN (CHART ABOVE WITH MATASII CROSS - LINK)
-
Nvidia (NVDA) (CHART LINK)
| |
RUSSEL 2000
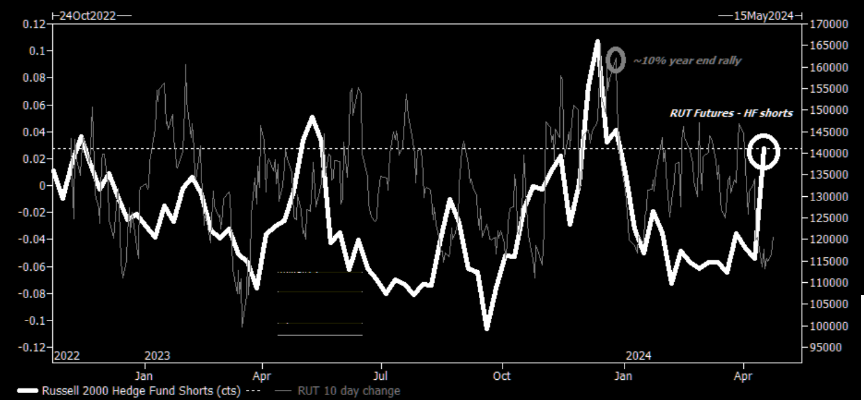
Hedge funds have been strongly adding RTY shorts!
NOTE: The positioning is approaching levels that preceded the sharp short covering we saw at the end of last year. (CHART RIGHT)
EQUITY ETF: Long iShares Russell 2000 ETF (IWM)
| |
YOUR DESKTOP / TABLET / PHONE ANNOTATED CHART
Macro Analytics Chart Above: SUBSCRIBER LINK
| |
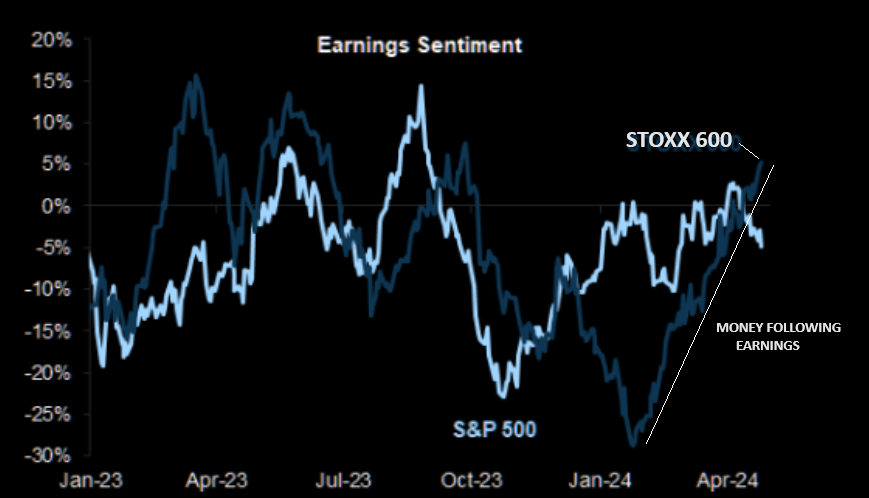
NOTE: Though Hedge funds net bought global equities at the fastest pace in nearly 3 months as overall gross trading activity increased for the 16th straight week, driven by long buys outpacing short sales (~3.6 to 1), THE ACTIVITY HAS BEEN DOMINANTLY SLANTED TOWARDS THE EU.
Earnings sentiment for Europe is trending upwards. (Chart Right)
| |
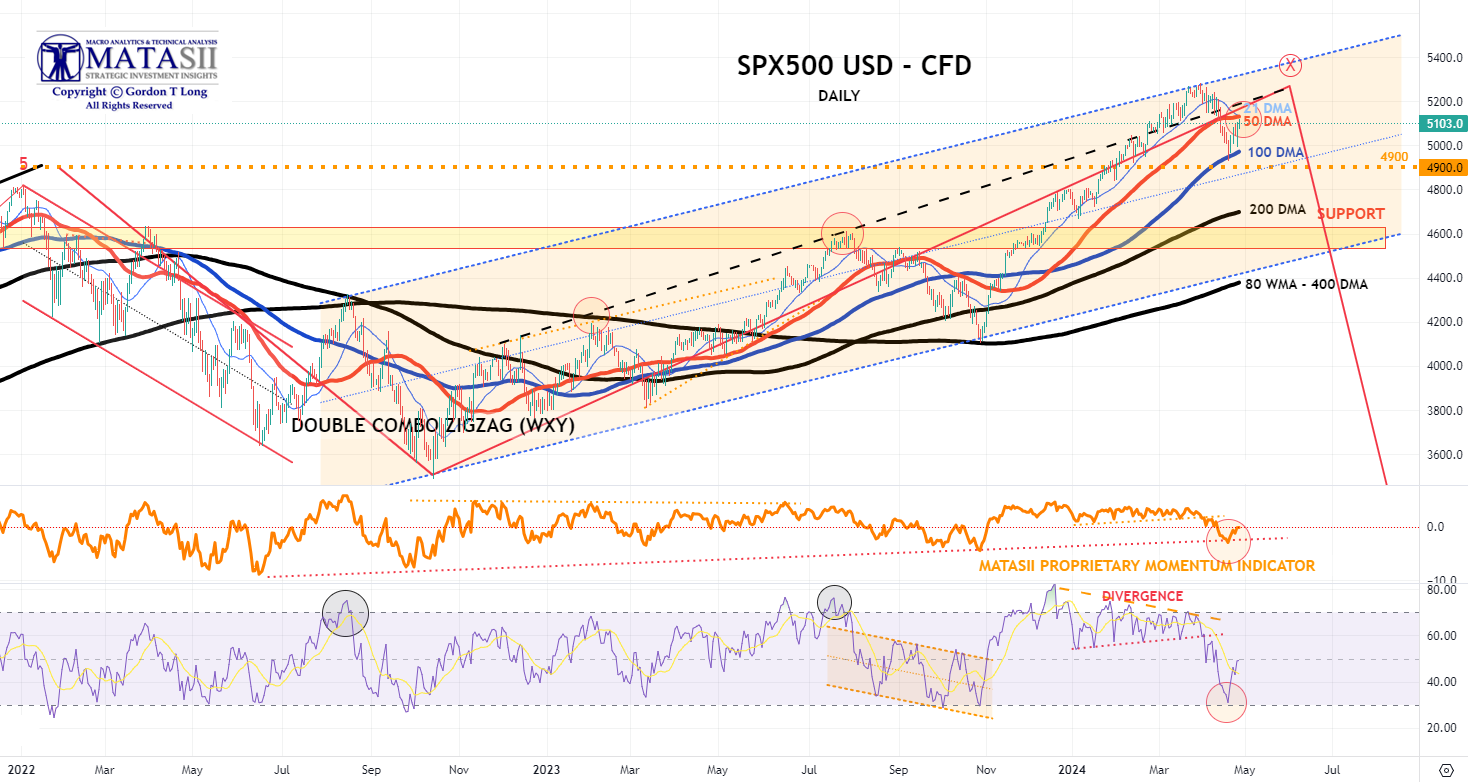
S&P 500 CFD
The S&P 500 cfd bounced off its 100 DMA and subsequently retraced to test its 50 DMA. Momentum (lower pane) also bounced off its lower support to a more neutral level.
| |
YOUR DESKTOP / TABLET / PHONE ANNOTATED CHART
Macro Analytics Chart Above: SUBSCRIBER LINK
| |
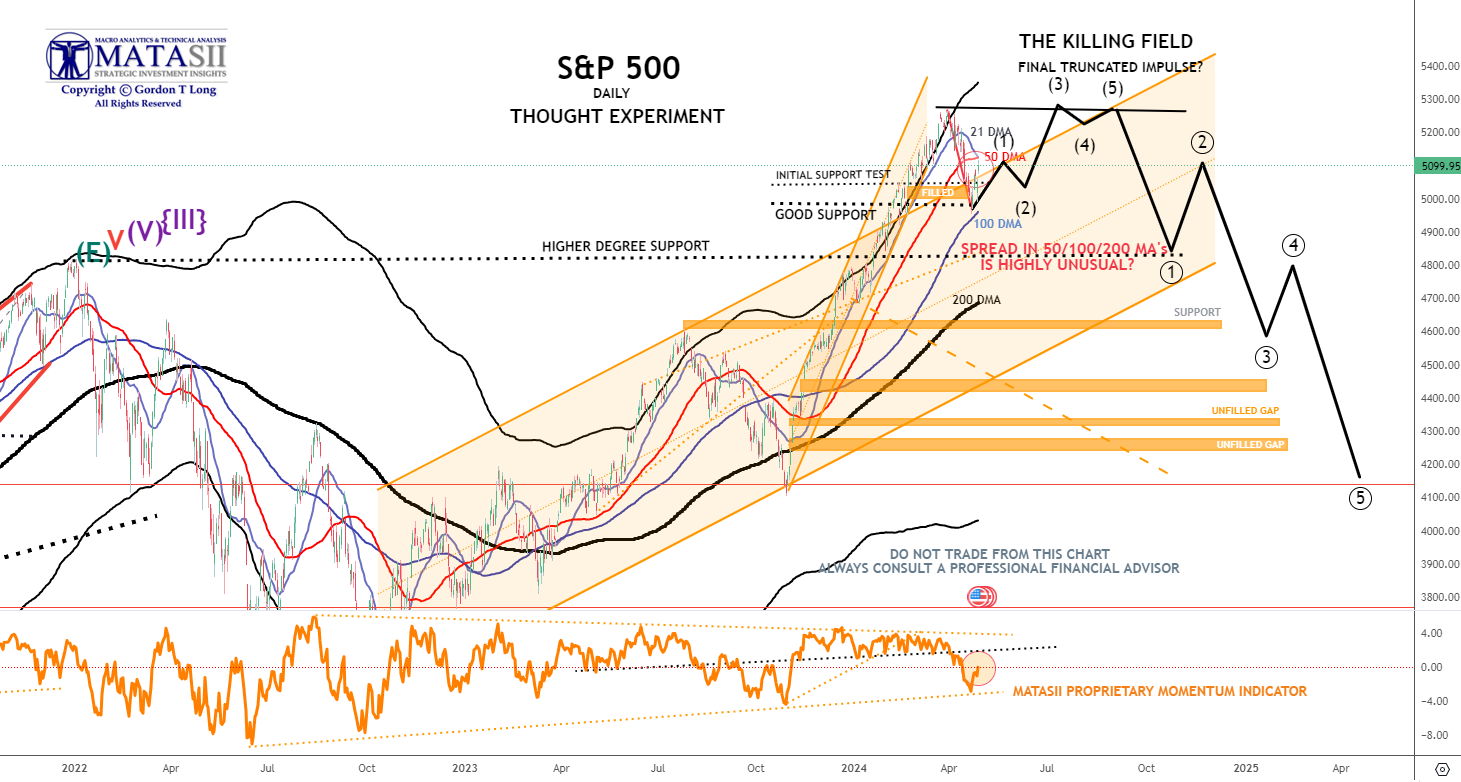
S&P 500 - Daily - Our Though Experiment
CHART RIGHT: So far this is just a "normal" bounce post the sell off. 5150 is key in SPX to the upside. The short term negative trend line comes in there, as well as the 21 day moving average, sloping negatively these days.
Our Though Experiment, which we have discussed many times previously in the way of a projection, suggests we have put in a near term top (or very close to it) and will now consolidate before possibly completing one final small impulse higher OR put in a final Wave 5 of a higher degree.
NOTE: To reiterate what I previously wrote - "the black labeled activity shown below, between now and July, looks like a "Killing Field" where the algos take Day Traders, "Dip Buyers", the "Gamma Guys" and FOMO's all out on stretchers!"
- The S&P 500 found support at its lower 100 DMA before retracing upward to retest the underside of its 50 DMA.
- Momentum (lower pane) also found support at its lower trend support line before retracing towards its upper trend momentum. From a momentum perspective it appears to still have further upside to go.
|  | |
YOUR DESKTOP / TABLET / PHONE ANNOTATED CHART
Macro Analytics Chart Above: SUBSCRIBER LINK
| |
STOCK MONITOR: What We Spotted
MONDAY
- US stocks managed to claw back some of the prior week's losses, with a rebound in Nvidia (NVDA) shares and in semis supportive of the move, underpinning technology outperformance. Elsewhere gold and oil prices were lower on a lack of geopolitical escalation seen over the weekend which also weighed on Treasuries overnight. T-notes eventually settled flat, paring the overnight losses as it tracked the bund higher ahead of a plethora of key risk events. In FX, the Dollar was flat while the Yen hit a 34-year low vs the buck ahead of the BoJ later this week. Antipodes and CAD meanwhile outperformed on the risk revival. Focus this week lies on a plethora of earnings, Tier 1 US data, including GDP and PCE, as well as the BoJ rate decision.
STOCK SPECIFIC
- Informatica (INFA) -10.5%: Confirmed it is not engaged in acquisition discussions; reaffirms FY24 outlook.
- Tesla (TSLA) -2%: Cut prices across its entire line-up in China, as well as some in other markets.
- Li Auto (LI) -5.5%: Has slashed prices by roughly 5% on four of its five models.
- Vista Outdoor (VSTO) +6.5%: It is engaged in talks with MNC Capital, although adds that it anticipates MNC will bump its prior bid.
- Quanex (NX) -3%: To acquire Tyman in a USD 1.1bln transaction.
- CNH Industrial (CNHI) -7%: Appoints Gerrit Marx to replace Scott Wine as CEO, after the latter surprisingly left to pursue other interests.
- Alcoa (AA) +2%: Upgraded at Morgan Stanley.
- Cardinal Health (CAH) -5%: Will not renew its pharmaceutical distribution contracts with UnitedHealth's (UNH) OptumRx unit, which expires at the end of June 2024.
- Paramount (PARA) -0.5%: CNBC's Faber says no bid from Apollo (APO) and Sony (SONY) has been submitted for Paramount (PARA).
- Verizon (VZ) -4.5%: Posted a mixed report; revenue missed while profit beat.
- Boeing (BA) +0.4%: Expects a slower increase in the rate of the 787 production and deliveries due to supplier shortages on "a few key parts"; Boeing (BA) said it still plans to steadily increase its rate to meet strong demand.
- Wolfspeed (WOLF) +8%: Jana partners urges co. to consider a potential sale, and other strategic alternatives, to boost its share price, Reuters reported.
TUESDAY
- Stocks continued their rally after the slump seen last week. The majority of the upside was sparked after the soft US PMI data with some cautious commentary on the labor market supporting the dovish move. As a result, the Dollar sold off throughout the session while T-Notes bull steepened. The 2yr auction was solid but it had little market impact with the PMI data driving price action throughout the session. In FX, the Dollar lagged while Pound outperformed after hawkish commentary from BoE Chief Economist Pill despite dovish remarks from Ramsden on Friday. The Yen saw some strength overnight on remarks from Finance Minister Suzuki that last week's discussions in Washington have laid the groundwork for Japan to take appropriate FX action. There was also a Nikkei sources article noting the BoJ will discuss the rapid slide of the Yen at their meeting later this week; helping keep USD/JPY sub 155.00. EUR/USD reclaimed 1.07 thanks to the dollar weakness. Meanwhile, on earnings, UPS, GE and GM figures were strong although Materials name underwhelmed.
INFLATION BREAKEVENS: 5yr BEI -0.4bps at 2.467%, 10yr BEI -0.5bps at 2.409%, 30yr BEI -0.3bps at 2.352%.
REAL RATES: 10Y -- 2.2285%
STOCK SPECIFIC
- Apple (AAPL) +0.5%: iPhone sales in China -19% in Q1 and down 24% Y/Y in the first six weeks of the year, according to Counterpoint Research.
- HashiCorp (HCP) +19.5%: IBM (IBM) reportedly nears a deal for HashiCorp, according to WSJ.
WEDNESDAY
- Stocks were sold on Wednesday with losses led by the Nasdaq as the Tech sector underperformed with semis weighed on by a poor ASML earnings report.
- Stocks had pared some of the weakness after a stellar 20yr bond auction before selling resumed into the closing bell.
- Elsewhere, the Dollar was sold as it tracked US yields lower which in turn supported the Yen, Franc and Euro but the Antipodes outperformed despite the risk-off tone of trade.
- GBP only saw slight gains vs the Buck but it was weaker vs the Euro despite hotter-than-expected inflation, but BoE officials did not seem too concerned. There were few developments on geopolitics today other than reports suggesting Israel was going to respond to Iran on Monday, but ultimately decided to wait - a response seems a given but it is still a matter of when and how.
- Elsewhere, trade concerns between the US and China are rising after US President Biden was calling for higher tariffs on Chinese steel.
- The lack of updates saw oil prices pare some of the recent strength with inventory data showing a larger build than expected supporting the move while gold prices saw slight losses, despite the weaker dollar.
- Attention turns to more Fed speak overnight and on Thursday, with Thursday US data focusing on Jobless Claims, Existing Homes Sales and the Philly Fed business index.
INFLATION BREAKEVENS: 5yr BEI +0.1bps at 2.468%, 10yr BEI +0.2bps at 2.411%, 30yr BEI +1.1bps at 2.362%.
REAL RATES: 10Y -- 2.241%
STOCK SPECIFIC
- Tapestry (TPR) -1% Capri (CPRI) -3%: FTC is preparing to sue to block Tapestry's USD 8.5bln takeover of Capri Holdings, according to NYT.
- Mobileye (MBLY) +3%: Secured orders for 46mln of the EyeQ6 Lite driver-assistance chips.
- Eli Lilly (LLY) +0.5%: Weight loss drug (Trezepatide) met all primary endpoints and key secondary endpoints in two Phase 3 clinical trials.
- Sage Therapeutics (SAGE) -20%: Phase 2 study of dalzanemdor did not meet primary endpoint.
- Autodesk (ADSK) -6%: Said it will further delay its annual 10-K filing due to an ongoing internal investigation of its board of directors.
- Knight-Swift Transportation (KNX) -4%: Lowers Q1 and Q2 guidance.
- Microsoft (MSFT) -0.7%: To reportedly avoid a formal EU probe over USD 13bln OpenAI deal, according to Bloomberg.
- Zuora (ZUO) +12%: Exploring potential options after receiving acquisition interest from potential buyers, according to Reuters sources.
- Snap (SNAP) +5%: US House Speaker Johnson says TikTok divest-or-ban bill is moving fast through Congress.
- Nvidia (NVDA) -3.5%: Set to acquire AI infrastructure orchestration and management platform Run:ai for around USD 700mln in the coming days, according to Calcalist. NVDA later confirmed the news.
- Social Media (SNAP -2.5%, META-0.5%): Senate approved a bill that could see TikTok banned in the US.
- UnitedHealth's (UNH) +0.5%Optum ending virtual care is a positive for Teladoc (TDOC) +0.5%, according to BofA
- IBM (IBM) +0.8% is said to offer about USD 35/shr for HashiCorp (HCP) +7.5%, according to Bloomberg
- David Einhorn Greenlight Capital Letter: New buys in HPQ, PENN and ROIV, reduced stake in TECK.
- UK CMA reportedly seeks views on Microsoft (MSFT) and Amazon's (AMZN) AI partnerships, according to Bloomberg.
THURSDAY
- Stocks were lower on Wednesday after a plunge in META post-earnings and a hot Q1 Core PCE Prices figure, which introduced upside risks to Friday's March PCE data, saw Fed pricing shift hawkishly.
- However, the indices closed well off worst levels with semiconductors leading the recovery ahead of more key earnings with INTC, MSFT, and GOOGL all set to report after the close on Thursday.
- Treasuries bear-flattened after the hot Q1 core PCE prices, overlooking the lower than expected headline Q1 GDP, with the long-end recovery somewhat into the close; there was little reaction to the 7yr auction which saw average demand.
- The Dollar was eventually lower, unwinding initial strength on the data gradually, while USD/JPY hit new peaks of c. 155.75 ahead of the BoJ on Friday.
- Oil prices were firmer in choppy trade after losses on the stagflationary headline US GDP figures were unwound through the session.
- Metals saw strong gains.
INFLATION BREAKEVENS: 5yr BEI -2.0bps at 2.452%, 10yr BEI +1.9bps at 2.434%, 30yr BEI +2.8bps at 2.394%.
REAL RATES: 10Y -- 2.281%
FRIDAY
- Stock Indices saw strong gains on Friday (SPX +1%, NDX +1.7%) although that appeared mostly a big tech earnings story (GOOGL +10%, MSFT +2%) with the equal-weight S&P flat.
- The macro highlight was the March Core PCE, +0.32% M/M vs exp. +0.3%, which led to a kneejerk relief dovish reaction after the hot Q1 GDP Prices data on Thursday stoked concerns over a hot March core PCE print today, with the hot Q1 data largely a function of upward revisions to the January data.
- Treasuries bull-flattened after the data (10s -4bps at 4.67%), with the long end outperforming (2s flat at 5.00%) ahead of next week's month-end, QRA, and FOMC.
- The Dollar Index saw notable gains although that was largely a function of the Yen posting its largest one-day fall of the year after a lack of hawkishness or intervention commentary at the BoJ, with USD/JPY hitting a new peak of 157.92 here at the close despite an earlier mini flash crash to lows of 155.00.
- Oil futures were modestly firmer in choppy trade, affirming a W/W gain for the first time in three weeks with little market-moving energy news flow.
- Metals saw strength.
INFLATION BREAKEVENS: 5yr BEI +0.5bps at 2.457%, 10yr BEI +0.3bps at 2.438%, 30yr BEI +0.7bps at 2.399%.REAL RATES: 10Y -- 2.28%
STOCK SPECIFIC
- U.S. Silica Holdings (SLCA) +21.5%: Apollo Funds is to acquire U.S. Silica Holdings for USD 15.50/shr in cash, according to Bloomberg. Note, SLCA closed Thursday at USD 13.06/shr.
- Boeing (BA) +0.5%: Fitch revises Boeing's outlook to negative, but affirmed Boeing's 'BBB-' long-term issuer default rating and 'F3' short-term IDR.
- Paramount (PARA) -2%: Reportedly considering removing CEO Bob Bakish as turmoil over sales talks deepen, according to WSJ.
| |
BOND MARKET
CONTROL PACKAGE
There have FIVE charts we have outlined in prior chart packages that we will continue to watch closely as a CURRENT "control set".
- The 10Y TREASURY NOTE YIELD - TNX - HOURLY (CHART LINK)
- The 10Y TREASURY NOTE YIELD - TNX - DAILY (CHART LINK)
- The 10Y TREASURY NOTE YIELD - TNX - WEEKLY (CHART LINK)
- The 30Y TREASURY BOND YIELD - TNX - WEEKLY (CHART LINK)
- REAL RATES (CHART LINK)
FISHER'S EQUATION = 10Y Yield = 10Y INFLATION BE% +REAL % = 2.414% + 2.193% = 4.607%
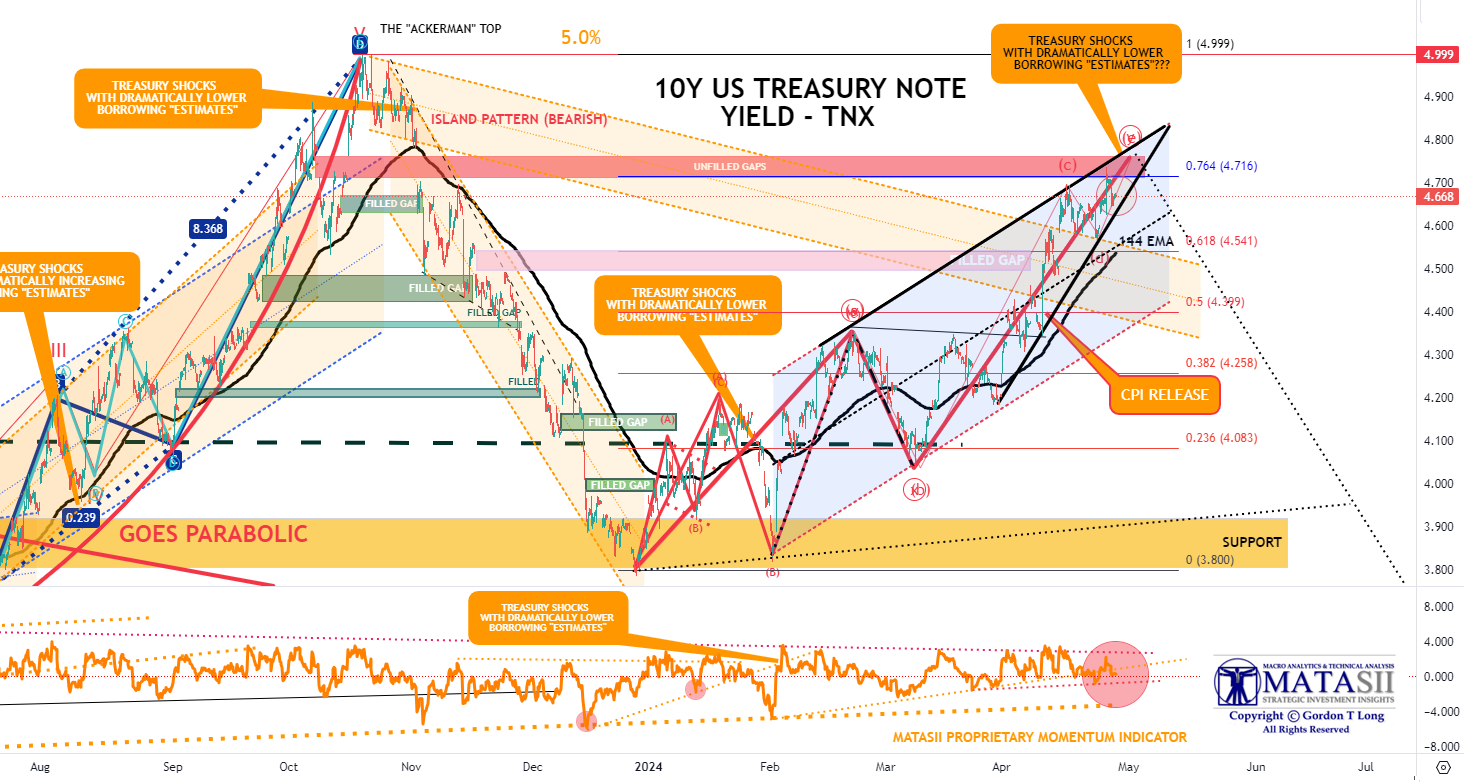
THURSDAY 7YR TREASURY AUCTION
- A respectable, albeit not amazing, USD 44bln 7yr auction from the Treasury, stopping on the screws at 4.716%, not as strong as March's 0.8bp stop-through despite the c. 50bps of cheapening since then, albeit better than the six-auction avg. tail of 0.6bps.
- The auction was covered 2.48x beneath the prior 2.61x and avg. 2.57x.
- Dealers were left with 13.9%, more than March's 12.9% but beneath the avg. 15.1%, with the rise in Directs to 21% from 17.4% offset by the fall in Indirects to 65.1% from 69.7%.
- There were certainly some concerns that the rates volatility after the hot Q1 GDP prices release earlier on Thursday could have seen primary demand step back, but that has not been the case, despite the upside risks to Friday's March Core PCE data.
- Additionally, given the auction settles on April 30th, the offering likely benefitted from some month-end demand, given it is the last coupon auction of the month.
- Note also that next week's QRA is expected to be relatively uneventful, with the Treasury expected to keep coupon auction sizes unchanged.
- The Intermediate term rise in the 10Y TNX Yield appears to be completed with a touch of the 4.76%.
- Monday's Treasury upcoming announcement of the size of auctions planned by treasury type and Wednesday QRA schedule of auctions with size will be extremely important to the Treasury market.
- Yellen has every incentive to signal slightly smaller sizes to the market, now that she has taken the TGA to $1Trillion in size.
|  | |
YOUR DESKTOP / TABLET / PHONE ANNOTATED CHART
Macro Analytics Chart Above: SUBSCRIBER LINK
| |
NOTICE Information on these pages contains forward-looking statements that involve risks and uncertainties. Markets and instruments profiled on this page are for informational purposes only and should not in any way come across as a recommendation to buy or sell in these assets. You should do your own thorough research before making any investment decisions. MATASII.com does not in any way guarantee that this information is free from mistakes, errors, or material misstatements. It also does not guarantee that this information is of a timely nature. Investing in Open Markets involves a great deal of risk, including the loss of all or a portion of your investment, as well as emotional distress. All risks, losses and costs associated with investing, including total loss of principal, are your responsibility.
FAIR USE NOTICE This site contains copyrighted material the use of which has not always been specifically authorized by the copyright owner. We are making such material available in our efforts to advance understanding of environmental, political, human rights, economic, democracy, scientific, and social justice issues, etc. We believe this constitutes a ‘fair use’ of any such copyrighted material as provided for in section 107 of the US Copyright Law. In accordance with Title 17 U.S.C. Section 107, the material on this site is distributed without profit to those who have expressed a prior interest in receiving the included information for research and educational purposes. If you wish to use copyrighted material from this site for purposes of your own that go beyond ‘fair use’, you must obtain permission from the copyright owner.
========
| |
MATASII'S STRATEGIC INVESTMENT INSIGHTS | |
2020 VIDEOS OUTLINING THE COMING RISE IN INFLATION, STAGLFLATION & COMMODITY PRICES | |
|
THE REGULATORY STATE
RELEASED - 01-17-24 --- 212 Page Paper
FULL 212 PAGE PDF DOWNLOAD
| |
IDENTIFICATION OF HIGH PROBABILITY TARGET ZONES | |
Learn the HPTZ Methodology!
Identify areas of High Probability for market movements
Set up your charts with accurate Market Road Maps
Available at Amazon.com
| |
The Most Insightful Macro Analytics On The Web | | | | |