|
LONGWave - MAY 2024
Technical Analysis - 05/20/24
| |
SMALL BUSINESS PAIN IS SO SEVERE THAT IT CAN'T CONTINUE TO BE IGNORED!
OBSERVATIONS: RELENTLESS REGULATIONS, ELEVATED INFLATION & SOON SPIRALLING TAXATION
Canada just announced an increase in the capital gains tax from 50% to 67%. President Biden has likewise proposed increasing the US capital gains tax to 44.6% and additionally starting taxation on Unrealized Capital Gains. To cover the administrations planned 10 Year Biden Budget revenue increase requirements, it is estimated to be an additional $5.6 Trillion - yet to be found? Scheduled changes to the individual income tax made by the 2017 Tax Act are set to expire by the end of calendar year 2025 and Biden has said he will not renew them to assist in finding new tax revenue.
To stop the rich from obviously fleeing the US and taking jobs with them, the Biden administration is additionally supporting a G7 push for a minimum 2% Global Taxation on the "wealthy".
Like taxing Unrealized Capital Gains, this is a new way of taxation. We currently have Local, State and Federal Tax regimes. We will be introducing a fourth level - A Global Tax Regime. When Personal Income was first introduced in 1913 it was to tax the rich only. Today even the destitute in the US must pay personal tax. Once the government introduces anything it can be counted on to quickly "morph" into something unrecognizable in very short order!
The Global 2% Wealth Tax proposal claims to address economic inequality by mandating a minimum tax on the wealth of the world’s wealthy. Here are the key points:
- Objective: The goal is to apparently raise funds for needed global initiatives related to poverty reduction, climate change, and other critical challenges (no further specifics given).
- Tax Rate: The proposal suggests that "billionaires" should pay a minimum of 2% of their wealth annually. This tax would apply to their "fast-growing" wealth. (Fast growing often reverses but losses appear not to be tax deductible.)
-
Estimated Revenue: If implemented, this measure could generate approximately £250 billion (about $313 billion) per year.
-
Supporting Countries: Brazil, Germany, South Africa and Spain have expressed support for this initiative. They believe that such a tax would help reduce inequality and provide much-needed public funds after the economic shocks caused by the pandemic, climate crises and military conflicts.
-
Global Impact: The annual revenue from this tax could cover the estimated cost of damage caused by extreme weather events in a given year.
- Technical Details: French economist Gabriel Zucman is working on the technical aspects of the plan, which will be further discussed by the G20 group of leading developed and developing countries. ===>
| |
 | |
THIS WEEK WE SAW
Exp=Expectations, Rev=Revision, Prev=Previous
US
NY Fed SCE (April) 1yr ahead inflation expectations 3.3% (prev. 3.0%), 3yr at 2.8% (prev. 2.9%), 5yr at 2.8% (prev. 2.6%), while year-ahead expected home price increase is at 3.3% (prev. 3.0%).
US PPI exFood/Energy MM (Apr) 0.5% vs. Exp. 0.2% (Prev. 0.2%, Rev. -0.1%)
US PPI Final Demand MM (Apr) 0.5% vs. Exp. 0.3% (Prev. 0.2%, Rev. -0.1%)
US CPI MM SA (Apr) 0.3% vs. Exp. 0.4% (Prev. 0.4%)
US Cleveland Fed CPI (Apr) 0.3% (Prev. 0.4%)
US NY Fed Manufacturing (May) -15.6 vs. Exp. -10.0 (Prev. -14.3)
US Retail Sales MM (Apr) 0.0% vs. Exp. 0.4% (Prev. 0.7%, Rev. 0.6%)
US Retail Control (Apr) -0.3% vs. Exp. 0.1% (Prev. 1.1%, Rev. 1.0%)
US NAHB Housing Market Index (May) 45.0 vs. Exp. 51.0 (Prev. 51.0)
US Industrial Production MM (Apr) 0.0% vs. Exp. 0.1% (Prev. 0.4%, Rev. 0.1%)
US Philly Fed Business Index (May) 4.5 vs. Exp. 8.0 (Prev. 15.5)
US Import Prices MM (Apr) 0.9% vs. Exp. 0.3% (Prev. 0.4%, Rev. 0.6%)
===> In summary, the Global 2% Wealth Tax claims to create a fairer tax system by ensuring that billionaires contribute a portion of their wealth to address global challenges.
"It represents a significant step toward combating inequality and financing essential public goods."
If you actually believe any of this tripe, I have a bridge to sell you in New York! What is true is the debt binge we have been on must now be paid for - or at least the interest on the debt which at $2T today will soon also be unrecognizable.
| |
========================= | |
|
WHAT YOU NEED TO KNOW!
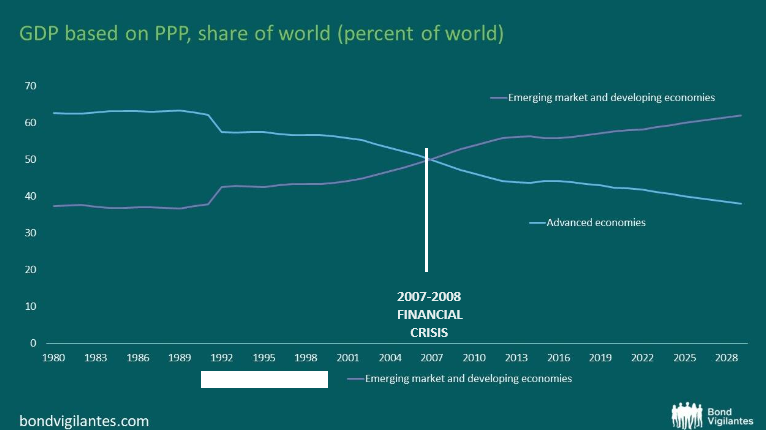
PURCHASING POWER PARITY IS THE HIDDEN STORYOF DEBT
Purchasing power parity (PPP) measures the price of specific goods in different countries and compares the purchasing power of their currencies. It's the rate at which a country's currency would need to be converted to another country's currency to buy the same amount of goods and services in each country.
Heavily indebted Developed Economies' Fiat Currencies in aggregate are steadily devaluing when compared to less indebted and more commodity (real asset) Economies. There is a price to be paid for high sovereign debt.
RESEARCH
-
SMALL BUSINESS HEADWINDS: There is Nothing Small About the Headwinds!
- The reality of the US economy is that 6.4 million small US companies account for 85 percent of US jobs. Included in the remaining15% are 28 million Sole Proprietorships of less than 3 employees. The S&P 500 corporations contribute to the tune of 0.01%.
- American small businesses are the largest victims of a stagflationary economy, which is being weighed down by big government policies.
- Job Creators Network's national poll of small businesses finds two-thirds of respondents say the current economic climate may force them to close their doors. Most businesses say the price hikes they are facing are more than the official inflation numbers suggest. One-third say elevated neighborhood crime is reducing their earnings. Small businesses are whimpering, not booming.
- The clear sentiment of National Small Business Week was a sense that Biden and Democrats are waging a war on small businesses.
-
REGULATING DIESEL HAULING OUT OF BUSINESS: Another Crippling Impact On Small To Medium Sized US Businesses
- The Biden administration announced last month that it plans to spend nearly $1.5 billion to make the U.S. freight industry “zero-emissions.” This is after the EPA finalized the “strongest ever” greenhouse gas standards for heavy-duty vehicles, a move that attracted strong criticism from trucking organizations.
- Ryder estimates cost increases to eventually add about 0.5–1 percent to overall price inflation in the US economy since transportation costs have a direct bearing on the price of goods sold in markets across the country,
- The problem is that the "school buses, trash and delivery trucks" operated by the cities and states are not accountable to making a profit from these vehicles, whereas commercial fleets must be profitable.
- This is yet another example of the crippling of small and medium sized business in America.
| |
|
DEVELOPMENTS TO WATCH
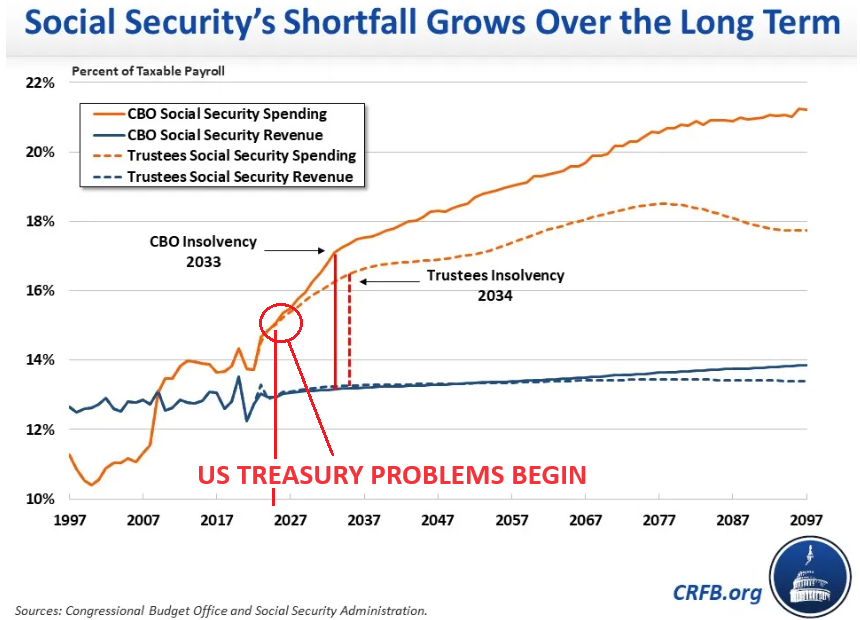
WHO WILL BUY THE COMING SOCIAL SECURITY TREASURY ROLL-OVER??
- Approximately one third of all U.S. government debt is “owed” to another government department! That Department is our Social Security System.
- Social Security will be insolvent by 2034.
- However long before that, the Social Security Treasury holdings will be liquidated to pay retiree benefits with no new buying occurring.
- The US Treasury must pay out the face value of the maturing bonds.
WHERE WILL THAT MONEY COME FROM???
SHOULD THE BUREAU OF ECONOMIC ANALYSIS (BEA) BE AUDITED?
- Long used Private Data, which has traditionally supported the BEA statistics, no longer matches nor supports BEA reporting. The divergences have become larger and more consistent.
- It has become such a major issue that it is amazing more public outcry is not being raised for an independent audit process being implemented.
- Issues with scoring budget proposals became such a similar political game years ago that an independent, non-partisan process was forced to be implemented. Are we at such a point with the BEA?
THESE ARE MAJOR INFLATIONARY ICEBERGS
| |
|
GLOBAL ECONOMIC REPORTING
1- APRIL CPI
- It was a miss but not for the reason expected!
- OER catch down STILL to kick in.
- Next few CPI print likely will be a dovish meltdown, which means the next few months CPI will likely see even bigger misses.
2- APRIL PPI
- April Producer Prices rose 0.5% MoM (vs +0.3% exp), with March's +0.2% MoM revised down to -0.1% MoM.
- The downward revision did not stop the YoY read rising to 2.2% (from +2.1% in March).
- This is the highest YoY read since April 2023 and is the fourth hotter than expected headline PPI print.
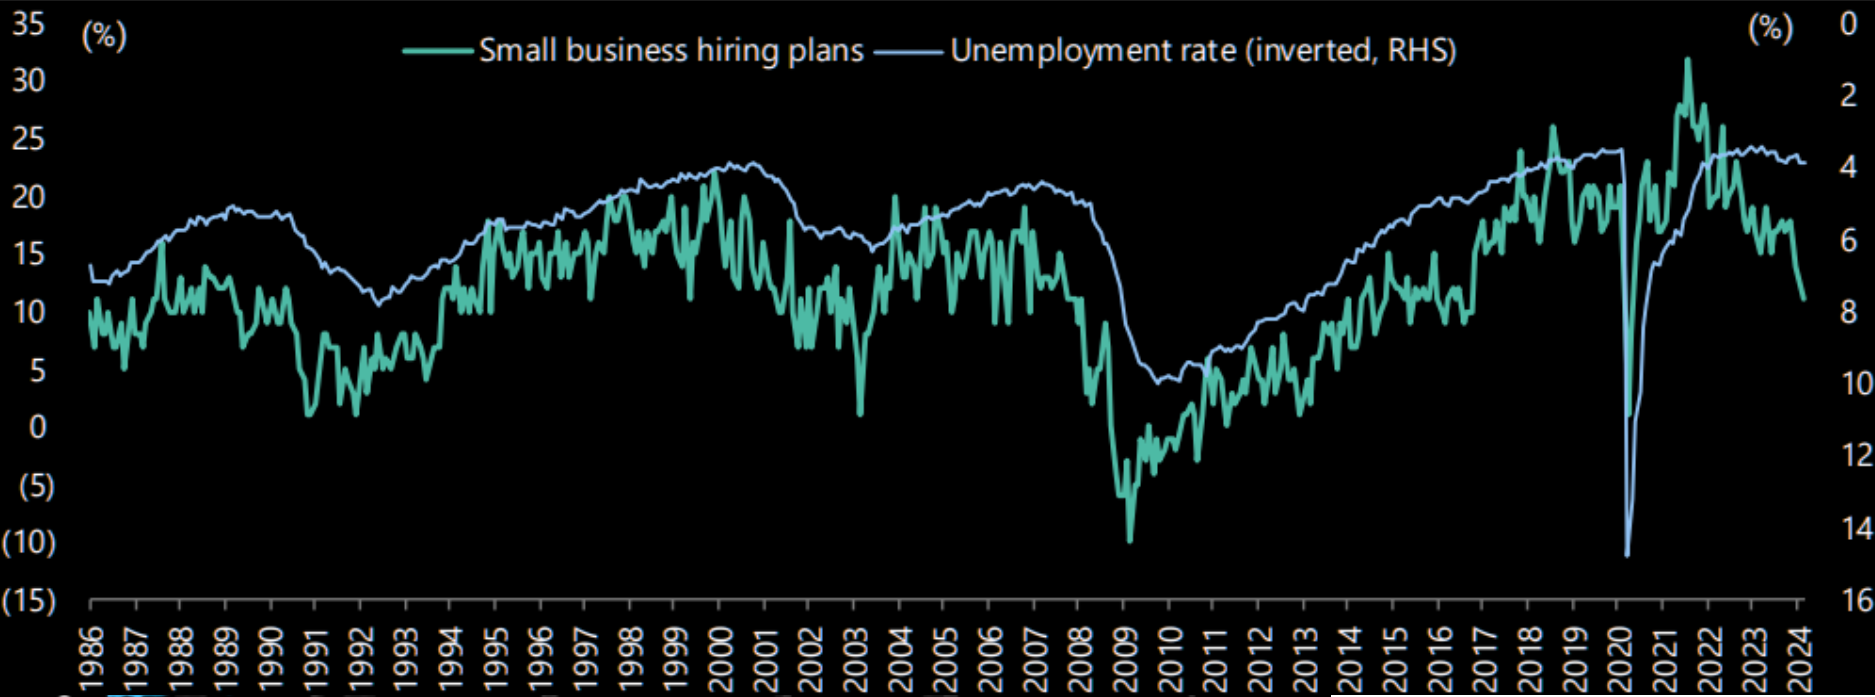
3- NFIB SMALL BUSINESS OPTIMISK INDEX
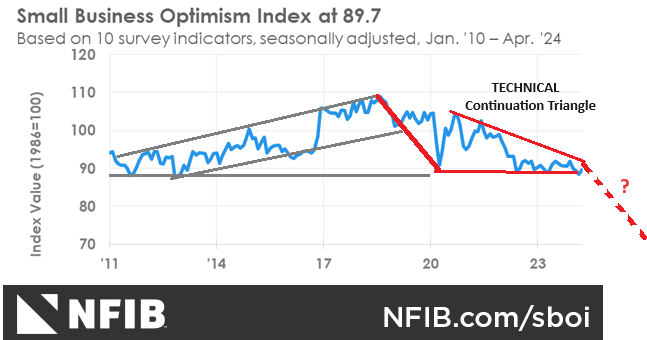
- Index at levels LOWER than the COVID Lows!
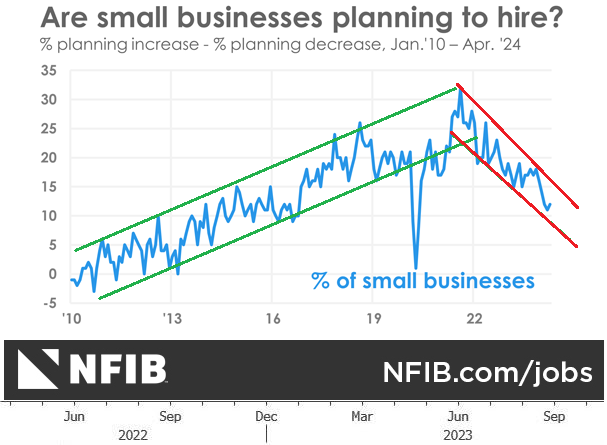
- Plans to Hire in Freefall
| |
|
In this week's "Current Market Perspectives", we focus on the signals that sentiment, fundamentals and various markets (Credit, Bond and Equity) are currently giving us.
=========
| |
|
SMALL BUSINESS HEADWINDS: There is Nothing Small About the Headwinds!
The reality of the US economy is that 6.4 million small US companies account for 85 percent of US jobs. Included in the remaining15% are 28 million Sole Proprietorships of less than 3 employees. The S&P 500 corporations contribute to the tune of 0.01%.
So why do we treat the pillars of US employment so badly, especially considering the US is nearly a 70% consumption economy dependent on worker wage spending? The short answer is Political Campaign contributions, Lobbying and Media Advertising influence. Yes the other 85 percent participate in these activities, but they are "small potatoes" in comparison. One truism of Washington is it always follows the money (and only the money).
So what has this imbalance wrought us lately?
- Profits are softening while corporate profits are experiencing a major surge. The later benefits from Inflation while the former suffers from it!
- The AI revolution is elevating corporate PE ratios while small businesses currently are only seen to marginally benefit or will be hurt if high paying corporate employment is impacted.
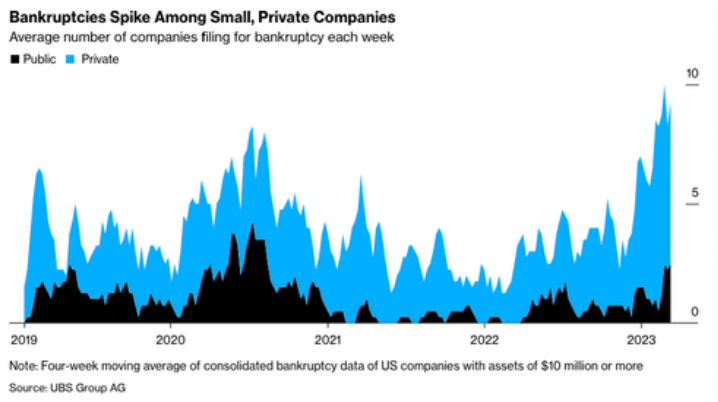
- Sole Proprietors’ income as a share of national income has been falling, small business bankruptcies are on the rise and fewer new businesses are starting.
|  | |
American small businesses are the largest victims of a stagflationary economy, which is being weighed down by big government policies. This was the most important storyline coming out of this Month’s National Small Business Week, which was summarized quite pointedly by Alfredo Ortiz via RealClearPolicy:
President Biden is claiming a small business "boom" under his administration. The reality is entrepreneurs grapple with a triple threat: a decelerating economy, soaring inflation, and escalating credit expenses due to his bad policies.
American consumers have a record $1.2 trillion of credit card debt. They are experiencing declining real wages and face a cost-of-living crisis. They can't afford to keep up their discretionary spending, which small businesses rely on to survive and thrive. It now costs the average American family $12,000 more to enjoy the same living standards as before President Biden took office.
Since Biden's inauguration, wholesale costs for small businesses have risen by 20%. To maintain their slim profit margins, entrepreneurs are forced to raise prices, alienating loyal customers and reducing demand. Commentators and the media don't understand that there's only so much customers are willing to pay for nonessential goods and services. To contend with outrageous inflation, the Fed raised interest rates to a 22-year high. High credit costs have dried up access to capital, making it impossible or prohibitively expensive for small businesses to expand or even continue operating. The Fed was supposed to start cutting interest rates soon, but as I predicted, given resurgent inflation, they have no other choice but to maintain today's elevated levels, continuing the credit crunch.
Given these headwinds, it's no surprise that Job Creators Network's national poll of small businesses finds two-thirds of respondents say the current economic climate may force them to close their doors. Most businesses say the price hikes they are facing are more than the official inflation numbers suggest. One-third say elevated neighborhood crime is reducing their earnings. Small businesses are whimpering, not booming.
Coverage of National Small Business Week was no surprise – the mainstream media refuses to admit that big government policies are why small businesses are suffering. Consider the reckless spending fueling inflation's fire. The annual deficit is on track to surpass $2 trillion this year, and the nation adds another $1 trillion to the national debt every three months. This money printing is rapidly devaluing the value of the dollar, hurting small businesses and consumers.
The Biden administration is also in the midst of a regulatory onslaught that's hitting small businesses hard. It recently issued rules:
- Expanding overtime pay
- Banning noncompete contracts
-
Mandating electric vehicle use and
- Regulating internet access
According to the American Action Forum, the Biden administration has issued more than $1 trillion of regulations – 30 times more than under President Trump.
Biden's biggest threat to small businesses is still to come. He recently promised that if he's reelected, he will dramatically raise taxes on small businesses by letting the Tax Cuts and Jobs Act expire in 2025 as scheduled. That means small businesses would face a 20% tax hike, the end of bonus depreciation, and higher tax brackets on their earnings. This massive tax hike would throw today's stagflationary economy into recession.
Here's the real message of National Small Business Week: Biden and Democrats are waging a war on small businesses that won't end until they've been voted out of office.
I asked my barber, who has four barbers employed, if what I was reading about small business headwinds was true. A 15 minute haircut turned into 30 minutes as I clearly hit a soft spot. The response (only the suitable for publication part) was:
"I was in before 6:45 AM today doing paper work for a shop I open at 9. By the time I clean up and leave in the evening it is 7:30 PM. Then last night I spent the evening doing an online state mandated course. The course was intended to teach me how to identify family abuse that may be occurring in client homes, how to ask specific questions and how to report it".
The rest of the conversation centered around:
1- What does this have to do with barbering?
2- What are my legal liabilities and responsibilities for non-conformity for myself and my employees?
3- When did I start working for the government?
This is what I think the Small Business Week was gripping about when talking about regulations!
| |
|
REGULATING DIESEL HAULING OUT OF BUSINESS
The Biden administration announced last month that it plans to spend nearly $1.5 billion to make the U.S. freight industry “zero-emissions.” This is after the EPA finalized the “strongest ever” greenhouse gas standards for heavy-duty vehicles, a move that attracted strong criticism from trucking organizations.
As part of the program, the Environmental Protection Agency (EPA) will offer $1 billion (2/3 of the money) from the Inflation Reduction Act solely to cities and states to replace Class 6 and Class 7 heavy-duty vehicles (HDVs) — which include "school buses, trash and delivery trucks" — with zero-emissions vehicles according to the White House. The money is going primarily to politically managed tax based government organizations who are glad to receive monies to dole out from an expanded beneficial revenue source.
The problem is that the "school buses, trash and delivery trucks" operated by the cities and states are not accountable to making a profit from these vehicles.
Making a profit from these zero-emissions HDV's is the purview of of Commercial Fleet Operators and Small Business Owner Operators. Here is their loudly expressed view and the consultants they hired:
-
ROLAND BERGER - Consulting Report: Full electrification of the U.S. commercial truck fleet would be an expensive affair. The cost of new electric trucks is twice or three times that of their diesel equivalents. A diesel Class 8 truck costs about $180,000, and a battery-electric truck costs more than $400,000.
-
AMERICAN TRANSPORTATION RESEARCH INSTITUTE: Estimated that electrifying the entire vehicle fleet in the United States will consume 40 percent of the United States’ existing electricity generation while requiring a 14 percent overall increase in energy generation.
-
CLEAN FREIGHT COALITION (CFC):
- There is currently no network in the United States where truck drivers can take rest breaks and charge their EV batteries at the same time.
- CFC estimates that electrifying the United States’ current commercial vehicle fleet would necessitate a $1 trillion investment.
- INTERNATIONAL COUNCIL ON CLEAN TRANSPORTATION
- Calculates that almost 700,000 chargers will be required to accommodate the 1 million Class 4, 6, and 8 electric trucks expected to be deployed by 2030.
- This alone will consume 140,000 megawatts of electricity per day, which is equivalent to the daily electricity needs of roughly 5 million U.S. homes.
COMMERCIAL FLEET OPERATORS
-
RYDER - A Transportation and Logistics Firm (Full Report)
- Ryder estimates cost increases to eventually add about 0.5–1 percent to overall price inflation in the US economy, since transportation costs have a direct bearing on the price of goods sold in markets across the country,
- The potential cost of transportation if internal combustion engine trucks are converted to EVs:
-
There is a 5 percent cost increase for light-duty EVs and a 94–114 percent increase for heavy-duty trucks, the May 8 report states.
- For a fleet of 25 mixed vehicles — light-, medium-, and heavy-duty trucks — costs surge by 56–67 percent.
- "We’re facing regulations aimed at accelerating broader EV adoption when the technology and infrastructure are still developing, Until the gap in TCT [total cost to transport] for heavier duty vehicles is narrowed or closed, we cannot expect many companies to make the transition; and, if required to convert in today’s market, we face more supply chain disruptions, transportation cost increases, and additional inflationary pressure.”
- In California, the annual TCT increase for a heavy-duty EV tractor was approximately $315,000, with the number rising to more than $330,000 in Georgia. In both cases, equipment costs were the biggest contributor to the increase, rising by 500 percent.
- There were 16.4 million Class 3 to Class 8 commercial vehicles in operation in the United States, out of which only an estimated 18,000 EVs have been deployed. “Therefore, if companies are required to convert to EVs in the near future, availability and production of EVs may be far less than the vehicles needed to run America’s supply chains,” the report states.
-
“Ryder’s analysis underscores the reasons EV adoption for commercial vehicles remains in its infancy. In addition to the limited support infrastructure and EV availability, the business case for converting to EV for most payload and mileage applications, is extremely challenging,” the report reads.
- Robert Sanchez, chairman and CEO of Ryder, said that although the company is actively deploying EVs and charging infrastructure, it has not seen any “significant adoption” of this technology. “For many of our customers, the business case for converting to EV technology just isn’t there yet, given the limitations of the technology and lack of sufficient charging infrastructure,”
-
PITT OHIO - Taki Darakos, the VP Vehicle Maintenance and Fleet Service (testimony at a House hearing on fleet electrification efforts):
- The upfront costs of zero-emission vehicles (ZEV) “are much higher than their diesel equivalent, making it difficult for fleets to embrace electrification until they see meaningful year-over-year upfront purchase price declines.”
- “Increased vehicle weight from the batteries reduced our payload and limited our usage of haul. These limitations have impacted the company’s timeline on how and when to transition to ZEV.”
- The US “aging grid can hardly meet current demands ...“ ..... ”In California, where rolling blackouts and brownouts are not uncommon, utilities would need to generate an additional 57 percent beyond their current output to support an electric vehicle fleet.”
- He pointed out that a truck driver can refuel a new diesel truck within 15 minutes for a journey of up to 1,200 miles. However, charging an EV truck for two hours provides a range of only about 200 miles.
PRIVATE OWNER-OPERATORS
-
OWNER-OPERATOR INDEPENDENT DRIVERS ASSOCIATION: Called the standards an “assault on small-business truck drivers,” who make up 96 percent of commercial motor carriers.
YET ANOTHER EXAMPLE OF THE CRIIPPLING OF SMALL & MEDIUM SIZED BUSINESS IN AMERICA
| |
|
DEVELOPMENTS TO WATCH
WHO WILL BUY THE COMING MATURING SOCIAL SECURITY TREASURIES??
Previously I laid out how the US government was now a "Zombie" government (versus Zombie Corporation) and was best equated to running a Ponzi Scheme. In that light here is something further to consider.
The shell game at the heart of the federal government’s balance sheet is that the U.S. Treasury always has to have buyers of its debt, because if they don’t, they won’t be able to pay:
1) Their deficit spending and
2) The old debt coming due (and the interest on the debt).
If they fail to pay those off, the Government would default and collapse. Well, then, who buys all the U.S. Government debt? China and Japan have long been the dominant buyers, but that is no longer the case as China has reduced its holdings from ~1.3T to ~750B while Japan is flat (rumors are they are selling their Treasuries to protect the Yen OR will soon need to)! Additionally, the shift to De-Dollarization of the BRICS-10 is further eroding foreign buyers.
- The largest buyer and owner of the U.S. Federal Government debt is THE U.S. FEDERAL GOVERNMENT THEMSELVES.
-
Approximately one third of all U.S. government debt is “owed” to another government department! That Department is our Social Security System.
So how long can this farce last? With 10,000 Baby Boomers retiring daily and filing for their Social Security Benefits, it currently means Social Security will be insolvent by 2034. However, long before that, the Social Security Treasury holdings will be liquidated to pay retiree benefits with no new buying occurring. The US Treasury must pay out the face value of the maturing bonds.
WHERE WILL THAT MONEY COME FROM???
| |
|
SHOULD THE BUREAU OF ECONOMIC ANALYSIS (BEA) BE AUDITED?
LOST CONFIDENCE IN BEA DATA POINTS
Since the abrupt resignation of the Labor Secretary directly responsible for the BEA, there has been a steady erosion of trust in the statistics coming out of the BEA.
"OBSCURING" DATA
Long used Private Data, which has traditionally supported the BEA statistics, no longer matches nor supports BEA reporting. The divergences have become larger and more consistent. It has become such a major issue that it is amazing more public outcry is not being raised for an independent audit process being implemented. Issues with scoring budget proposals became such a similar political game years ago that an independent, non-partisan process was forced to be implemented Are we at such a point with the BEA?
CHART ABOVE RIGHT
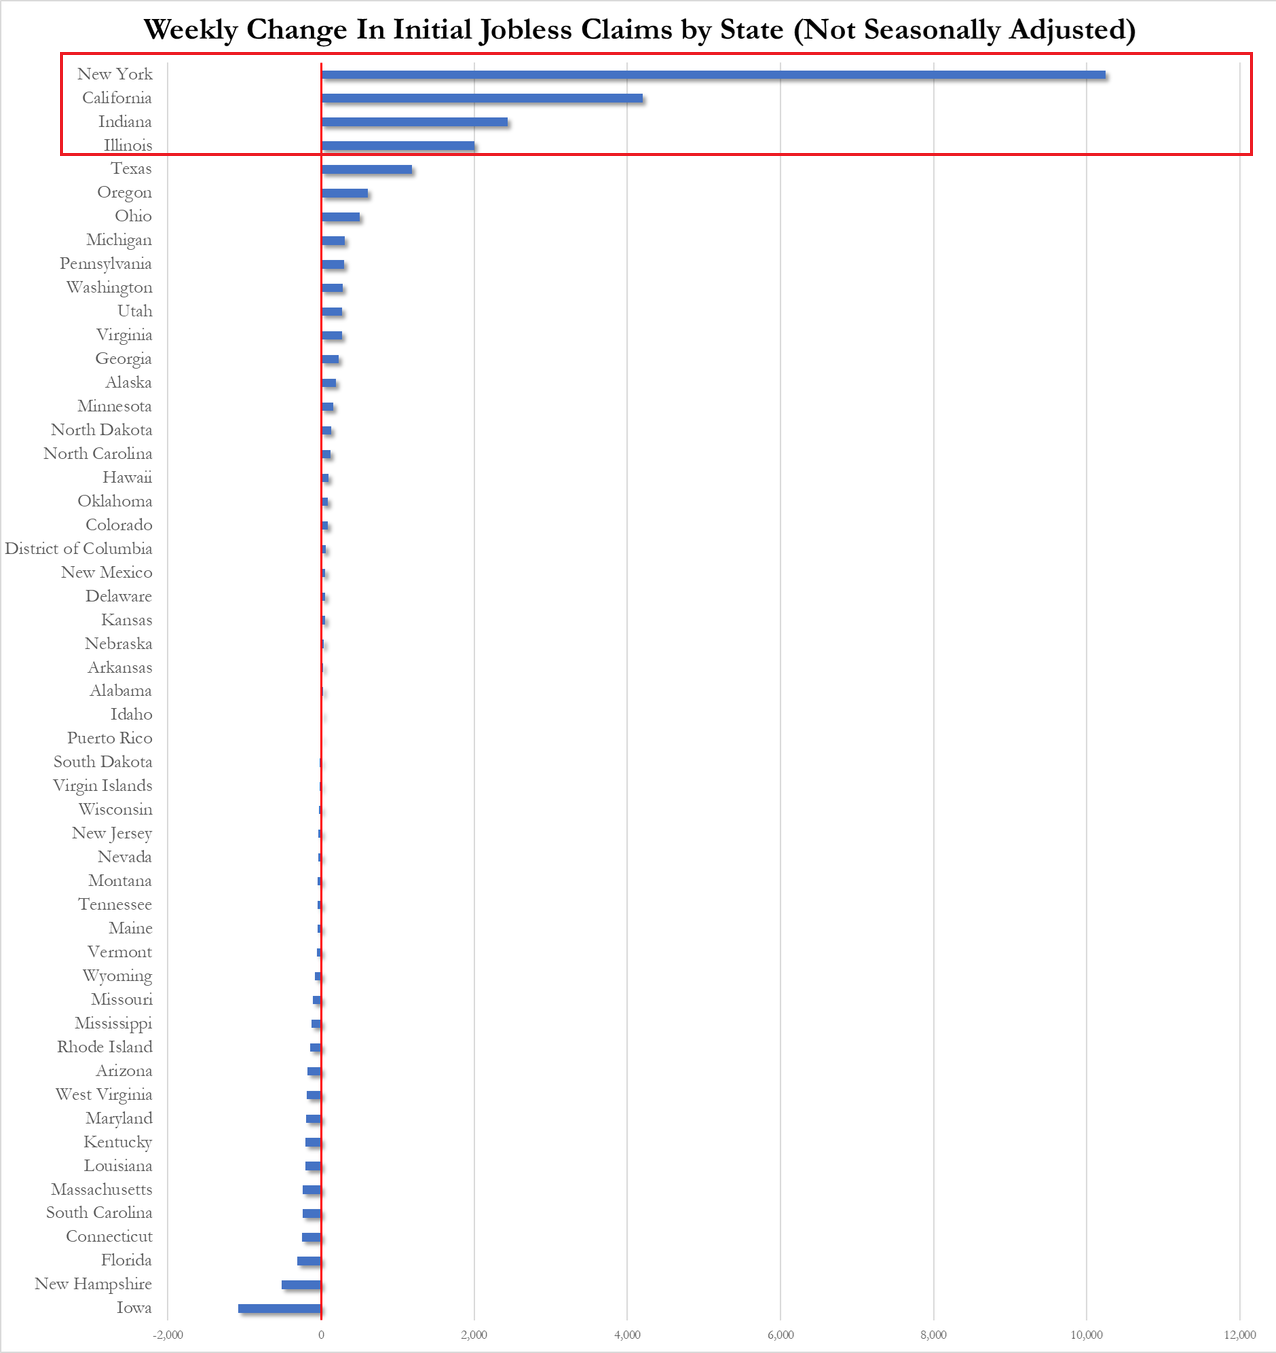
Small Business in America employs 6.4 million and accounts for 85 percent of US jobs. Included in the remaining15% are 28 million Sole Proprietorships of less than 3 employees. As the chart above right illustrates, the NFIB has been reporting a steady collapse in hiring in small business. Meanwhile small business bankruptcies are soaring, (see section above - "SMALL BUSINESS HEADWINDS: There is Nothing Small About the Headwinds!), and yet BEA Unemployment reports have continued to report historic low unemployment with Jobless Claims having barely budged - How can that be?? The analyst community are overwhelmingly appalled!
| |
|
LAYOFF REPORT
Layoffs are steady and significant as you can see below. Yet again unemployment has continued to report historic low unemployment and Jobless Claims have barely budged? Again, few can reconcile the difference and the BEA feels not reason to explain. We all know its an election year but this is absurd! Biden appointed and for 2 years yet to be confirmed Acting Labor Secretary Julie Su may have been accustomed to getting away with this in California but she didn't have an industry trained to spot even the smallest discrepancies watching her!
| |
|
1. Everybuddy: 100% of workforce
2. Wisense: 100% of workforce
3. CodeSee: 100% of workforce
4. Twig: 100% of workforce
5. Twitch: 35% of workforce
6. Roomba: 31% of workforce
7. Bumble: 30% of workforce
8. Farfetch: 25% of workforce
9. Away: 25% of workforce
10. Hasbro: 20% of workforce
11. LA Times: 20% of workforce
12. Wint Wealth: 20% of workforce
13. Finder: 17% of workforce
14. Spotify: 17% of workforce
15. Buzzfeed: 16% of workforce
16. Levi's: 15% of workforce
17. Xerox: 15% of workforce
18. Qualtrics: 14% of workforce
19. Wayfair: 13% of workforce
20. Duolingo: 10% of workforce
21. Rivian: 10% of workforce
22. Washington Post: 10% of workforce
23. Snap: 10% of workforce
24. eBay: 9% of workforce
25. Sony Interactive: 8% of workforce
26. Expedia: 8% of workforce
| |  |
|
27. Business Insider: 8% of workforce
28. Instacart: 7% of workforce
29. Paypal: 7% of workforce
30. Okta: 7% of workforce
31. Charles Schwab: 6% of workforce
32. Docusign: 6% of workforce
33. Riskified: 6% of workforce
34. EA: 5% of workforce
35. Motional: 5% of workforce
36. Mozilla: 5% of workforce
37. Vacasa: 5% of workforce
38. CISCO: 5% of workforce
39. UPS: 2% of workforce
40. Nike: 2% of workforce
41. Blackrock: 3% of workforce
42. Paramount: 3% of workforce
43. Citigroup: 20,000 employees
44. ThyssenKrupp: 5,000 employees
45. Best Buy: 3,500 employees
46. Barry Callebaut: 2,500 employees
47. Outback Steakhouse: 1,000
48. Northrop Grumman: 1,000 employees
49. Pixar: 1,300 employees
50. Perrigo: 500 employees
51. Tesla: 10% of workforce
| |
|
DATA MADE TO SUPPORT REQUIRED NARRATIVE
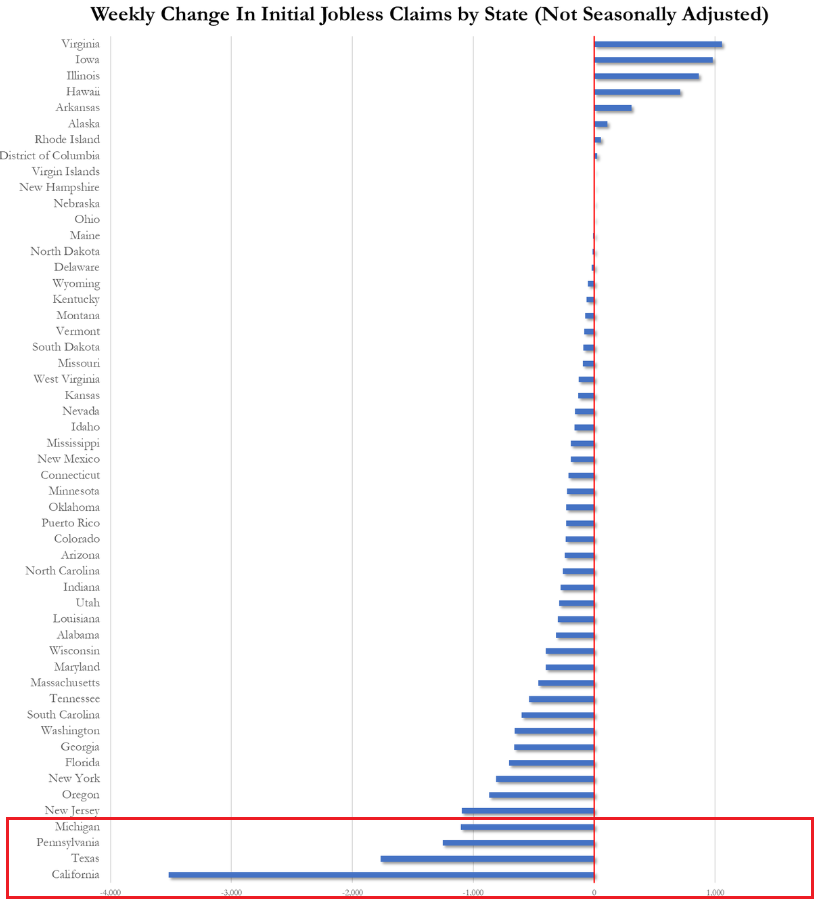
We have reported continuously the 3-6 SIGMA reporting anomalies over the last year which we would refer you to prior newsletters. The one thing that has consistently stood out to us is how the Job Reports from major Democratic states (specifically CA, NY, PA, IL & MI) are off the scale on either end, depending on the data required to support the current Bidenomics narrative.
| |
|
GLOBAL ECONOMIC INDICATORS:
What This Week's Key Global Economic Releases Tell Us
NFIB: Small Business Optimism Index
| |
|
APRIL CPI
SUMMARY:
- US CPI MM SA (Apr) 0.3% vs. Exp. 0.4% (Prev. 0.4%)
- US Core CPI MM SA (Apr) 0.3% vs. Exp. 0.3% (Prev. 0.4%)
- US CPI YY NSA (Apr) 3.4% vs. Exp. 3.4% (Prev. 3.5%)
- US Core CPI YY NSA (Apr) 3.6% vs. Exp. 3.6% (Prev. 3.8%)
- After a fourth straight month of hotter than expected PPI, analysts' expectations for CPI were tightly ranged around 0.3-0.4% MoM and printed +0.3% MoM, (slightly below the 0.4% expected).
- The YoY headline CPI fell to +3.4% as expected from +3.5% prior.
UNDER THE HOOD
- Services slowed modestly MoM...
- On a 3m and 6m annualized basis, Energy costs are reaccelerating.
- Used car and truck prices along with Gas Utility prices plunged on a MoM basis.
- Core CPI rose 0.3% MoM (as expected) with YoY slowing to +3.6%, also as expected.
- Core goods deflation continues while Core Services continue to rise.
- Core CPI YoY was 3.6% in April, the lowest it's been in 3 years.
- The 1-month annualized fell to the same 3.6% as the YoY, which is why the YoY has been more reliable as a trend measure recently.
- Housing (rent and OER) contributed 17.5 bps to monthly core CPI inflation in April. While still hot (2018-19 average was 11 bps), it's the lowest monthly contribution since Dec 2021. And as we show in the chart, YoY housing in CPI is cooling.
- Virtually all of the excess core CPI inflation YoY - the part of inflation above and beyond Fed target - resulted from housing & auto insurance. Core non-housing services have heated up on a higher frequency basis but haven't weighing much (yet) on the annual print.
- Also, while not in core, but extremely important for anyone who eats food: grocery prices actually fell -0.2% MoM in April and are running 1.1% YoY according to the Biden BLS. We doubt anyone will believe this number, which was goal seeked so that wage growth would strongly outpace grocery inflation. Relative to wages, grocery prices are back down below their 2019 levels. This, too, won't be believed by anyone.
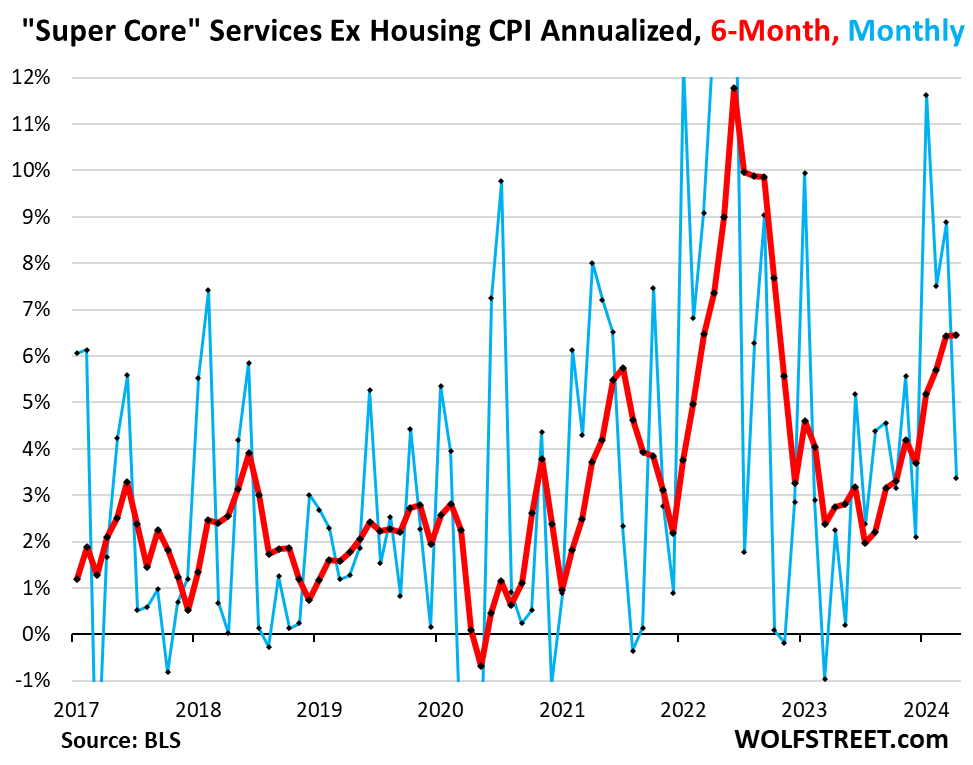
- And one step deeper - the so-called SuperCore: Core CPI Services Ex-Shelter index - rose 0.5% MoM up to 5.05% YoY - the hottest since April 2023...
- Under the hood of SuperCore CPI, Education costs rose (to pay for cleaning up all those protests?) and Transportation Services dominated on a YoY basis...
- While Shelter costs rose on a MoM basis, they continued to slow on a YoY basis.
- Goods prices are deflating at the fastest pace since April 2004, while Services prices are stuck around +5.3% YoY...
- We note that consumer prices have not fallen in a single month since President Biden's term began (July 2022 was the closest with 'unchanged'), which leaves overall prices up over 19.5% since Bidenomics was unleashed (compares with +8% during Trump's term). And prices have never been more expensive...
- That is an average of 5.5% per annum (more than triple the 1.9% average per annum rise in price during President Trump's term).
It was a miss but not for the reason expected! OER catch down STILL to kick in. Next few CPI print likely will be a dovish meltdown. Which means the next few months CPI will be even bigger misses.
| |
APRIL PPI
SUMMARY
- US PPI exFood/Energy MM (Apr) 0.5% vs. Exp. 0.2% (Prev. 0.2%, Rev. -0.1%)
- US PPI exFood/Energy YY (Apr) 2.4% vs. Exp. 2.4% (Prev. 2.4%)
- US PPI Final Demand MM (Apr) 0.5% vs. Exp. 0.3% (Prev. 0.2%, Rev. -0.1%)
- US PPI Final Demand YY (Apr) 2.2% vs. Exp. 2.2% (Prev. 2.1%, Rev. 1.8%)
UNDER THE HOOD
- April Producer Prices rose 0.5% MoM (vs +0.3% exp), with March's +0.2% MoM revised down to -0.1% MoM.
- The downward revision did not stop the YoY read rising to 2.2% (from +2.1% in March).
- This is the highest YoY read since April 2023 and is the fourth hotter than expected headline PPI print.
- Producer Prices have been aggressively downwardly revised for 4 of the last 7 months...
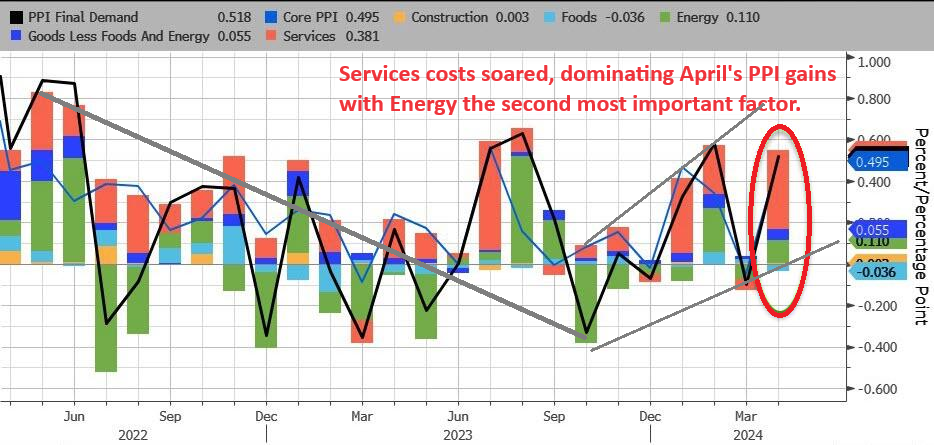
- Services costs soared, dominating April's PPI gains with Energy, the second most important factor. Food prices actually declined on a MoM basis.
- On a YoY basis, headline PPI's rise was dominated by Services (rising at their hottest since July 2023). For the first time since Feb 2023, none of the underlying factors were negative on a YoY basis...
- On a 6-month annualized rate, Final Demand Core Services PPI is rising at its highest since Q3 2021...
- After last month's farcical 'seasonally adjusted' gasoline price, April saw the PPI Gasoline index rise (with actual prices at the pump), but still has a long way to go.
- Core PPI was worse - rising 0.5% MoM (more than double the +0.2% MoM expected) - which pushed the Core PPI YoY up to +2.4%.
- And finally US PPI Final Demand Less Foods Energy and Trade Services rose by 0.4% MoM and 3.1% YoY (the highest in 12 months).
- Worse still, the pipeline for primary PPI is not good as intermediate demand is starting to accelerate.
Over the past month, 'higher prices' have dominated 'lower prices' in recent survey data...
Higher producer prices:
- New York Empire manufacturing price paid advanced to 33.7 from 28.7.
- Philadelphia Fed manufacturing reported prices paid gained to 23.0 from 3.7 in March.
- Philadelphia Fed non-manufacturing prices paid rose to 31.0 from 26.6 in the prior month.
- Richmond Fed services prices paid rose to 6.11 from 5.43 in March.
- Kansas City Fed manufacturing prices paid advanced to 18 from 17.
- Kansas City Fed services input price growth continued to outpace selling prices.
- S&P Global manufacturing input cost inflation quickened to hint at sustained near-term upward pressure on selling prices.
- ISM Manufacturing prices paid gained to 60.9, the highest since June 2022, from 55.8 in March.
- ISM Services prices paid notched up to 59.2, the highest since January, from 53.4 in March.
| |
|
GLOBAL MACRO
WHAT DOES YOUR SCAN OF THE DATA BELOW TELL YOU? - THE MEDIA AVOIDS BAD NEWS!
We present the data in a way you can quickly see what is happening.
THIS WEEK WE SAW
Exp=Expectations, Rev=Revision, Prev=Previous
| |
|
UNITED STATES
- NY Fed SCE (April) 1yr ahead inflation expectations 3.3% (prev. 3.0%), 3yr at 2.8% (prev. 2.9%), 5yr at 2.8% (prev. 2.6%), while year-ahead expected home price increase is at 3.3% (prev. 3.0%).
- US PPI exFood/Energy MM (Apr) 0.5% vs. Exp. 0.2% (Prev. 0.2%, Rev. -0.1%)
- US PPI exFood/Energy YY (Apr) 2.4% vs. Exp. 2.4% (Prev. 2.4%)
- US PPI Final Demand MM (Apr) 0.5% vs. Exp. 0.3% (Prev. 0.2%, Rev. -0.1%)
- US PPI Final Demand YY (Apr) 2.2% vs. Exp. 2.2% (Prev. 2.1%, Rev. 1.8%)
- US CPI MM SA (Apr) 0.3% vs. Exp. 0.4% (Prev. 0.4%)
- US Core CPI MM SA (Apr) 0.3% vs. Exp. 0.3% (Prev. 0.4%)
- US CPI YY NSA (Apr) 3.4% vs. Exp. 3.4% (Prev. 3.5%)
- US Core CPI YY NSA (Apr) 3.6% vs. Exp. 3.6% (Prev. 3.8%)
- US Cleveland Fed CPI (Apr) 0.3% (Prev. 0.4%)
- US NY Fed Manufacturing (May) -15.6 vs. Exp. -10.0 (Prev. -14.3)
- US Retail Sales MM (Apr) 0.0% vs. Exp. 0.4% (Prev. 0.7%, Rev. 0.6%)
- US Retail Control (Apr) -0.3% vs. Exp. 0.1% (Prev. 1.1%, Rev. 1.0%)
- US NAHB Housing Market Index (May) 45.0 vs. Exp. 51.0 (Prev. 51.0)
- US Business Inventories MM (Mar) -0.1% vs. Exp. -0.1% (Prev. 0.4%, Rev. 0.3%)
- US Industrial Production MM (Apr) 0.0% vs. Exp. 0.1% (Prev. 0.4%, Rev. 0.1%)
- US Building Permits Number (Apr) 1.44M vs. Exp. 1.485M (Prev. 1.467M, Rev. 1.485M)
- US Housing Starts Number (Apr) 1.36M vs. Exp. 1.42M (Prev. 1.321M, Rev. 1.287M)
- US Philly Fed Business Index (May) 4.5 vs. Exp. 8.0 (Prev. 15.5)
- US Export Prices MM (Apr) 0.5% vs. Exp. 0.4% (Prev. 0.3%, Rev. 0.1%)
- US Import Prices MM (Apr) 0.9% vs. Exp. 0.3% (Prev. 0.4%, Rev. 0.6%)
- US Initial Jobless Claims 222k vs. Exp. 220k (Prev. 231k, Rev. 232k)
- US Continued Jobless Claims 1.794M vs. Exp. 1.785M (Prev. 1.785M, Rev. 1.781M)
CHINA
- Chinese CPI MM (Apr) 0.1% vs. Exp. -0.1% (Prev. -1.0%)
- Chinese CPI YY (Apr) 0.3% vs. Exp. 0.2% (Prev. 0.1%)
- Chinese PPI YY (Apr) -2.5% vs. Exp. -2.3% (Prev. -2.8%)
- Chinese New Yuan Loans (CNY)(Apr) 730B vs Exp. 800B (Prev. 3090B)
- Chinese Aggregate Financing (CNY)(Apr) -200B vs Exp. 1000B (Prev. 4870B)
- Chinese Money Supply M2 YY (Apr) 7.2% vs Exp. 8.3% (Prev. 8.3%)
- Chinese Industrial Output YY (Apr) 6.7% vs. Exp. 5.5% (Prev. 4.5%)
- Chinese Retail Sales YY (Apr) 2.3% vs. Exp. 3.8% (Prev. 3.1%)
- Chinese Urban Investment (YTD) YY (Apr) 4.2% vs. Exp. 4.6% (Prev. 4.5%)
- Chinese Unemployment Rate Urban Area (Apr) 5.0% (Prev. 5.2%)
- Chinese China House Prices YY (Apr) -3.1% (Prev. -2.2%)
| | |
|
EU
- EU ZEW Survey Expectations (May) 47 (Prev. 43.9)
- EU GDP Flash Estimate QQ (Q1) 0.3% vs. Exp. 0.3% (Prev. 0.3%)
- EU GDP Flash Estimate YY (Q1) 0.4% vs. Exp. 0.4% (Prev. 0.4%)
- EU Employment Flash QQ (Q1) 0.3% vs. Exp. 0.3% (Prev. 0.3%)
- EU Employment Flash YY (Q1) 1.0% vs. Exp. 1.0% (Prev. 1.2%)
- EU Industrial Production MM (Mar) 0.6% vs. Exp. 0.5% (Prev. 0.8%, Rev. 1.0%)
- EU Industrial Production YY (Mar) -1.0% vs. Exp. -1.2% (Prev. -6.4%, Rev. -6.3%)
- EU HICP Final YY (Apr) 2.4% vs. Exp. 2.4% (Prev. 2.4%); HICP-X F&E Final YY (Apr) 2.8% vs. Exp. 2.8% (Prev. 2.8%)
GERMANY
- German CPI Final MM (Apr) 0.5% vs. Exp. 0.5% (Prev. 0.5%)
- German CPI Final YY (Apr) 2.2% vs. Exp. 2.2% (Prev. 2.2%)
- German HICP Final MM (Apr) 0.6% vs. Exp. 0.6% (Prev. 0.6%)
- German HICP Final YY (Apr) 2.4% vs. Exp. 2.4% (Prev. 2.4%)
- German ZEW Economic Sentiment (May) 47.1 vs. Exp. 46.0 (Prev. 42.9)
- German ZEW Current Conditions (May) -72.3 vs. Exp. -75.8 (Prev. -79.2)
UK
- UK BRC Rep. 0.4% (Prev. -0.3%); YY 0.2% (Prev. -0.2%)
- UK Employment Change (Mar) -177k vs. Exp. -215k (Prev. -156k)
- UK ILO Unemployment Rate (Mar) 4.3% vs. Exp. 4.3% (Prev. 4.2%)
- UK Average Earnings (Ex-Bonus)(Mar) 6.0% vs. Exp. 5.9% (Prev. 6.0%)
- UK Average Weekly Earnings 3M YY (Mar) 5.7% vs. Exp. 5.5% (Prev. 5.6%, Rev. 5.7%)
AUSTRALIA
- Australian NAB Business Confidence (Apr) 1.0 (Prev. 1.0); Conditions (Apr) 7.0 (Prev. 9.0)
- Australian Wage Price Index QQ (Q1) 0.8% vs. Exp. 0.9% (Prev. 0.9%, Rev. 1.0%)
- Australian Wage Price Index YY (Q1) 4.1% vs. Exp. 4.2% (Prev. 4.2%)
- Australian Employment (Apr) 38.5k vs. Exp. 23.7k (Prev. -6.6k)
- Australian Full-Time Employment (Apr) -6.1k (Prev. 27.9k)
- Australian Unemployment Rate (Apr) 4.1% vs. Exp. 3.9% (Prev. 3.8%)
NEW ZEALAND
- New Zealand 2-year Inflation Forecast (Q2) Q1 2.33% (Prev. 2.5%); 1-year Inflation Forecast (Q2) Q1 2.73% (Prev. 3.22%)
JAPAN
- Japanese PPI MM (Apr) 0.3% vs. Exp. 0.3% (Prev. 0.2%)
- Japanese PPI YY (Apr) 0.9% vs. Exp. 0.8% (Prev. 0.8%, Rev. 0.9%)
- Japanese GDP QQ (Q1) -0.5% vs. Exp. -0.4% (Prev. 0.1%, Rev. 0.0%)
- Japanese GDP QQ Annualized (Q1) -2.0% vs. Exp. -1.5% (Prev. 0.4%, Rev. 0.0%)
| |
CURRENT MARKET PERSPECTIVE | |
|
MAJOR EQUITY INDEXES ACHIEVE NEW HIGHS
THE EQUITY FOCUS SHIFTS TO NEXT WEEK'S NVIDIA EARNINGS
Click All Charts to Enlarge
| |
|
We have been highlighting the above NVDA chart with the Red Box Target highlighted for a couple of weeks. The CPI. PPI and Retail Sales this week have all moved NVDA towards our target. We believe that the Equity market is currently more focused on AI for direction than anything else. Wednesday the 22nd will potentially be a big day for the Equity markets.
NOTE: NVDA SKEW is behaving very different compared to what we saw in mid March. There is much less upside excitement, at least judging by how skew is trading - (SEE SKEW CHART)
As goes NVDA, so goes the MAG-7 - As Goes Mag-7 so goes The Market
| |
1 - SITUATIONAL ANALYSIS | |
|
More recent disappointments have been cheered by the markets reacting to:
“Bad News is Good News!”
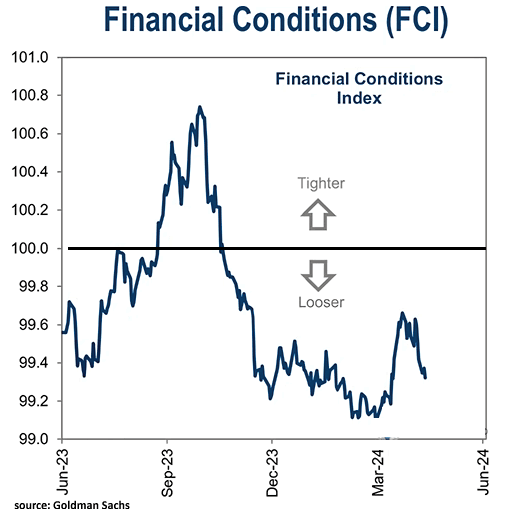
- Currently the extremely loose Financial Conditions index and the turn up in M2 Money Supply is buoying the equity markets.
- Falling Yields due to further weakening CPI and PPI inflation rates are adding a catalyst for the Trade Range markets to want to test their upper boundaries.
- We don’t think that will last in the Intermediate Term.
- The correlation between economic surprise changes and stock returns is negative when equities are focused on the Fed.
- With cracks appearing in the labor market, more below-consensus data will eventually weigh on equities (even though the first cut may be viewed positively), as would a tightening in financial conditions.
CHART RIGHT ABOVE: Financial Conditions, as reported by Goldman Sachs over the last year, show already Loose Financial Conditions are again being loosened.
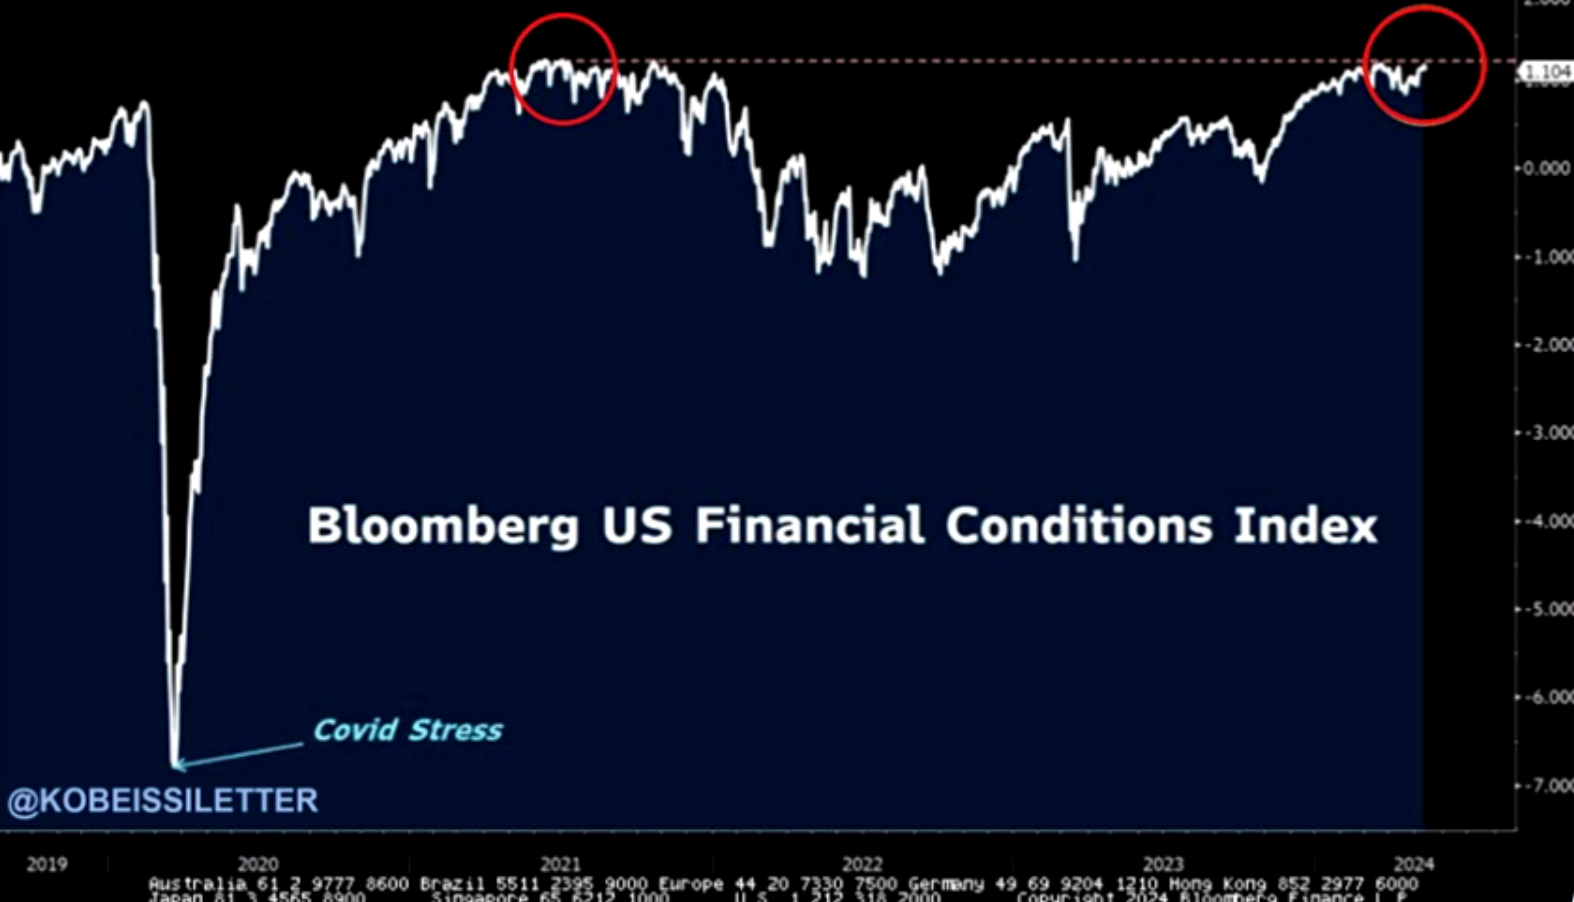
CHART BELOW: Financial Conditions as reported by Bloomberg are now looser than before the Fed started hiking rates.
| |
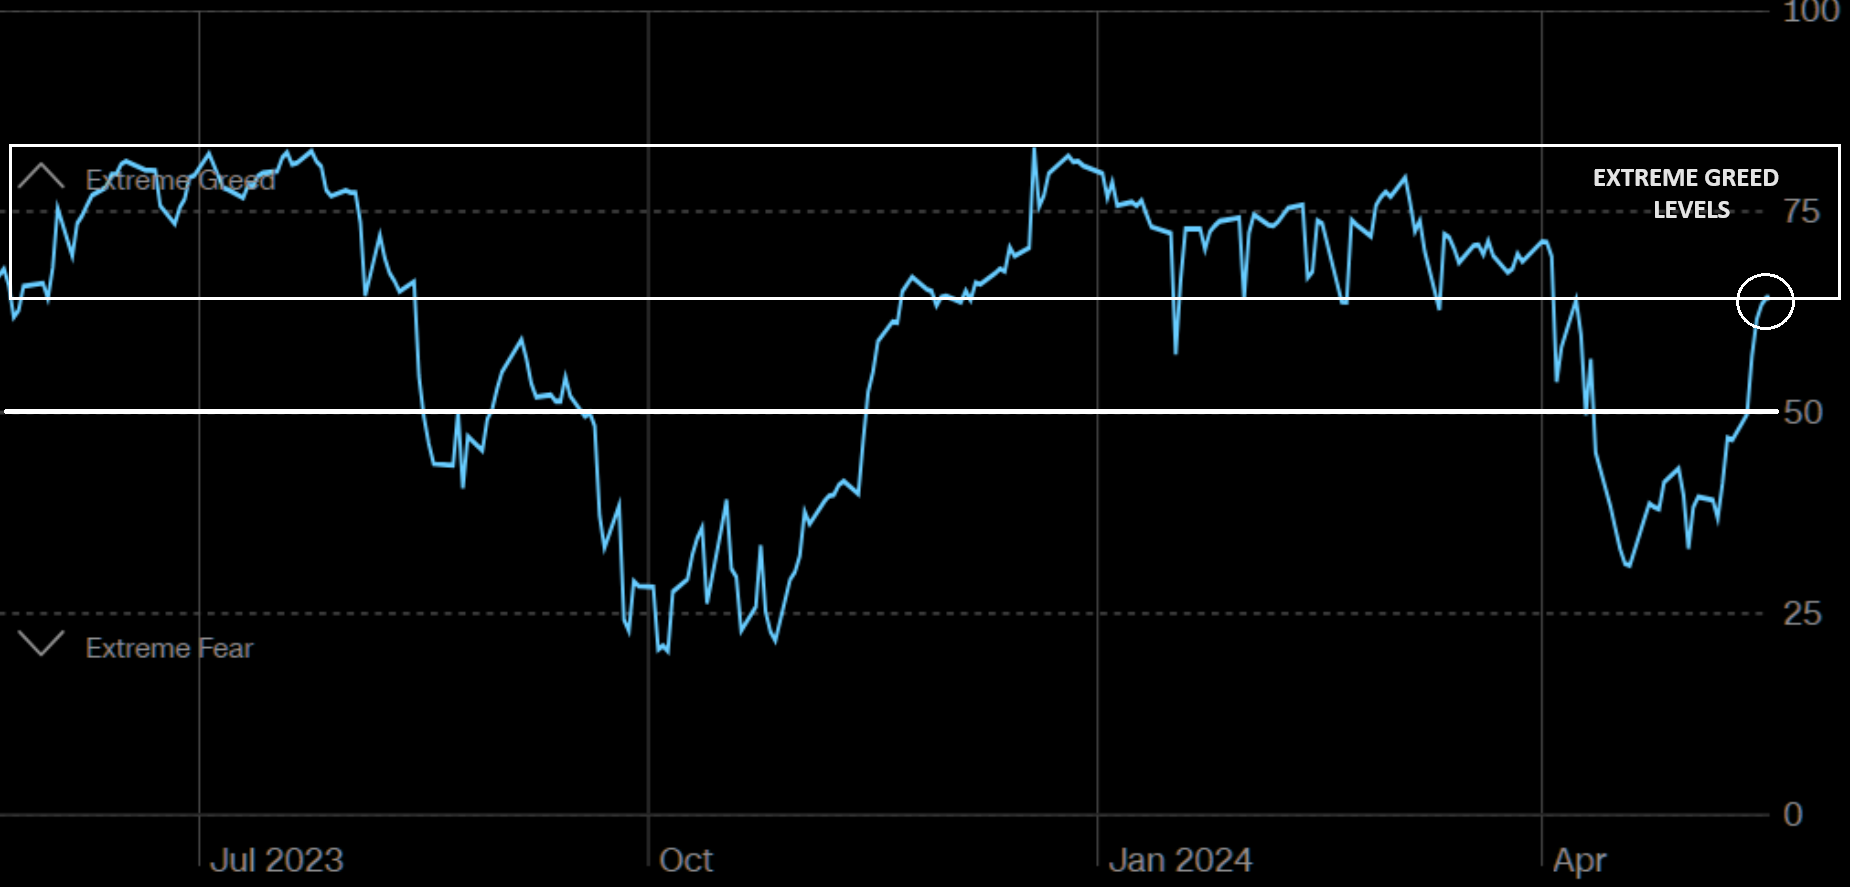
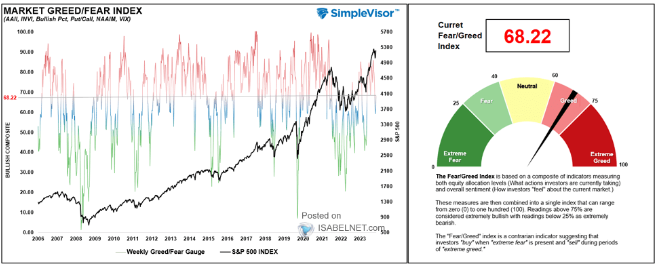
HISTORICAL GREED-FEAR LEVELS (Chart Below) | |
|
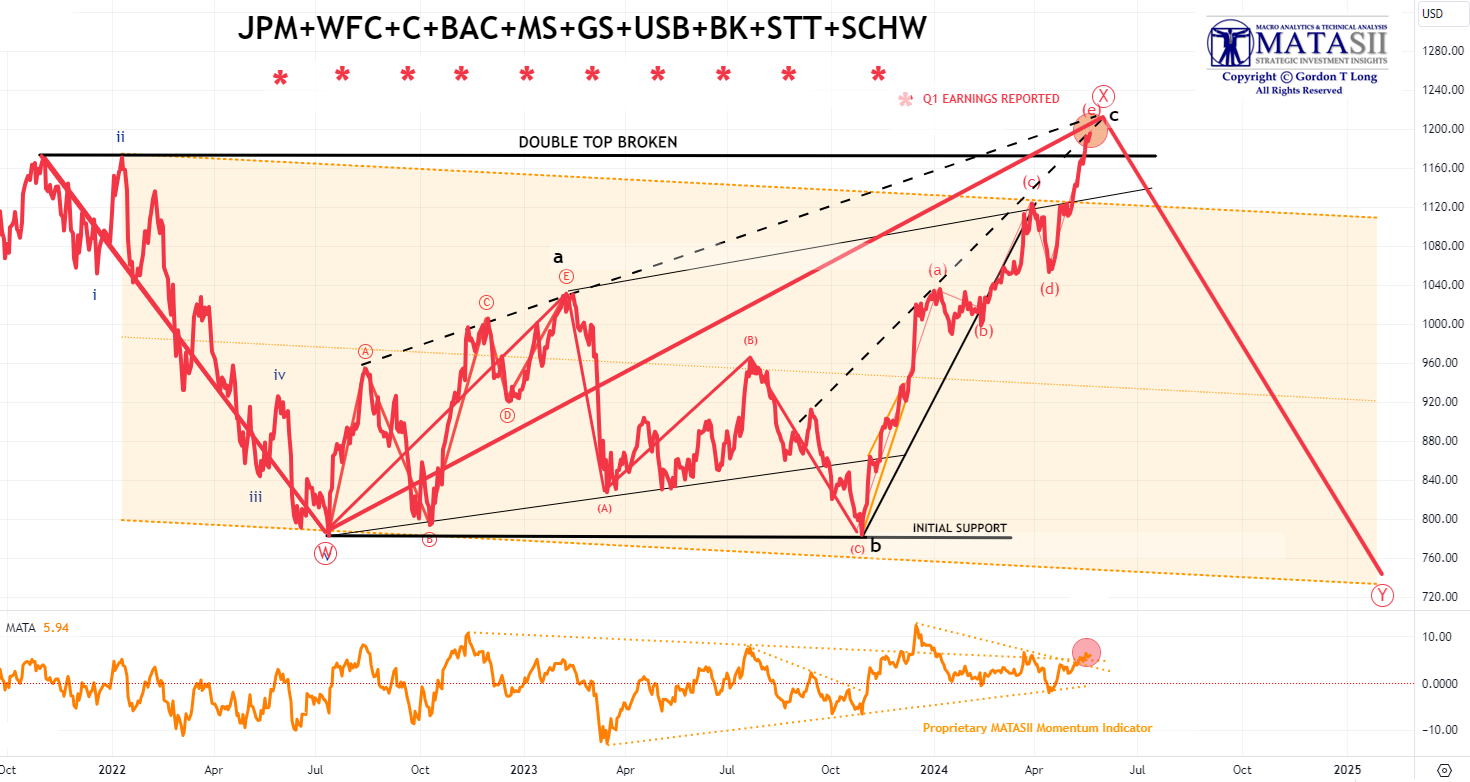
"AS GO THE BANKS, SO GO THE MARKETS"
MATASII BANKING STOCK INDEX
- Bank stocks, though initially weak on earnings release, have been trending up ever since.
- The MATASII Bank Stock Index broke through two overhead resistance trend lines last week before achieving the Double Top, which has subsequently been broken.
- Falling Yields as a result of this week's PPI and CPI pushed the Banking Stocks through their Double Top.
-
A decisive break of this Double Top and markets will head higher. We don't see that and currently expect the completion of the "X" leg (of a "WXY" Zig Zag pattern), as indicated in the chart below. There is still a little more upside to go before this pattern is complete (expand chart to see).
- The MATASII's Proprietary Momentum Indicator (lower pane) has pushed through its overhead resistance trend line.
| |
|
YOUR DESKTOP / TABLET / PHONE ANNOTATED CHART
Macro Analytics Chart Above: SUBSCRIBER LINK
| |
|
OUR GLOBAL MACRO VIEW
- The global recovery story remains very much alive in the hard data. But we continue to be worried about the labor market in the world’s financial debt creation locomotive - the US. We are watching for a break of the critical 4% Unemployment level within the next 90 days.
- A bottom in Chinese asset prices is likely, but a major Credit Impulse to save the global economy is less than a 50% probability. As for China’s real growth, we would not get too excited about this, providing any great support to the EA or EMs this year, beyond any one-shot boost from stimulus and the ongoing apparent stockpiling of commodities.
- Europe's underlying story remains resilient, but the probability of a near-term wobble is rising.
- For global investors, a pincer seems to be closing in. Either US jobs deteriorate further or inflation progress stalls. We are betting on the former, with inflation continuing to slow, though not to 2010s rates. Likely in the ~3% range.
|
 |  |
- Following a steep recovery from 2020 to 2023, we expect oil and gas capex growth to return to a more normalized 4% rate over the next few years, as the pace of investment decisions moderates and the industry becomes less cyclical.
- Alongside this capex moderation, the oil industry has likely entered peak non-OPEC production growth, though LNG should enter a phase of strong volume growth in 2025. All that said, expect consolidation and capital discipline in the energy industry to continue supporting strong profitability, with IRRs of >15%/20% in LNG/oil for this year’s new projects.
- The White House announced tariff increases on US$18bn worth of Chinese goods, including EVs, batteries, solar cells, semiconductors and critical materials. The tariff hikes will take effect this year, apart from semiconductors (in 2025) and non-EV lithium-ion batteries (in 2026). The tariff hike is symbolic and will have a limited economic impact on China, given that the targeted products only account for 4% of its exports to the US and 0.5% of its total exports. Beijing may react with commensurate and symbolic tariff hikes on select US products, but it will maintain a pragmatic approach to mitigating tensions over the medium term, spending more efforts on domestic economic rebalancing and outbound investment.
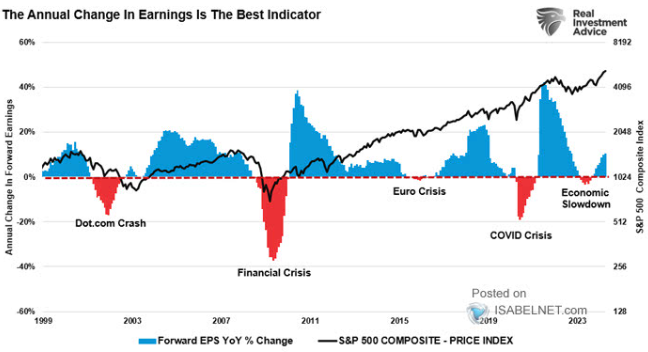
GLOBAL ECONOMIC & EARNINGS GROWTH
21% of countries in the global universe show significant growth upgrades vs only 11% showing downgrades. The Global Growth Momentum is currently quite positive. An increase in forward earnings is normally seen as a positive indicator for higher equity prices and can often mitigate the risk of more serious market corrections.
|  | |
|
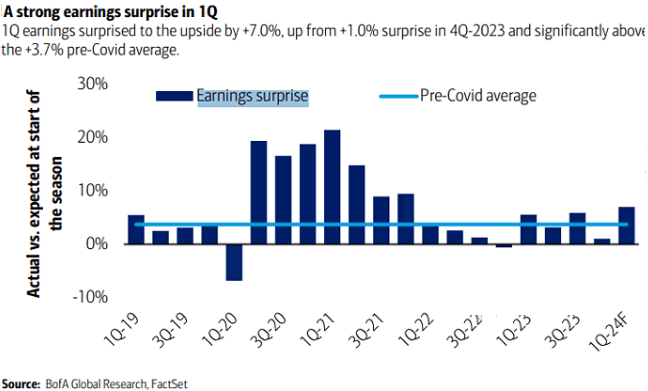
STRONG Q1 EARNINGS SURPRISES
Q1 Earnings surprised to the upside by 7.0%, up from +1.0% surprises in Q4 2023 and significantly above the +3.7%pre-Covid average.
| | |
|
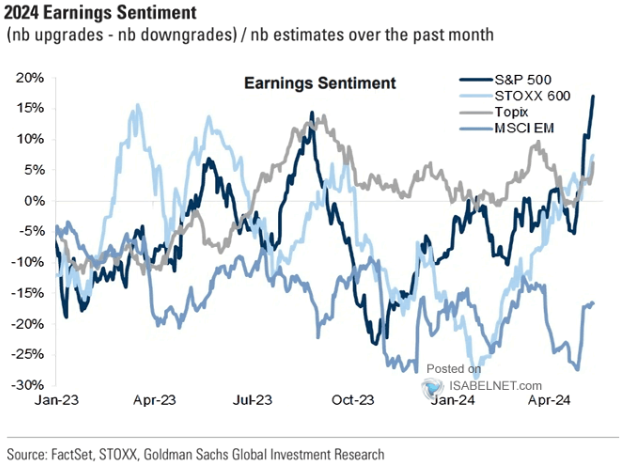
2024 EARNINGS SENTIMENT
Strongly rising.
| | |
|
MARKET DRIVERS
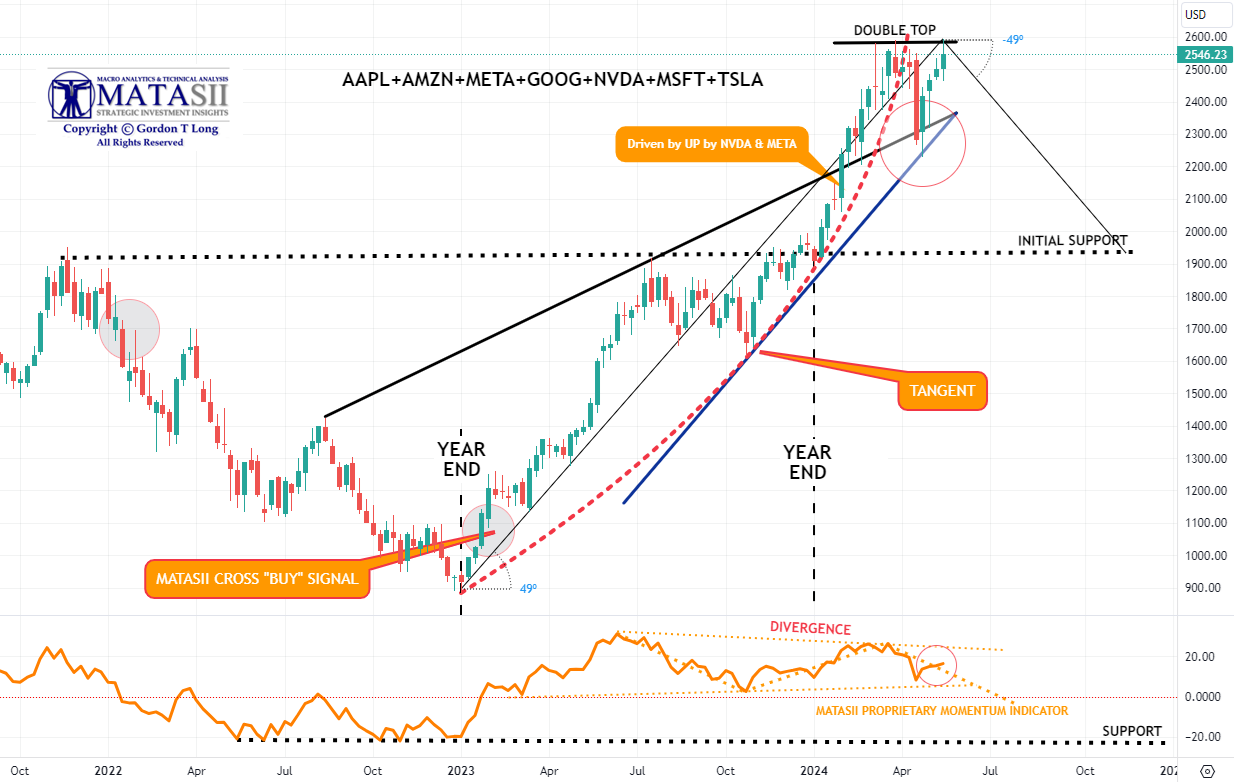
I DON'T EVER RECALL SEEING MORE DOUBLE TOPS!
MAGNIFICENT 7
Total CAPEX + R&D for the Magnificent Seven this year is expected to total $348bn, (think about that for a second).
Here’s another way to frame it: the Magnificent 7 is reinvesting 61% of their operating free cash flow back into
CAPEX + R&D!
- We were reaching the vertical lift part of the parabolic (geometric) lift shown by the dashed red line, before falling off and then retracing after the release of the Labor Report last Friday.
-
As of close close Friday we have completed a Double Top. A decisive break and the market is headed higher with the assistance of falling yields. We suspect however we are in a trading range until the NVDA earnings release next Wednesday (May 22nd).
-
In the short term, Momentum (bottom pane) has broken the overhead Momentum trend line resistance level (dotted orange line), which is a positive trigger.
|  | |
YOUR DESKTOP / TABLET / PHONE ANNOTATED CHART
Macro Analytics Chart Above: SUBSCRIBER LINK
| |
|
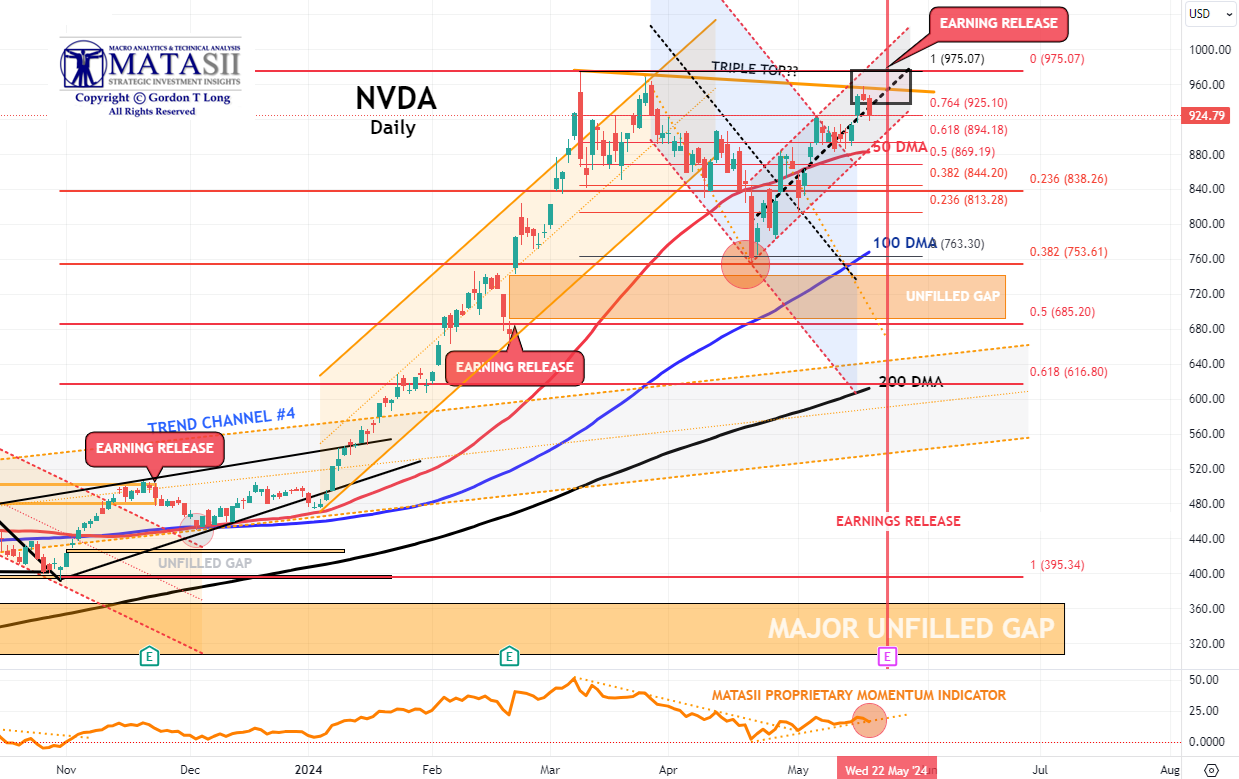
NVDA - Daily
- NVDA initially broke through the overhead 50 DMA on a retest to reach slightly above the 76.4% Fibonacci Retracement, but more importantly touched its descending trend line to achieve a Triple Top. Normally when this level of Fibonacci is reached a Double Top of prior highs follows. Double Tops normally result in Market Resistance before being possibly broken. Typically they are signs of short to Intermediate Term Tops.
- NVDA Momentum (lower pane) is currently resting on its support trend line (dotted orange trend line).
- This counter rally has been noticeably strong for NVDA as it prepares for its May 22nd Earnings release.
- The pattern is currently suggesting we are in a corrective wave 2 of what may be a downward 5 count.
- With earnings release fast approaching (marked by the red "E" box at the bottom of the pane), this potentially could be a set-up for NVDA to move towards its 100 DMA for support. Even strong earnings could turn out to "disappoint" on potential newly surfacing concerns?
- A strong decisive break of the Double High Top and we are likely to see the Bulls take control of the market!
| |
|
YOUR DESKTOP / TABLET / PHONE ANNOTATED CHART
Macro Analytics Chart Above: SUBSCRIBER LINK
| |
"CURRENCY" MARKET (Currency, Gold, Black Gold (Oil) & Bitcoin) | |
|
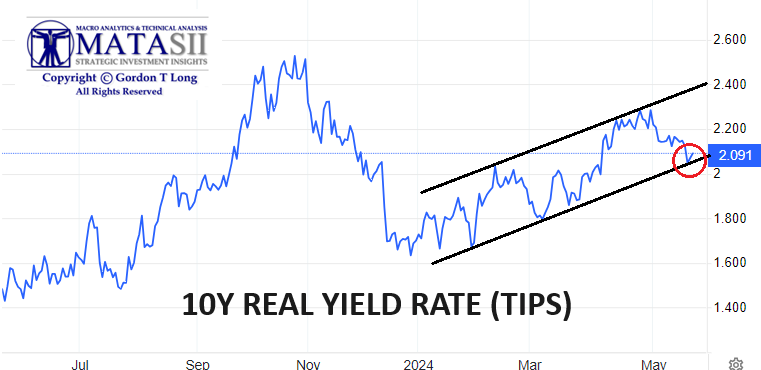
10Y REAL YIELD RATE (TIPS)
Real Rates reached our initial overhead resistance level of 2.25% before falling off hard with last Friday's Labor Report (Chart Right).
This week's Jobless Claims further added to the downward movement to our lower trend line support.
TRADING RANGE: Equity markets reacted
to labor market pressures associated with a weakening Jobs Report (last Friday).
We expected yields & rates to test the lower trend line (chart above right) as we wait on NVDA Earnings potentially changing equity risk premiums.
CONTROL PACKAGE
There are TEN charts we have outlined in prior chart packages, which we will continue to watch closely as a CURRENT Control Set:
-
US DOLLAR -DXY - MONTHLY (CHART LINK)
-
US DOLLAR - DXY - DAILY (CHART LINK)
-
GOLD - DAILY (CHART LINK)
-
GOLD cfd's - DAILY (CHART LINK)
-
GOLD - Integrated - Barrick Gold (CHART LINK)
-
SILVER - DAILY (CHART LINK)
-
OIL - XLE - MONTHLY (CHART LINK)
-
OIL - WTIC - MONTHLY - (CHART LINK)
-
BITCOIN - BTCUSD - WEEKLY (CHART LINK)
-
10y TIPS - Real Rates - Daily (CHART LINK)
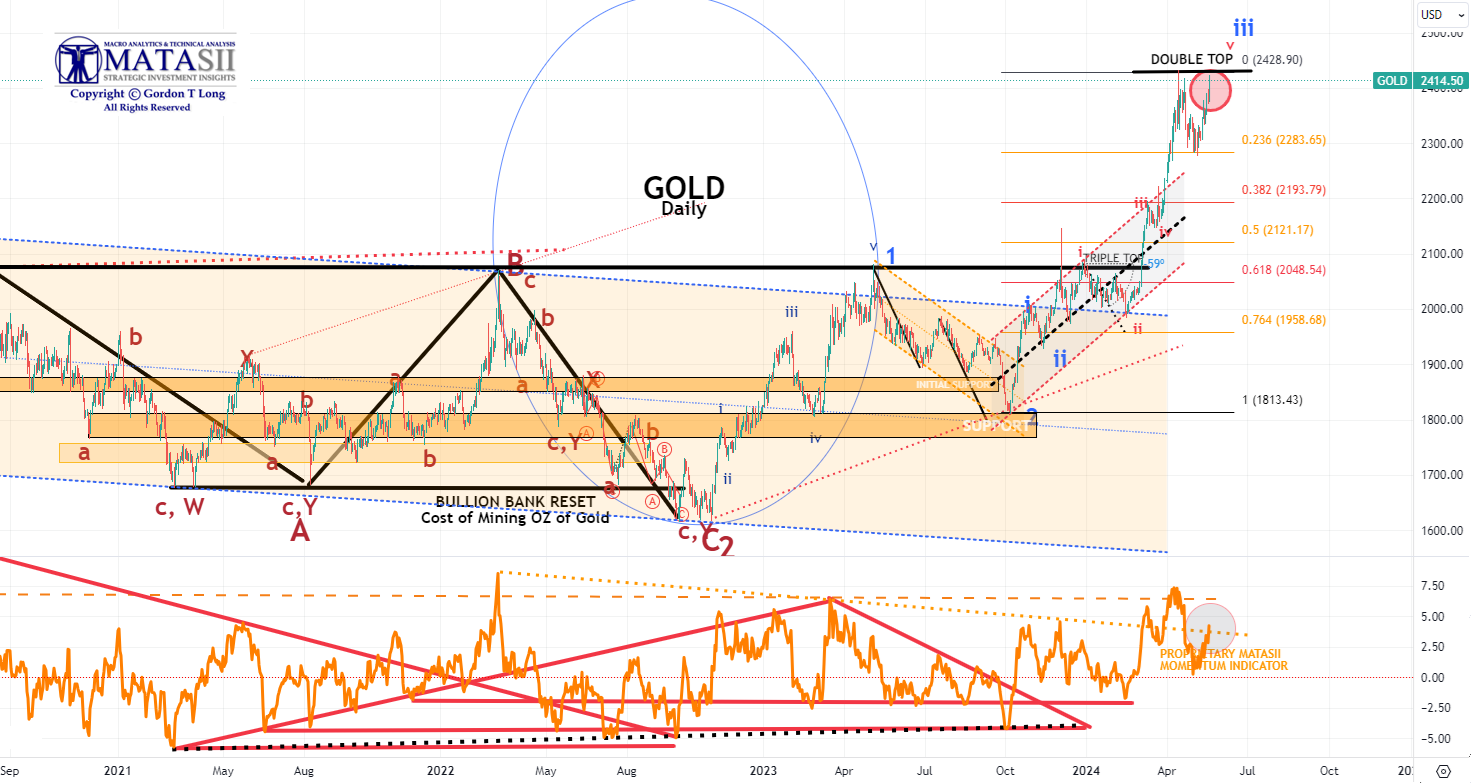
GOLD - DAILY
- Gold surge back to its previous high, putting in a Double Top.
- Gold Momentum (lower pane) found initial overhead resistance at the dotted orange trend line.
- Gold is likely headed towards then upper Momentum resistance shown by the dashed orange line.
|  | |
YOUR DESKTOP / TABLET / PHONE ANNOTATED CHART
Macro Analytics Chart Above: SUBSCRIBER LINK
| |
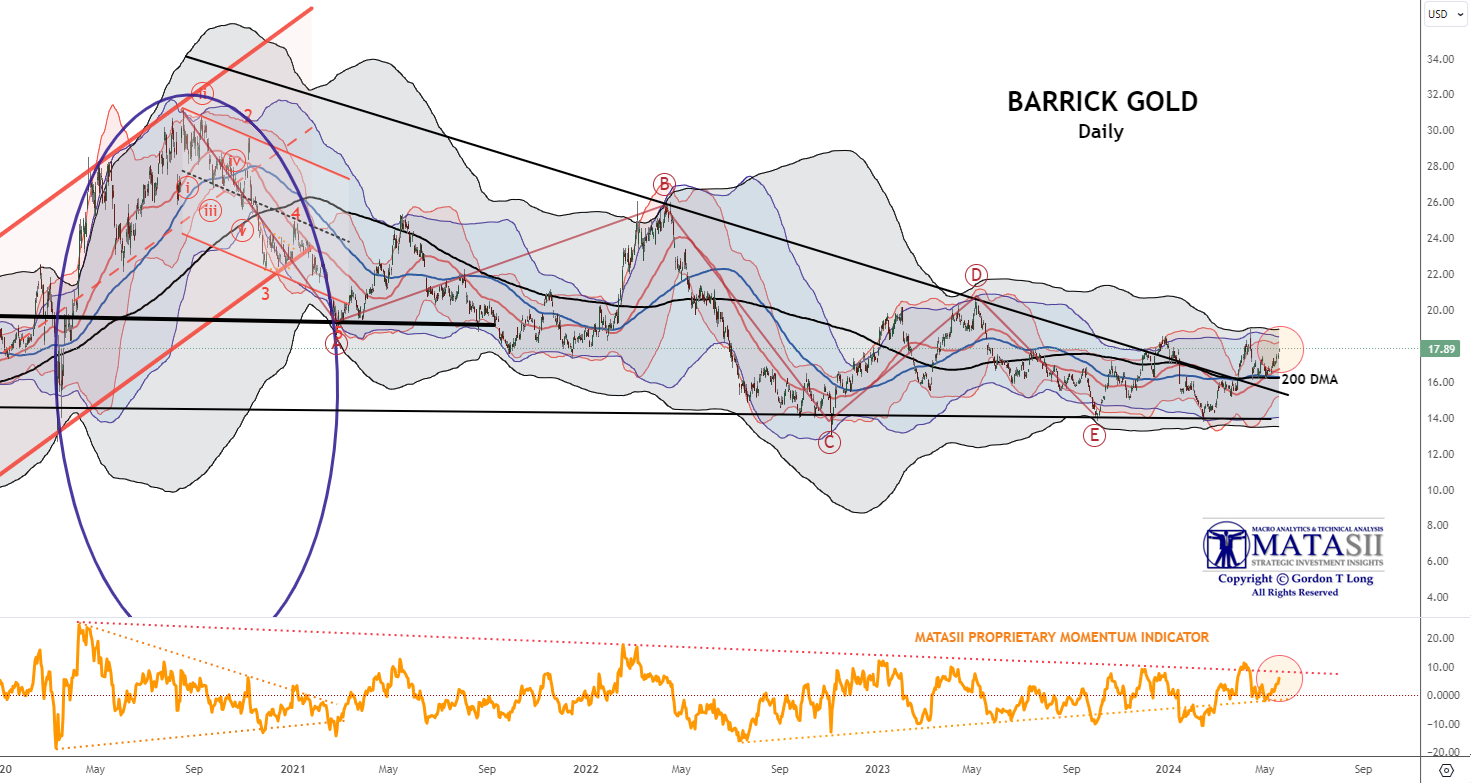
GOLD - INTEGRATED MINERS
Barrick Gold - Daily
Gold stocks have abnormally lagged the gold price - normally gold stocks have a beta of 2X to the gold price. This implies gold miners could be up 45% from current prices. The chase may soon be on?
- After retesting the 200 DMA, Barrick Gold has again surged higher.
- The MATASII Proprietary Momentum Indicator is again approaching its overhead Resistance Trend line.
| |
YOUR DESKTOP / TABLET / PHONE ANNOTATED CHART
Macro Analytics Chart Above: SUBSCRIBER LINK
| |
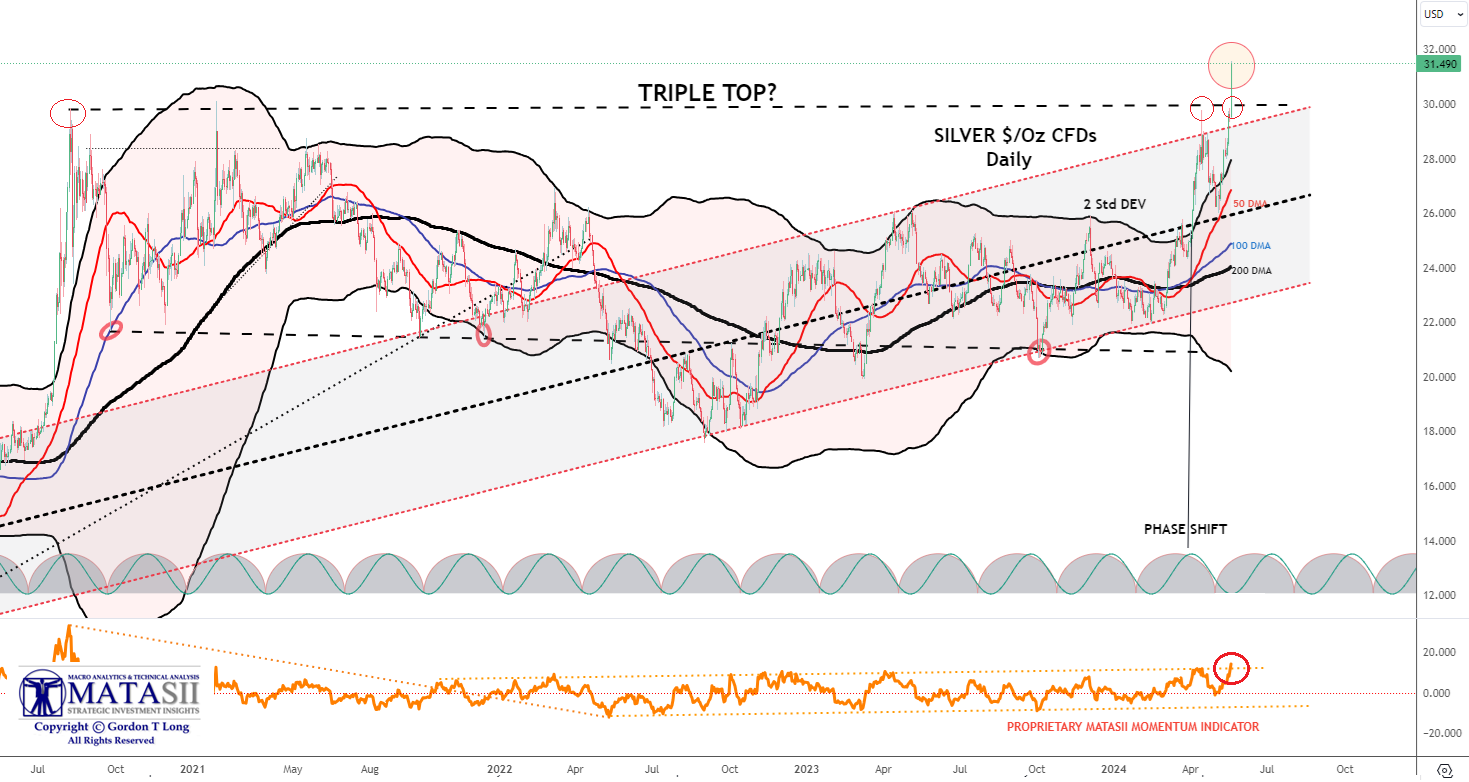
SILVER - Daily
- Silver surged this week through a Triple Top to new highs. This is a very Bullish indication, even if Silver was to temporarily consolidate before heading higher.
- The 50 / 100 / 200 DMAs are widely spread and normally need to be tightened as part of a corrective consolidation before Silver heads higher.
- The MATASII Proprietary Momentum Indicator (lower pane) has also broken through overhead Resistance.
- The pattern suggests Silver (like the Gold Miners) is building for a Short to Intermediate Break-Out.
NOTE: A Fed Pivot to lower rates can be expected to weaken the dollar which is normally Bullish for Precious Metals priced in US Dollars. - The Dollar Weakened this week on weakening Yields.
| |
|
YOUR DESKTOP / TABLET / PHONE ANNOTATED CHART
Macro Analytics Chart Above: SUBSCRIBER LINK
| |
|
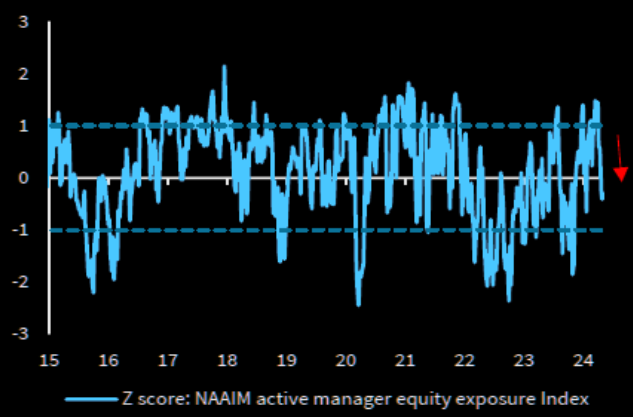
CHART RIGHT: Active managers have generally been reducing risk.
CONTROL PACKAGE
There are FIVE charts we have outlined in prior chart packages that we will continue to watch closely as a CURRENT "control set":
-
The S&P 500 (CHART LINK)
-
The DJIA (CHART LINK)
-
The Russell 2000 through the IWM ETF (CHART LINK),
-
The MAGNIFICENT SEVEN (CHART ABOVE WITH MATASII CROSS - LINK)
-
Nvidia (NVDA) (CHART LINK)
| |
S&P 500 CFD
- The S&P 500 cfd broke to new highs this week.
- Momentum (lower pane), having bounced off its lower support, moved quickly to an overhead resistance trend line (dotted orange line). Both the MATASII Momentum Indicator and RSI suggest there may be a little more to go on this upward leg in the short term.
- The Moving Averages (50/100/200 DMA) normally needs to narrow and tighten before a further strong lift can occur.
| |
YOUR DESKTOP / TABLET / PHONE ANNOTATED CHART
Macro Analytics Chart Above: SUBSCRIBER LINK
| |
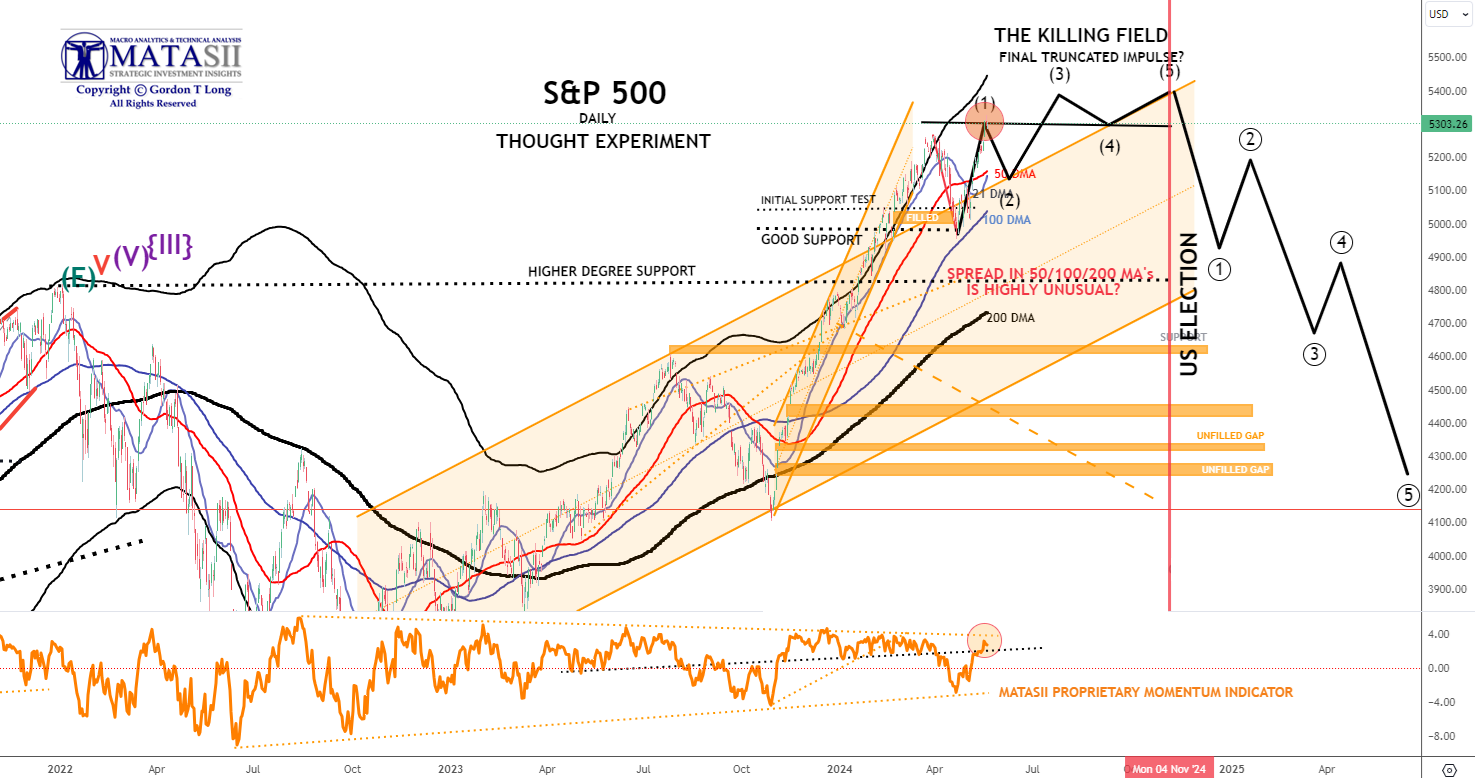
S&P 500 - Daily - Our Thought Experiment
Our Thought Experiment, which we have discussed many times previously in the way of a projection, suggests we have put in a near term top and will now consolidate before possibly completing one final small impulse higher OR put in a final Wave 5 of a higher degree.
NOTE: To reiterate what I previously wrote - "the black labeled activity shown below, between now and July, looks like a "Killing Field" where the algos take Day Traders, "Dip Buyers", the "Gamma Guys" and FOMO's all out on stretchers!"
- The S&P 500 achieved new highs this week on falling Yields.
- Though the lift higher was not strong the EW count suggests a good possibility we have begun a final 5 count higher.
- The 50/100/200 DMA bands are unusually wide and normally markets will need to narrow the gaps in a consolidation / corrective action.
- It will take a major new catalyst to keep the Moving Average bands this separated. That could occur with NVDA earnings on Wednesday.
OUR CURRENT ASSESSMENT IS THAT THE INTERMEDIATE TERM IS LIKELY TO LOOK LIKE THE FOLLOWING: (NOTE - The black projection has not been changed since prior posts so as to serve as a reference.)
|  | |
YOUR DESKTOP / TABLET / PHONE ANNOTATED CHART
Macro Analytics Chart Above: SUBSCRIBER LINK
| |
STOCK MONITOR: What We Spotted
MONDAY
- It had a feel of calm before the storm on Monday with equities and bonds relatively flat by the end of the session.
- Equity futures ground higher in pre-market trade before selling off at the open with lows in stocks later seen in the US afternoon, seemingly on account of an underwhelming Open AI Spring Update, which announced Chat GPT-4o (which will be free), briefly weighing on chip names and Microsoft (MSFT), while Google (GOOGL) caught a bid on the lack of search engine announcement.
- The moves then pared to see the S&P at the unchanged level by market close.
- Treasuries also saw a bid throughout the morning with 10yr finding resistance at 109-00 before paring ahead of NY Fed SCE, which ultimately saw inflation expectations in the 1 and 5-yr hotter than the prior, extending the selling pressure before chopping into settlement.
- Similar was seen with the Dollar, which moved off lows after the NY Fed inflation expectations although the Yen and Franc lagged while Antipodes and the Loonie were flat. GBP outperformed ahead of key labour market data with Cable also back above the 200dma at 1.2540.
- Crude prices attempted to reverse some of the Friday downside while Gold prices completely pared Friday's upside.
- Elsewhere, Meme stocks (GME, AMC) surged on the return of "TheRoaringKitty" on X (formerly Twitter).
- Aside from the NY Fed Survey, Fed's Jefferson spoke but largely echoed Fed Chair Powell, there are a slew of Fed speakers scheduled for the week and plenty of tier 1 data, including US PPI on Tuesday, with US CPI and Retail Sales on Wednesday.
INFLATION BREAKEVENS: 5yr BEI -1.7bps at 2.343%, 10yr BEI -1.4bps at 2.346%, 30yr BEI -1.5bps at 2.351%.
REAL RATES: 10Y -- 2.1471%
- Nvidia (NVDA) +0.5%: Will accelerate quantum computing efforts at national supercomputing centers. In other news, Chinese regulators tell local tech firms to buy fewer Nvidia chips, according to The Information.
- Arm (ARM) +7.5%: Will foray into the development of AI chips, and aims to build a prototype by spring 2025, with mass production scheduled to begin in Autumn 2025.
- Apple (AAPL) +1.5%: Plans to announce that it will bring generative AI to iPhones after the Cos. most significant reorganization in a decade.
- Squarespace (SQSP) +13%: Is to go private for USD 44.00/share in cash with Permira. Note, SQSP closed Friday at USD 38.19/shr.
- Gamestop (GME) +74%: "TheRoaringKitty" posted for the first time in roughly three years. The post, a picture on X of a video gamer leaning forward on their chair to indicate he’s taking the game seriously. Note, AMC Entertainment (AMC) (+80%).
- Incyte (INCY) +8.5%: Announces intention to buy back up to USD 2bln of its common stock.
- Intel (INTC) +2%: In advanced talks with Apollo (APO) which would see the firm supply over USD 11bln to construct a plant in Ireland.
- Walgreen Boots Alliance (WBA) +5.5%: Reportedly to contact potential buyers for the drug-chain Boots, according to Bloomberg.
- AI: OpenAI released the new flagship model called GPT-4o; it will be available for free because it is more efficient. There was no update on a Google (GOOGL) Search competitor as was suggested in reports last week, but OpenAI CEO Sam Altman did state on Friday no search announcement would be made soon.
TUESDAY
- Markets saw two-way action on Tuesday, as the initial broad-based hawkish reaction seen post-PPI (downside in Treasuries and stocks, upside in Dollar) swiftly pared as participants digested the details and awaited remarks from Fed Chair Powell, albeit he said little new with the takeaway arguably him noting confidence in inflation moving back down is lower than it was before.
- Back to PPI, headline and core PPI M/M metrics were hotter-than-expected, printing 0.5% M/M (exp. 0.3%, prev. -0.1%) and 0.5% M/M (exp. 0.2%, prev. -0.1%), respectively, both outside of the upper bound of the analyst forecast range. Headline Y/Y was in line with expectations at 2.2%, with the previous revised lower to 1.8%; the Core rate was unchanged at 2.4%, as forecast, although analysts note details under the bonnet were more encouraging for PCE than the headline suggests, along with revisions lower to prior data.
- As such, US indices saw gains (SPX +0.5%, NDX +0.7%, DJIA +0.4%) with outperformance in the RUT (+1.2%) amid continued tailwinds from the AMC (AMC) (+33%), albeit way off earlier highs in excess of 120%.
- Elsewhere in stocks, Alphabet (GOOGL) (+1%) had its Google O/I event, Musk’s xAI reportedly nears USD 10bln deal to rent Oracle’s (ORCL) (+4%) AI servers, and Sony (SONY) is reportedly rethinking Paramount (PARA) (-5%) bid.
- Treasuries pared post-PPI losses and curve steepened, while the crude complex was lower, as US inflation data and OPEC sources weighed.
- On the latter, Bloomberg source reports noted OPEC+ has reopened fraught debate on members' oil capacity; UAE, Kazakhstan, Iraq, Kuwait and Algeria are among countries whose potential to pump more next year is under scrutiny.
- In FX, the Dollar Index reversed from its post-PPI high of 105.470 to a 104.950 low, as G10 peers (ex-JPY) benefited off the Dollar weakness.
- USD/JPY hit a high of 156.75, with little in the way of resistance ahead of 157.00. Looking ahead, as mentioned all focus is on US CPI on Wednesday (primer below), alongside Retail Sales with a deluge of other data later on.
INFLATION BREAKEVENS: 5yr BEI -1.8bps at 2.327%, 10yr BEI -1.4bps at 2.332%, 30yr BEI -0.9bps at 2.342%.
REAL RATES: 10Y -- 2.0987%
- Walmart (WMT) -1%: To lay off and relocate workers as it is cutting hundreds of corporate jobs and asking some staff to move to large corporate hubs, according to WSJ.
- B. Riley Financial (RILY) -2%: Announced it has delayed its 10-Q filing; sees Q1 net loss of c. USD 51mln.
- AMC (AMC) +33%, GameStop (GME) +60.5% continue to surge after extensive gains on Monday.
- Plug Power (PLUG) +20.5%: Receives USD 1.66bln conditional commitment loan guarantee from DoE for green hydrogen development pipeline.
- Amazon (AMZN) +0.5%: AWS CEO Selipsky is to step down, with Matt Garman replacing him, effective June 3rd.
- Oracle (ORCL) +4%: Musk’s xAI reportedly nears USD 10bln deal to rent Oracle’s AI servers, according to The Information.
- QuidelOrtho (QDEL) +6%: Activist investor Jana Partners built a new stake in the Co. during Q1, according to Reuters citing sources.
- Paramount (PARA) -5%: Sony (SONY) is reportedly rethinking Paramount bid, according to CNBC.
- Alphabet (GOOGL) +1%: Had its Google O/I event; said more than 1.5mln developers use Gemini AI models and launching AI overviews in search across US this week. DeepMind CEO announces Gemini 1.5 flash model, and is built to be fast and cost efficient. Within the event, Co. announced many news AI tools.
WEDNESDAY
- The highlight of the day was the softer than expected US CPI report which saw markets back to fully pricing in two rate cuts this year, with the first move now fully discounted by September.
- Stocks and bonds were instantly bid and despite some post data chop, both finished the day around highs, with the S&P 500 closing at a fresh ATH.
- The soft CPI was the key driver, although a weak Retail Sales report supported the moves.
- The Buck was the FX laggard, with the DXY falling from a peak of 105.06 to a trough of 104.300 while
- Treasuries were bid across the curve to see the 10yr yield fall from c. 4.45% to a low of 4.34%.
- The move lower in yields supported both Gold prices and the Yen while cyclical currencies also benefited from the rally in stocks.
- Bitcoin also rose to the highest level since April 24th, but meme stocks (AMC, GME) were hit after their rocket trip to the moon seen earlier in the week.
- Crude prices sold off throughout the US morning and saw a fleeting bid on the US data, but ultimately settled in the black after a surprise draw in the EIA inventory data.
- Note, that after the CPI data, many analysts started to release their forecasts for Core PCE, the Fed's Preferred gauge of inflation, which is expected now to come in between 0.20-0.26% but the import price data tomorrow could have some sway on these forecasts (via WSJ's Timiraos who compiled analyst forecasts).
- Fed's Kashkari spoke after the data, but he reiterated the Fed line that they need to keep rates on hold for a while longer to figure out where inflation is headed, a message likely to be echoed by the several Fed speakers due throughout the rest of the week, given the CPI data is just one data release.
INFLATION BREAKEVENS: 5yr BEI -2.1bps at 2.310%, 10yr BEI -1.9bps at 2.320%, 30yr BEI -1.4bps at 2.331%.
REAL RATES: 10Y -- 2.0463%
-
Boeing (BA) -2%: DoJ says the Co. violated 737 MAX settlement.
- Nextracker (NXT) +7%: EPS and revenue beat, with FY EBITDA guidance better than expected.
- Infinera (INFN) -8%: Deeper loss per share, revenue missed with light next quarter outlook.
- Monday.com (MNDY) +21%: Top and bottom-line surpassed consensus, with strong Q2 and FY revenue guide.
- New York Community Bancorp (NYCB) -5.5%: Agrees to sell approx. USD 5bln in mortgage warehouse loans to JPMorgan Chase Bank (JPM).
- DLocal (DLO) -26%: All major metrics missed in its Q1 report.
- Petrobras (PBR) -7%: Brazil President Lula dismisses Petrobras CEO Jean Paul Prates; board asked to negotiate over the ending of his term.
- Netflix (NFLX) flat: Reaches 40mln global MAUS on its ad-supported plan; is to launch an in house advertising technology platform by the end of 2025, via Presentation. Also, reportedly nears deal for NFL games, and is continuing push into sports, according to Bloomberg.
- Apple (AAPL) +1.2%: New accessibility features are coming later this year; eye tracking comes to iPad and iPhone.
THURSDAY
- Stocks were ultimately slightly lower (RUT underperformed) on Thursday with gains after the cash equity open paring throughout the US evening in a quiet session.
- Bonds had given up some of the post-CPI rally and were gradually sold throughout the session on likely profit-taking while the US data dump accelerated the selling pressure.
- Import and Export prices were hotter than expected - which may have implications for Core PCE - while jobless claims were in line, paring most of the prior week's spike.
- Elsewhere, housing data was soft and the Philly Fed disappointed, with the prices paid component easing.
- Aside from data, Fed speak saw Barkin acknowledge inflation is not where the Fed is trying to get, and it will take more time to get it there.
- Mester also noted it will take longer to gain confidence inflation is moving towards 2%, adding that risks to the inflation side of the Fed's mandate have increased.
- Williams spoke pre-data, noting the April CPI was a positive development, and that he does not see a need for a near-term rate cut OR hike.
- Elsewhere, crude prices settled in the green supported by geopolitics but with gains capped on the Dollar strength. The Buck was supported by the move higher in yields and perhaps some general paring from the move on Wednesday while traditional havens lagged with the Yen and Franc underperforming, gold was also lower.
- The earnings highlight was Walmart (WMT) who rallied on a strong report while Under Armour (UAA) saw slight losses after weak guidance. Cisco (CSCO) failed to hold on to its pre-market bid despite a strong report, with the stock heavily sold on the session amid some cautious sell-side commentary on the report.
INFLATION BREAKEVENS: 5yr BEI +1.4bps at 2.319%, 10yr BEI +0.3bps at 2.319%, 30yr BEI -0.3bps at 2.324%
REAL RATES: 10Y -- 2.1196%
STOCK SPECIFIC
- Walmart (WMT) +7%: EPS, revenue, and comparable sales all beat, with FY adj. EPS at high end or slightly above original guidance.
- Cisco (CSCO) -2.5%: Top and bottom line surpassed Wall St. consensus, alongside raising FY revenue view. Note, despite the strong report Piper Sandler noted the organic lead metrics were not that impressive (ex-product orders / low-quality) and still suggests core Networking, Security, and Collaboration weakness.
- JD.Com (JD) +2%: Profit and revenue topped consensus.
- Under Armour (UAA) -1.5%: FY profit outlook was way short of expected and revenue is seen to be down at a low double digit percentage rate, amid downbeat commentary. Also, sees a surprise Q1 loss per share.
- Deere & Co (DE) -4.5%: Profit forecast was cut on a demand slowdown.
- SilverBow Resources (SBOW) +13%: To be acquired by Crescent Energy (CRGY) for USD 2.1bln.
- Corebridge (CRBG) +8%: AIG (AIG) is to sell 20% ownership stake of Corebridge (CRBG) to Nippon Life for USD 3.8bln.
- Meta (META) -1.5%: EU investigates Co. over child safety & mental health concerns.
- Microsoft (MSFT) -0.5%: Will reportedly launch its custom Cobalt 100 chips to customers as a public preview at its Build conference next week, according to TechCrunch. MSFT will also announce a partnership with Snowflake (SNOW). Fabric will now support Snowflake’s Iceberg format.
- Waste Management (WM) +1.5%: Exploring a USD 3bln sale of its renewable natural gas unit, via Reuters citing sources.
- Chubb (CB) +4.5%: In its latest 13-F Berkshire Hathaway (BRK.B) reported a stake in the Co., around 6.4% of its market cap.
FRIDAY
INFLATION BREAKEVENS: 10yr BEI -0.5bps at 2.32%.
REAL RATES: 10Y -- 2.091%
| |
CONTROL PACKAGE
There have FIVE charts we have outlined in prior chart packages that we will continue to watch closely as a CURRENT "control set":
- The 10Y TREASURY NOTE YIELD - TNX - HOURLY (CHART LINK)
- The 10Y TREASURY NOTE YIELD - TNX - DAILY (CHART LINK)
- The 10Y TREASURY NOTE YIELD - TNX - WEEKLY (CHART LINK)
- The 30Y TREASURY BOND YIELD - TNX - WEEKLY (CHART LINK)
- REAL RATES (CHART LINK)
FISHER'S EQUATION = 10Y Yield = 10Y INFLATION BE% +REAL % = 2.32% + 2.091% = 4.411%
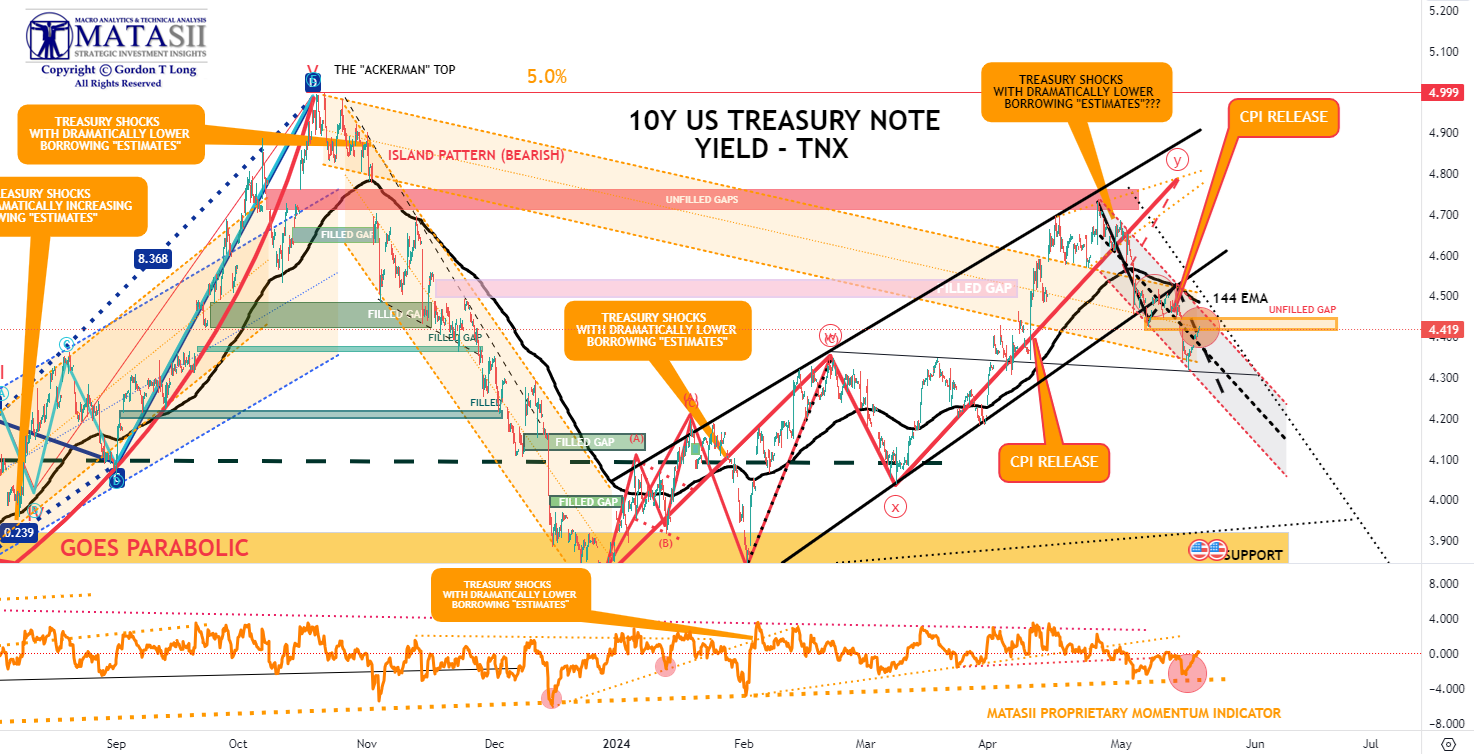
10Y UST - TNX - DAILY
- The TNX has broke downward to find support at a solid black trend line, before bouncing late in the week.
-
It appears to have found potential near term support and likely wants to test overhead support at the 144 EMA and close the unfilled gap.
| |
YOUR DESKTOP / TABLET / PHONE ANNOTATED CHART
Macro Analytics Chart Above: SUBSCRIBER LINK
| |
10Y UST - TNX - WEEKLY
- Yields plunged on the CPI Report but found initial support at the 40 WMA before bouncing to retest overhead resistance at the 50 DMA.
- Yields at Momentum Support (dotted black line in lower pane) with overhead resistance slightly above.
| |
YOUR DESKTOP / TABLET / PHONE ANNOTATED CHART
Macro Analytics Chart Above: SUBSCRIBER LINK
| |
NOTICE Information on these pages contains forward-looking statements that involve risks and uncertainties. Markets and instruments profiled on this page are for informational purposes only and should not in any way come across as a recommendation to buy or sell in these assets. You should do your own thorough research before making any investment decisions. MATASII.com does not in any way guarantee that this information is free from mistakes, errors, or material misstatements. It also does not guarantee that this information is of a timely nature. Investing in Open Markets involves a great deal of risk, including the loss of all or a portion of your investment, as well as emotional distress. All risks, losses and costs associated with investing, including total loss of principal, are your responsibility.
FAIR USE NOTICE This site contains copyrighted material the use of which has not always been specifically authorized by the copyright owner. We are making such material available in our efforts to advance understanding of environmental, political, human rights, economic, democracy, scientific, and social justice issues, etc. We believe this constitutes a ‘fair use’ of any such copyrighted material as provided for in section 107 of the US Copyright Law. In accordance with Title 17 U.S.C. Section 107, the material on this site is distributed without profit to those who have expressed a prior interest in receiving the included information for research and educational purposes. If you wish to use copyrighted material from this site for purposes of your own that go beyond ‘fair use’, you must obtain permission from the copyright owner.
========
| |
MATASII'S STRATEGIC INVESTMENT INSIGHTS | |
2020 VIDEOS OUTLINING THE COMING RISE IN INFLATION, STAGLFLATION & COMMODITY PRICES | |
|
THE REGULATORY STATE
RELEASED - 01-17-24 --- 212 Page Paper
FULL 212 PAGE PDF DOWNLOAD
| |
IDENTIFICATION OF HIGH PROBABILITY TARGET ZONES | |
Learn the HPTZ Methodology!
Identify areas of High Probability for market movements
Set up your charts with accurate Market Road Maps
Available at Amazon.com
| |
The Most Insightful Macro Analytics On The Web | | | | |