|
Gordon T Long Research exclusively distributed at MATASII.com
Subscribe to Gordon T Long Research - $35 / Month - LINK
Complete MATASII.com Offerings - $55/Month - LINK
SEND YOUR INSIGHTFUL COMMENTS - WE READ THEM ALL - lcmgroupe2@comcast.net
| |
|
LONGWave - MARCH 2024
Technical Analysis - 03/18/24
| |
THE US HAS SLOWLY BEGUN IMPORTING INFLATION!
OBSERVATIONS: THE REDISTRIBUTION OF WEALTH
I remember visually and tentatively walking into the eastern University amphitheater of my first year Political Science class. It was 1968 and though Canada was far away from the Vietnam War, I was confronted by at least 60% of the students having long hair, bandanas around their heads with flowered braids and paisley adornments. They were fleeing US draft dodgers.
The clear smell of "pot" floating in the air was something this country boy from western Canada was not used to. With the US Presidential election campaigns of Hubert Humphrey and Richard Nixon fully underway, there was a charged feeling within the hall as the professor mounted the podium. His first words out of his mouth brought out a thunderous and knowing approval from the students when he bellowed:
"Politics is about the redistribution of wealth, from one group to another!"
I never forgot how that statement loudly resonated throughout the theater that morning. The arbitrary taking of wealth from some to give to others seemed somehow unfair to me coming from a region of extremely independent famers and ranchers. In that first semester I came to grips with the immense power we give to our elected officials. I naively assumed (and hoped) these older and wiser adults would exercise the entrusted power with knowledge, wisdom and a strong moral compass. My newly introduced "tainted" American friends however quickly tried dispelling that notion in the highly ruckus tutorial sessions.
Now that my hair is grey, I have witnessed enormous change in the field of political economics. Nothing being larger than exploding public debt and the implicit power it commands. This is the modern version of Redistribution of Wealth, where increasing nation debt and its financing obligations are transferred to "We the People" by political operatives and politicians from those with the financial acumen and leveraged liquidity access to turn it into unfathomable wealth!
Secondly, increasing Crony Capitalism has emerged over the years living off Regulatory Arbitrage and the flow of deficit financing, which has created government dependent industries controlled by private enterprises.
I also additionally recall learning in my first semester of Political Economics that:
"Power Corrupts, But Absolute Power Absolutely Corrupts!" ===>
| |
|
VIDEO PREVIEW (click image)
Pay-Per-View Page Link
| |
THIS WEEK WE SAW
Exp=Expectations, Rev=Revision, Prev=Previous
US
US CPI MM (Feb) 0.4% vs. Exp. 0.4% (Prev. 0.3%)
US CPI YY NSA (Feb) 3.2% vs. Exp. 3.1% (Prev. 3.1%)
US Core CPI MM (Feb) 0.4% vs. Exp. 0.3% (Prev. 0.4%)
US Core CPI YY NSA (Feb) 3.8% vs. Exp. 3.7% (Prev. 3.9%)
US Cleveland Fed CPI (Feb) 0.4% (Prev. 0.5%)
US Retail Sales MM (Feb) 0.6% vs. Exp. 0.8% (Prev. -0.8%, Rev. -1.1%)
US PPI Final Demand MM (Feb) 0.6% vs. Exp. 0.3% (Prev. 0.3%)
US PPI Final Demand YY (Feb) 1.6% vs. Exp. 1.1% (Prev. 0.9%, Rev. 1.0%)
US PPI ex-Food/Energy MM (Feb) 0.3% vs. Exp. 0.2% (Prev. 0.5%)
US PPI ex-Food/Energy YY (Feb) 2.0% vs. Exp. 1.9% (Prev. 2.0%)
US Initial Jobless Claims 209k vs. Exp. 218k (Prev. 217k, Rev. 210k)
US Continued Jobless Claims 1.81M vs. Exp. 1.90M (Prev. 1.91M, Rev. 1.79M)
===> This is precisely one reason why the Canadian national anthem has the phrase "We Stand On Guard For Thee" enshrined in it.
| |
========================= | |
|
WHAT YOU NEED TO KNOW!
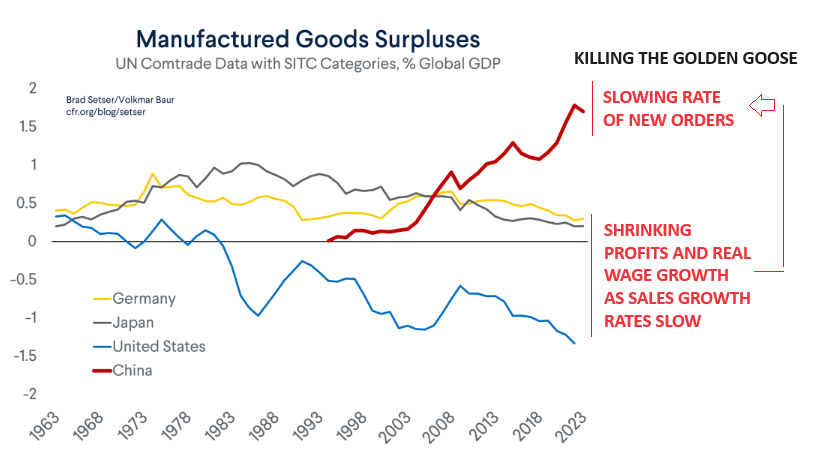
THE KILLING OF THE GLOBAL GOLDEN GOOSE
The US as a nearly 70% consumption economy and the Euro Zone as ~ 55% consumption economy are critical demand drivers of the Chinese manufacturing juggernaut. However, when that Juggernaut reaches a point where it begins slowing the rate of growth of those buying its products something happens. Job growth and wage growth slows in the consuming countries and with it Consumer demand growth slows. This becomes a slow starvation of the Golden Goose. Has China potentially now reached such a point? Is this at the core root of China's current dilemma?
RESEARCH
THE US HAS SLOWLY BEGUN IMPORTING INFLATION - Will only get worse when Commodities resume their rise.
- People get fooled by currency conversions. It is actually about PPP (purchase price parity).
- Distortions from the ~600-$750T unregulated, OTC Swaps markets creates a false illusion.
- Major Fiat currencies and currency pegs continue heading lower together. However, you can't tell because they are always measured against each other.
CORE SERVICE INFLATION IS WHAT REALLY MATTERS IN A SERVICE ECONOMY - Goods Inflation Pressures now Succumbing to Services Inflation
- Core Service inflation has accelerated over the past six months, and it is a major problem for the Fed.
- The Fed acutely knows it, but can't directly or expediently control it!
- Core prices have actually accelerated on an annualized basis and is particularly evident on 3 and 6 month time horizons.
- Time Strapped US Consumers have become highly dependent on the increasing use of consumer services which is fostering workers to demand wage increases as their real disposable incomes come under pressure.
| |
|
DEVELOPMENTS TO WATCH
BIDEN BUDGET - $7.3T and the End of Fiscal Responsibility
- The Biden administration has released a proposed budget that would boost federal spending to $7.3 trillion next fiscal year. To pay for it, they intend to raise taxes by $5.5T over 10 years.
- To make Biden's Budget seem plausible the planned increase in Individual Income Tax is going to be taken from $2510B in the current tax year to $4486B in 10 years or 78.7%.
- If this tax is to supposedly to come from primarily those earnings over $400K/annum, do you really believe the rich are going to stay or worse - invest in America?
- The Budget is simply preposterous since, even with these Revenue expectations, the budget deficit growth is $16.3T over the same 10 years.
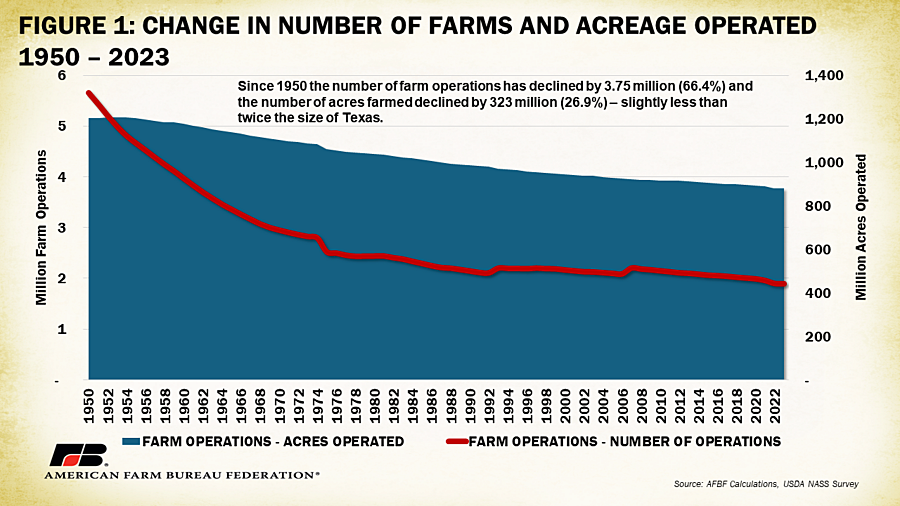
140,000 FARMS LOST - A Food Inflation Set-Up??
- Between 2017 and 2022, the number of farms in the U.S. declined by 141,733 or 7%,
- Acres operated by farm operations during the same timeframe declined by 20.1 million (2.2%), a loss equivalent to an area about the size of Maine.
- Only 1.88% of acres operated and 1% of farm operations were classified under a non-family corporate farm structure.
| |
|
GLOBAL ECONOMIC REPORTING
-
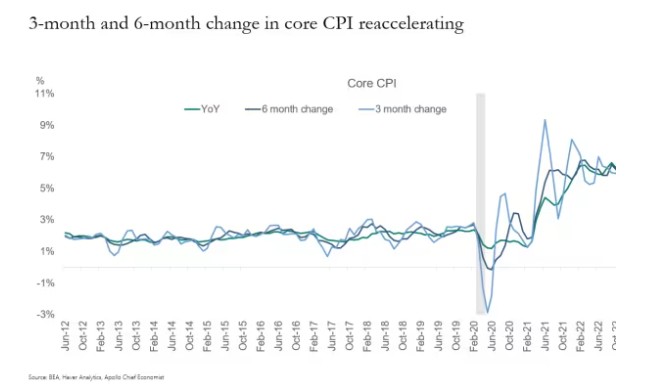
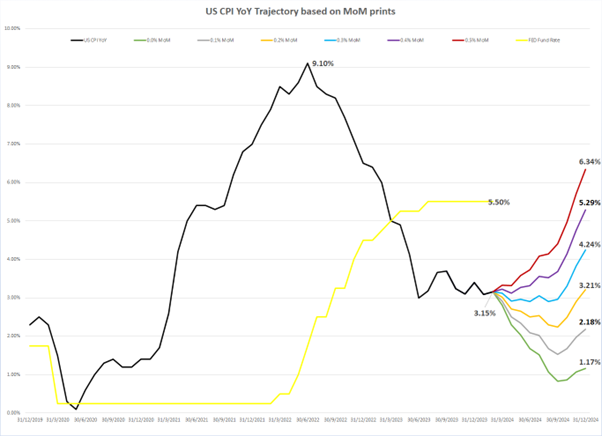
FEBRUARY CPI: Core CPI continued to decline on a year-over-year basis in February. But things look different over a three-month and six-month time horizon. For both, core prices have actually accelerated on an annualized basis.
- The February CPI report suggests that Wall Street bankers' hopes for the last mile of disinflation may remain elusive, as the economy could face the resurgence of inflation in the coming quarters.
- Additionally, geopolitical and social unrest both domestically and abroad may contribute to a stagflation environment by the end of the second quarter.
-
Similar to the 1970s and previous periods marked by wars and social unrest, holding equities and hard assets, rather than long-dated bonds, appears to be the most effective strategy for safeguarding investors' purchasing power.
-
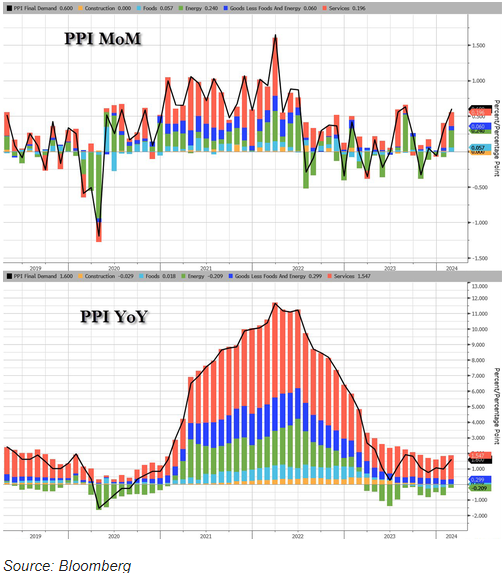
FEBRUARY PPI: February Producer Prices were expected to slow their surge from January, but they did not.
- Headline Final Demand PPI rose 0.6% MoM (double the 0.3% rise expected) - the hottest print since June 2022.
- This lifted the YoY PPI to +1.6%, its highest since September.
-
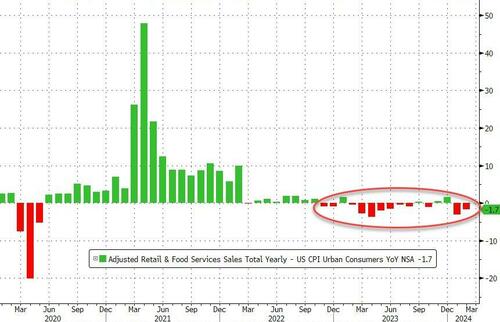
RETAIL SALES: Adjusted (crudely) for inflation, this was a huge drop in 'real' retail sales.
- REAL retail sales have declined for 12 of the last 16 months - in other words, on a crude basis (Ret Sales - CPI), Americans aren't buying more "stuff"!
-
Is the "Soft-landing" morphing into a stagflationary crash-landing?
| |
|
In this week's expanded "Current Market Perspectives", we focus on Bitcoin, Gold, PEs and rising Treasury Yields.
=========
| |
|
THE US HAS SLOWLY BEGUN IMPORTING INFLATION!
PEOPLE GET FOOLED BY CURRENCY CONVERSIONS ...
... IT IS ACTUALLY ABOUT US PPP (PURCHASE PRICE PARITY).
Presently imported inflation to the US is most noticeably occurring through major non currency-pegged exporters to the US like Mexico. They continue to import both finished goods and raw material commodities as their currencies rise. (chart below).
| 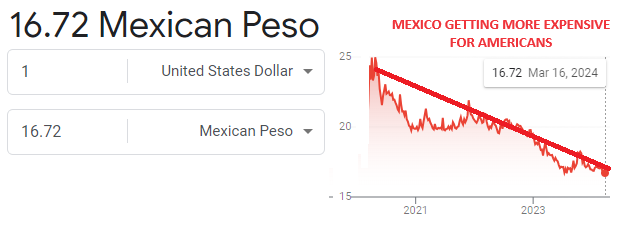 | |
What many fail to recognize is that inflation is no longer being absorbed by the Commodity countries (the BRICs, OPEC, etc.). Increasingly foreign rising foreign commodity prices will further create US inflation.
There are 156 countries world wide who's economies depend on the export of commodities. They have historically been held hostage by a strong dollar. This is changing as margins on goods manufacturing continue to be squeezed while raw material costs become increasingly a key driver of cost. Shortages, scarcities, competition, economic development and de-dollarization of FX reserves are all contributing.
The reality is that Commodities being sold to any Fiat Currency country only passes that inflation on to the US since the US has a massive trade deficit with the other fiat based currencies. It is coming to the US both in the form of finished goods, supply chain products and direct imports of commodities themselves.
The easiest way to see this imported inflation is to look at comparative PPP of commodity exporters in US dollars. PPPs of commodity dominate exporters are steadily rising on the longer term, even though their currency conversions are volatile
MAJOR FIAT CURRENCIES & CURRENCY PEGS CONTINUE HEADING LOWER TOGETHER,
BUT YOU CAN'T TELL BECAUSE THEY ARE MEASURED AGAINST EACH OTHER.
MEASURED AGAINST REAL ASSETS OR PPP SHOWS THE DEBASEMENT RATE.
(Click here to compare Global PPP changes versus Currency Conversion by US Importer)
What keeps the "mechanism" working (and somewhat hidden) is the use of ~$600 -$750 TRILLION in unregulated OTC currency and interest swaps tracked (but not policed nor regulated) by the Bank of International Settlements (BIS).
The US Dollar Global Regime has now been fragmented into an East/West paradigm with the Western G8 Currencies being inflationary while the Eastern currencies and BRICS are mostly commodity based.
The West can't inflate their way out of a looming potential Oil trap UNLESS they open up all the US Domestic reserves and Drill Drill Drill, which isn't happening. The result of these policies is extreme inflation on commodities and in the real economy, bolstered by the fact that US infrastructure is designed that an average Tomato travels 1500 miles by truck before reaching its dinner table - all powered by Oil.
US Oligarchs are happy with this arrangement because inflation always bubbles up their balance sheets. On paper, sales are higher, markets are generally higher and growth is positive. But in reality, those paper gains are just a measure of inflation - it isn't their net worth going up, it's the US Dollar going down.
The test is, how much does the US Dollar buy you? What's the buying power of US Dollars domestically?
The argument about a strong or weak US Dollar has never been one sided. Importers want a strong US dollar and Exporters want a weak US Dollar, and both sides make arguments to cater to their own interests - but what's happening now is toxic to both, because it's not markets that are making prices higher, it's inflation. Or in other words, that value is being sucked up by the inflation. It isn't being passed on to the Oligarchs - it's being vaporized.
Whether you are looking at housing, groceries, or buying a business - you are getting less for your money than you did 2 years ago, and we can't say a number, because there's not enough data to calculate (and based on what method?). Some will say 10%, some will say 50%. But we all agree that the last 2 years have been more inflationary than any other period in recent history.
Traditionally the issue with the USD is that since 90% of other currencies use the USD to 'back' their currencies (meaning they keep USD in reserve), for SWAP agreements and to value their Currencies - the US system exports inflation to those Currencies. Russia is not the only country that uses USD reserves. In fact many central banks keep US Dollars in their reserves to shore up their balance sheets. Many major Currencies are priced in USD, such as USD/JPY (Dollar / Yen) - and so their value is often quoted as how they are doing against the other. Because the USD is the most commonly used Currency in the world, the absorbing of this inflation due to Blacklisting the Commodity Currencies is having a uniquely toxic effect on the USD. Foreigners have stopped buying it, and that's causing the price to go down, which means the net effect is the purchasing power of the USD is going down.
Of course there's a simple cure for this - end the Sanctions and raise rates. But that's not likely to happen in this Administration.
| |
|
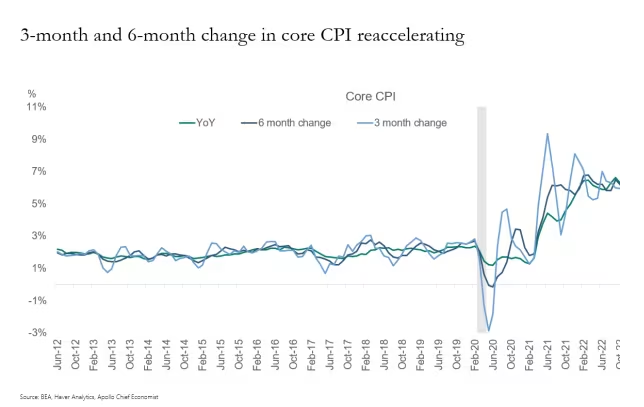
CORE SERVICE INFLATION IS WHAT MATTERS IN A SERVICE ECONOMY
CORE SERVICES IS THE FED'S PROBLEM
Core Service inflation has accelerated over the past six months, and it is a major problem for the Fed.
They acutely know it but can't directly or expediently control it!
Though Core CPI did decline on a year-over-year basis in February, things look different over a three-month and six-month time horizon. For both, core prices have actually accelerated on an annualized basis. (chart right).
Time Strapped US Consumers have become highly dependent on the increasing use of consumer services.
The first wave of services inflation came from labor shortages. The new wave is coming from a wage price spiral as continued tight job markets are compounded by rising goods prices causing workers to demand wage increases as their real disposable incomes come under pressure. This is why when the inflation genie is let out of the bottle. It is so difficult to get back in. The Fed can't directly impact this, other than let it play out like "food through a snake"!
| |
|
DEVELOPMENTS TO WATCH
BIDDEN BUDGET: $7.3T and the End of Fiscal Responsibility
The Biden administration has released a proposed budget that would boost federal spending to $7.3 trillion next fiscal year. To pay for it, they intend to raise taxes by $5.5T over 10 years.
SOURCE DATA:
CHART BELOW
To make Biden's Budget seem plausible, the planned increase in Individual Income Tax is going to be taken from $2510B in the current tax year to $4486B in 10 years or 78.7%. If this tax is to supposedly to come from primarily those earnings over $400K/annum, do you really believe the rich are going to stay or worse - invest in America? The Budget is simply preposterous, since even with these Revenue expectations the budget deficit growth is $16.3T over the same 10 years.
| |
|
There's virtually no chance of it passing given the current makeup of Congress. Even the WSJ calls it 'largely symbolic', as it will give Biden a steady supply of talking points to read off teleprompters across the land during his re-election campaign.
SPIN
According to the White House, the 2025 budget would cut the deficit by $3 trillion over the next decade, and raise taxes by a net of $4.9 trillion - a boost of roughly 7% in collections without any policy changes, the Wall Street Journal reports.
.
Other features of the proposed budget include:
- A boost in defense spending to $895 billion, up from $886 billion.
- Congressional approval for roughly $1.6 trillion in discretionary spending - slightly lower than the current year's budget.
- This will be offset by $1.6 trillion in spending caps which were agreed to last year by House Republicans and the Biden administration, according to the Congressional Budget Office.
-
Medicare taxes and drug pricing are also included, with tax increases on people earning more than $400,000 per year (which we all know is total bullshit). The plan will also significantly expand the number of drugs subject to government price negotiation to 50 per year, up from 20, and it would extend a $2,000 cap on out-of-pocket prescription drugs under Medicare.
- Immigration and international aid: The Department of Homeland Security would receive an additional $8.7 billion under the proposal - much of which would plug a budget hole created by the 'unexpected' surge in migrants last year. $2.9 billion of it would fund longer term investments, including hiring more Border Patrol agents and asylum officers.
- Ukraine: Of course, the budget proposal also reiterates Biden's supplemental request for $60 billion in emergency aid for his favorite country.
NON-PARTISAN TAX FOUNDATION SUMMARY
Rather than aiming for a simpler tax code that broadly encourages investment, saving and work in the United States, the president has promised higher taxes that would decrease economic output and incomes, reduce U.S. competitiveness, and further complicate the tax code. While the Biden budget claims to reduce deficits as a share of the economy over the next decade, that claim is based on several unrealistic assumptions, including:
-
No extension of the individual and estate tax cuts from the 2017 Tax Cuts and Jobs Act (TCJA) that are set to expire at the end of 2025, despite signaling interest in extending the tax cuts for people earning under $400,000, which would cost at least $1.4 trillion over the 10-year budget window
-
No extension of the administration’s proposed expansion of the child tax credit beyond 2025, which would cost more than $1 trillion over the budget window.
-
Economic growth well in excess of what is forecast by the Congressional Budget Office (CBO).
The FY 2025 Biden budget includes the following major changes, beginning in 2024 unless otherwise noted:
MAJOR BUSINESS TAX PROVISIONS IN BIDEN BUDGET
- Increase the corporate tax rate from 21 percent to 28 percent
-
Increase the corporate alternative minimum tax (CAMT) on book income tax rate from 15 percent to 21 percent
- Disallow deductions for employee compensation above $1 million
- Quadruple the stock buyback tax from 1 percent to 4 percent
- Make permanent the excess business loss limitation for pass-through businesses
-
Eliminate the foreign-derived intangible deduction (FDII) and replace it with unspecified research & development (R&D) incentives
-
Repeal the base erosion and anti-abuse tax (BEAT) and replace it with an undertaxed profits rule (UTPR) consistent with the OECD/G20 global minimum tax model rules
- Raise taxes on fossil fuel companies and oil extraction
MAJOR INDIVIDUAL, CAPITALGAINS & ESTATE TAX PROVISIONS IN BIDEN BUDGET
- Expand the base of the net investment income tax (NIIT) to include nonpassive business income and increase the rates for the NIIT and the additional Medicare tax to reach 5 percent on income above $400,000
-
Increase top individual income tax rate to 39.6 percent on income above $400,000 for single filers and $450,000 for joint filers
-
Tax long-term capital gains and qualified dividends at ordinary income tax rates for taxable income above $1 million and tax unrealized capital gains at death above a $5 million exemption ($10 million for joint filers)
-
Create a 25 percent “billionaire minimum tax” to tax unrealized capital gains of high-net-worth taxpayers
- Limit retirement account contributions for high-income taxpayers with large individual retirement account (IRA) balances
- Tax carried interest as ordinary income for those earning over $400,000
- Limit 1031 like-kind exchanges to $500,000 in gains
- Tighten estate and generation-skipping tax (GST) rules
-
Tighten tax rules for digital assets, including cryptocurrency, and impose a new 30 percent excise tax on electricity costs associated with digital asset mining
| |
140K FARMS LOST - A Food Inflation Set-Up
Between 2017 and 2022, the number of farms in the U.S. declined by 141,733 or 7%, according to USDA’s 2022 Census of Agriculture, released on Feb. 13.
Acres operated by farm operations during the same timeframe declined by 20.1 million (2.2%), a loss equivalent to an area about the size of Maine. Only 1.88% of acres operated and 1% of farm operations were classified under a non-family corporate farm structure.
READ MORE:
| |
|
GLOBAL ECONOMIC INDICATORS: What This Week's Key Global Economic Releases Tell Us
FEBRUARY CPI
- US CPI MM (Feb) 0.4% vs. Exp. 0.4% (Prev. 0.3%)
- US CPI YY NSA (Feb) 3.2% vs. Exp. 3.1% (Prev. 3.1%)
- US Core CPI MM (Feb) 0.4% vs. Exp. 0.3% (Prev. 0.4%)
- US Core CPI YY NSA (Feb) 3.8% vs. Exp. 3.7% (Prev. 3.9%)
The February CPI report suggests that Wall Street bankers' hopes for the last mile of disinflation may remain elusive, as the economy could face the resurgence of inflation in the coming quarters. Additionally, geopolitical and social unrest both domestically and abroad may contribute to a stagflation environment by the end of the second quarter. Similar to the 1970s and previous periods marked by wars and social unrest, holding equities and hard assets, rather than long-dated bonds, appears to be the most effective strategy for safeguarding investors' purchasing power.
CHART BELOW: Core Services
Core CPI continued to decline on a year-over-year basis in February. But things look different over a three-month and six-month time horizon. For both, core prices have actually accelerated on an annualized basis.
|  |
- Overall, CPI data was hotter than expected with the core CPI rising 0.4% M/M, above the 0.3% consensus and matching the top end of analyst forecasts.
- The Core Y/Y rose 3.8%, easing from the 3.9% prior, but not as much as the 3.7% forecast.
- The headline numbers saw M/M rise 0.4% (exp. 0.4%, prev. 0.3%), with Y/Y rising 3.2% (exp. 3.1%, prev. 3.1%).
- The annualized measures rose, with the core CPI 3mth annualized rate ticking up to 4.1% from 3.9%, and the 6mth rising to 3.8% from 3.5%.
- The main concern here is that the hot January report has continued into February, somewhat dismissing the argument that seasonality concerns led to the "one-off" hot print in January.
- Nonetheless, the BLS exclaims that the rise in shelter and gasoline prices contributed to over 60% of the monthly increase - suggesting the high price rises are largely concentrated in these areas; Pantheon Macroeconomic writes "the bigger picture is fine".
- There is still plenty of data due before the May and June meetings to help shape expectations. The Fed (and now markets) have already dismissed the probability of a March cut while May also seems highly unlikely.
- This report therefore likely does little to alter the Fed's near term narrative.
- It will be interesting to see if the Fed Chair repeats his line at the semi-annual testimony (post Jan CPI) that the Fed is "not far" from gaining confidence that inflation is on the track to hit the 2% goal, particularly after this latest report.
- However, he also explained that the Fed is not looking for better inflation readings than what has already been, but for more of what has been seen.
| |
FEBRUARY PPI
- US PPI Final Demand MM (Feb) 0.6% vs. Exp. 0.3% (Prev. 0.3%)
- US PPI Final Demand YY (Feb) 1.6% vs. Exp. 1.1% (Prev. 0.9%, Rev. 1.0%)
- US PPI ex-Food/Energy MM (Feb) 0.3% vs. Exp. 0.2% (Prev. 0.5%)
- US PPI ex-Food/Energy YY (Feb) 2.0% vs. Exp. 1.9% (Prev. 2.0%)
February Producer Prices were expected to slow their surge from January, but they did not... with headline Final Demand PPI rising 0.6% MoM (double the 0.3% rise expected) - the hottest print since June 2022. That lifted the YoY PPI to +1.6%, its highest since September.
This was the second big beat for PPI in a row with Energy costs leading the MoM charge.
70% of the rise in February Goods PPI can be attributed to the index for energy, which jumped 4.4%. (One-third of the February advance in the index for final demand goods can be traced to a 6.8% increase in prices for gasoline.)
- PPI came in much hotter than expected in February, adding fuel to the fire after the hot CPI figures earlier in the week.
- Headline producer prices rose 0.6% vs January, well above the expected and prior 0.3% pace, driven by energy price increases (particularly gasoline) as well as food price inflation accelerating, with the headline Y/Y rising 1.6%, also well above the expected 1.1% and the prior 1.0%, now at the highest rate since September 2023.
- The core figure (ex-food and energy) rose 0.3% M/M, which was down from January's 0.5% increase, but above the expected +0.2%, while the Y/Y rate was unchanged at +2.0% despite expectations for a fall to +1.9%.
- Transportation & warehouse services, alongside airline passenger services, were notable upward drivers for the core figures.
- As far as Core PCE is concerned (which is scheduled for release on March 29th), after the CPI and PPI figures (we get the import price data on Friday), the growing consensus appears to be for a 0.3% M/M print, which would mark a slowing from last month's +0.4% print.
- Analysts note the inputs from PPI into Core PCE were mixed with a reversal back lower from January's spike in inpatient care services and investment-related financial services, (which were key drivers for the increase in Jan PCE), although the contribution from insurance prices picked up in February, as did health and medical care insurance, which fell in January.
| |
|
RETAIL SALES
- US Retail Sales MM (Feb) 0.6% vs. Exp. 0.8% (Prev. -0.8%, Rev. -1.1%)
Adjusted (crudely) for inflation, this was a huge drop in 'real' retail sales. REAL retail sales have declined for 12 of the last 16 months - in other words, on a crude basis (Ret Sales - CPI), Americans aren't buying more "stuff"!
Soft-landing morphing into a stagflationary crash-landing?
- Retail sales for February rose 0.6% M/M, shy of the expected 0.8% while January was revised lower from -0.8% to -1.1%.
- Ex-Autos rose 0.3% (prev. -0.8%), light of the forecast 0.8%, and Ex-Gas/Autos also rose 0.3% (prev. -0.8%), with retail control, which feeds into GDP, flat (exp. 0.4%, prev. -0.3%).
- Within the dataset, outperforming categories included building material/garden (+2.2% M/M), motor vehicles & parts dealers (+1.6%) and electronics/appliances (+1.5%), while underperformers included furniture/home furnishings (-1.1%) clothing/clothing accessories (-0.5%).
- Overall, the modest rebound suggests that consumer spending growth slowed in early 2024. As such, Oxford Economics notes, “accounting for inflation, we think real consumption growth was flat in February, leaving it on track for growth of 2% annualized in Q1, weaker than our baseline forecast for a 2.4% increase and the 3% rise in Q4.”
- Moreover, the consultancy expects consumption growth to remain close to that pace over the rest of the year as solid labor market conditions keep real disposable income growth strong, and the resilience of households' balance sheets means the saving rate rises only modestly.
| |
|
GLOBAL MACRO
WHAT DOES YOUR SCAN OF THE DATA BELOW TELL YOU? - THE MEDIA AVOIDS BAD NEWS!
We present the data in a way you can quickly see what is happening.
THIS WEEK WE SAW
Exp=Expectations, Rev=Revision, Prev=Previous
| |
|
UNITED STATES
- US CPI MM (Feb) 0.4% vs. Exp. 0.4% (Prev. 0.3%)
- US CPI YY NSA (Feb) 3.2% vs. Exp. 3.1% (Prev. 3.1%)
- US Core CPI MM (Feb) 0.4% vs. Exp. 0.3% (Prev. 0.4%)
- US Core CPI YY NSA (Feb) 3.8% vs. Exp. 3.7% (Prev. 3.9%)
- US Cleveland Fed CPI (Feb) 0.4% (Prev. 0.5%)
- US Retail Sales MM (Feb) 0.6% vs. Exp. 0.8% (Prev. -0.8%, Rev. -1.1%)
- US PPI Final Demand MM (Feb) 0.6% vs. Exp. 0.3% (Prev. 0.3%)
- US PPI Final Demand YY (Feb) 1.6% vs. Exp. 1.1% (Prev. 0.9%, Rev. 1.0%)
- US PPI ex-Food/Energy MM (Feb) 0.3% vs. Exp. 0.2% (Prev. 0.5%)
- US PPI ex-Food/Energy YY (Feb) 2.0% vs. Exp. 1.9% (Prev. 2.0%)
- US Initial Jobless Claims 209k vs. Exp. 218k (Prev. 217k, Rev. 210k)
- US Continued Jobless Claims 1.81M vs. Exp. 1.90M (Prev. 1.91M, Rev. 1.79M)
CHINA
- Chinese CPI MM (Feb) 1.0% vs. Exp. 0.7% (Prev. 0.3%)
- Chinese CPI YY (Feb) 0.7% vs. Exp. 0.3% (Prev. -0.8%)
- Chinese PPI YY (Feb) -2.7% vs. Exp. -2.5% (Prev. -2.5%)
- Chinese House Prices YY (Feb) -1.4% (Prev. -0.7%)
- Chinese House Prices YY (Feb) -1.4% (Prev. -0.7%).
- Chinese M2 Money Supply (Feb): 8.7% Y/Y (exp. 8.8%); New Yuan Loans (CNY) 1.56tln (exp. 1.55tln).
JAPAN
- Japanese Corporate Goods Prices MM (Feb) 0.2% vs. Exp. 0.1% (Prev. 0.0%)
- Japanese Corporate Goods Prices YY (Feb) 0.6% vs. Exp. 0.5% (Prev. 0.2%)
- Japanese GDP Revised QQ (Q4) 0.1% vs. Exp. 0.3% (Prev. -0.1%)
- Japanese GDP Revised Annualised (Q4) 0.4% vs. Exp. 1.1% (Prev. -0.4%)
UK
- UK Employment Change (Jan) -21k (Prev. 72k)
- UK ILO Unemployment Rate (Jan) 3.9% vs. Exp. 3.8% (Prev. 3.8%)
- UK Claimant Count Unemployment Change (Feb) 16.8k (Prev. 14.1k, Rev. 3.1k)
- UK Average Earnings (Ex-Bonus)(Jan) 6.1% vs. Exp. 6.2% (Prev. 6.2%)
- UK Average Week Earnings 3M YY (Jan) 5.6% vs. Exp. 5.7% (Prev. 5.8%)
- UK GDP Estimate MM (Jan) 0.20% vs. Exp. 0.20% (Prev. -0.10%)
- UK GDP Estimate YY (Jan) -0.30% vs. Exp. -0.30% (Prev. 0.00%)
- UK GDP Est 3M/3M (Jan) -0.10% vs. Exp. -0.10% (Prev. -0.30%)
- UK Manufacturing Output MM (Jan) 0.0% vs. Exp. 0.0% (Prev. 0.8%)
- UK Manufacturing Output YY (Jan) 2.0% vs. Exp. 2.0% (Prev. 2.3%)
- UK Industrial Output MM (Jan) -0.2% vs Exp. 0.0% (Prev. 0.6%)
- UK Industrial Output YY (Jan) 0.5% vs. Exp. 0.7% (Prev. 0.6%)
- UK Services MM (Jan) 0.20% vs. Exp. 0.20% (Prev. -0.10%)
- UK Services YY (Jan) -0.50% vs. Exp. -0.50% (Prev. 0.10%)
- UK RICS Housing Survey (Feb) -10.0 vs. Exp. -11.0 (Prev. -18.0)
AUSTRALIA
- Australian NAB Business Conditions (Feb) 10.0 (Prev. 6.0, Rev. 7.0)
- Australian NAB Business Confidence (Feb) 0.0 (Prev. 1.0)
| |  |
|
EU
- EU Industrial Production MM (Jan) -3.2% vs. Exp. -1.5% (Prev. 2.6%, Rev. 1.6%)
- EU Industrial Production YY (Jan) -6.7% vs. Exp. -2.9% (Prev. 1.2%, Rev. 0.2%)
GERMANY
- German HICP Final MM (Feb) 0.6% vs. Exp. 0.6% (Prev. 0.6%)
- German HICP Final YY (Feb) 2.7% vs. Exp. 2.7% (Prev. 2.7%)
- German CPI Final MM (Feb) 0.4% vs. Exp. 0.4% (Prev. 0.4%)
- German CPI Final YY (Feb) 2.5% vs. Exp. 2.5% (Prev. 2.5%)
- German Wholesale Price Index MM (Feb) -0.1% (Prev. 0.1%)
- German Wholesale Price Index YY (Feb) -3.0% (Prev. -2.7%)
FRANCE
- French Central Bank sees full-year 2024 growth at 0.8% (prev. 0.9%), 2025 at 1.5% (prev. 1.3%) and 2026 at 1.7% (prev. 1.6%), while it sees HICP inflation at 2.5% in 2024 and 1.7% in both 2025 and 2026
- French CPI (EU Norm) Final YY (Feb) 3.2% vs. Exp. 3.1% (Prev. 3.1%); CPI (EU Norm) Final MM (Feb) 0.9% vs. Exp. 0.9% (Prev. 0.9%)
ITALY
- Italian Consumer Prices Final YY (Feb) 0.8% vs. Exp. 0.8% (Prev. 0.8%); Consumer Prices Final MM (Feb) 0.1% vs. Exp. 0.1% (Prev. 0.1%)
- Italian Retail Sales SA MM (Jan) 1.0% (Prev. -0.1%); Retail Sales NSA YY (Jan) -0.1% (Prev. 0.3%)
INDIA
- Indian CPI Inflation YY (Feb) 5.09% vs. Exp. 5.02% (Prev. 5.10%)
- Indian Industrial Output YY (Jan) 3.8% vs. Exp. 4.1% (Prev. 3.8%)
- Indian Manufacturing Output (Jan) 3.2% (Prev. 3.9%)
- Indian WPI Inflation YY (Feb) 0.2% vs. Exp. 0.25% (Prev. 0.27%); WPI Food Articles YY (Feb) 6.95% (Prev. 6.85%); WPI Mfg Inflation (Feb) -1.27% (Prev. -1.13%); WPI Fuel YY (Feb) -1.59% (Prev. -0.51%); WPI Food Index (Feb) 4.09% (Prev. 3.79%)
- Indian Trade Def Govt -USD (Feb) 18.71B vs. Exp. 18.3B (Prev. 17.49B); Imports - USD (Feb) 60.11B (Prev. 54.41B); Exports - USD (Feb) 41.4B (Prev. 36.92B)
SWEDEN
- Swedish Money Mkt CPIF Infl 5 Yrs (Mar) 2.0% (Prev. 2.10%); Money Mkt CPIF Infl 1 Yr (Mar) 2.0% (Prev. 1.90%)
- Swedish CPIF Inflation 5 Years (Q1) 2.1% (Prev. 2.10%); CPIF Inflation 1 Year (Q1) 2.4% (Prev. 2.80%)
- Swedish Unemployment Rate SA (Feb) 8.0% vs. Exp. 8.3% (Prev. 8.2%); Unemployment Rate (Feb) 8.5% (Prev. 8.5%); Total Employment (Feb) 5.174M (Prev. 5.136M)
TURKEY
- Turkish End Year CPI Fcst/Cb Svy (Mar) 44.19% (Prev. 42.96%)
POLAND
- Polish CPI Final YY (Feb) 2.8% vs. Exp. 3.2% (Rev. 3.7%); CPI Final MM (Feb) 0.3% vs. Exp. 0.5%.
| |
CURRENT MARKET PERSPECTIVE | |
|
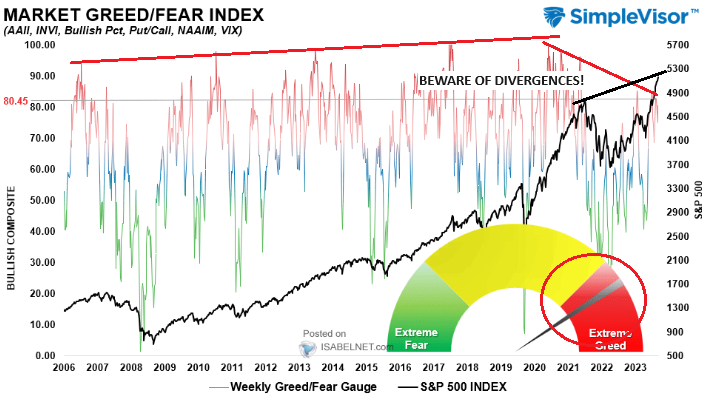
A QUADRUPLE WITCH
ON THE "IDES OF MARCH"
WE SEE MARKET DIVERGENCES EVERYWHERE??
Click All Charts to Enlarge
| |
|
1 - SITUATIONAL ANALYSIS
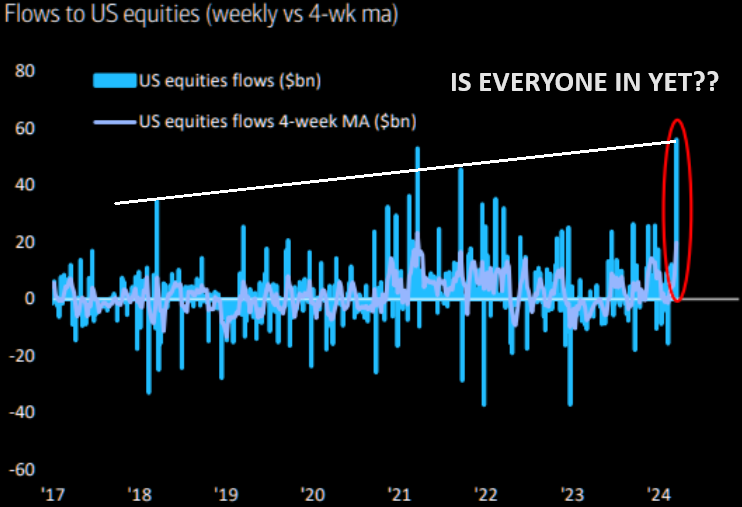
It was an ugly week on the macro side with hotter than expected inflation coming from the PPI, slower than expected growth, weaker than expected labor market data and noticeable volatility in Gold and Bitcoin/Cryptos.
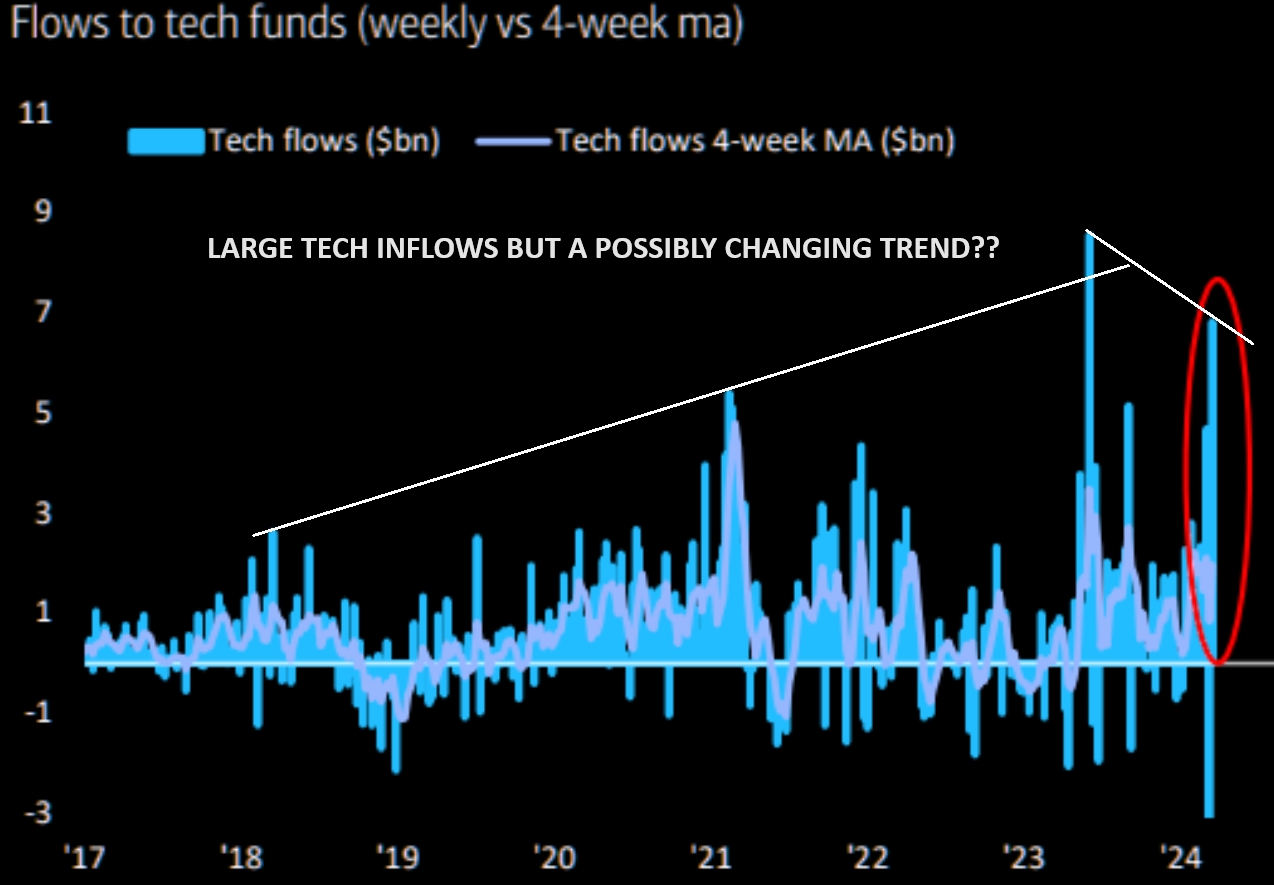
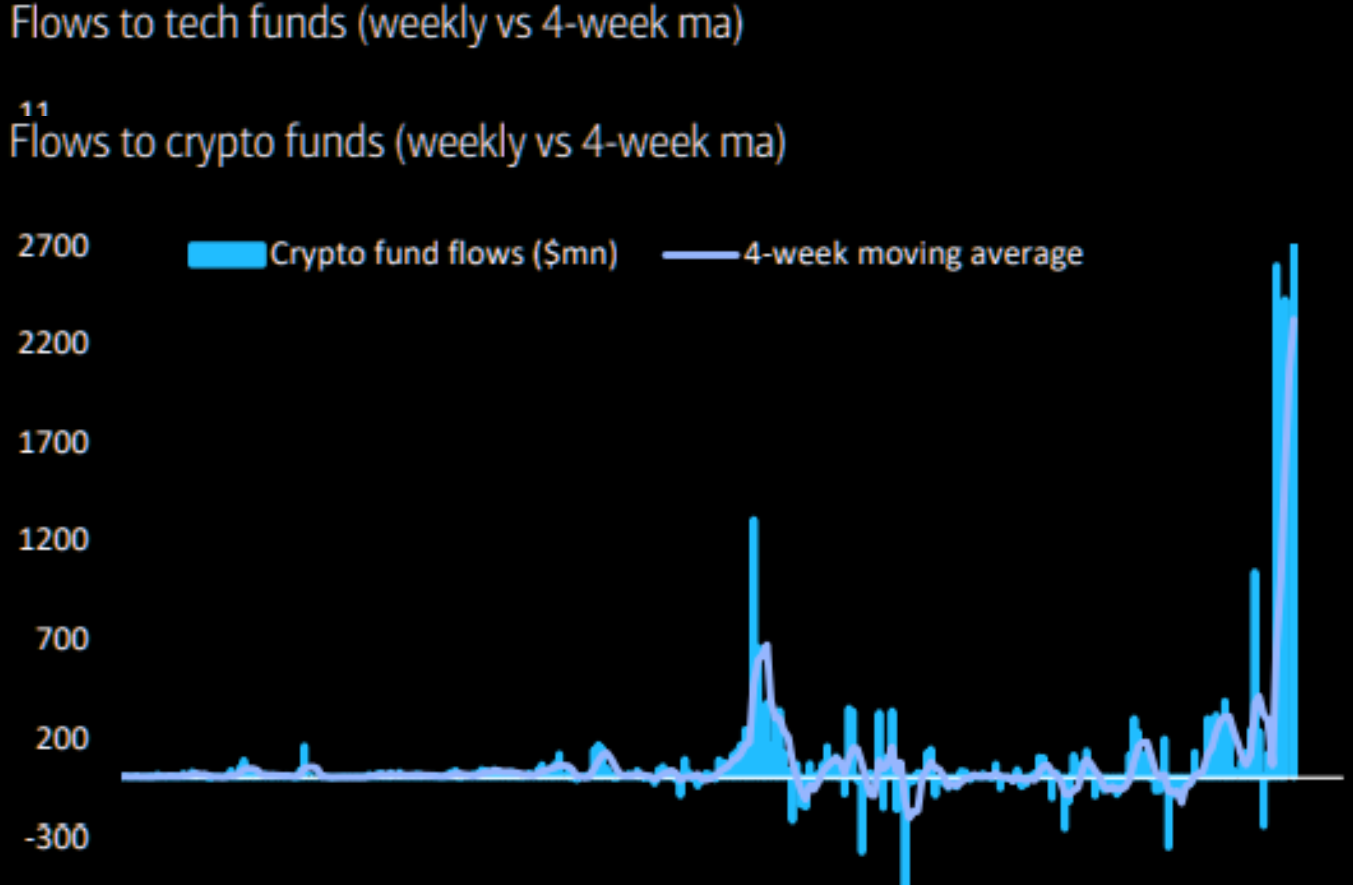
This comes on prior week reporting of massive flow volumes into US equities (chart top right). However we were already seeing weakening in the Tech flows (chart right bottom), which carried forward into this week with weakening prices.
| |
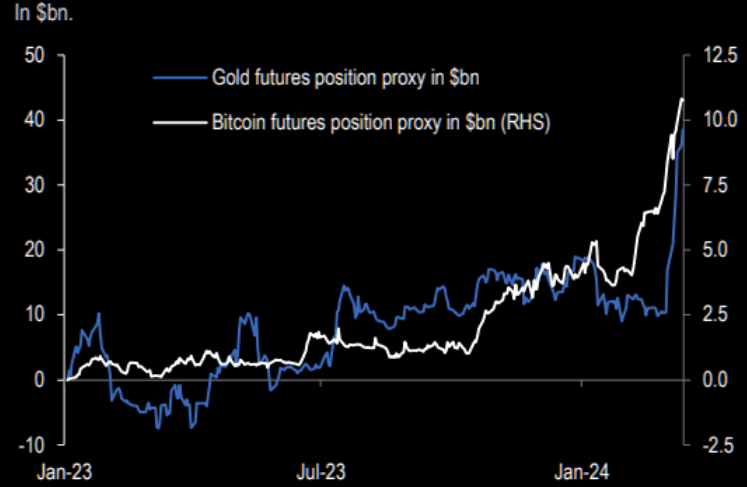
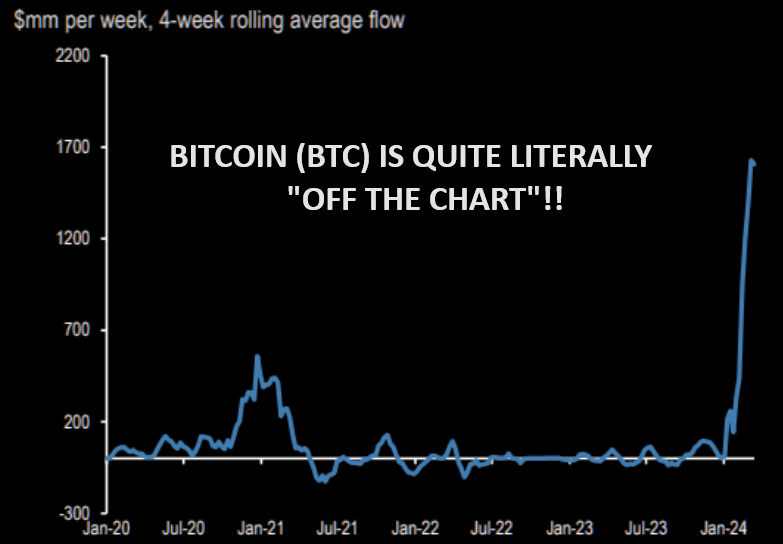
CHART BELOW - GOLD & BITCOIN
JPM futures positioning proxy in BTC and gold indicates momentum chasers are "all in". This could get "nasty" should we reverse lower in a more serious way. Private investors seem to be supporting both gold and bitcoin. Speculative institutional investors like hedge funds and CTAs have also been active in both markets.
| |
|
MicroStrategy has bought more than $1bn of bitcoin YTD after more than $1bn of purchases in Q4 2023. We believe debt-funded bitcoin purchases by MicroStrategy add leverage and froth to the current crypto rally and raise the risk. | | |
Despite big net inflows this week Bitcoin ended the week only marginally higher (up around 3%), with choppy moves (day-session dips bought overnight), but ended back above $70,000. | | |
|
2 - FUNDAMENTAL ANALYSIS
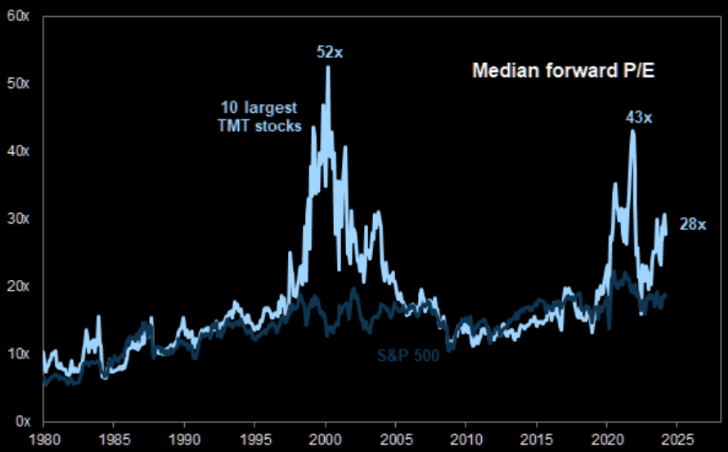
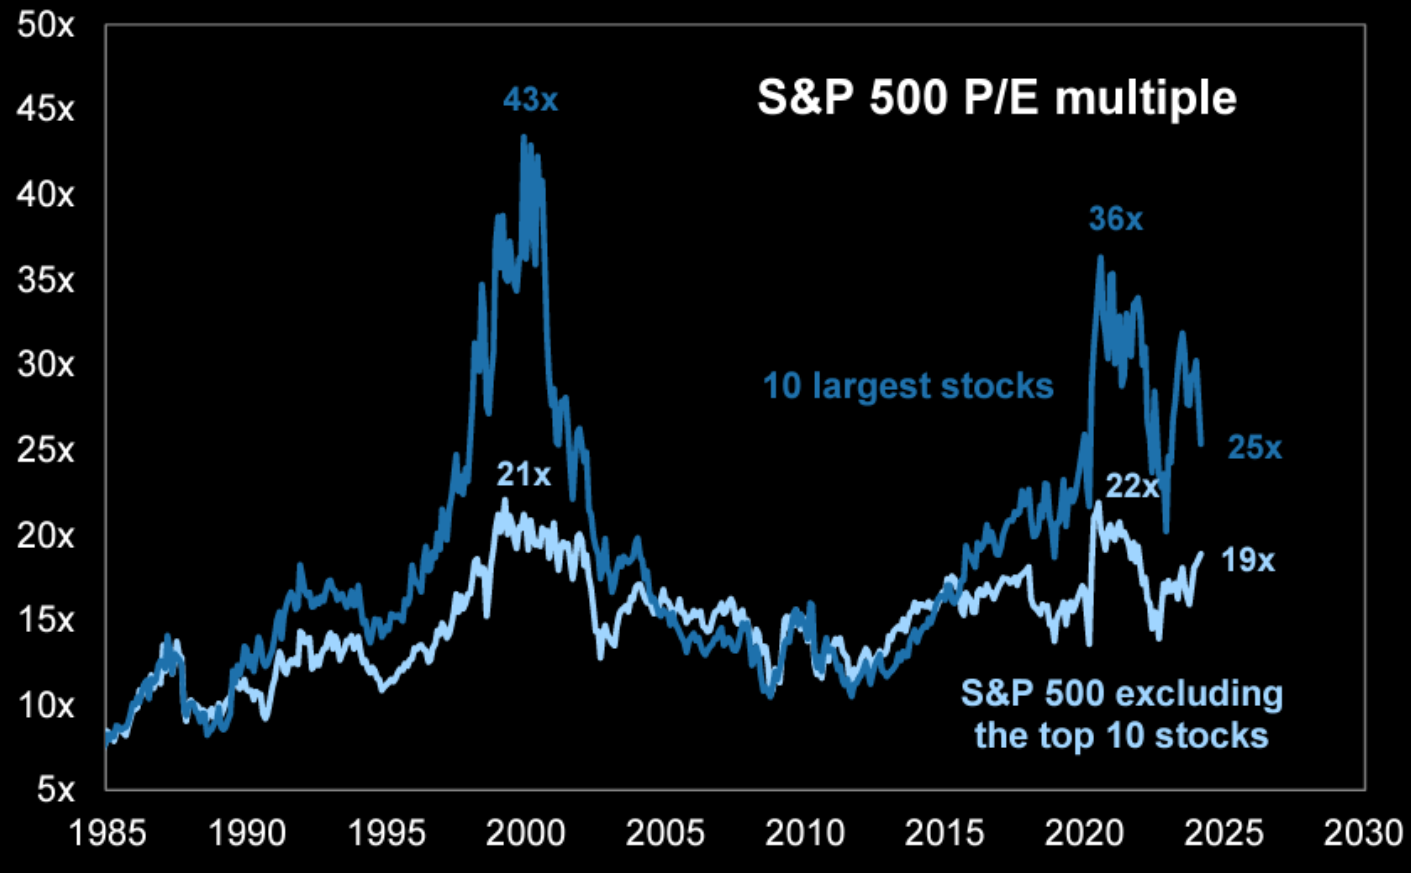
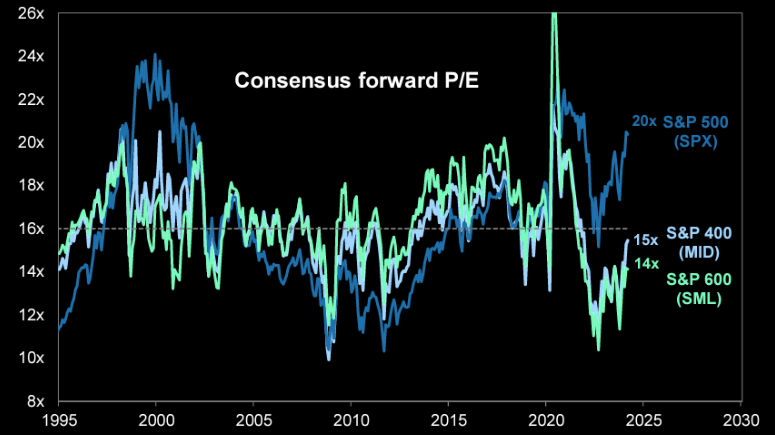
THIS IS NO VALUATION BUBBLE
PE Multiples are not outrageously out of line (chart right top).
Valuation of small-caps and mid-caps remain below historical averages (chart right bottom).
Valuation of largest TMT stocks today pales in comparison to the Tech Bubble (chart below).
| |
|
|
3 - TECHNICAL ANALYSIS
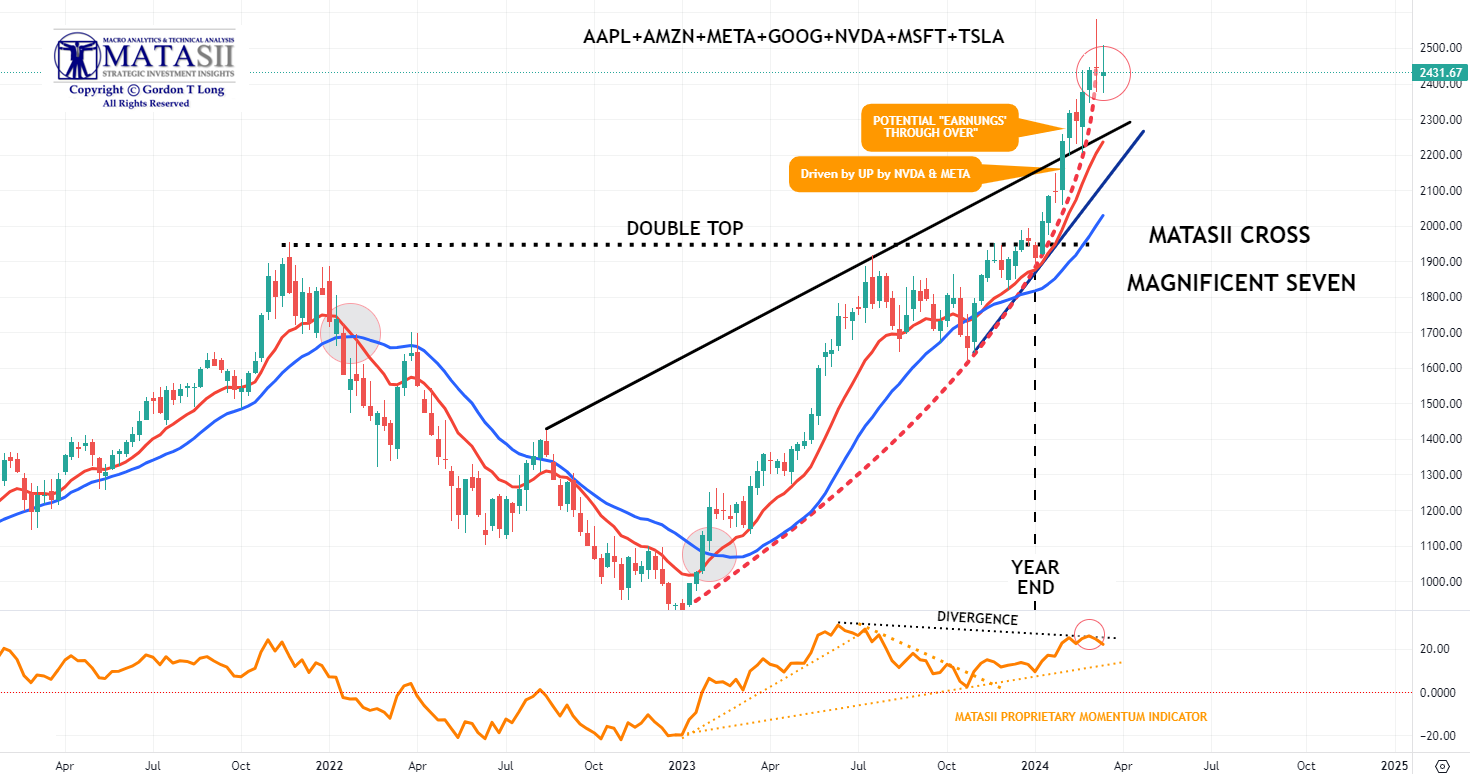
MAGNIFICENT SEVEN -- Weakening!
| |
YOUR DESKTOP / TABLET / PHONE ANNOTATED CHART
Macro Analytics Chart Above: SUBSCRIBER LINK
| |
BOND MARKET
CONTROL PACKAGE
There are FIVE charts we have outlined in prior chart packages that we will continue to watch closely as a "control set".
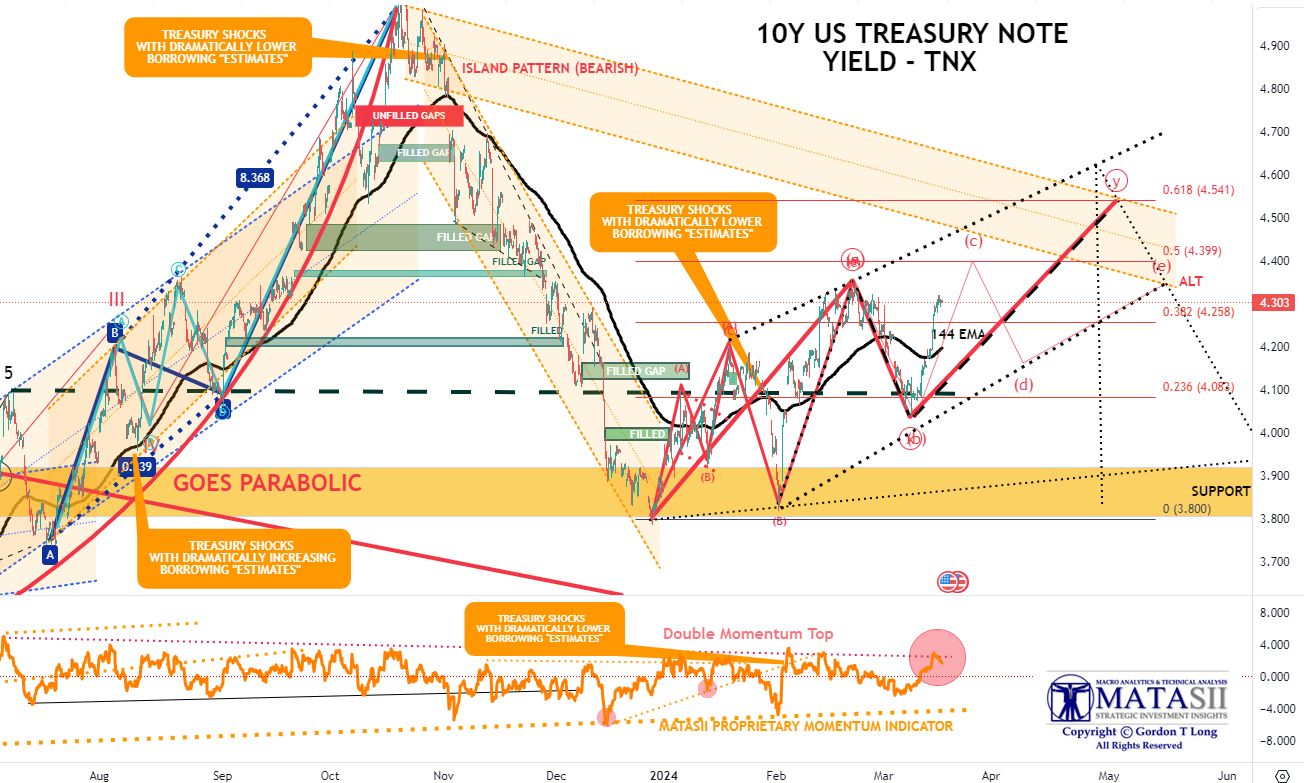
- The 10Y TREASURY NOTE YIELD - TNX - HOURLY (CHART LINK)
- The 10Y TREASURY NOTE YIELD - TNX - DAILY (CHART LINK)
- The 10Y TREASURY NOTE YIELD - TNX - WEEKLY (CHART LINK)
- The 30Y TREASURY BOND YIELD - TNX - WEEKLY (CHART LINK)
- REAL RATES (CHART LINK)
FISHER'S EQUATION = 10Y Yield = 10Y INFLATION BE% +REAL % = 2.326% + 1.991% = 4.317%
As rate-cut expectations fell from 6 this year to 3, Treasury yields rose... non-stop... all week with the belly of the curve underperforming (5Y yields up 28bps on the week). Yields all ended back up near their year-to-date highs...
| |
|
YOUR DESKTOP / TABLET / PHONE ANNOTATED CHART
Macro Analytics Chart Above: SUBSCRIBER LINK
| |
US EQUITY MARKETS
CONTROL PACKAGE
There are FIVE charts we have outlined in prior chart packages that we will continue to watch closely as a "control set".
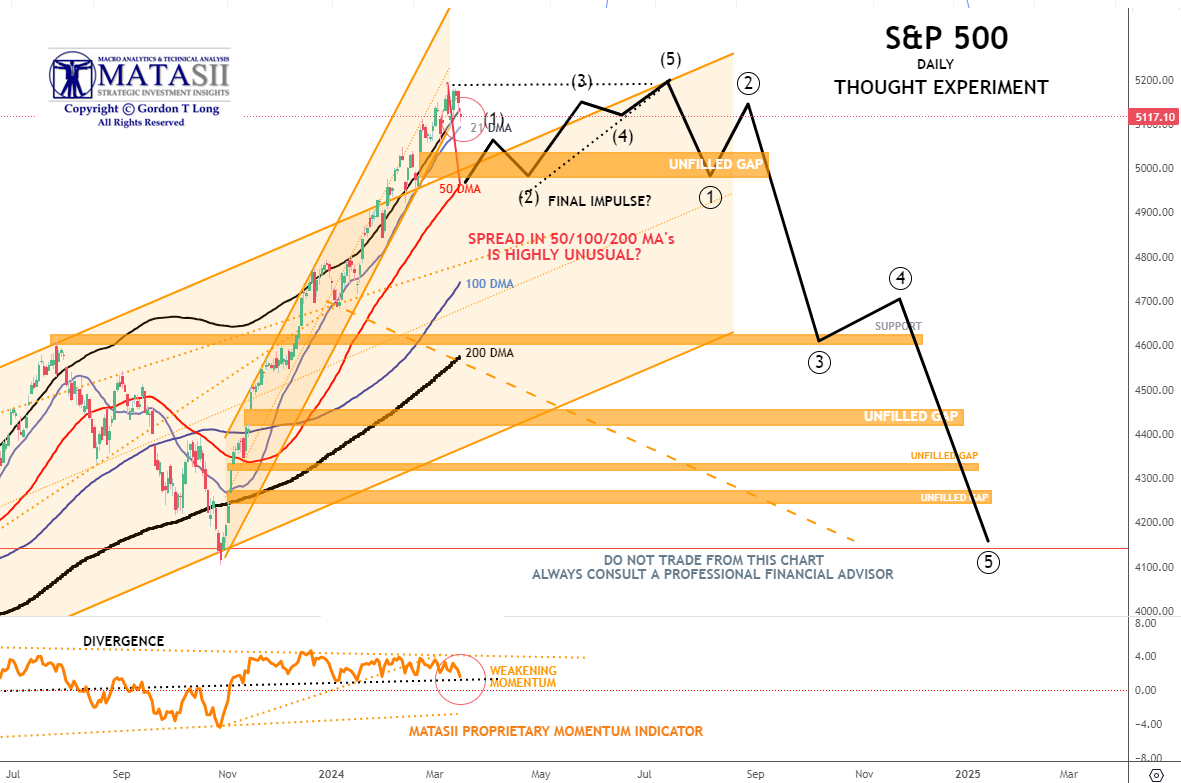
- The S&P 500 (CHART LINK)
- The DJIA (CHART LINK)
- The Russell 2000 through the IWM ETF (CHART LINK),
- The MAGNIFICENT SEVEN (CHART ABOVE WITH MATASII CROSS - LINK)
- Nvidia (NVDA) (CHART LINK)
S&P 500 - Daily - Our Though Experiment
Our Though Experiment, which we have discussed previously, suggests we have put in a near term top (or very close to it) and will now consolidate before possibly completing one final small impulse higher or put in a 1-2 Wave of a one higher degree.
NOTE: To reiterate what I previously wrote - "the black labeled activity shown below, between now and July, looks like a "Killing Field" where the algos take Day Traders, "Dip Buyers", "Gamma Guys" and FOMO's all out on stretchers!"
| |
YOUR DESKTOP / TABLET / PHONE ANNOTATED CHART
Macro Analytics Chart Above: SUBSCRIBER LINK
| |
STOCK MONITOR: What We Spotted
|  | |
NOTICE Information on these pages contains forward-looking statements that involve risks and uncertainties. Markets and instruments profiled on this page are for informational purposes only and should not in any way come across as a recommendation to buy or sell in these assets. You should do your own thorough research before making any investment decisions. MATASII.com does not in any way guarantee that this information is free from mistakes, errors, or material misstatements. It also does not guarantee that this information is of a timely nature. Investing in Open Markets involves a great deal of risk, including the loss of all or a portion of your investment, as well as emotional distress. All risks, losses and costs associated with investing, including total loss of principal, are your responsibility.
FAIR USE NOTICE This site contains copyrighted material the use of which has not always been specifically authorized by the copyright owner. We are making such material available in our efforts to advance understanding of environmental, political, human rights, economic, democracy, scientific, and social justice issues, etc. We believe this constitutes a ‘fair use’ of any such copyrighted material as provided for in section 107 of the US Copyright Law. In accordance with Title 17 U.S.C. Section 107, the material on this site is distributed without profit to those who have expressed a prior interest in receiving the included information for research and educational purposes. If you wish to use copyrighted material from this site for purposes of your own that go beyond ‘fair use’, you must obtain permission from the copyright owner.
========
| |
MATASII'S STRATEGIC INVESTMENT INSIGHTS | |
2020 VIDEOS OUTLINING THE COMING RISE IN INFLATION, STAGLFLATION & COMMODITY PRICES | |
IDENTIFICATION OF HIGH PROBABILITY TARGET ZONES | |
Learn the HPTZ Methodology!
Identify areas of High Probability for market movements
Set up your charts with accurate Market Road Maps
Available at Amazon.com
| |
The Most Insightful Macro Analytics On The Web | | | | |