|
LONGWave - JULY 2024
Technical Analysis - 08/11/24
| |
THE JAPANESE CARRY TRADE AS A PILLAR OF GLOBAL CREDIT MAY BE ENDING!
OBSERVATIONS: KAMALA HARRIS IS TALKING TOO FAST & LOOSE WITH THE FACTS
Watching Vice President Kamala Harris talk about her economic record would make even Pinocchio blush. With a straight face, the presumptive Democratic presidential nominee has claimed the Heritage Foundation’s Project 2025 would weaken middle-class America. Of course, she offered no specifics to support her claim, nor any evidence to defend her own record.
So here are the facts (not mistaken claims) about how the middle class has fared while Harris helped (mis)manage the nation’s economy.
-
Annual inflation went from 1.4% in January 2021 to over 9% in June 2022.
- Just 1 1/2 years after the Biden administration took power and began implementing its radical agenda, prices were rising about as much in a single month as they did in the entire year before Harris was sworn in as vice president.
- Inflation has far outpaced wage growth.
-
The average person can buy much less today than in January 2021, despite having a much larger paycheck. For the typical family, this has amounted to a loss of $4,000 in annual purchasing power.
- The impetus behind Inflation has been unprecedented overspending by the government, which Harris not only helped oversee but for which she also repeatedly advocated over the last 3 1/2 years.
- Since Harris took office, the federal debt has exploded by over $7 trillion.
-
The Treasury has burned through about another $1 trillion in cash reserves, for a total cumulative deficit of over $8 trillion. By January 2025, that number will breach $9 trillion, according to her own administration’s estimates.
- The Treasury’s unparalleled need to borrow money has pushed up interest rates, including for the $35 trillion federal debt.
-
Taxpayers are now shelling out an annualized $1.6 trillion just to finance the burgeoning debt.
-
The Treasury paid $140 billion in June just for interest on the debt. That was over 75% of all the personal income taxes collected that month. Harris has helped oversee the worst deterioration of federal finances since at least World War II.
- Family finances are now being crushed by higher interest rates, hitting everything from mortgages to credit cards.
- With home prices and interest rates launching higher, the nation has been thrown into a housing affordability crisis.
-
The monthly mortgage payment on a median-priced home has more than doubled since Harris took office, rising over 115%. That’s an extra $14,000 per year for the same house.
-
People are also drowning in $1.1 trillion of credit card debt, even as the average interest rate on those outstanding balances is near a record high.
- Families are now paying $240 billion annually just in credit card interest, without putting a dime toward principal.
| |
 | |
THIS WEEK WE SAW
Exp=Expectations, Rev=Revision, Prev=Previous
US
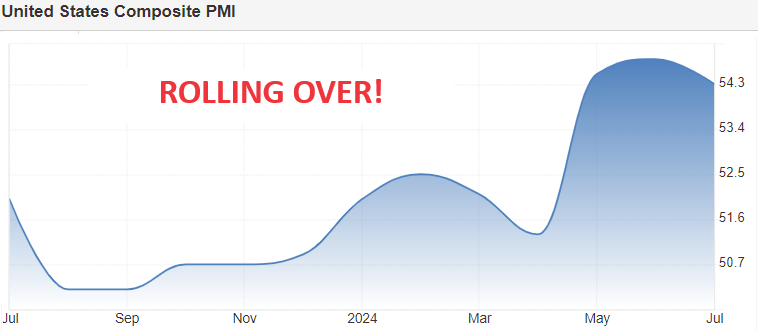
US S&P Global Services PMI Final (Jul) 55.0 (Prev. 56.0)
US S&P Global Comp Final PMI (Jul) 54.3 (Prev.
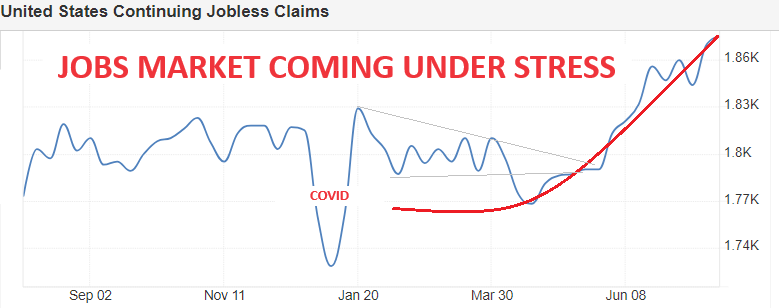
US Continued Jobless Claims w/e 1.875M vs. Exp. 1.87M (Prev. 1.877M, Rev. 1.869M)
US Wholesale Sales MM (Jun) -0.6% vs. Exp. 0.3% (Prev. 0.4%, Rev. 0.3%)
These are just some of the reasons people widely disapprove of the current administration’s handling of the economy. Families can’t make it from paycheck to paycheck with today’s stratospheric cost of living. They’re going into debt and depleting their savings just to make ends meet. In fact, the national savings rate is now less than half what it was before the pandemic.
Harris refuses to take any accountability for her role in this disaster. Worse, she claims that a conservative agenda would do precisely what her agenda has already done: eviscerate middle-class finances.
- Far from hollowing out the middle class, conservatives aim to hollow out the unelected government bureaucracy that has morphed into a fourth branch of government, actively subverting the other three.
- Instead of more spending and borrowing by the government, conservatives want this largess reined in and inflation ended.
Conversely, Harris was one of just 13 senators who voted against Federal Reserve Chairman Jerome Powell, because she thought he was too tough on inflation—the same Powell who let inflation hit 40-year highs before raising interest rates above 1%.
Harris is an arsonist playing firefighter, simultaneously pushing for more government spending and taxes on the middle class while claiming conservatives are the ones to blame for her failures. People would be wise to remember who set the inflationary fire that burned their finances to ash.
H/T AJ ANTONI
| |
========================= | |
|
WHAT YOU NEED TO KNOW!
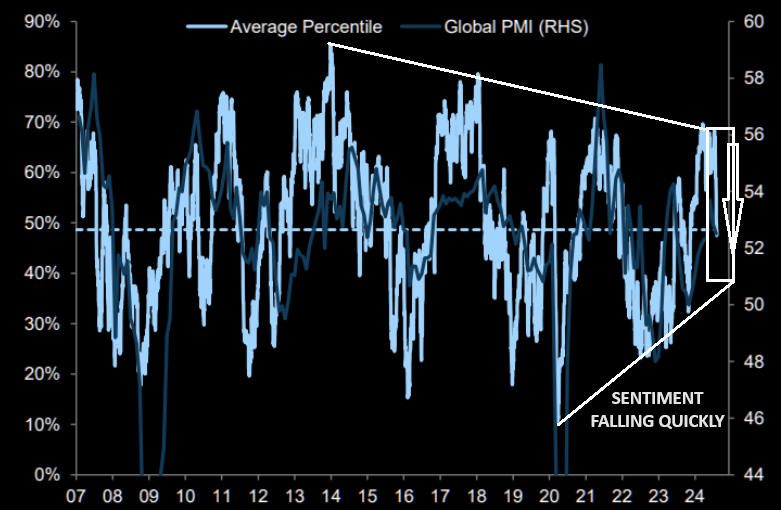
COMMODITIES SENDING A MESSAGE
The carnage in commodities continues to send warning messages. With spot commodity prices one-percent away from three year lows, it's not a message of a 'soft landing'.
RESEARCH
THE JAPANESE CARRY TRADE - The MATASII Cross Can Be A Guide
- The Yen/ $USD pair has ripped 12% higher.
- This, combined with the higher interest rate on the Yen, (the BoJ raised rates from 0.1% to 2.5% last week), is blowing up hundreds of billions of dollars’ worth of the Yen carry trade.
- When a carry trade blows up, investors are forced to panic liquidate their holdings. That is why the market melted down over the last few weeks contributing to companies like Apple and Nvidia collapsing in share price.
FOOD - Policies For Planned Scarcities?
- The EU, under the control of what I will call the "Davos Crowd" (i.e. global elite), appears to be systematically crushing agriculture through its policies. Unfortunately, this is happening not only in Europe but also across the wider West.
- NORMAL LEADERS WOULD NOT DO THIS??
- Behind it you sense left-liberal and globalist aspirations. This is what they believe, and it is now manifested in the fact that global warming is increasing in a devastating way, that the earth’s climate is becoming unbearable. But they believe that this is due to one single cause: human activity, mainly and decisively anthropogenic carbon dioxide emissions.
| |
|
DEVELOPMENTS TO WATCH
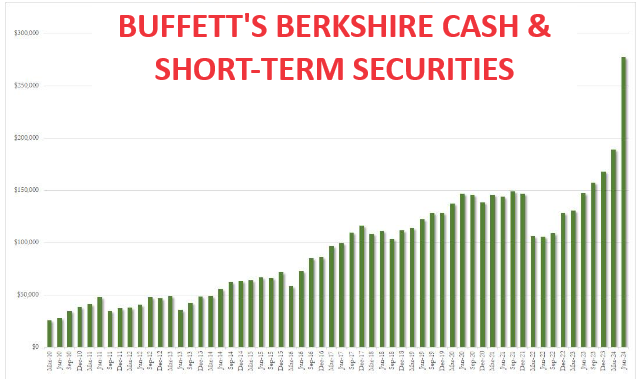
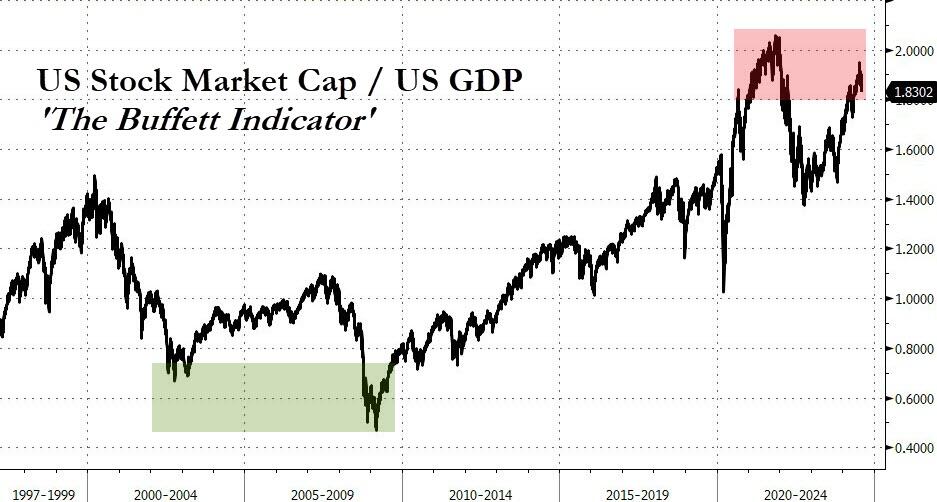
THE BUFFETT INDICATOR - Preparing For Lower Prices
- Buffett quietly dumped half of Berkshire's Apple shares in the second quarter in addition to 90M Bank of America shares.
- This increased the company's cash pile by a record $88 billion to an all-time high of $277 billion at the end of last quarter.
CHINA - Don't Take Your Eye Off New Developments
- The strategy is designed to bolster national self-sufficiency and resilience against external shocks, and ultimately allow the nation to withstand ‘extreme situations’ including protracted armed conflict.
| |
|
GLOBAL ECONOMIC REPORTING
CONTINUOUS JOBLESS CLAIMS
- This was the highest since November 2021 and above market expectations of 1,870,000.
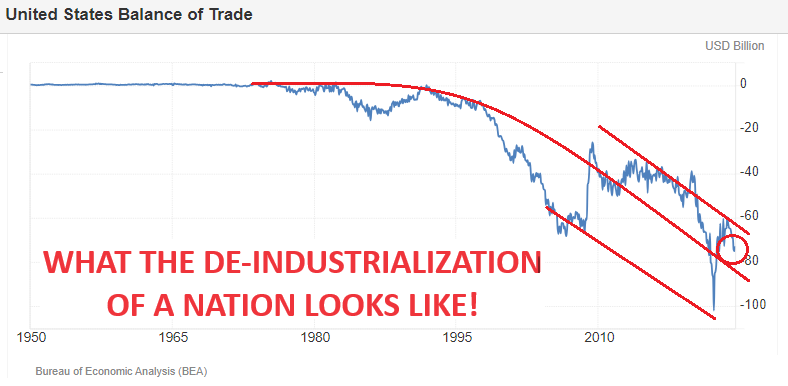
US INTERNATIONAL BALANCE OF TRADE
- The trade deficit in the US narrowed to $73.1 billion in June of 2024 from the revised 20-month high of $75 billion in the previous month, but above market expectations of a $72.5 billion trade gap.
GLOBAL PMI & ISM MANUFACTURING
- The S&P Global US Composite PMI was revised lower to 54.3 in July 2024, from the preliminary estimate of 55 and a slight decrease from June's 54.8.
- The S&P Global US Services PMI was revised lower to 55 in July 2024 from a preliminary of 56, compared to 55.3 in June.
- ISM Manufacturing PMI rose back into the expansionary territory at 51.4, above the expected 51.0, and the prior 48.8.
| |
|
In this week's "Current Market Perspectives", we focus on the signals that Sentiment, Fundamentals and various market Segments (Credit, Bond and Equity) are currently giving us.
=========
| |
|
1- THE JAPANESE CARRY TRADE
| |
If you have not already reviewed last week's LONGWave video on the Japanese Carry Trade, we strongly suggest you do. | |  |
This is an excellent introduction to understanding the Japanese Carry Trade. | | |
|
SITUATIONAL ANALYSIS
If you’re unfamiliar with a carry trade, it consists of borrowing money in a depreciating currency at a low interest rate to invest in other assets or to invest in an appreciating currency offering higher payout yields.
The Fed first introduced Zero Interest Rate Policy (ZIRP) and Quantitative Easing (QE) in 2008.
- Japan’s central bank, the Bank of Japan (BoJ) introduced ZIRP in 1999 and QE in 2001, respectively.
- Over the course of the last 20+ years, the BoJ has engaged in a slow-motion nationalization of Japan’s financial system.
-
The BOJ now owns over 50% of all Japanese Government bonds.
- The BOJ is the single largest shareholder of Japanese stocks in the world.
All of this worked relatively well until inflation entered the financial system in 2020-2021 and the BoJ refused to address the situation.
- The Fed and the European Central Bank (ECB) started raising rates and shrinking their balance sheets in early/ mid-2022.
- The BoJ only started tightening monetary policy in 2023. And it finally started raising rates at the end of July (as in a week ago).
-
Japan become the grandfather of monetary insanity.
- The Japanese Yen has been in a free-fall for the last four years as the BoJ refused to tighten monetary policy while every other major central bank was raising rates and draining liquidity. Indeed, going into the BoJ’s rate hike decision a week ago, the Yen was trading at levels not seen since the late 1980s.
- The current mini-crisis was triggered by the BoJ raising rates for the first time since 2007, which in turn, blew up the Yen carry trade.
SOMETHING BROKE
Once the BoJ started talking about raising rates, the Yen started moving higher. Last week, when the BoJ actually raised rates, the Yen EXPLODED higher. This is a globally systemic issue because the Yen is one of the largest carry trades in the world.
It is estimated that the Japanese Carry Trade involves:
- Over $20T in Global Japanese Carry
- Over $3.5T in US Japanese Carry
- Over $1.3T in the purchase of US Treasuries
Since the Yen has been yielding more or less ZERO for the last 20+ years, hedge funds and other institutional investors have been borrowing hundreds of billions of dollars’ worth of Yen to invest in other assets with EXTREME leverage. The problem with this is that leverage works both positively and negatively.
- Imagine you have $1 million to invest and you borrow $10 million in Yen at 0.1%.
- Your annual interest payments on the Yen are ~$10,000.
- Meanwhile, you invest that $10 million in stocks, which then rally 10%.
- You’ve just made $1.1 million in profits (10% of your $11 million). And since your actual capital is just $1 million, you’ve more than doubled your money with this trade courtesy of leverage.
- However, this process ALSO works to the downside when things go wrong. If the currency you are borrowing in (the Yen) skyrockets relative to the currency in which the assets you are buying are denominated (the $USD), your trade will BLOW up quite badly.
In the last month:
- The Yen/ $USD pair has ripped 12% higher.
- This, combined with the higher interest rate on the Yen, (the BoJ raised rates from 0.1% to 2.5% last week), is BLOWING UP hundreds of billions of dollars’ worth of the Yen carry trade.
- When a carry trade blows up, investors are forced to panic liquidate their holdings. That is why the market melted down over the last few weeks with companies like Apple and Nvidia collapsing in share price despite being OBSCENELY profitable.
CURRENT SITUATIONAL
The BoJ announced a previously unscheduled meeting on Tuesday with Japan’s Ministry of Finance and its Financial Services Agency. This was a signal to the markets that an intervention of sorts was coming. Soon after that, the deputy head of the BoJ, Shinichi Uchida, announced that the BoJ won’t “raise rates if the markets are unstable.” This is akin to the BoJ telling the markets, “we got the message and are standing down.”
The big question now is if the lows are in… or is another round of selling coming? Put another way, was this simply a correction in the context of a bull market… or is a legitimate crash/ bear market is about to unfold?
One the one hand, corrections are common events in which you should “buy the dip.” But on the other hand, once every 10 years or so, a REAL crash/ bear market will hit that will wipe out years’ worth of gains!
So obviously, investors need a tool for determining whether stocks are simply correcting in the context of a bull market… or if a legitimate crash/ bear market is about to unfold.
We at MATASII have developed a tool that takes ALL of the guessing work out of this problem. It is called the MATASII CROSS and we use it regularly in our bi-weekly Market Perspectives Newsletter.
| |
YOU NEED THE INDIVIDUAL PROPRIETARY MATASII CROSS BUY/SELL SIGNALS
TO HELP SORT IT OUT.
REMEMBER: THE CARRY TRADE (Credit Leverage) and REAL 10Y YIELDS ARE A DRIVER OF
US EQUITY DIRECTION
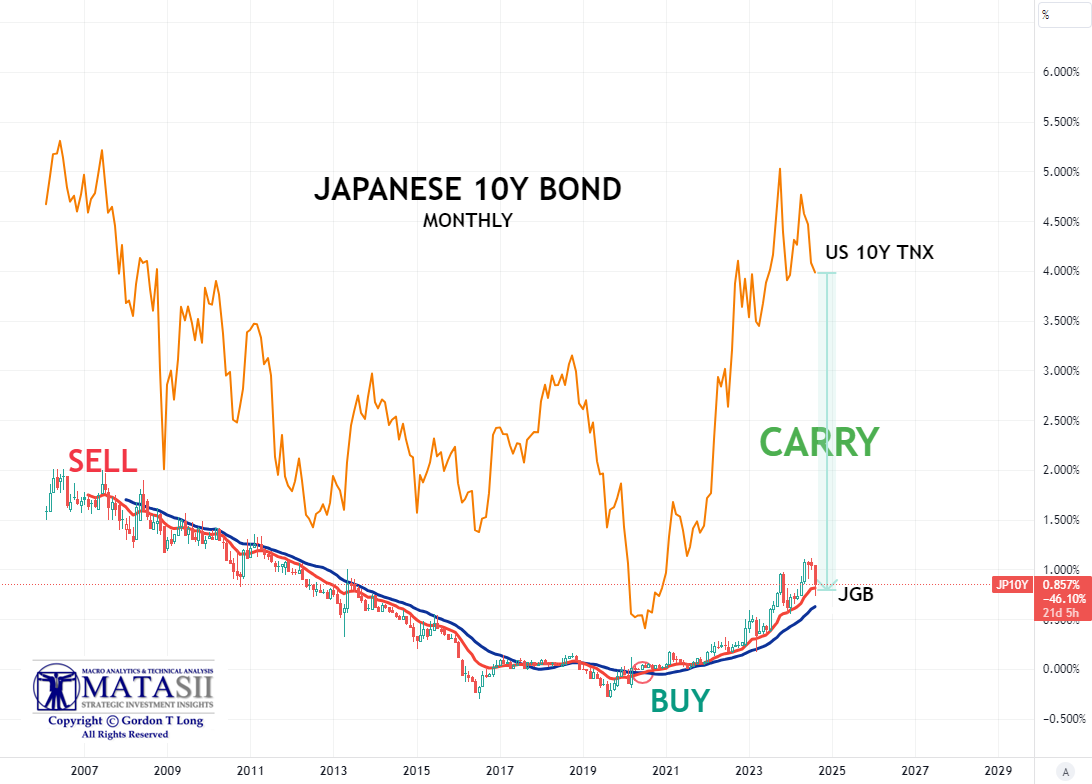
1- JAPANESE 10Y GOVERNMENT BONDS v US SPREAD -- w/ MATASII CROSS
The larger the Spread the more attractive the Carry IF
1-Yen is Weakening
2-Target Currency is strong
3- Hedging Costs are reasonable
| |
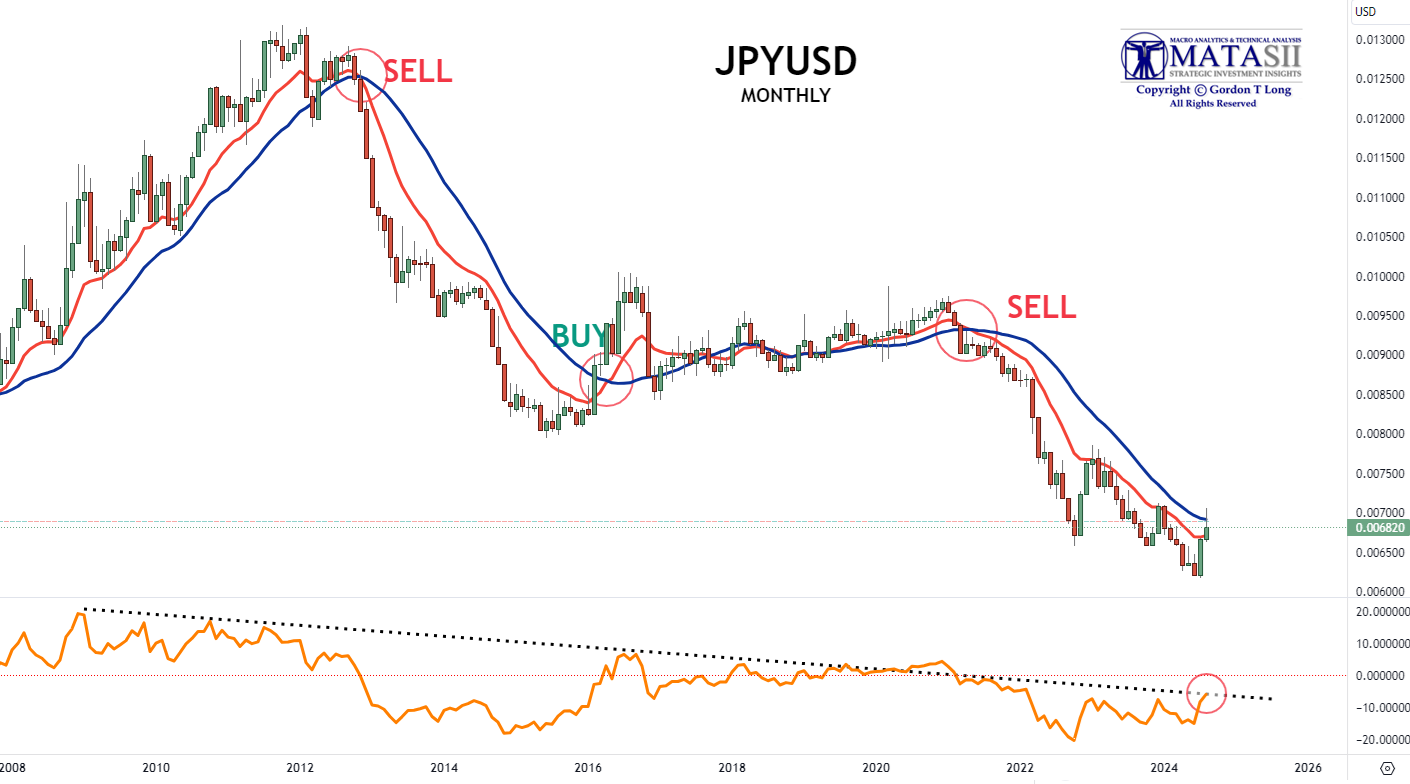
2a- JPYUSD - Monthly -- w/ MATASII CROSS
The Yen has been weakening BUY recently showing surging strength! Still on a Monthly MATASII Cross SELL.
(NOTE: We run the Cross on Weekly, Daily and Hourly levels.)
| |
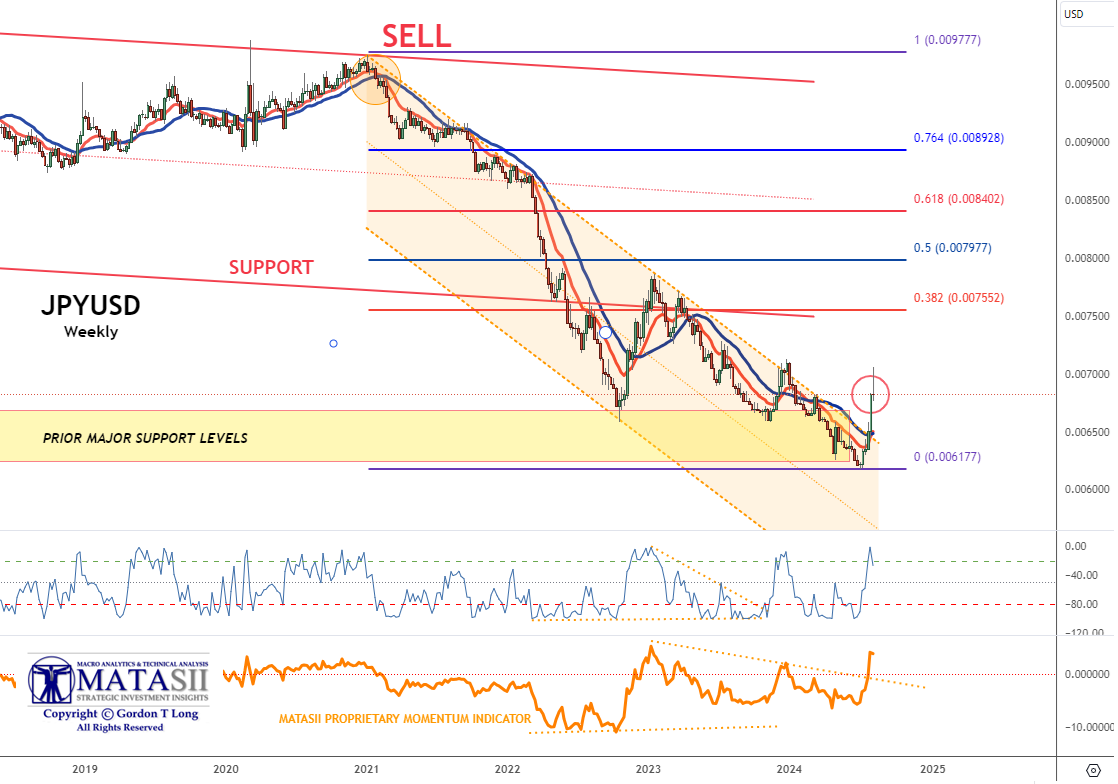
2b- JPYUSD - Weekly -- w/ MATASII CROSS
The Yen has been weakening BUY recently showing surging strength! Still on a Weekly MATASII Cross SELL.
(NOTE: We run the Cross on Weekly, Daily and Hourly levels.)
| |
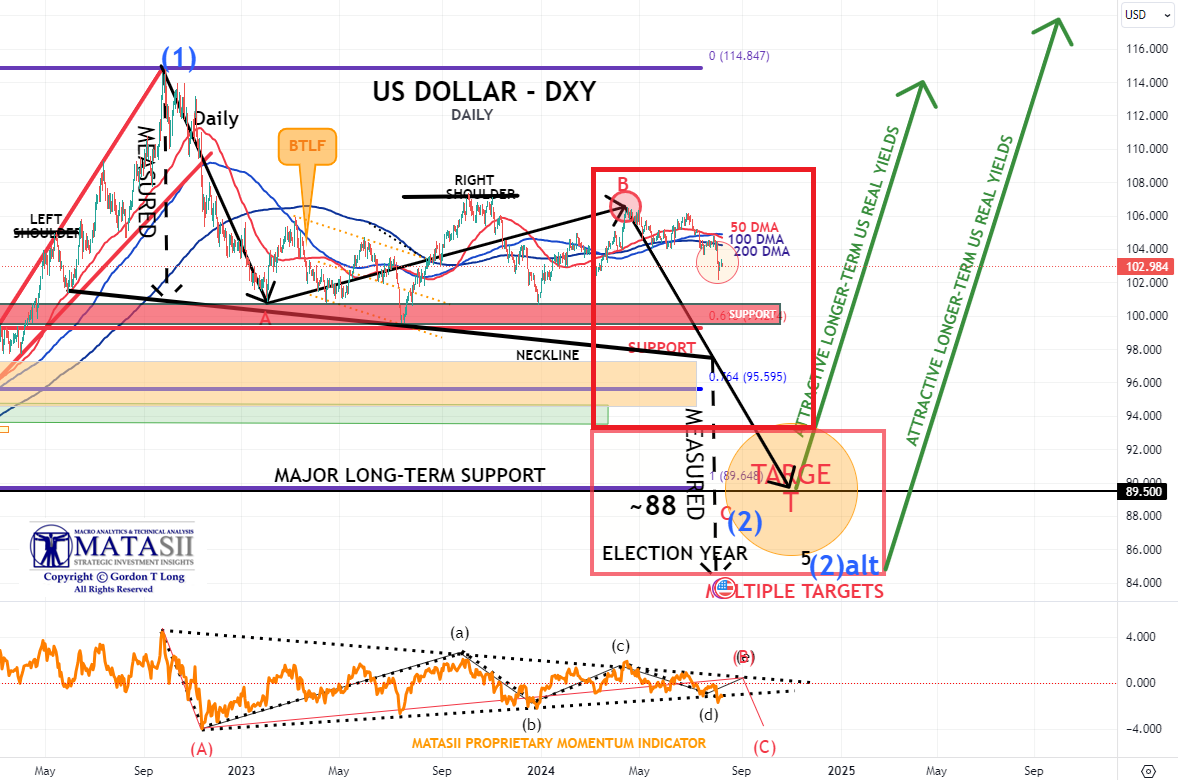
3- US DOLLAR AS THE TARGET CURRENCY - DXY - Weekly
The US Dollar (DXY) has begun to show weakness on a trade weighted basis (DXY) as the YEN surges.
| |
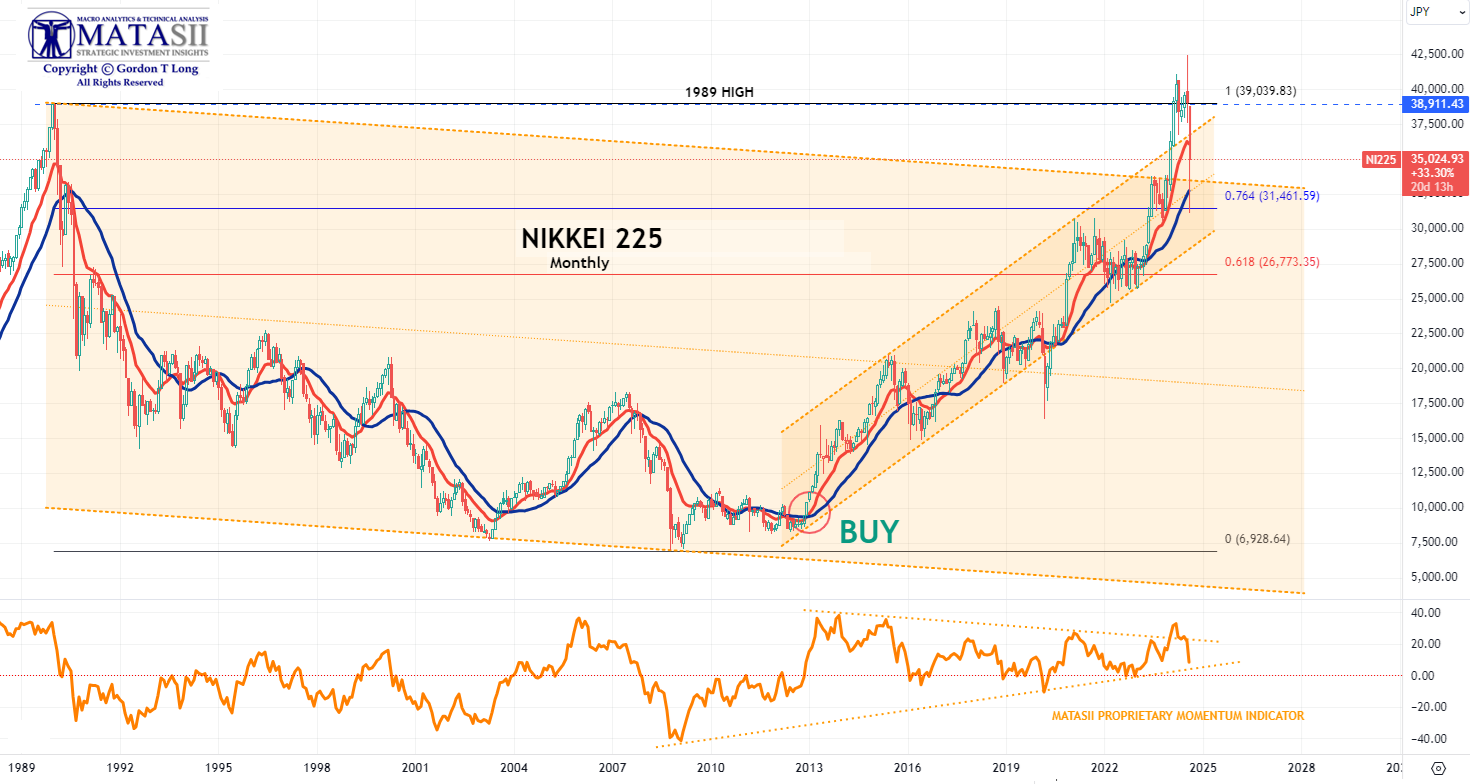
4- NIKKEI - -- w/ MATASII CROSS
The Nikkei stock market has been strong as the Yen weakened. However, with Yen strength the Nikkei has been selling off. Japanese investors are always assessing whether buying foreign debt or buying the Nikkei gives a better risk adjusted return.
| |
|
2- FOOD SCARCITY IS ON THE HORIZON
FOOD POLICIES FOR PLANNED SCARCITIES?
What are they possibly thinking??
The EU, under the control of what I will call the "Davos Crowd", (i.e. global elite), appears to be systematically crushing agriculture through its policies. Unfortunately, this is happening not only in Europe, but also across the wider West. (SEE SOURCE LIST AT BOTTOM)
The European Commission and the member states are specifically taking one measure after another that can have no other result than to make traditional farming and livestock breeding impossible. EU policies threaten to destroy what has provided us with our daily bread and food and make it impossible for farmers to survive. Without them, we will all ultimately starve to death.
The measures that the EU and individual Western countries are putting in place are diverse, but they all point in the same direction, to force farmers not to cultivate certain areas, to clear land, and to stop their activities in order to protect the climate. This is what farmers in the Netherlands were forced to do a few months ago, and the measures put some 3,000 farmers in an impossible situation.
DENMARK has recently announced that it will introduce cattle, pig, and sheep taxes in 2030. They say (…) these animals cause huge damage, as they emit carbon dioxide into the atmosphere. Behind this is the green ideology, the European Union’s Green Deal, which is based on the idea that global warming is caused by human carbon dioxide emissions, and agriculture is linked to this, since cows, for example, emit a lot of methane into the atmosphere.
UKRAINE agricultural products being released onto the European market is a concrete, tangible crime by Brussels, which poses a direct, clear, and present danger to European farmers, especially those in Eastern and Central Europe. It is well known that the standards for Ukrainian agricultural products are far more lax and permissive than those within the EU, and the quality of Ukrainian products (from cereals to foodstuffs) is far inferior to that of European products — but that is why EU farmers simply cannot compete with the prices of Ukrainian products.
It is clear, therefore, that every move by Brussels and the European leaders, (who appear to serve the globalist elite), is potentially deliberately destroying European agriculture.
NORMAL LEADERS WOULD NOT DO THIS!! Behind it you sense left-liberal and globalist aspirations. This is what they believe, and it is now manifested in the fact that global warming is increasing in a devastating way, and that the earth’s climate is becoming unbearable. But they believe that this is due to one single cause: human activity, mainly and decisively anthropogenic carbon dioxide emissions.
THEY ARE WRONG OF COURSE, BUT IT IS A USEFUL ARGUMENT!
FURTHER EXAMPLES
| |
DEVELOPMENTS
THE BUFFETT INDICATOR - Preparing For Lower Prices
A stock market omen of insider dumping is billionaire investor Warren Buffett's Berkshire Hathaway, disposing of 90 million Bank of America shares in recent weeks.
Buffett's 'dump-a-thon' selling last week was a warning sign that the billionaire saw trouble ahead.
Furthermore, Buffett quietly dumped half of Berkshire's Apple shares in the second quarter while increasing the company's cash pile by a record $88 billion to an all-time high of $277 billion at the end of last quarter.
| |
|
CHINA - "Fortress Economy" Policy
In a strategic pivot designed to safeguard China’s economic stability amid escalating global uncertainties, Chinese Communist Party (CCP) leader Xi Jinping is advancing an economic model aimed at bolstering national self-sufficiency and resilience. This shift, documented in a recent study, underscores Beijing's ambition to fortify its economy against external shocks, including geopolitical conflicts and global pandemics.
The report, released on July 30 by Jimmy Goodrich, a fellow at the University of California Institute on Global Conflict and Cooperation, delves into official CCP speeches and policy documents. It provides an in-depth analysis of the Party’s progress in implementing its “Fortress Economy” Policy across several critical sectors.
“[The strategy is] designed to bolster national self-sufficiency and resilience against external shocks, and ultimately allow the nation to withstand ‘extreme situations’ including protracted armed conflict,” the paper asserts.
The impetus for this strategic shift can be traced to a series of global upheavals. Rising tensions between the U.S. and China, the Russian invasion of Ukraine, and the far-reaching disruptions caused by the COVID-19 pandemic have collectively underscored the vulnerability of interconnected global supply chains. These events have prompted Beijing to recalibrate its economic priorities, focusing on reducing dependency on foreign markets and enhancing domestic economic capabilities.
Central to this recalibration is the concept of “dual-economic circulation,” a policy aimed at reorienting China’s economy from its historical reliance on exports towards a more balanced model that strengthens domestic industries while continuing to engage in international trade. By fostering robust internal economic activity, the CCP hopes to mitigate the impact of global disruptions on China's economy.
This dual approach not only seeks economic stability but also dovetails with Xi’s broader national security agenda. The report highlights that the CCP’s strategy encompasses several critical areas, including food and energy security, supply-chain robustness, civil defense mobilization, and the development of strategic reserve infrastructure. These measures are designed to prepare the nation for “extreme-case” scenarios, ensuring that China remains resilient in the face of potential crises.
As the Epoch Times notes further, “This research contributes to understanding China’s strategic intentions and provides a foundation for further exploration of the implications of China’s fortress economy on global economic and geopolitical dynamics,” the author wrote.
China’s economy significantly depends on exports. Last year, the country’s total exports reached about $3.38 trillion, while imports totaled roughly $2.56 trillion. This resulted in a trade surplus of $820 billion—the second-highest in the past decade.
Robert O'Brien, a former national security adviser, commented on the report on X, formerly known as Twitter, urging Washington to pay attention.
“The CCP is preparing to fight and win (or at least survive) a very long war. America should take heed,” he wrote on Aug. 3.
Since the COVID-19 pandemic, the Chinese economy has faced multiple problems, particularly the property crisis marked by the bankruptcy of China’s real estate giant Evergrande. The company is the world’s most indebted firm, with $340 billion in debt.
Earlier this year, a prominent hedge fund manager said the Chinese economy was in trouble because of its heavy investment in the real estate sector, which could result in a crash worse than the 2008 U.S. financial crisis.
The property sector accounts for 70 percent of China’s gross household wealth and about 25 percent of its gross domestic product (GDP), making it a key growth driver but posing a vulnerability for its economy.
China’s troubled real estate market has dragged down the economy, prompting the regime in Beijing to implement “temporary steps,” including 16 measures to support the sector, according to last year’s report from the Atlantic Council Geo-Economics Center and the Rhodium Group, a Washington-based think tank.
The report found that China’s economy struggled with multiple problems, and without robust reforms, Beijing was likely to face a threat to its growth prospects in the coming years, hurting its global position.
The report points out that the root of China’s economy is its “persistent structural reform gap,” which results in “lagging behind top OECD economies in most market dimensions,” and suggests that structured reform is needed.
“The Chinese economy is suffering in part because the [Chinese Communist] Party continues to prioritize ideology over economic dynamism,” it reads.
Due to its weak performance, Beijing’s ambition to dethrone the United States as the world’s largest economy by the end of the 2020s “will not happen in this century, let alone this decade,” the report notes.
Bloomberg economists also forecasted last year that China’s economy was unlikely to overtake the U.S. economy. They predicted that China’s GDP might surpass that of the United States around the mid-2040s but by “only a small margin” before “falling back behind.”
| |
|
GLOBAL ECONOMIC INDICATORS:
What This Week's Key Global Economic Releases Tell Us
| |
CONTINUOUS JOBLESS CLAIMS
Outstanding jobless claims in the United States which are seen as a proxy for the number of people receiving unemployment benefits, rose by 6,000 to 1,875,000 in the week ending July 27th 2024,
This was the highest since November 2021 and above market expectations of 1,870,000.
| |
INTERNATIONAL TRADE
The trade deficit in the US narrowed to $73.1 billion in June of 2024 from the revised 20-month high of $75 billion in the previous month, but above market expectations of a $72.5 billion trade gap.
Exports rose by 1.5% from the previous month to $265.9 billion, the second-highest on record, amid increases in sales of civilian aircraft, automotive vehicles, and energy commodities, including natural gas, petroleum products, and fuel oil.
The rise in exports of goods was enough to offset a slight decrease in exports of services, largely due to less travel. In the meantime, imports rose by a softer 0.6% to $339 billion, with support from purchases of pharmaceutical operations, semiconductors, electric apparatus and energy commodities.
Among different countries, the gap with Italy decreased by $1.7 billion to $3.1 billion, the deficit with China fell by $1.6 billion to $22.3 billion, and the balance with Singapore shifted to a deficit of $0.4 billion from a surplus of $1.3 billion.
Analysts at Oxford Economics note that "Net trade was shown to have been a 0.7ppt drag on GDP growth in Q2, and the June trade report is unlikely to materially change this number in the second release of GDP. The risks are for a larger drag, though with real trade data from June's report showing a 1.6% annualized decline in goods trade, compared to a 1.6% gain in the first estimate of GDP."
| |
GLOBAL PMI & ISM MANUFACTURING
- US S&P Global Services PMI Final (Jul) 55.0 (Prev. 56.0)
- US S&P Global Comp Final PMI (Jul) 54.3 (Prev. 55.0)
- US ISM N-Mfg PMI (Jul) 51.4 vs. Exp. 51.0 (Prev. 48.8)
- US ISM N-Mfg Price Paid Idx (Jul) 57.0 (Prev. 56.3)
- US ISM N-Mfg Employment Idx (Jul) 51.1 (Prev. 46.1)
- US ISM N-Mfg New Orders Idx (Jul) 52.4 (Prev. 47.3)
GLOBAL PMI - COMPOSITE
The S&P Global US Composite PMI was revised lower to 54.3 in July 2024, from the preliminary estimate of 55 and a slight decrease from June's 54.8.
- The revised reading still signaled a solid monthly expansion in private sector business activity, led by the service sector, while manufacturing output rose only marginally.
- New business saw an increase, with services outweighing the dip in manufacturing orders.
- Export orders decreased slightly in July.
- Private sector employment continued to rise for the second consecutive month, though work backlogs persisted. Input cost inflation reached a four-month high, but the rise in charges was the slowest since January, reflecting moderate increases in both manufacturing and services.
GLOBAL PMI - SERVICES
The S&P Global US Services PMI was revised lower to 55 in July 2024 from a preliminary of 56, compared to 55.3 in June.
- The reading continued to point to a marked expansion in the services sector, although the rate of growth eased slightly.
- New business rose for the third consecutive month and at a solid pace.
- Also, new business from abroad increased for the first time in six months, albeit only marginally and to a much lesser extent than total new orders.
- Growth of new business also encouraged firms to take on extra staff.
- Meanwhile, the rate of input cost inflation quickened, but companies increased their selling prices at a softer pace amid competitive pressures.
- Finally, service providers remained optimistic that business activity will rise over the coming year, although confidence eased to an eight-month low.
- A greater focus on marketing and sales efforts, a reduction in interest rates and an improvement in demand following the Presidential Election were supporting confidence.
ISM MANUFACTURING PMI:
ISM Manufacturing PMI rose back into the expansionary territory at 51.4, above the expected 51.0, and the prior 48.8.
- Within the report, business activity jumped to 54.5 (exp. 51.5, prev. 49.6), while employment and prices paid lifted to 51.1 (prev. 46.1) and 57.0 (prev. 56.3), respectively.
- Elsewhere, new orders, backlog of orders, and imports all lifted back above 50, while supplier deliveries fell back into contractionary territory.
- The report notes, “The past relationship between the Services PMI and the overall economy indicates that the Services PMI for July corresponds to a 0.8-percentage point increase in real GDP on an annualized basis.”
- On ISM Services, Oxford Economics notes the uptick will do little to reverse market jitters of a recession in the wake of Friday's employment report, but it aligns with their view of an economy in transition rather than one on the brink of collapse.
- Looking to the September 18th FOMC meeting, OxEco add expectations for aggressive rate cuts in September are overdone, and they expect the Fed to move forward with a 25bps cut.
- Further, on the dataset, Oxford adds, as with last month's decline, it would caution against an overreaction to a single month of data and instead focus on trend, and the six-month moving average remains well above the level that would be consistent with a recession.
| |
|
GLOBAL MACRO
WHAT DOES YOUR SCAN OF THE DATA BELOW TELL YOU? - THE MEDIA AVOIDS BAD NEWS!
We present the data in a way you can quickly see what is happening.
THIS WEEK WE SAW
Exp. =Expectations, Prev. =Previous
| |
|
UNITED STATES
- US S&P Global Services PMI Final (Jul) 55.0 (Prev. 56.0)
- US S&P Global Comp Final PMI (Jul) 54.3 (Prev. 55.0)
- US ISM N-Mfg PMI (Jul) 51.4 vs. Exp. 51.0 (Prev. 48.8)
- US ISM N-Mfg Price Paid Idx (Jul) 57.0 (Prev. 56.3)
- US ISM N-Mfg Employment Idx (Jul) 51.1 (Prev. 46.1)
- US ISM N-Mfg New Orders Idx (Jul) 52.4 (Prev. 47.3)
- US Initial Jobless Claims w/e 233.0k vs. Exp. 240.0k (Prev. 249.0k, Rev. 250k)
- US Continued Jobless Claims w/e 1.875M vs. Exp. 1.87M (Prev. 1.877M, Rev. 1.869M)
- US Wholesale Sales MM (Jun) -0.6% vs. Exp. 0.3% (Prev. 0.4%, Rev. 0.3%)
- US Wholesale Invt(y) MM (Jun) 0.2% vs. Exp. 0.2% (Prev. 0.2%)
CHINA
- Chinese Caixin Services PMI (Jul) 52.1 vs. Exp. 51.4 (Prev. 51.2)
- Chinese Caixin Composite PMI (Jul) 51.2 (Prev. 52.8)
- Chinese Trade Balance (USD)(Jul) 84.65B vs. Exp. 99.0B (Prev. 99.05B)
- Chinese Exports YY (USD)(Jul) 7.0% vs. Exp. 9.7% (Prev. 8.6%)
- Chinese Imports YY (USD)(Jul) 7.2% vs. Exp. 3.5% (Prev. -2.3%)
- Chinese Trade Balance (CNY)(Jul) 601.9B (Prev. 703.7B)
- Chinese Exports (CNY)(Jul) 6.5% (Prev. 10.7%)
- Chinese Imports (CNY)(Jul) 6.6% (Prev. -0.6%)
- Chinese CPI MM (Jul) 0.5% vs. Exp. 0.3% (Prev. -0.2%)
- Chinese CPI YY (Jul) 0.5% vs. Exp. 0.3% (Prev. 0.2%)
- Chinese PPI YY (Jul) -0.8% vs. Exp. -0.9% (Prev. -0.8%)
UK
- UK S&P Global Service PMI (Jul) 52.5 vs. Exp. 52.4 (Prev. 52.4)
- UK S&P Global PMI Composite (Jul) 52.8 vs. Exp. 52.7 (Prev. 52.7)
- UK BRC Retail Sales YY (Jul) 0.3% (Prev. -0.5%)
- UK BRC Total Sales YY (Jul) 0.5% (Prev. -0.2%)
- Barclaycard UK Consumer Spending YY (Jul) -0.3% Y/Y (Prev. -0.6%)
- UK BRC Retail Sales YY (Jul) 0.3% (Prev. -0.5%); Total Sales YY (Jul) 0.5% (Prev. -0.2%)
- UK S&P Global Construction PMI (Jul) 55.3 vs. Exp. 52.8 (Prev. 52.2)
- Barclaycard UK Consumer Spending YY (Jul) -0.3% Y/Y (Prev. -0.6%)
- UK RICS House Price Balance (Jul) -19 vs. Exp. -10 (Prev. -17)
| | |
|
EU
- EU Sentix Index (Aug) -13.9 vs. Exp. -8.0 (Prev. -7.3)
- EU HCOB Services Final PMI (Jul) 51.9 vs. Exp. 51.9 (Prev. 51.9)
- EU HCOB Composite Final PMI (Jul) 50.2 vs. Exp. 50.1 (Prev. 50.1)
- EU Producer Prices MM (Jun) 0.5% vs. Exp. 0.4% (Prev. -0.2%)
- EU Producer Prices YY (Jun) -3.2% vs. Exp. -3.3% (Prev. -4.2%, Rev. -4.1%)
- EU Retail Sales MM (Jun) -0.3% vs. Exp. -0.1% (Prev. 0.1%); YY -0.3% vs. Exp. 0.2% (Prev. 0.3%, Rev. 0.5%)
GERMANY
- German HCOB Services PMI (Jul) 52.5 vs. Exp. 52.0 (Prev. 52.0)
- German HCOB Composite Final PMI (Jul) 49.1 vs. Exp. 48.7 (Prev. 48.7)
- German Industrial Orders MM (Jun) 3.9% vs. Exp. 0.5% (Prev. -1.6%)
- EU HCOB Construction PMI (Jul) 41.4 (Prev. 41.8)
- German Industrial Output MM (Jun) 1.4% vs. Exp. 1.0% (Prev. -2.5%)
- German Exports MM SA (Jun) -3.4% vs. Exp. -1.5% (Prev. -3.6%)
NEW ZEALAND
- New Zealand HLFS Job Growth QQ (Q2) 0.4% vs. Exp. -0.2% (Prev. -0.2%)
- New Zealand HLFS Unemployment Rate (Q2) 4.6% vs. Exp. 4.7% (Prev. 4.3%)
- New Zealand HLFS Participation Rate (Q2) 71.7% vs. Exp. 71.3% (Prev. 71.5%)
- New Zealand Labor Cost Index QQ (Q2) 0.9% vs. Exp. 0.8% (Prev. 0.8%)
- New Zealand Labor Cost Index YY (Q2) 3.6% vs. Exp. 3.5% (Prev. 3.8%)
- New Zealand 2yr Inflation Expectations (Q3) 2.0% (Prev. 2.3%)
- New Zealand 1yr Inflation Expectations (Q3) Q1 2.4% (Prev. 2.73%)
JAPAN
- Japanese All Household Spending MM (Jun) 0.1% vs. Exp. 0.2% (Prev. -0.3%)
- Japanese All Household Spending YY (Jun) -1.4% vs. Exp. -0.9% (Prev. -1.8%)
- Japanese Labor Cash Earnings YY (Jun) 4.5% vs Exp. 2.4% (Prev. 2.0%)
| |
CURRENT MARKET PERSPECTIVE | |
|
EXPECT "CHOPPY"
CPI / PPI POTENTIAL DIRECTIONAL MOVERS THIS WEEK
Click All Charts to Enlarge
| |
|
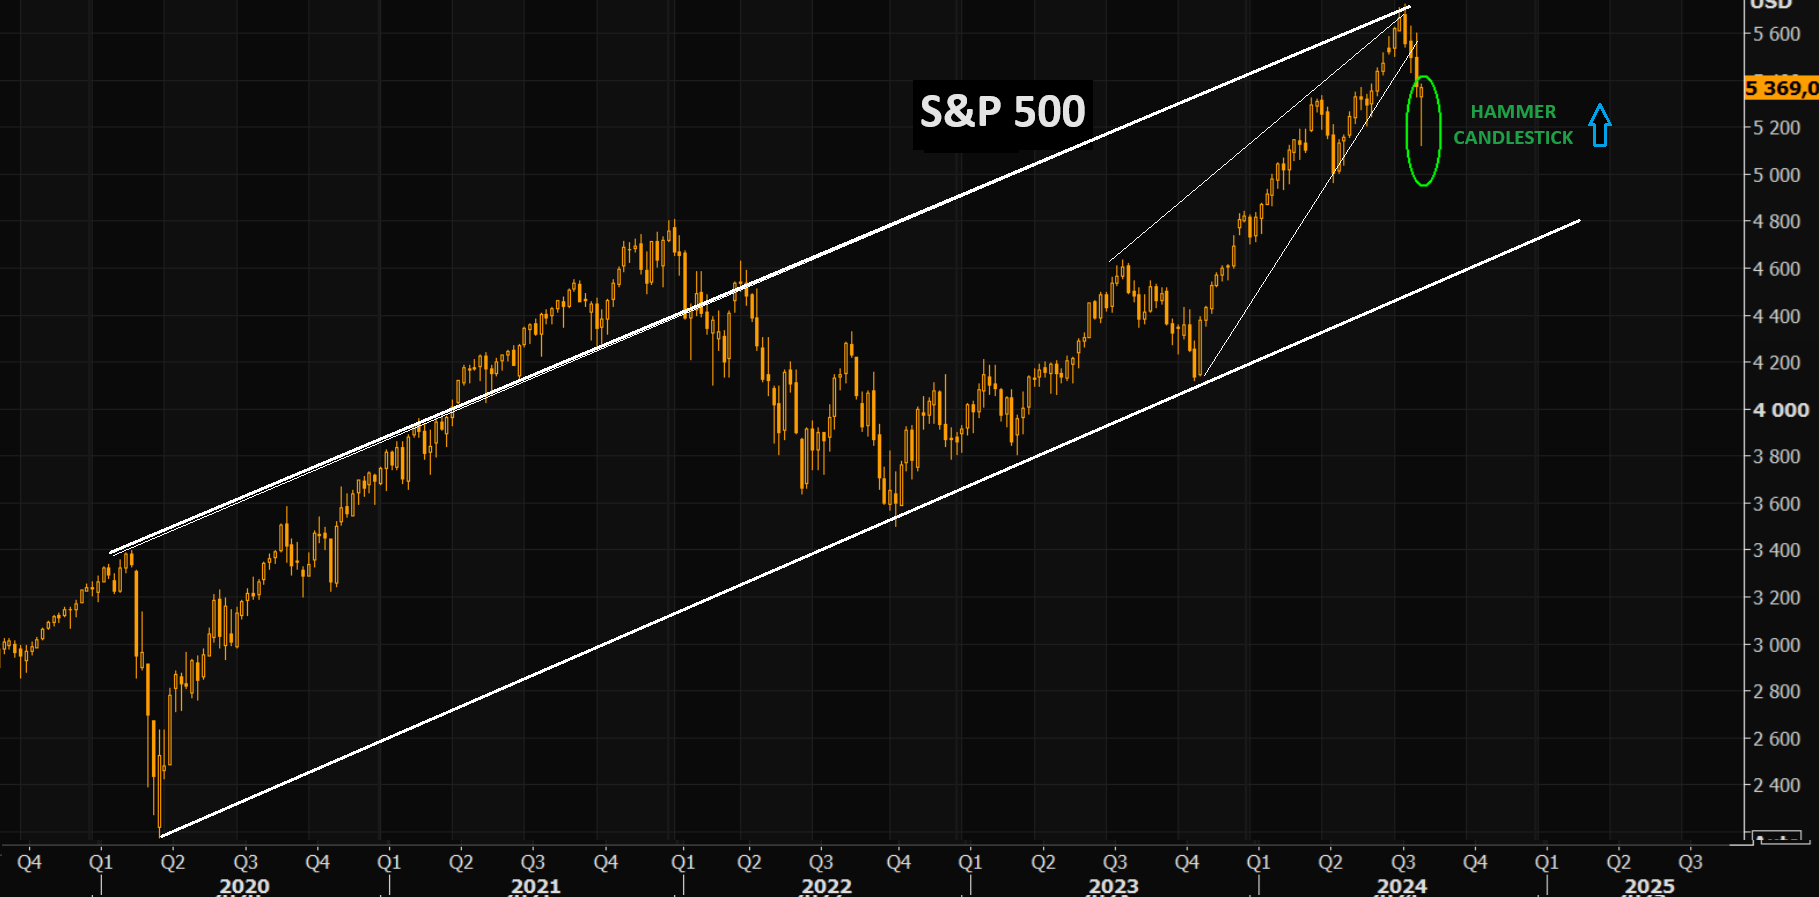
A HAMMER CANDLESTICK FOR MONDAY AM: The SPX putting in a massive hammer candle on the Weekly chart. Hammer candlesticks indicate a potential price reversal to the upside. The price must start moving up following the hammer (i.e. Monday) - this is called confirmation.
BOTTOM LINE:
The technical levels that would flip Wall St narrative from soft to hard landing have not been broken.
- 4% on 30-year Treasury
- 400bps on HY CDX
- 5050 on S&P500
All good news so far, but important now for stock leaders SOX (4600) & big tech XLK (200) to hold 200dma levels.
If levels break, traders then target 2021 highs (i.e. 10% lower).
| |
|
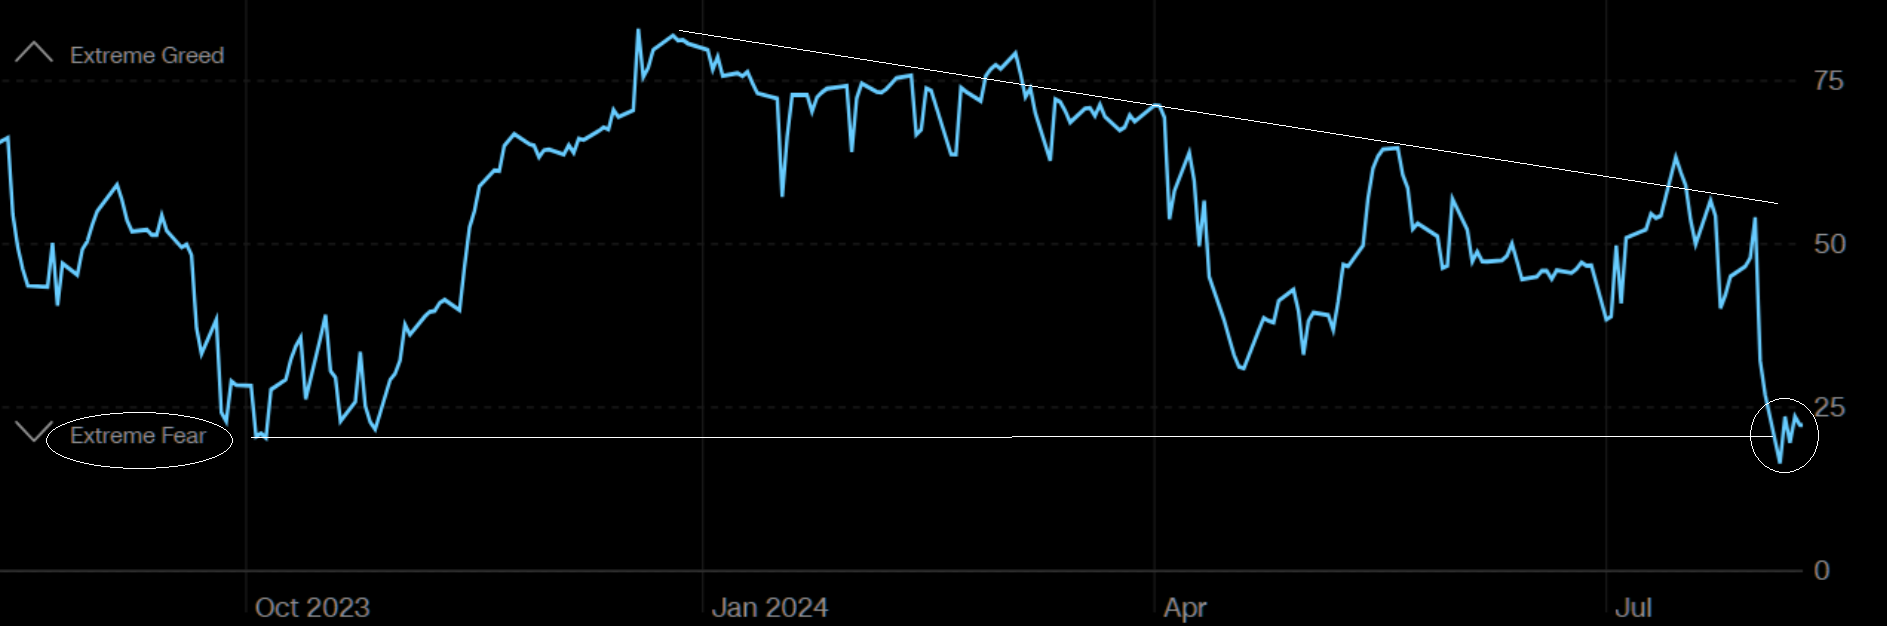
1 - SITUATIONAL ANALYSIS
SENTIMENT - Extreme Fear Often Triggers a (False) Relief Counter Rally
CHART RIGHT:
This last move lower in sentiment is visible on a longer time chart as well.
EXTREME FEAR ON MOST MEASURES
CHART BELOW LEFT:
Soc Gen's sentiment indicator in extreme risk adverse territory.
CHART BELOW RIGHT:
Morgan Stanley's global risk demand index has collapsed post the latest turbulence.
| |
|
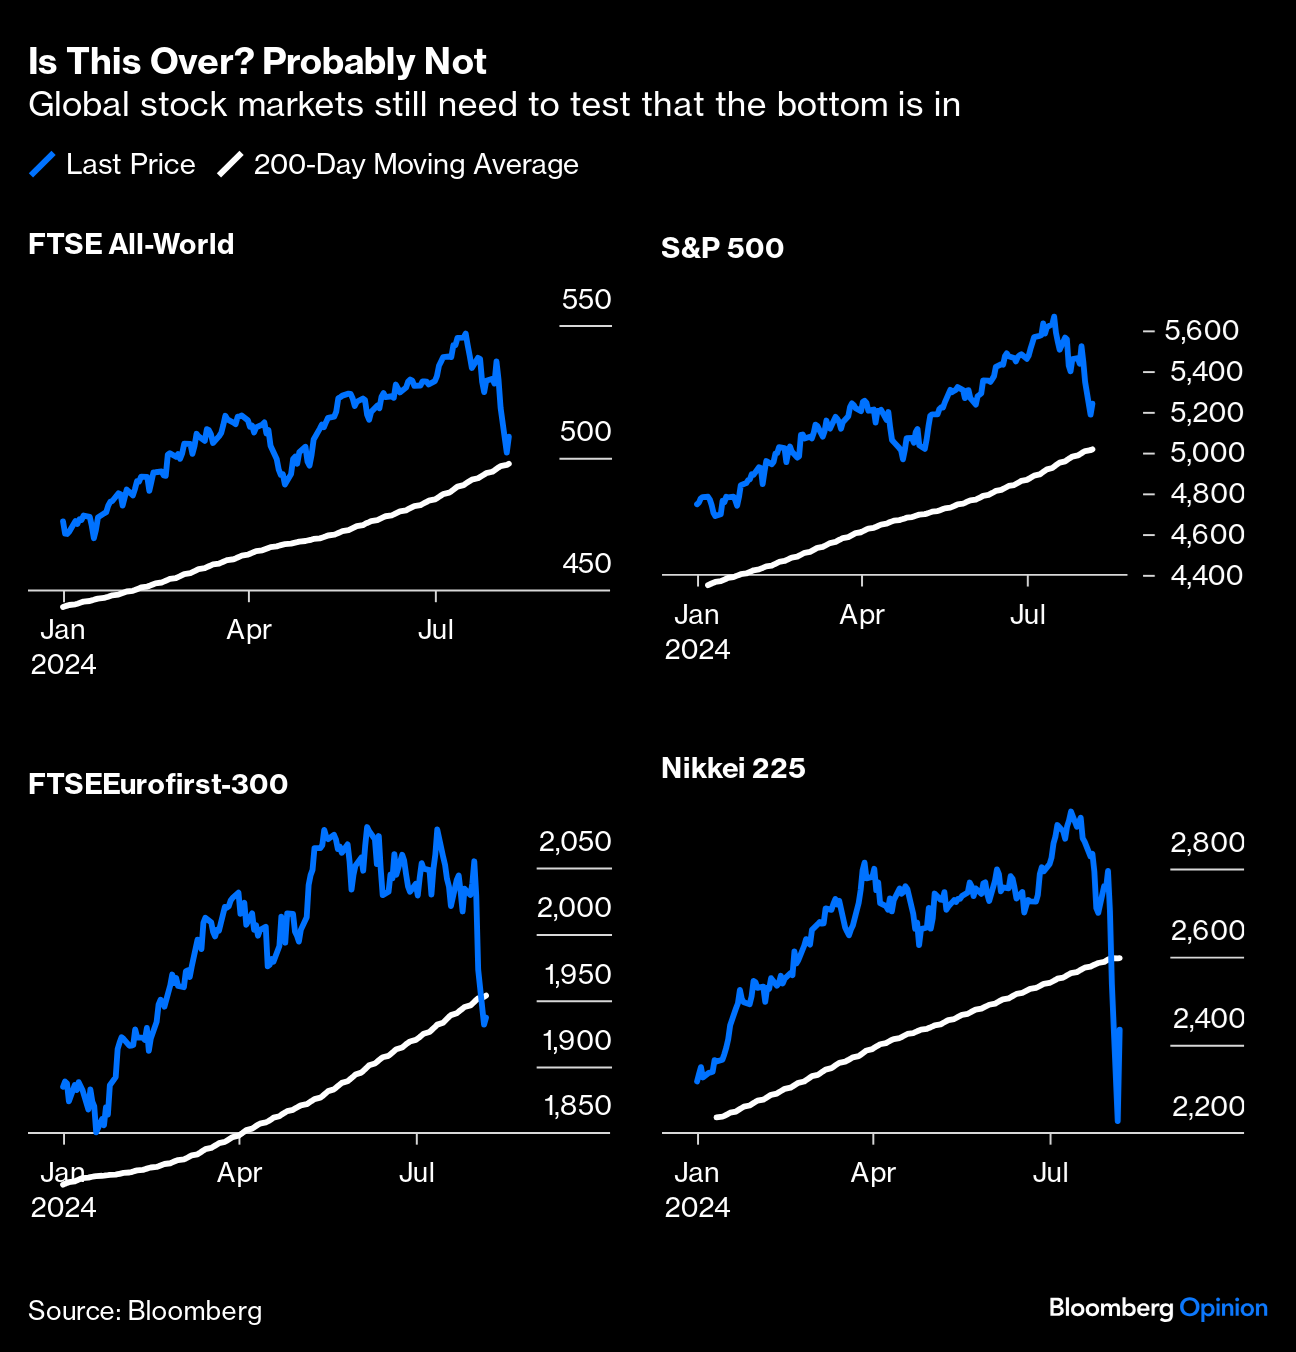
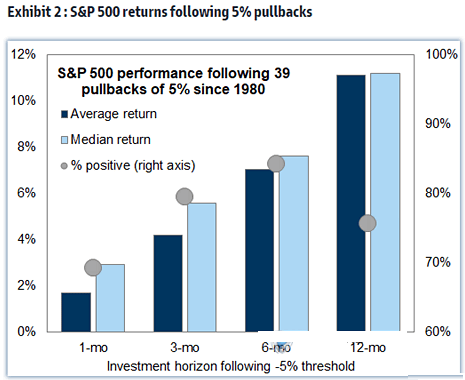
THE RESEARCH ON A BIG DROP
FRIDAY/MONDAY SHOCK NEEDS TIME TO "DECAY"
A RETEST OF MONDAY LOW
AND SUPPORT AT 200 DMA COMING!
WHAT THE STATISTICAL RESEARCH SUGGESTS:
- Expect a "Dead Car" Bounce.
- Expect a Retest of Mondays lows.
- Shocks of this magnitude normally require finding support at the 200 DMA. (See Research Highlight Below)
To put Monday & Tuesday market actions in perspective, Harry Colvin of Longview Economics in London looked at 15 S&P 500 selloffs since 1978, in which the initial wave of selling brought the index down by at least 10%, (which happened in Monday’s intraday trading).
- The likelihood of a retest of the initial lows was high.
- “In 13 of the 15 examples, a retest of the Wave One low occurred in a subsequent wave of selling (i.e., after a relief rally). The two exceptions were April 2012; and October 1997.”
| |
|
Nicholas Colas of Datatrek International applies lessons from the VIX index of volatility.
- Since inception in 1990, its daily average close is 19.5.
- A VIX of 35.3 is two standard deviations above the mean, while 43.2 is three above.
- The VIX briefly touched 55.1 on Monday — a level it has previously reached only 0.8% of the time, during the greatest crises.
- By Tuesday’s close, it was back to 27.7, but after such a shift on the market seabed, we should expect more waves.
- Going through history, Colas finds that without a specific catalyst, (in the form of a major economic or financial event), “the VIX is telling us that we have time (4-6 weeks) before a genuine investable low is at hand.”
- There may be tradable rallies for those willing to try to exploit them.
- If there turn out to be greater problems with the economy, we can expect to wait much longer.
- Some major financial plates have been dislodged. What matters is whether they’ve been shifted permanently, (meaning a recession).
- Either way, the propulsive energy won’t abate just yet.
| |
|
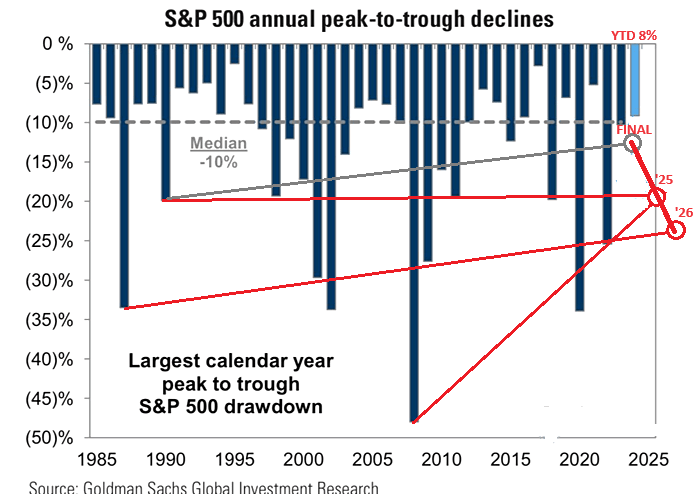
PEAK-TO-TROUGH
Annual Peak-to-Trough historical patterns might give us further insights for coming action in the S&P 500.
- 2024 support at the 200 would come close to the first projection bubble to the right.
- 2025 would be closer to the medium.
- 2026 would approximate prior peak-to-trough trend lines
STILL STRESSED SITUATION
With the SPX trading this weak, despite the JPY move, it is a sign of equities still in very stressed mode.
| |
|
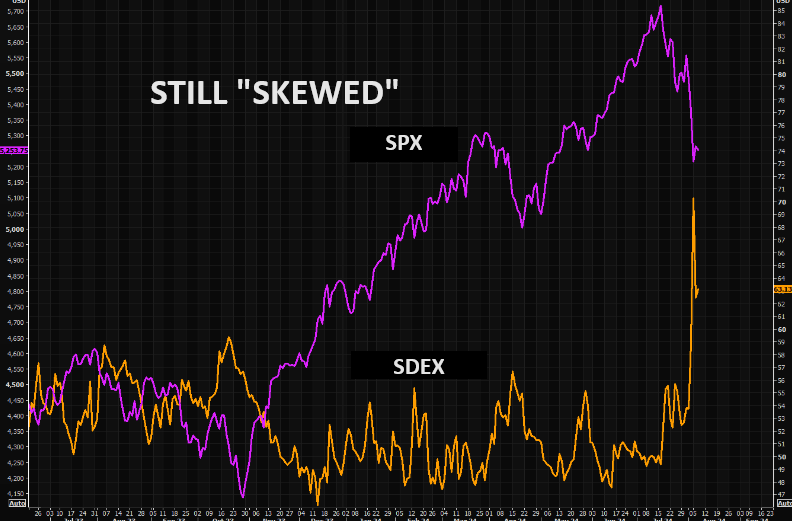
CHART RIGHT:
The crowd remains long and in need of downside protection still. Skew (SDEX index) bouncing higher from already very well bid levels shows you just how fragile this market remains.
CHART BELOW:
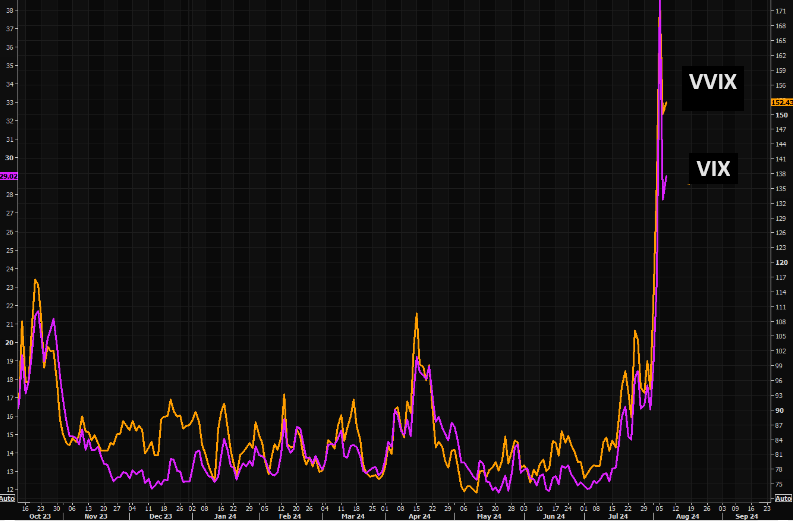
You know things are still "fluid" when VIX is at 29, up 4-5% on the day and still "lagging" the VVIX.
| |
|
US corporate bonds best "tell" whether cutting into "soft" or "hard" landing…
we say "harder" landing thus ==> "sell the 1st cut".
| |
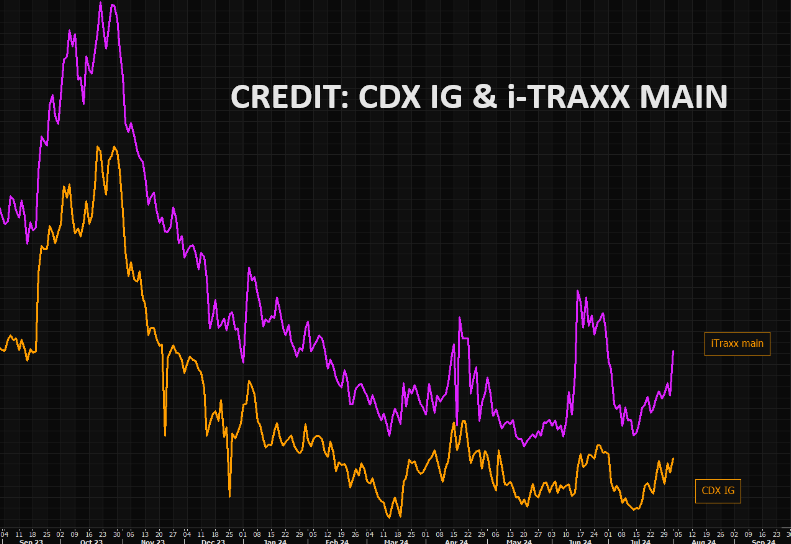
CREDIT ALWAYS LEADS
CHART RIGHT: CDX IG and iTraxx main.
The key credit spreads that would signal harder landing:
- CDX IG >60bps (now 55bps)
- CDX HY >375bps (now 348bps)
CHART BELOW LEFT
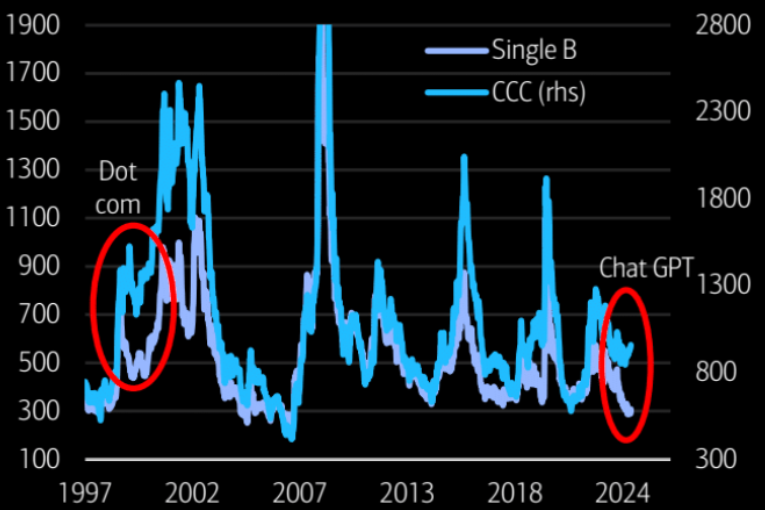
The last time CCC/B diverged, it was the dot-com warning.
CHART BELOW RIGHT
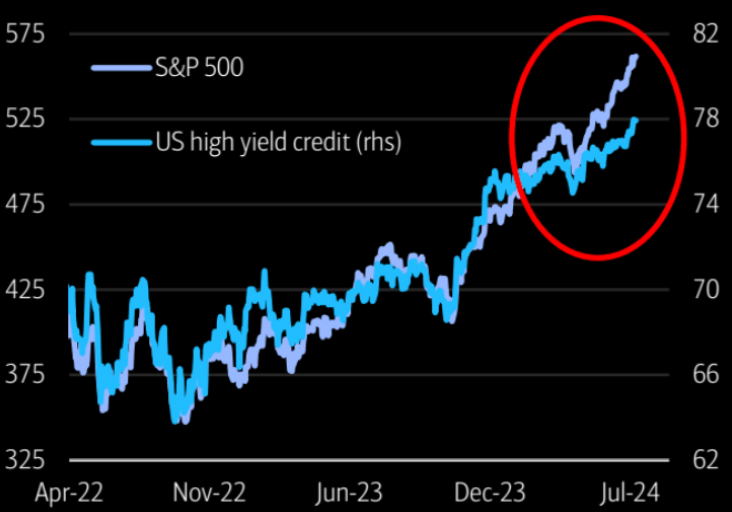
High yield credit has not been confirming the rally in stocks. It is warning there are problems in the underlying credit world.
| |
|
The last time CCC/B diverged, it was the dot-com warning.
| | |
High yield credit has not been confirming the rally in stocks. It is warning there are problems in the underlying credit world. | | |
|
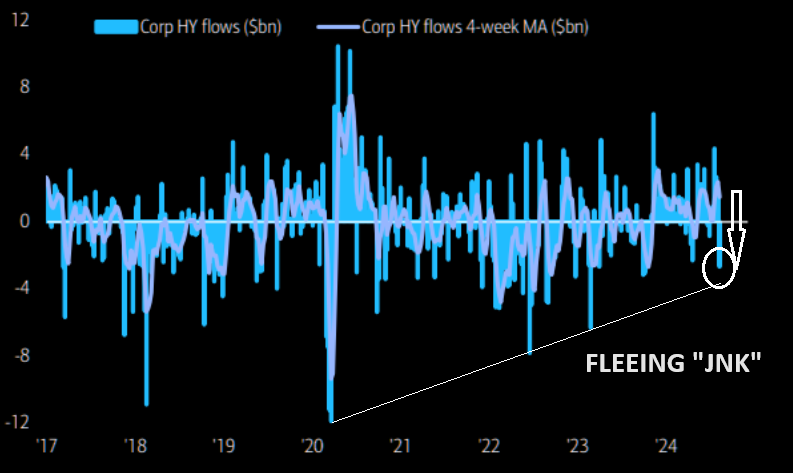
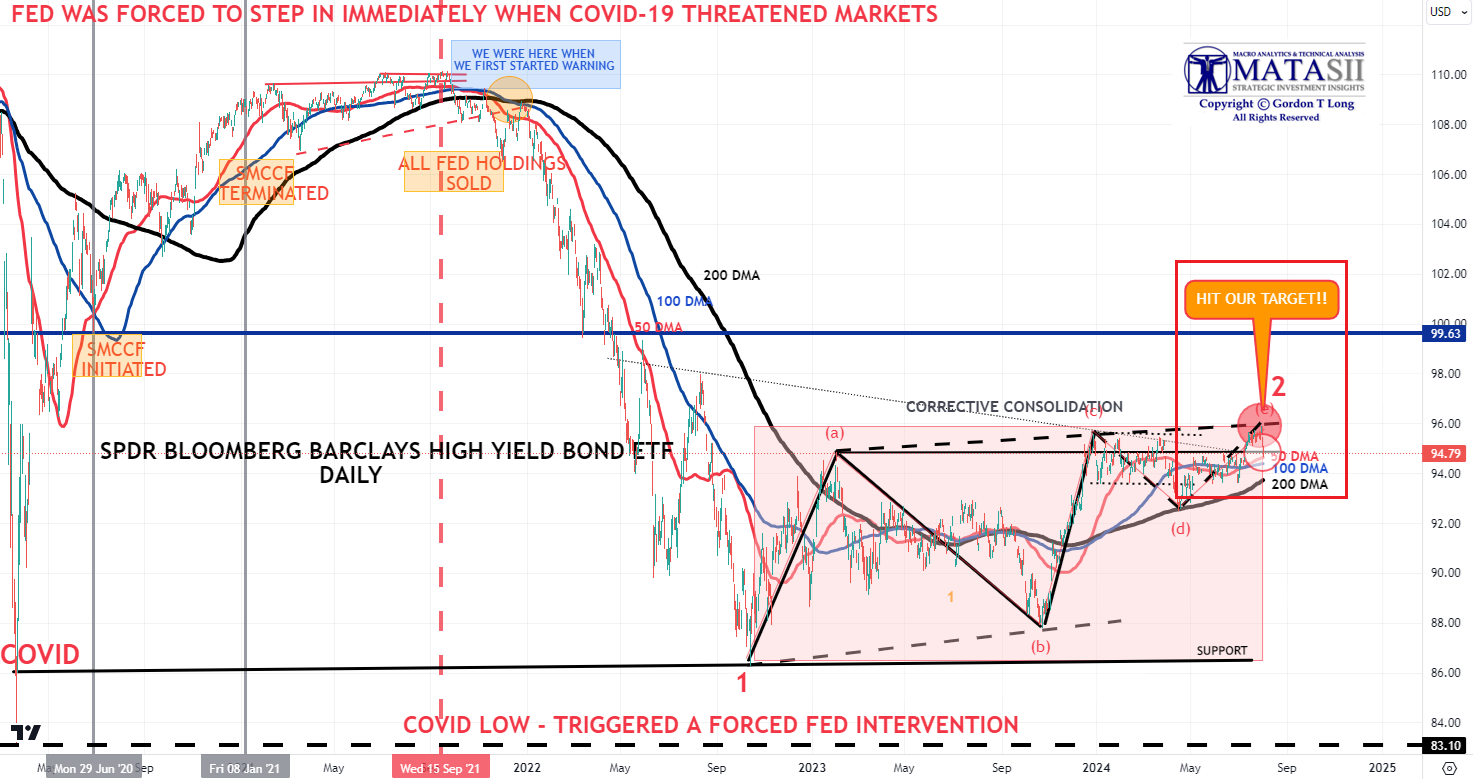
CREDIT LEADS -- HIGH YIELD BONDS - JNK
CHART RIGHT: Biggest outflows in High Yield (JNK) since Oct 2023.
- CREDIT REACHED OUR TARGET OBJECTIVE
- Prices had steadily rose with the 50 DMA crossing the 100 DMA until our target price was reached, then abruptly fell off with Friday's Labor Report.
- We appear to have completed our ABCDE Corrective pattern within Wave 2.
- Wave 2, which we expected to end in August, did so - however, a little sooner than we thought.
- HY JNK Prices can now be expected to likely fall with spreads then widening, (especially if/when the Fed cuts Rates).
| |
|
YOUR DESKTOP / TABLET / PHONE ANNOTATED CHART
Macro Analytics Chart Above: SUBSCRIBER LINK
| |
|
GROWTH MATTERS
Growth has taken over as a driver of risk appetite and is becoming more important driver than monetary policy/inflation.
| |
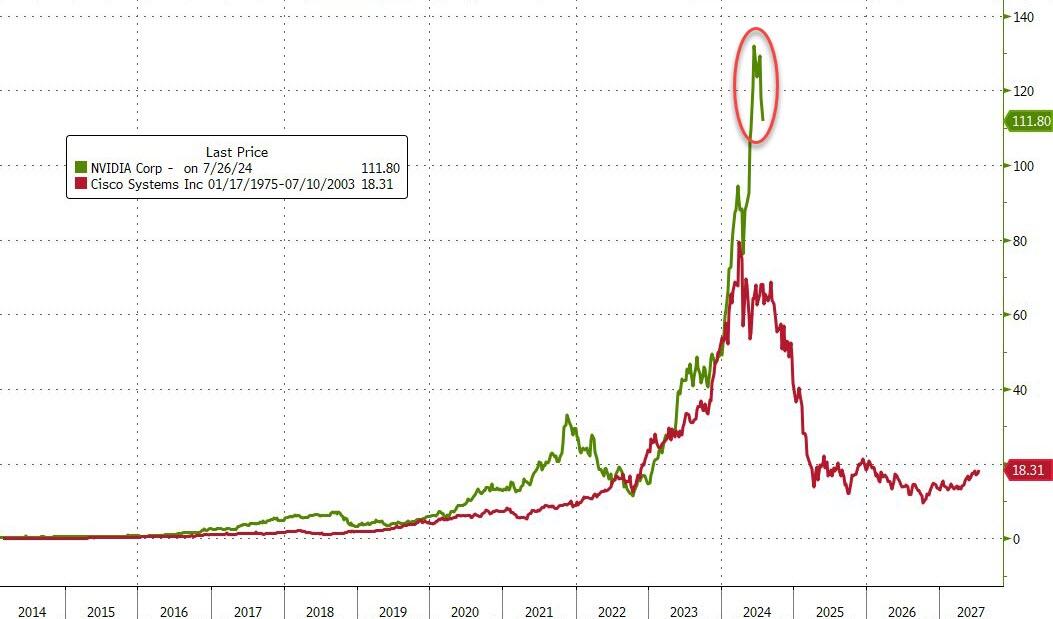
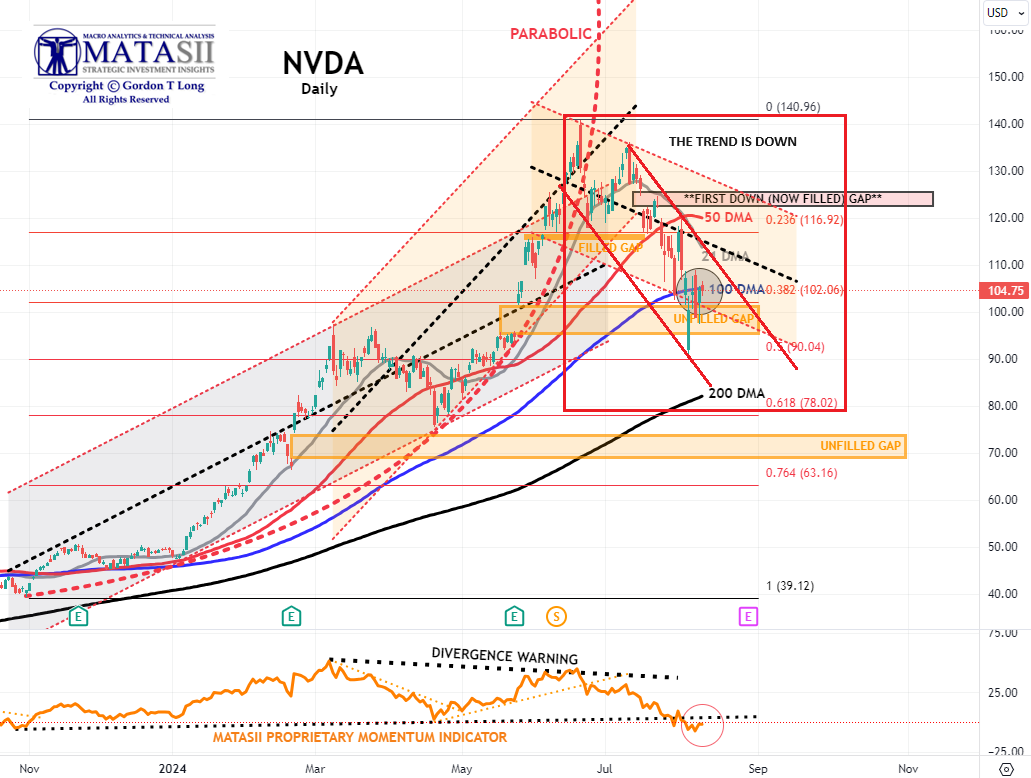
As goes NVDA, so goes the MAG-7, As Goes Mag-7 so goes The Market. | Investment benefactors are often not the big winners. | |
CHART RIGHT: NVDA v the dominant darling CSCO of the Dotcom Bubble (for those who recall). | | |
| |
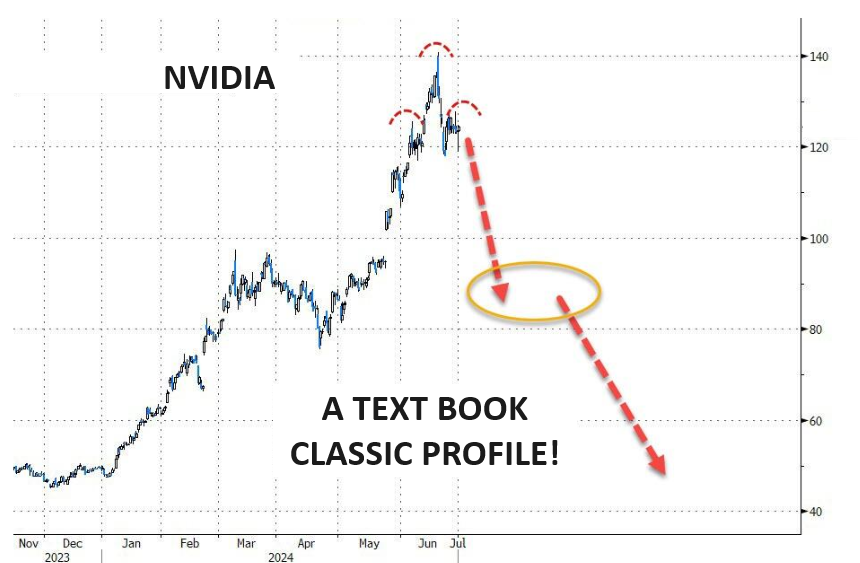
- NVDA appears to have found near term overhead resistance at the 100 DMA.
- Indications are NVDA is looking to test its 200 DMA within the descending red channel on our chart below.
- The MATASII Proprietary Momentum Indicator (lower pane) has broken through its longer term support.
- As we said in the last report, the Momentum support trend line is likely to precipitate a counter rally - however, the trend is now clearly down.
- The Dotted Black Trend line in the MATASII Proprietary Momentum Indicator, (lower pane below), has been signaling this sell-down was coming for some time now.
- Divergence is normally seen as a warning to the downside and is still ahead if the Divergence isn't removed by a movement higher in Momentum.
- At some point, the major unfilled gaps (at much lower levels) must be filled. NVDA therefore may no longer become a Short to Intermediate Long Term hold, but rather a position trading stock as other competitors enter the space and force margins and the earnings growth rate contracts.
| |
|
YOUR DESKTOP / TABLET / PHONE ANNOTATED CHART
Macro Analytics Chart Above: SUBSCRIBER LINK
| |
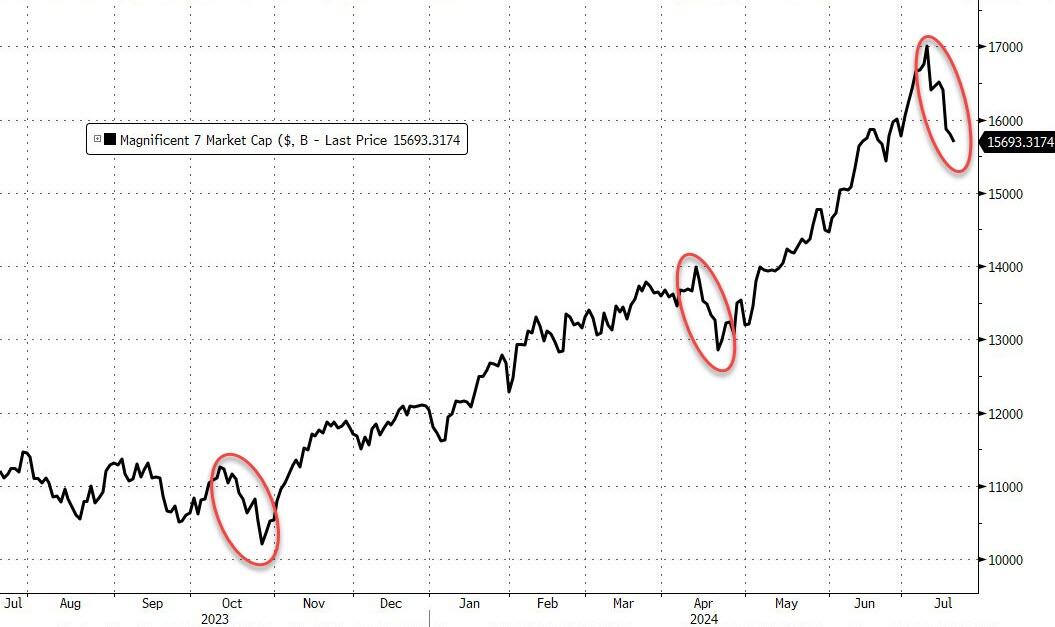
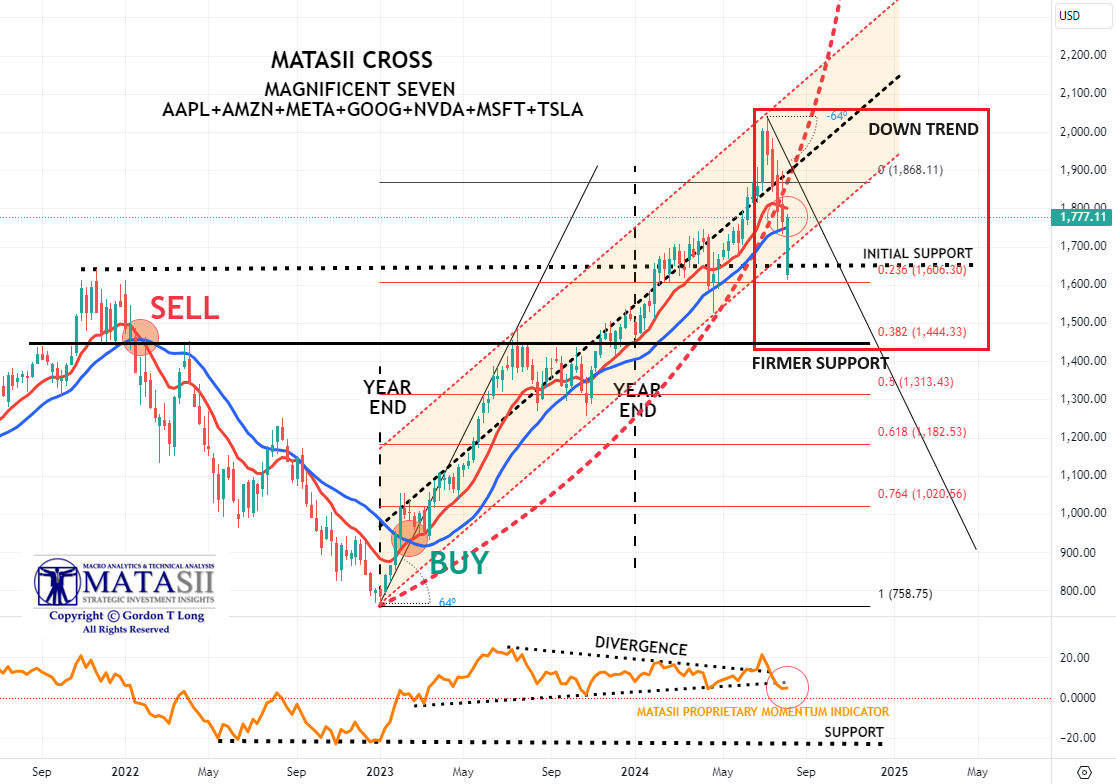
MAGNIFICENT 7
The Magnificent 7 stocks are now down an incredible $2.3 trillion market cap from their record highs.
- The basket of 'Magnificent 7' stocks appear to have found support at the black dotted "initial Support" line on our chart below.
- The Intermediate Momentum Indicator trend line (Lower pane) offered initial support, but has been broken with long term support much lower.
- As we said in our last report: "A brief counter rally may ensue next week, but it is highly likely that Longer term Momentum Support (lower pane black dashed line) will soon be tested".
- Continued caution is advised since major global "Dark Pools" have been identified as presently operating behind the scenes on the Mag-7.
| |
|
YOUR DESKTOP / TABLET / PHONE ANNOTATED CHART
Macro Analytics Chart Above: SUBSCRIBER LINK
| |
"CURRENCY" MARKET (Currency, Gold, Black Gold (Oil) & Bitcoin) | |
|
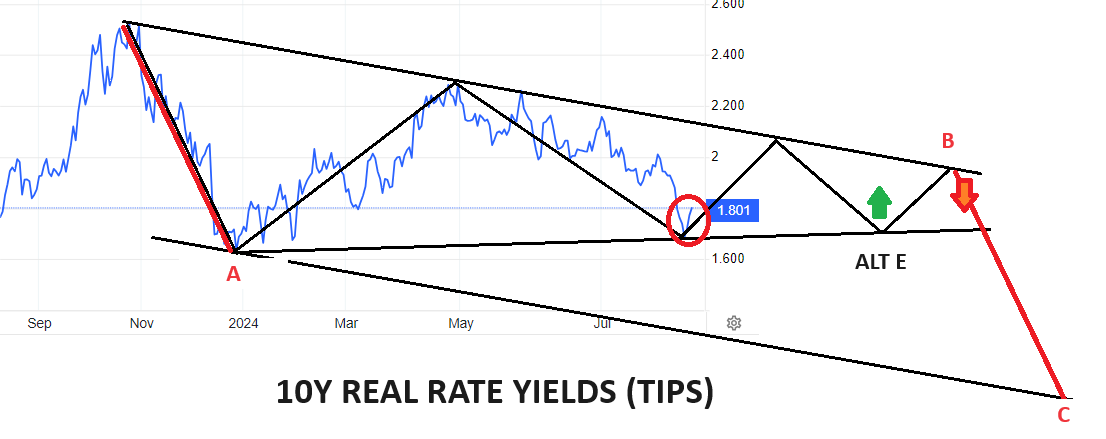
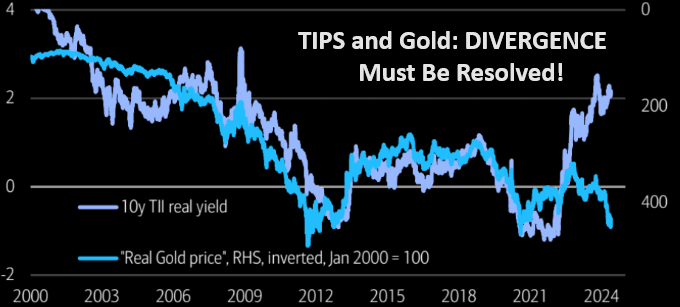
10Y REAL YIELD RATE (TIPS)
Real Rates bounced-off our lower support trend line which gives us confidence with the two alternative counts that could occur, (shown in the chart to the right).
NOTE: Gold is suggesting it will be resolved by the red line (chart right) with a fall in real rates (chart lower right) with rising Gold prices.
| |
CONTROL PACKAGE
There are TEN charts we have outlined in prior chart packages, which we will continue to watch closely as a CURRENT Control Set:
-
US DOLLAR -DXY - MONTHLY (CHART LINK)
-
US DOLLAR - DXY - DAILY (CHART LINK)
-
GOLD - DAILY (CHART LINK)
-
GOLD cfd's - DAILY (CHART LINK)
-
GOLD - Integrated - Barrick Gold (CHART LINK)
-
SILVER - DAILY (CHART LINK)
-
OIL - XLE - MONTHLY (CHART LINK)
-
OIL - WTIC - MONTHLY - (CHART LINK)
-
BITCOIN - BTCUSD - WEEKLY (CHART LINK)
-
10y TIPS - Real Rates - Daily (CHART LINK)
US DOLLAR - DXY
LAST FRIDAY'S ACTION'S saw the Dollar Index markedly weaker, with the flight-to-haven trade ramping up after the US jobs report as Yen and Franc's strength sent the index lower.
- The Dollar was initially weaker before the US Jobs report, with losses accelerating once it was unveiled the US added way fewer jobs than expected, as well as the Unemployment Rate unexpectedly ticking higher by 0.2%.
- Fed pricing reacted extremely dovish to the data, which added to US growth fears, as there is now 117bps of rate cuts by year-end (prev. 88bps).
- As such, bonds soared, with US 10y yields falling over 16bps, adding further pressure to the Buck.
- The dovish reaction was highlighted in Investment Bank projections, particularly Goldman Sachs and Citi, who now see a 50bps Fed rate cut in both September and November, alongside BofA and Goldman Sachs seeing additional rate cuts by year-end. Elsewhere,
- Friday saw Fed's Goolsbee reiterated the Fed's narrative, namely, they'd never want to overreact to one month's data, while Barkin noted the 114k jobs are still a 'reasonable' number, even if it marks a slowdown.
- Looking ahead, ISM Services PMI (Jul) on Monday acts as the next possible dollar catalyst, with US data release light for the remainder of the week.
CURRENT
- The Dollar should now be expected to fall as/if Fed Rate expectations are taken down.
- There are key lower support levels shown below that should be expected to offer important support.
- The MATASII Proprietary Momentum Indicator (lower pane) offers a clearer view of what might be underway, which matches the 10Y Real Rates chart (above). Both highlight a significant September FOMC meeting.
| |
|
YOUR DESKTOP / TABLET / PHONE ANNOTATED CHART
Macro Analytics Chart Above: SUBSCRIBER LINK
| |
|
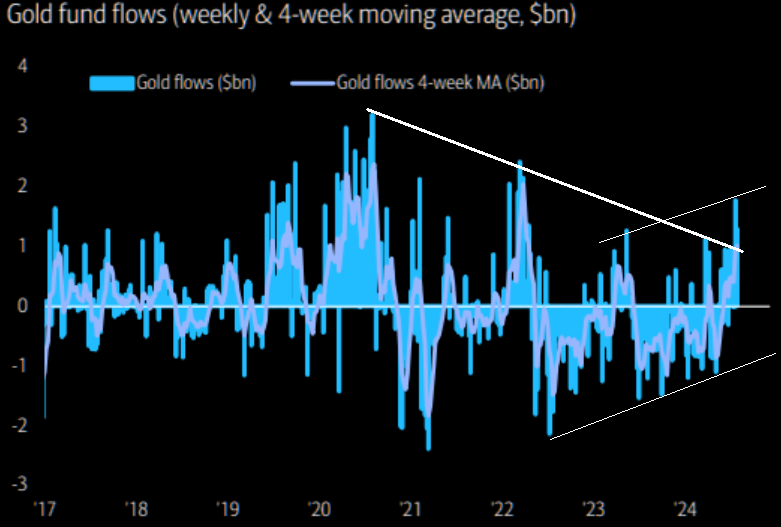
GOLD
CHART RIGHT:
We have just experienced the biggest 2-week inflow to gold since March '22.
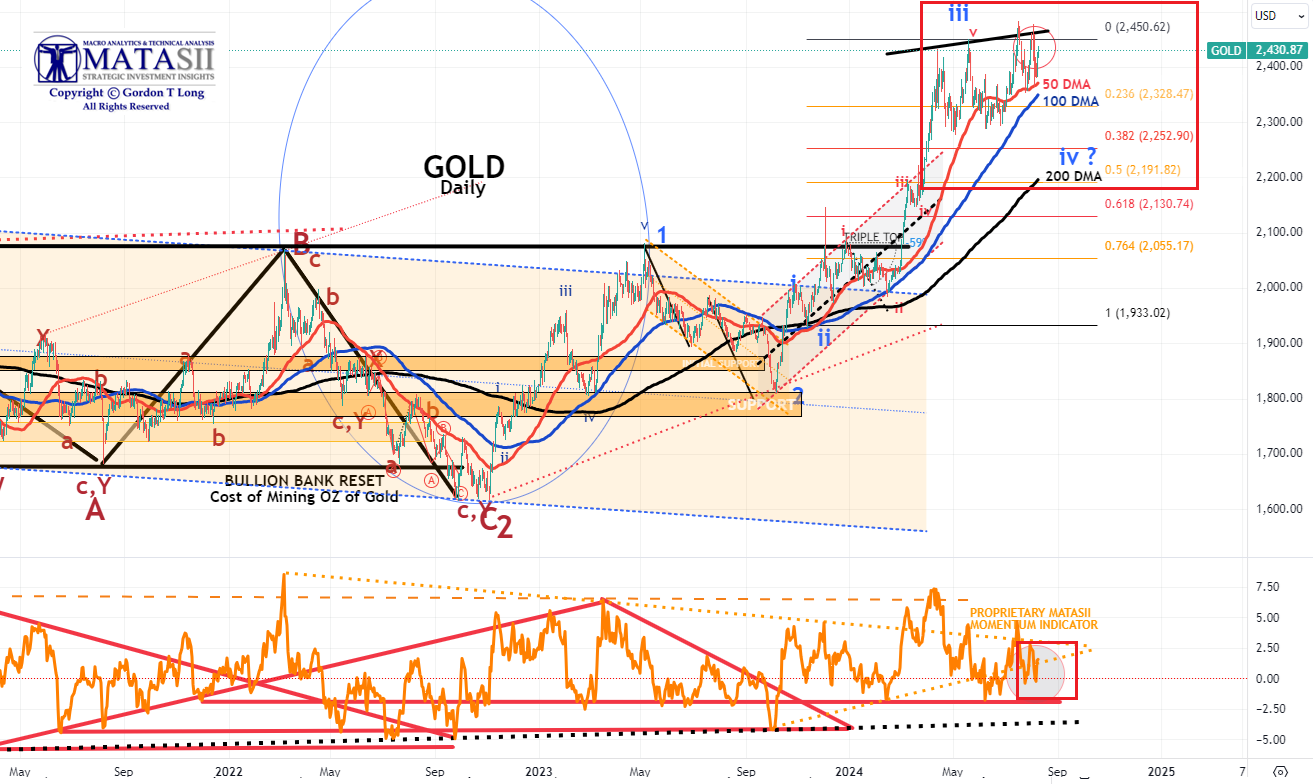
CHART BELOW
- Gold tested its 50 DMA again at the end of last week before rising to our overhead resistance trend line (black line) this week and then falling and bouncing once again.
- We are beginning to get the framework of a rising triangle which suggests gold may have to test lower support before being able to break through overhead resistance.
- The MATASII Proprietary Momentum Indicator (Lower pane) is within a "momentum wedge".
- Gold likely needs stronger support at lower levels closer to a 38.2% retracement and the rising 200 DMA, before it breaks to the upside and through overhead resistance (black line).
| |
|
YOUR DESKTOP / TABLET / PHONE ANNOTATED CHART
Macro Analytics Chart Above: SUBSCRIBER LINK
| |
|
CONTROL PACKAGE
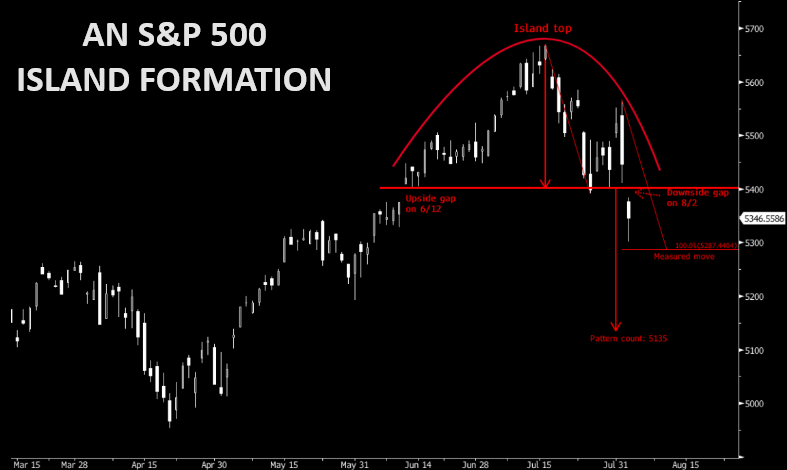
CHART RIGHT: Beware of the Island top Formation pattern in the SPX with downside projections at 5287 (measured move) and 5135 (pattern count).
There are FIVE charts we have outlined in prior chart packages that we will continue to watch closely as a CURRENT "control set":
-
The S&P 500 (CHART LINK)
-
The DJIA (CHART LINK)
-
The Russell 2000 through the IWM ETF (CHART LINK),
-
The MAGNIFICENT SEVEN (CHART ABOVE WITH MATASII CROSS - LINK)
-
Nvidia (NVDA) (CHART LINK)
| |
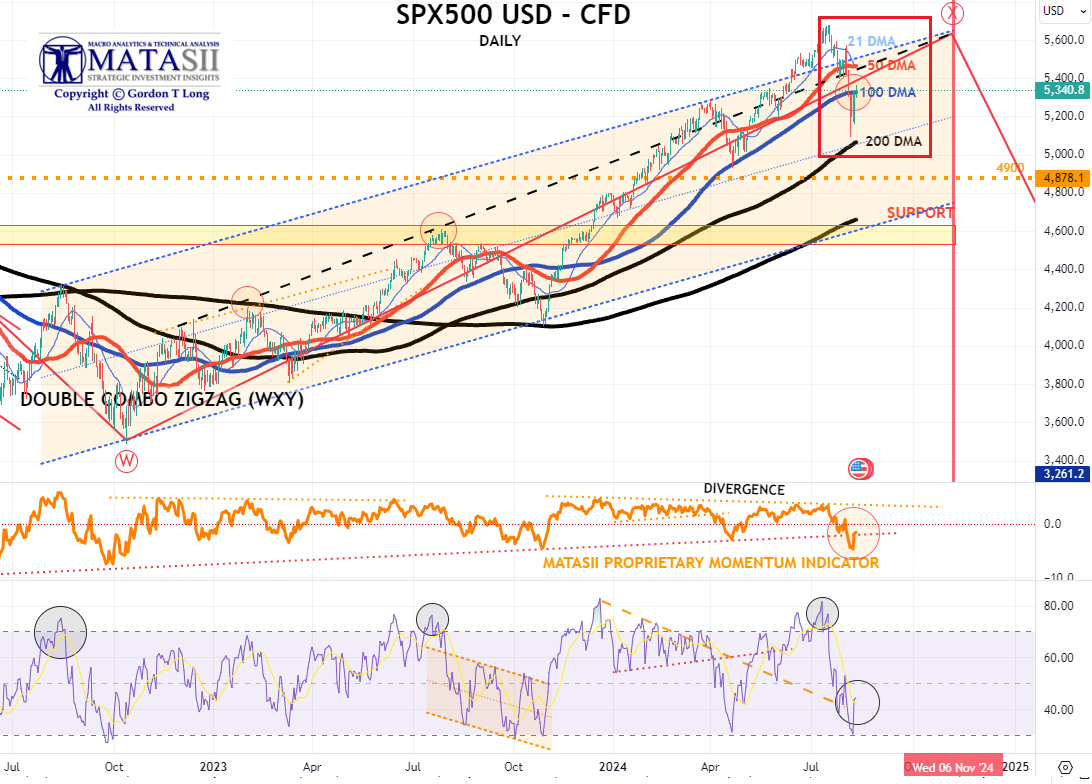
S&P 500 CFD
- The S&P 500 cfd appears to be looking for support at the 200 DMA. This is inline with our research noted at the top of this report.
- The MATASII Proprietary Momentum Indicator (middle pane) supplied initial support at its longer term rising support trend line before breaking.
| |
YOUR DESKTOP / TABLET / PHONE ANNOTATED CHART
Macro Analytics Chart Above: SUBSCRIBER LINK
| |
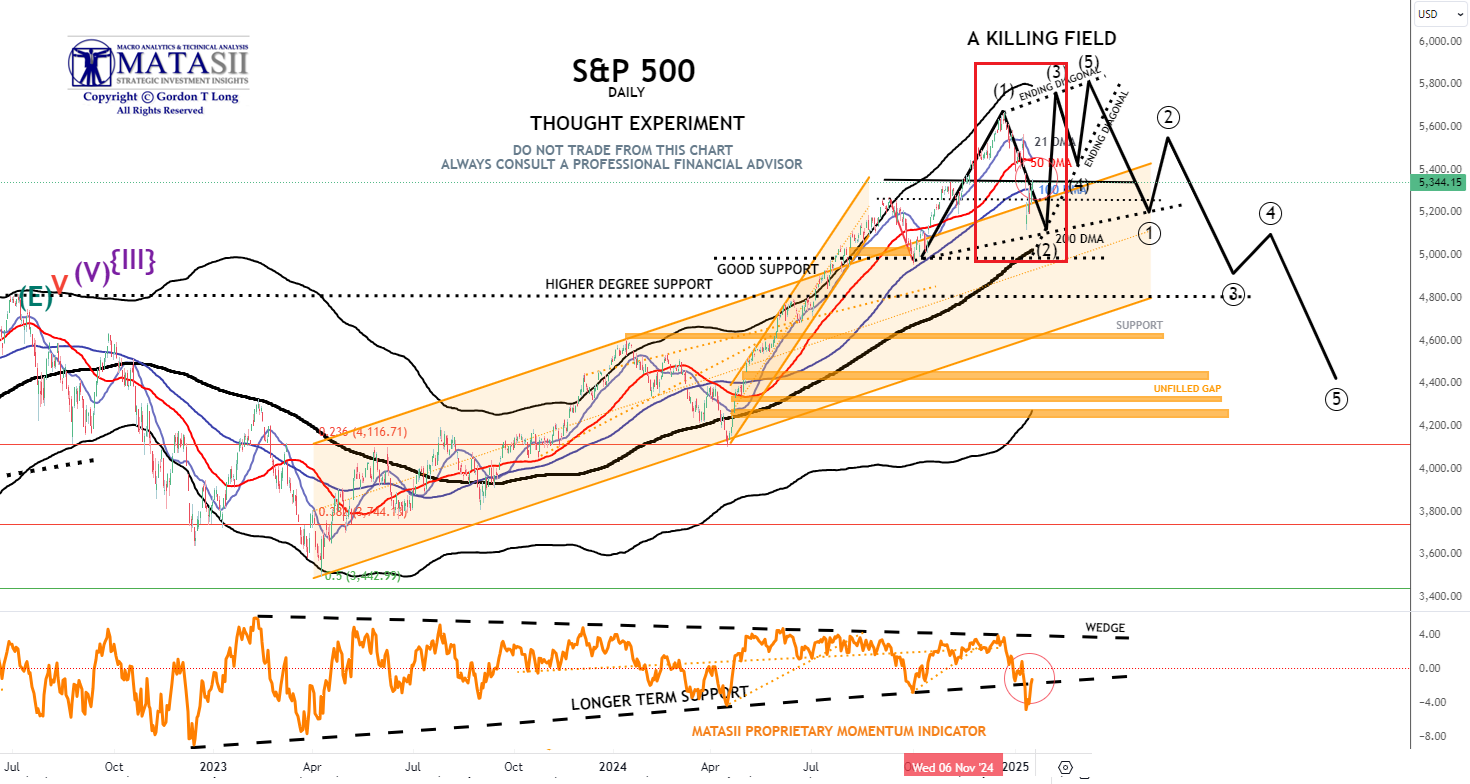
S&P 500 - Daily - Our Thought Experiment
OUR CURRENT ASSESSMENT IS THAT THE INTERMEDIATE TERM IS LIKELY TO LOOK LIKE THE FOLLOWING:
NOTE: To reiterate - "the black labeled activity shown below, between now and September, looks like a "Killing Field", where the algos take Day Traders, "Dip Buyers", the "Gamma Guys" and FOMO's all out on stretchers!"
WHY DID I CALL IT A KILLING FIELD?: "We remain in short gamma land. Dealers had to sell deltas into the 5450 support area during the July 30 move lower. The same dealers had to chase all that sold delta and much more at higher prices as they became shorter and shorter deltas as the market ripped higher yesterday. Today is another brutal day for the short gamma community as they have been forced to sell (at much lower prices) all that delta they bought yesterday. Add to it poor summer liquidity, and you realize why things are moving in an erratic way."
- The S&P 500 like the S&P 500 cfd appears to be looking for support at the 200 DMA. This is inline with our research noted at the top of today's mid-week report.
- The MATASII Proprietary Momentum Indicator (lower pane) supplied initial support at its longer term rising support trend line before being decisively broken. This should be seen as further indication that final support has not yet been found.
|  | |
YOUR DESKTOP / TABLET / PHONE ANNOTATED CHART
Macro Analytics Chart Above: SUBSCRIBER LINK
| |
STOCK MONITOR: What We Spotted
MONDAY
- US indices (SPX -3%, NDX -3%, RUT -3.3%, DJIA -2.6%) continued to plunge lower on Monday, continuing on from Fridays' NFP-induced weakness amid fears regarding US growth and a possible recession.
- Whilst risk averse sentiment and flight-to-quality was somewhat present to start the week, relevant indices settled well off extremes, highlighted by the US 10yr yield lower by roughly 4bps and at roughly 3.75%, vs. an earlier low of 3.6670%.
- In addition, the Dollar Index was lower and around 102.70 at pixel time (Mon low 102.15), with USD/JPY trading between 141.70-146.56, and currently around 144, indicating the size of the moves.
- WTI and Brent continued its sell off, albeit settling well off worst levels, as the aforementioned global risk-averse sentiment outweighed heightened Middle East tensions, with focus on Iran's soon coming response to Israel.
- Elsewhere, Bitcoin plunged beneath 50k, while the VIX soared to 65.
- The aforementioned moves reversed off peaks after a better-than-expected ISM Services report, whereby the headline rose back above 50, as did business activity, which also saw Fed pricing 'ease' back to Friday's levels, as it its peak money market priced in 130bps by year-end and 52bps in September.
- Sectors all closed in the red, with Technology lagging and weighed on by weakness in MAG7 names.
- On the Fed footing, Goolsbee (2025 Voter) acknowledged he was forbidden to talk about the prospect of emergency cuts, when he was questioned, (implied pricing for a 25bp move in the next week at 60% in the European morning) but made clear that everything is always on the table.
INFLATION BREAKEVENS: 5yr BEI +1.0bps at 2.063%, 10yr BEI +1.3bps at 2.069%, 30yr BEI +1.8bps at 2.110%.
REAL RATES: 10Y -- 1.6927%
EARNINGS
- Infineon (IFX GY) - Q3 (EUR): Revenue 3.7bln (exp. 3.8bln), Net 403mln (exp. 447mln), adj. Gross Margin 42.2% (exp. 40.3%), adj. EPS 0.43 (exp. 0.42). Further improvement to revenue and earnings seen in Q4, FY forecasts are well within the prior guided range. It is anticipated that revenue will increase in all four segments Q/Q. Q4 Guidance: Revenue 4bln (exp. 3.9bln). CEO says they are to cut around 1.4k jobs globally and will move an additional 1.4k. 3.6% weighting in the DAX 40.
- Berkshire Hathaway (BRK) - Q2 EPS 21,122 (vs 24,775 Y/Y), Q2 operating income USD 11.59bln (+15.5% Y/Y), Quarterly net income -15% to USD 30.34bln (vs 35.91bln Y/Y), Q2 revenue USD 93.65bln (exp. 94.5bln). Nearly half of BRK's profit came from its insurance businesses, including Geico car insurance, where underwriting profit more than tripled as premiums rose and claims fell. Insurance underwriting income +81% Y/Y, and insurance investment income +40% Y/Y. Berkshire's cash stake grew to USD 276.9bln (vs 189bln Q/Q) as it sold a net USD 75.5bln of stocks in Q2, the seventh straight quarter that Berkshire sold more stocks than it bought, Reuters notes. Berkshire repurchased USD 345mln of its own stock in the quarter (vs USD 2.57bln in Q1).
STOCK SPECIFICS
- Apple (AAPL) - Warren Buffett's Berkshire Hathaway (BRK) cut its stake in the Co. by 38% from the previous quarter.
- Nvidia (NVDA) - Its upcoming AI chips, which are part of the Blackwell series, will be delayed by over three months due to design flaws, Information reports.
- Kellanova (K) - Mars is considering acquiring the Co. for roughly USD 27bln, which could challenge regulatory approval for sector consolidation.
- Berkshire Hathaway (BRK.B) - Revenue fell short, but posted strong Q2 earnings thank to insurance strength with its cash stake growing 47% to 277bln, as it sold a net USD 75.5bln of stocks in Q2, the seventh straight quarter that the CO. sold more stocks than it bought.
- Alphabet (GOOGL) - Lost DoJ antitrust suit over search, according to Bloomberg.
TUESDAY
- Stocks rebounded from the recent bloodbath with slight outperformance in the NDX for the majority of the session although gains were broad based, with the SPX, RUT and RSP (equal weighted S&P) not far behind.
- The sectoral outperformance was seen in Real Estate, Financials and Industrials, although all sectors were in the green with the large cap Tech, Consumer Discretionary and Comms notching gains north of 1.2%.
- However, some broad-based profit taking was observed within the last hour and a half of trade, with indices closing off highs with the RUT finishing out in front.
- T-Notes were choppy but ultimately bear steepened, with the equity rally and concession ahead of the 3yr auction weighing, with overnight pressure following the fastest increase of Japanese wages since 1997, while Asian stocks surging (Nikkei up over 10%) also likely added to the overnight pressures.
- Some rebound was seen after strong German Industrial orders, but once US equities rallied after the open, the T-Note selling resumed. In FX, the USD saw only marginal gains, with DXY hovering around 103.00, while the Yen underperformed after its recent rally but AUD was the leader after hawkish commentary from RBA Governor Bullock, who noted the RBA discussed a rate hike at this meeting.
- It is also worth noting that in Japan, the top currency diplomat, BoJ and FSA discussed the recent big moves in the stock market, forex and that they are closely watching FX moves but they gave no further details.
- Oil prices were choppy but ultimately settled marginally in the green.
INFLATION BREAKEVENS: 5yr BEI +5.3bps at 2.110%, 10yr BEI +4.7bps at 2.109%, 30yr BEI +3.9bps at 2.142%
REAL RATES: 10Y -- 1.7950%
EARNINGS
- Uber (UBER) - Revenue and gross bookings surpassed expectations.
- Palantir (PLTR) - Beat on the top and bottom line, alongside giving Q3 and FY24 revenue outlooks above forecasts.
- GlobalFoundries (GFS) - Adj. EPS and revenue beat, though Q3 Adj. EPS was below the consensus.
- ZoomInfo Technologies (ZI) - EPS and revenue missed alongside guidance for the next quarter and FY coming in light.
- Caterpillar (CAT) - Exceeded Adj. EPS and revenue consensus.
- Zoetis (ZTS) - Topped EPS and revenue expectations, as well as its FY revenue view.
- Yum China (YUMC) - Profit beat, and on a separate footing announced its CFO is stepping down.
- Lucid (LCID) - Top line beat and delivered more vehicles than expected alongside PIF making an investment worth USD 1.5bln.
STOCK SPECIFICS
- Southwest Airlines (LUV) - Elliot Investment management disclosed a 7% stake in the Co, believing the shares undervalued.
- Lumen Technologies (LUMN) - Announced it has USD 5bln in new business due to AI-driven demand for connectivity, with another USD 7bln in discussions.
- CrowdStrike (CRWD) - Upgraded to Overweight from Neutral at Piper Sandler, on the ramifications of the latest update 'will likely be more-so short-lived and at negligible cost".
- TSMC (TSM) - To increase prices for its 5nm and 3nm process manufacturing in 2025 by 3-8%
- Disney (DIS) - Raised streaming prices by as much as 25% and adds channels.
WEDNESDAY
- Stocks initially resumed the session on a strong footing but shortly after the US open the optimism faded with stocks tumbling throughout the rest of the session with stocks closing well in the red with underperformance in the RUT.
- Sectors ultimately closed mixed with gains seen in Utilities, Energy and Financials, while Consumer Discretionary, Materials and Tech lagged; Comms also finished red.
- In healthcare, the weakness was largely led by a tumbling Eli Lilly (LLY) on the back of Novo Nordisk (NVO) Wegovy sales missing estimates, hitting the GLP1 competitor, while CVS (CVS) missed on revenue and light FY guidance.
- T-Notes were pressured throughout the session with a slew of corporate and treasury supply weighing, with the 10yr auction seeing a very weak reception with a chunky 3.1bps tail.
- In FX, the Dollar was bid but primarily as a function of Yen weakness after BoJ Deputy Governor Uchida overnight said that the BoJ will not hike rates when markets are unstable, noting that Ueda shares his views.
- Elsewhere, the cyclical currencies outperformed, particularly the Kiwi after a strong jobs report overnight but all the risk-sensitive currencies were off best levels as equities nose-dived in the US afternoon.
- Crude prices held onto the bid on geopolitical tensions, bullish inventory data, and Libya's NOC confirming its force majeure of the Sharara oil field.
INFLATION BREAKEVENS: 5yr BEI +2.2bps at 2.127%, 10yr BEI +1.8bps at 2.122%, 30yr BEI +1.6bps at 2.152%..
REAL RATES: 10Y -- 1.873%
EARNINGS
- Super Micro Computer (SMCI) - Missed on profit and gross margin, with gross margin guidance underwhelming, and announced a 10-for-1 stock split.
- Walt Disney (DIS) - Saw weakness on Hulu negotiations despite a blowout report, as it may have to pay USD 5bln more for Hulu stake.
- Ralph Lauren (RL) - Beat on the top and bottom line.
- Shopify (SHOP) - Strong earnings report, highlighted by beating on key metrics.
- Airbnb (ABNB) - Fell short on profit and gave soft guidance for the next quarter, with the executive seeing some signs of slowing demand from US guests.
- Rivian Automotive (RIVN) - Deeper loss per share than expected, and has seen its order backlog fall in recent quarters as deliveries increased and some customers cancelled their reservation.
- Novo Nordisk (NVO) - Q2 profit and sales disappointed after bottlenecks hit its weight loss products, though it did raise its FY sales outlook on the increased supply of its weight loss drugs.
- CVS Health (CVS) - Bottom line and comp. sales surpassed expectations, though revenue and FY guidance were beneath forecasts.
- Amgen (AMGN) - Bottom line missed.
- Lyft (LYFT) - Profit missed with next quarter guidance soft.
- Fortinet (FTNT) - Stellar report; EPS and revenue beat, with strong guidance for the next quarter and the FY.
- Upstart (UPST) - Shallower loss per share, topped on revenue, with solid outlook.
STOCK SPECIFICS
- Nvidia (NVDA) - Nvidia clears Samsung's (SSNLF) 8-layer HBM3E chips for use in AI chipsets, and it is set to sign a deal to begin supplies of such chips by end-Q4.
-
Micron (MU) - Has determined that it could resume its buyback program, citing improved conditions
- Advanced Micro Devices (AMD) - Piper Sandler reiterated AMD as a top pick, saying the stock should gain significant market share in the traditional server space.
- Meta (META) - Reportedly in talks with Indian tech firm Jio for a possible hardware device deal, according to The Information.
THURSDAY
- Stocks surged on Thursday with broad based gains while T-notes bear flattened after Initial Jobless Claims fell by more than expected, helping ease some recent labor market concerns.
- The equity rally was broad-based, with all sectors in the green but the gains were seen most in Tech, Communication, Industrials and Health Care, with the latter sector buoyed by a stellar report from Eli-Lilly (LLY) which saw it raise its outlook on diabetes and weight loss drugs after a strong quarter for Mounjaro and Zepbound, seeing the stock + c. 9.5%.
- T-notes were sold across the curve in a flatter manner after the jobless claims data, while attention turned to the 30yr bond auction, which ultimately was woeful, seeing a whopping 3.1bp tail, the largest since November.
- Crude prices continued their bid, buoyed by risk sentiment and geopolitical tensions.
- The Dollar was bid after the US claims data while Yen and franc underperformed given their sensitivity to risk and yields.
- The cyclical currencies outperformed, but the Aussie was a clear leader, buoyed by hawkish commentary from RBA Governor Bullock.
- MXN was choppy around the Banxico rate decision, which voted 3-2 to cut rates by 25bps, vs split analyst expectations for a cut or hold.
INFLATION BREAKEVENS: 5yr BEI +2.5bps at 2.136%, 10yr BEI +1.5bps at 2.133%, 30yr BEI +2.3bps at 2.164%..
REAL RATES: 10Y -- 1.827%
EARNINGS
- Eli Lilly (LLY) - Beat on profit, revenue, and key drug breakdown, alongside better-than-expected FY guidance. Moreover, plans to launch zepbound single-dose vials in the coming weeks. Executive says concerns remain about Novo Nordisk (NOVOB DC) and Catalent (CTLT) acquisition.
- Warner Bros Discovery (WBD) - Much deeper loss per share than expected with revenue missing, as results include a USD 9.1bln non-cash goodwill impairment, plus a USD 2.1bln amortisation and restructuring cost.
- Robinhood (HOOD) - Revenue and EPS exceeded expectations.
- Monster Beverage (MNST) - Poor report, highlighted by profit, net sales, volume and average net sales all short.
- Zillow Group (Z) - EPS, revenue, and adj. EBITDA all topped alongside solid next quarter outlook. The CEO is to step down, with the COO replacing him.
- Dutch Bros (BROS) - Expects new openings for this year to be at the lower end of a range between 150-165, which overshadowed a stellar report.
- Bumble (BMBL) - Revenue missed and FCF way below the consensus and significantly cut its revenue and adj. EBITDA margin growth view.
- Occidental Petroleum (OXY) - Top and bottom line surpassed forecasts and maintained its YF production guidance ex CrownRock.
- Under Armour (UAA) - Surprise profit per share and revenue topped, alongside lifting FY adj. operating income view.
STOCK SPECIFICS
- Nvidia (NVDA) - Issues with its Blackwell chips have not yet deterred Big Tech companies from investing in Nvidia AI chips, DigiTimes reports.
- Apple (AAPL) - Prepares a small Mac mini model that will use the new M4 chip, Bloomberg reports. The design will be the smallest Apple desktop computer to date.
- Amazon (AMZN) - Enlists TikTok and Pinterest (PINS) in a quest to sell everywhere, according to The Information.
- Delta Air Lines (DAL)- Said they are pursuing legal claims against CrowdStrike (CRWD) and Microsoft (MSFT) to recover damages caused by outage, which total at least USD 500mln
FRIDAY
- Stocks were predominantly bid on Friday with outperformance in the Nasdaq, although the Russell lagged and was the only index finishing in the red.
- The majority of sectors were green, with outperformance in Communication Services, Technology, and Real Estate, while Materials, Industrials, and Consumer Staples were the relative laggards.
- T-notes Bull flattened with eyes turning to US CPI next week.
- The Dollar index saw slight pressure but DXY managed to hold above 103.00.
- The Yen and Franc outperformed thanks to lower UST yields while antipodes lagged with Kiwi traders eyeing the RBNZ rate decision next week, with analysts split between a hold or cut.
- Highlights on Friday saw slightly hotter than expected China inflation data, while Canada Employment was mixed, with the headline missing, the unemployment rate printing beneath expectations, and the full-time employment number surging.
- Fed's Collins also spoke, noting that if data continues to come in the way she expects, she believes it will be appropriate to soon adjust policy and ease restrictiveness.
- She also noted the July jobs report was softer than expected, and it warrants careful attention, but she cautioned against over-emphasizing any one or two releases.
INFLATION BREAKEVENS: 5yr BEI -2.3bps at 2.112%, 10yr BEI -2.1bps at 2.112%, 30yr BEI -1.8bps at 2.148%.
REAL RATES: 10Y -- 1.842%
EARNINGS
- Expedia (EXPE) - Beat on the top and bottom line.
- Paramount (PARA) - Profit was well above expectations, and sees the Skydance transaction closing in H1 2025. Moreover, it plans to cut its US workforce by roughly 15% to realize USD 500mln in savings.
- Take-Two Interactive (TTWO) - Revenue beat, with results not showing the full impact of its acquisition of GearBox.
- Gilead Sciences (GILD) - Top and bottom lines exceeded expectations, alongside raising its FY profit guidance.
- Akamai Technologies (AKAM) - Profit and revenue surpassed forecast with strong next quarter and FY guidance.
- Doximity (DOCS) - EPS and revenue topped Wall St. consensus, accompanied by better-than-expected Q2 and FY guidance.
STOCK SPECIFICS
- TSMC (TSM) - Reported July sales, which revealed 24% of growth from June.
- Disney (DIS) - Plans to invest at least USD 5bln in the UK and Europe over the next five years to produce blockbuster films and TV shows.
- Apple (AAPL) - Spotify (SPOT) and Epic Games criticised Apple's revised compliance plan for the EU's Digital Markets Act, TechCrunch reported.
- Netflix (NFLX) - Reportedly taps CBS Sports (PARA) to produce its Christmas NFL games, according to WSJ.
- Intel (INTC) - Postponed an innovation event that was scheduled for September.
- Pacira Biosciences (PCRX) - Said a court found the 495 patent is not valid, and is considering options including an appeal; shares fell over 40% in response.
| |
CONTROL PACKAGE
There are FIVE charts we have outlined in prior chart packages that we will continue to watch closely as a CURRENT "control set":
- The 10Y TREASURY NOTE YIELD - TNX - HOURLY (CHART LINK)
- The 10Y TREASURY NOTE YIELD - TNX - DAILY (CHART LINK)
- The 10Y TREASURY NOTE YIELD - TNX - WEEKLY (CHART LINK)
- The 30Y TREASURY BOND YIELD - TNX - WEEKLY (CHART LINK)
- REAL RATES (CHART LINK)
FISHER'S EQUATION = 10Y Yield = 10Y INFLATION BE% + REAL % = 2.112% + 1.842% = 3.954%
| |
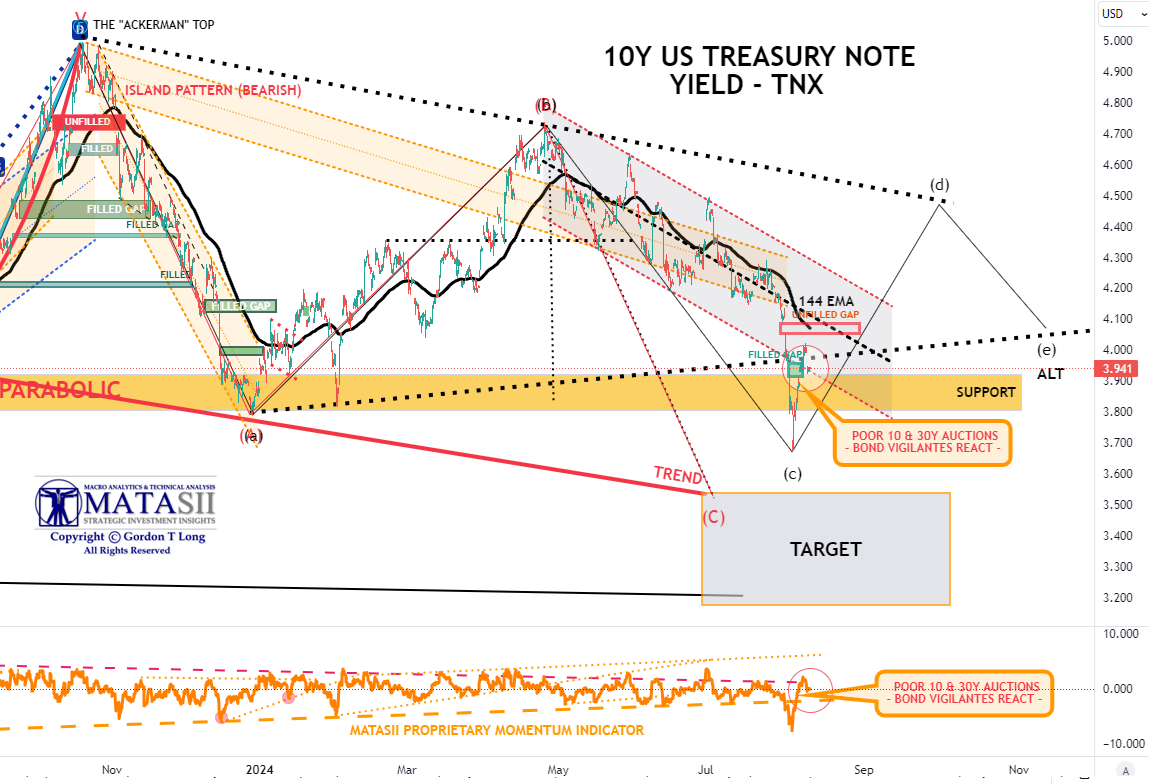
10Y UST - TNX - Hourly
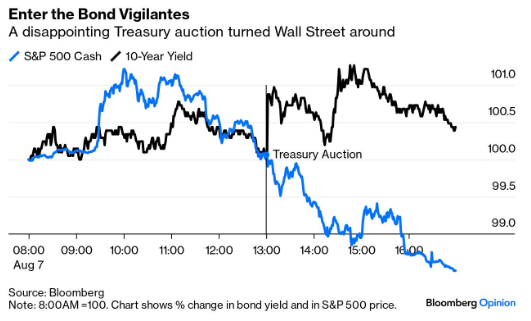
While central banks want to keep money tight, fiscal authorities want to keep it loose and spend more freely. That puts the US Treasury in conflict with the bond market. When so-called bond vigilantes think a government is spending too much, they go on strike, refusing to buy. That pushes up the yields at which bonds trade, and therefore the interest, that government must pay.
It was the bond vigilantes who doused the enthusiasm Wednesday as a poorly received Treasury auction sent yields upward again. As the chart to the right shows, that auction turned everyone around:
3YR AUCTION: The USD 58bln 3yr auction was rather average. The high yield of 3.810% stopped through the when issued by 0.2bps, vs the six auction average of on the screws, but not as strong as the prior 0.8bps stop through. The bid-to-cover of 2.55x was just a touch under the six auction average of 2.57x, and beneath the prior 2.67x. Dealer demand was a touch better than average, taking just 15.35% vs the average 16.5%, but not as strong as the prior 14.8%. There was a slight increase in indirect demand to 64.39% from 64.0%, relatively in line with the 65% average, while direct demand slipped marginally to 20.25% from 21.3%, but above the 18.5% six-auction average.
==> 10YR AUCTION: The 10yr auction was weak. The US Treasury sold USD 42bln of 10yr notes at a high yield of 3.960%, showing a whopping 3.1bp tail vs the 3.929% WI. The Bid-to-Cover of 2.32x was well beneath the prior and average of 2.58x and 2.52x, respectively. The breakdown saw dealers take an above-average 17.9%, while direct demand took a step back to 16% from 20.9%, beneath the 17.1% average. Indirect demand slipped marginally and was a touch beneath the six-auction average
==> 30YR AUCTION: Another woeful bond auction. The US sold USD 25bln of 30yr bonds at a high yield of 4.314%, showing a chunky 3.1bps tail vs the 4.283% WI. The 3.1bp tail is the largest tail since November, and even larger than the chunky prior month tail of 2.2bps. The Bid-to-Cover was more in line with last month's weak auction, but below the six auction average. Dealers took a chunky 19.18% of supply, above the 15.9% prior and 15.2% average, while direct bidders took a step back, taking just 15.5% of the supply, vs the prior 23.4% and average 18.4%. Indirect demand improved however, taking 65.32%, albeit still a touch beneath the six auction average.
- The TNX fell hard the prior week with the release of the US Treasury's Quarterly Refunding Announcement, comments from Fed Chairman Jerome Powell, ISM Manufacturing and Friday's highly disappointing Labor Report. The fall in yields continued on Monday with Yen Carry Trade movements before initiating a counter rally.
- We expect the open unfilled gap to be filled during this counter rally.
- The counter rally appears to be losing momentum as the 10 and 30Y Treasury Auctions last week were quite weak! The Bond Vigilante's are sending a clear message to the Fed that they are 100 bps behind the curve.
- We are labeling a tentative Alternative ABCDE count that is inline with the movements in the Real Rate Yields and Dollar (chart shown above).
|  | |
YOUR DESKTOP / TABLET / PHONE ANNOTATED CHART
Macro Analytics Chart Above: SUBSCRIBER LINK
| |
NOTICE Information on these pages contains forward-looking statements that involve risks and uncertainties. Markets and instruments profiled on this page are for informational purposes only and should not in any way come across as a recommendation to buy or sell in these assets. You should do your own thorough research before making any investment decisions. MATASII.com does not in any way guarantee that this information is free from mistakes, errors, or material misstatements. It also does not guarantee that this information is of a timely nature. Investing in Open Markets involves a great deal of risk, including the loss of all or a portion of your investment, as well as emotional distress. All risks, losses and costs associated with investing, including total loss of principal, are your responsibility.
FAIR USE NOTICE This site contains copyrighted material the use of which has not always been specifically authorized by the copyright owner. We are making such material available in our efforts to advance understanding of environmental, political, human rights, economic, democracy, scientific, and social justice issues, etc. We believe this constitutes a ‘fair use’ of any such copyrighted material as provided for in section 107 of the US Copyright Law. In accordance with Title 17 U.S.C. Section 107, the material on this site is distributed without profit to those who have expressed a prior interest in receiving the included information for research and educational purposes. If you wish to use copyrighted material from this site for purposes of your own that go beyond ‘fair use’, you must obtain permission from the copyright owner.
========
| |
MATASII'S STRATEGIC INVESTMENT INSIGHTS | |
2020 VIDEOS OUTLINING THE COMING RISE IN INFLATION, STAGLFLATION & COMMODITY PRICES | |
|
THE REGULATORY STATE
RELEASED - 01-17-24 --- 212 Page Paper
FULL 212 PAGE PDF DOWNLOAD
| |
IDENTIFICATION OF HIGH PROBABILITY TARGET ZONES | |
Learn the HPTZ Methodology!
Identify areas of High Probability for market movements
Set up your charts with accurate Market Road Maps
Available at Amazon.com
| |
The Most Insightful Macro Analytics On The Web | | | | |