|
LONGWave - JULY 2024
Technical Analysis - 08/18/24
| |
TRUE MONEY SUPPLY & THE RATE OF CHANGE OF LIQUIDITY
OBSERVATIONS: COMMODITIES ARE THE FIRST CASUALITIES OF GLOBAL CONFLICT
EXPANDING THEATERS & ESCALATION OF GLOBAL CONFLICT
We are presently witnessing:
- ISRAEL v HEZBOLLAH, HAMAS, HOUTHIS
- ISRAEL v IRAN - Waiting on Iran's Promised Retaliation for the Killing of Hamas’s political leader Ismail Haniyeh
- RUSSIA - UKRAINE - Incursions now into Russian Crimea
- NORTH KOREA + RUSSIA (Jointly supplying arms to Iran)
- SOUTH CHINA SEA & NATO EXPANSION - Canadian and other NATO Warships "patrolling" South China Sea
- NATO EXPANSION - To Include East Asian countries such as South Korea, Australia, New Zealand. New military alliances between Philippines, South Korea & US
- CHINA PREPARATION FOR CONFLICT - Recent 5 Year Plenary focused on "Fortress China" in preparation for threats of global conflict
- FACTIONS SUCH AS HOUTHIS ARMED WITH POWERFUL DRONES & MISSILES
BLOCKAGES, DISRUPTIONS LEAD TO SCARCITY
This occurs as a result of:
- Trade Conflicts, Tariffs and Currency Wars
- Global Shipping Choke Points
- Strategic Materials for Conflict & Warfare
COMMODITIES THE FIRST CASUALITIES OF CONFLICT
- COMMODITIES (Energy & Food)
- PRECIOUS METALS (Gold & Silver)
- CENTRAL BANK GOLD BUYING: Now broad based.
- PAPER ASSETS: As the Russians recently found, paper assets can easily and arbitrarily be confiscated. Therefore, gold will become necessary for them to trade. Gold means they don’t have to trust one another. Either that or they will go back to barter, which is both costly and inconvenient.
HISTORY:
- Since the days of the Bible, war has included burning crops, cutting down the enemy’s orchards, and even salting the fields where grain grows. That’s unlikely to change. Battles are won by soldiers; wars are won by controlling resources and commodities.
- Japan is a classic example. The country has no hydrocarbons, no metals, and few resources of any kind. When the US cut off their oil and steel supplies in 1941, they felt war, however risky, was the only their alternative.
TRADE & ASYMMETRIC / PROXY WARFARE
-
TRADE WARS: Most countries don’t produce much of anything locally anymore. The world turns on trade. If you cut off trade—a prime strategy during war—both exporting and importing countries are likely to suffer an economic collapse, or worse.
- Supply lines are now both highly complex and critically important to winning. And very easily cut with today’s military technology.
-
ASYMMETRIC & PROXY WARFARE: Doubtful (I hope) that is not Kinetic (Armed Conflict), but rather Asymmetric Warfare as I outlined in the 2020 Thesis Paper "Global Conflict".
| |
 | |
THIS WEEK WE SAW
Exp=Expectations, Rev=Revision, Prev=Previous
US
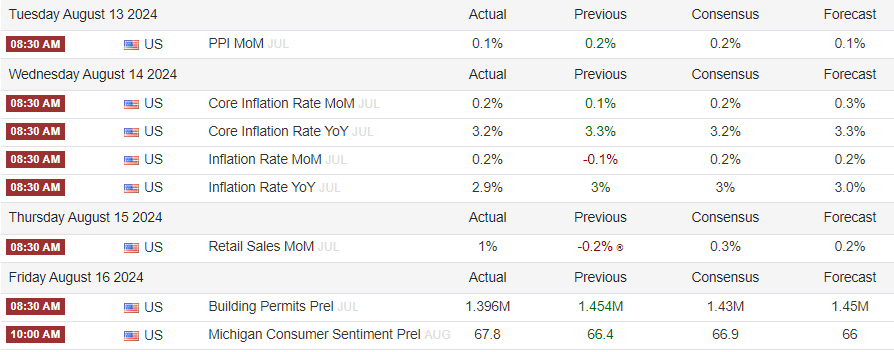
US PPI ex-Food/Energy MM (Jul) 0.0% vs. Exp. 0.2% (Prev. 0.4%, Rev. 0.3%)
US Core CPI MM, SA (Jul) 0.2% vs. Exp. 0.2% (Prev. 0.1%)
US Retail Sales MM (Jul) 1.0% vs. Exp. 0.3% (Rev. -0.2%)
US Initial Jobless Claims w/e 227.0k vs. Exp. 235.0k (Prev. 233.0k, Rev. 234k)
US Continued Jobless Claims w/e 1.864M vs. Exp. 1.875M (Prev. 1.875M, Rev. 1.871M
US CPI MM, SA (Jul) 0.2% vs. Exp. 0.2% (Prev. -0.1%)
US Core CPI YY, NSA (Jul) 3.2% vs. Exp. 3.2% (Prev. 3.3%)
- CYBER: The whole world runs on computers. Computers control utilities, transport, the banking system, communications, commerce, distribution and everything else. If computer networks are massively hacked it could collapse civilization. The result could be mass starvation after a couple of weeks.
- BIOLOGICAL: And, of course, there’s a real possibility of biological warfare. If any of these things happen, it increases the odds of all of them happening.
FINANCIAL ADVANTAGE
-
COUNTRIES ALREADY FINANCIALLY BROKE (Debt & Tax Levels):
- Along with unsupportable debt, and high levels of currency debasement, taxes are already at the 40%, 50% or 60% level for most countries. Before World War I and even before World War II, taxes, inflation, and debt were only a tiny fraction of present levels. Governments could access huge resources. Even though the world is much richer, it hardly seems possible now. They’re already running on empty.
- US can barely afford support of Ukraine or Israel
-
CURRENCY DEBASEMENT: Governments have debased their currencies to finance their wars. Prices of commodities always rise, with prices for war material leading the way.
| |
========================= | |
|
WHAT YOU NEED TO KNOW!
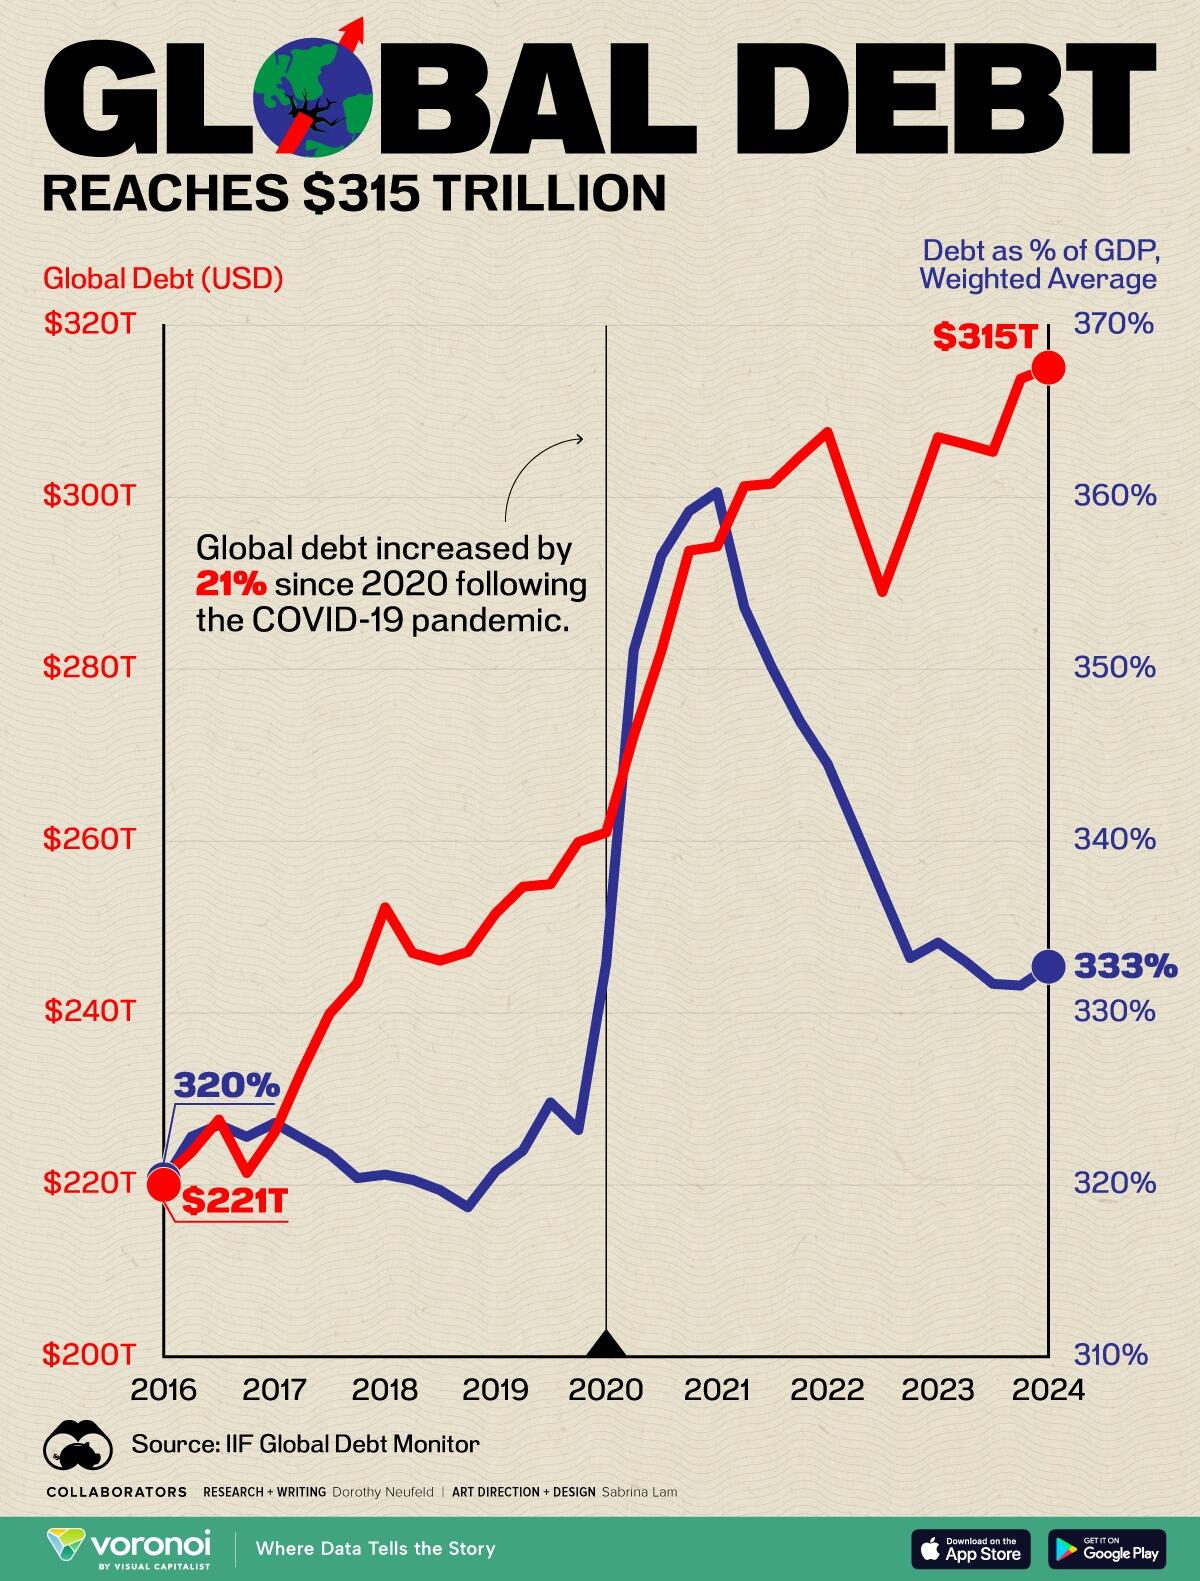
EXPLODING GROWTH OF GLOBAL DEBT
Global debt hit a new record in the first quarter of 2024, increasing by $1.3 trillion in just three months. While the U.S. and Japan were the largest contributors across advanced economies, China, India, and Mexico drove the largest share in emerging markets. Overall, the global debt-to-GDP ratio reached 333% as higher debt servicing costs and growing debt burdens continue piling up.
SINCE THE PANDEMIC debt has surged by 21%, adding $54.1 trillion to the global total. Today, the largest share of debt is held by non-financial corporations, at $94.1 trillion, while government borrowings follow closely behind at $91.4 trillion. Meanwhile, the financial sector holds $70.4 trillion in debt and households carry $59.1 trillion.
While stimulus measures fueled an influx of borrowing, it is leaving many economies in a more precarious state. Even more concerning is about a third of emerging markets have not recovered from the pandemic, with per capita income standing beneath levels seen in 2019. Over the quarter, debt held by emerging markets hit a record $105 trillion, climbing by $55 trillion over the last 10 years.
RESEARCH
TRUE MONEY SUPPLY (TMS) & RATE OF CHANGE OF LIQUIDITY
- The True Money Supply (TMS) tells us the key measure of Buying Pressure within the market.
- The trend now signals liquidity drying up. There may not be a recession, but monetary buying pressure is slowing down markedly. The tap is not closed, but the flow is now slow.
- The next wave of monetary excess will be more aggressive than the past one, that is guaranteed.
- That means markets will soar again. However, timing is key… and it may take a few painful months to arrive.
CONSEQUENCES OF A 3% INFLATION REALITY
- It takes a rate of US debt growth equal to twice the growth of needed nominal GDP.
- Assuming a target 3% REAL growth with 3% INFLATION (from above), it will require ~6% Nominal Growth.
- That will require (an expanding) ~12% growth rate in the US National Debt.
- That rate of growth in the national debt will likely mean it will be nearly impossible to keep Inflation below 3%!
| |
|
DEVELOPMENTS TO WATCH
THE PATH TO FIAT CURRENCY EXTINGUISHMENT
- The BOE’s new system moves away from excess reserve creation that is governed by the supply of government debt to one based on banks’ demand for reserves through repos. There lies the rub. The BOE is shifting away from a lender or dealer of last resort to one of first resort.
- This matters as it will inevitably lead to the BOE holding collateral of poorer quality than government debt outside of crises or their aftermath.
- The normalization of central-bank balance-sheet deterioration, and the banking and credit system’s zeal for creating collateral of poor or opaque quality (e.g. private credit), ensure fiat currencies will continue to bear the burden of asset-value depletion, with their real values facing years of further and unrelenting debasement.
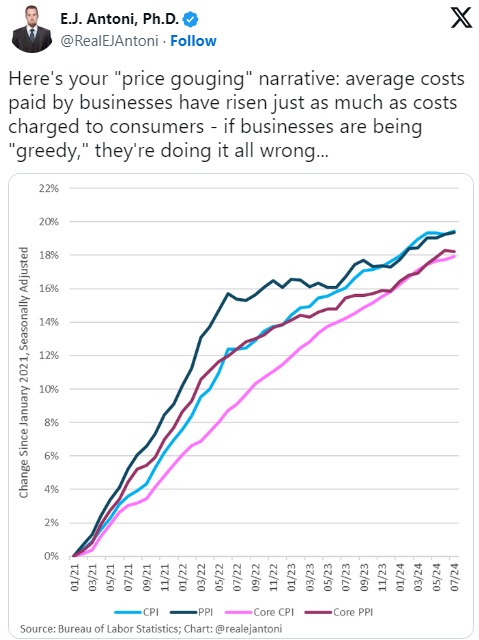
KAMALA HARRIS' ECONOMIC PLAN FOR "LOWERING COSTS FOR AMERICAN FAMILIES"
-
Highlights included:
- Price Controls to crack down on 'corporate price-gouging' in the food and grocery industries.
- A $25,000 subsidy for first-time home buyers, under which those who have a two-year history of on-time rent payments, would be eligible for "down-payment support"
- A cap on prescription drug costs
- The elimination of medical debt for millions of Americans
- Child tax credit that would provide $6,000 per child to families for the first year of a baby's life
| |
|
GLOBAL ECONOMIC REPORTING
US CPI/PPI
- CPI data was primarily in line with expectations, although when rounded, the numbers are a touch on the soft side. Headline CPI rose 0.155%, vs. the 0.2% expectation and prior -0.1%, with the Y/Y rising 2.9%, a touch beneath the 3.0% forecast and prior. Core metrics saw the M/M rise 0.165% vs. the 0.2% forecast and prior 0.1%. The Core Y/Y rose by 3.2%, in line with expectations and a touch beneath the prior 3.3%.
- Overall, the PPI data was cooler than expected. Headline PPI rose 0.1% M/M, beneath the 0.2% forecast and easing from the prior 0.2% pace with the Y/Y rising 2.2%, beneath the 2.3% forecast and down from the prior 2.7% (revised up from 2.6%). The Core metrics were also soft, with the headline unchanged at 0.0% M/M (exp. 0.2%, prev. 0.3%revised down from 0.4%), with Y/Y rising 2.4%, down from 3.0% in June and beneath the 2.7% consensus. It was also softer than all analyst forecasts with the lowest forecast penciling in 2.5%.
RETAIL SALES
- Retail Sales soared in August... thanks to massive historical revisions and a surge in Auto sales... but Auto production crashed by the most since COVID lockdowns (lowering GDP expectations)... and homebuilder sentiment slumped... and the Philly Fed business outlook plunged... and the Empire Fed Manufacturing survey remains in contraction for the 9th straight month... and import and export price inflation was hotter than expected... all of which sent the macro surprise index down to 2024 lows.
| |
|
In this week's "Current Market Perspectives", we focus on the signals that Sentiment, Fundamentals and various market Segments (Credit, Bond and Equity) are currently giving us.
=========
| |
|
1- TRUE MONEY SUPPLY (TMS) & RATE OF CHANGE OF LIQUIDITY
TRUE MONEY SUPPLY (TMS)
The True Money Supply (TMS) includes the currency component of M1, total checkable and savings deposits, as well as U.S. government deposits, note balances, and demand deposits from foreign banks and public institutions. Any market trader understands this when they are talking of “cash on the sides,” “high liquidity,” and “bullish sentiment.”. All these money measures, when rising, indicate stronger demand for risky assets looking for a return. Why are these measures more important than the traditional M2 and M3 money aggregates? Because they show us the level of buying pressure in the market.
- Many Keynesian economists see deposits and savings accounts as idle money and invented the ludicrous “excessive savings” concept.
- There is no such thing as excessive savings or idle money.
- The reason they see those savings as negative is because their political view of economics perceives that any money not spent by the government is not productive. Far from it. Those savings and deposits are invested in the capital markets and are the key to originating lending, investment, and growth in the real economy.
- Keynesians tend to think of the “social use of money,” which means more printing of currency through deficit spending, because they mostly perceive that the government is the only one making a real social use of currency issued.
- However, inflationism is not a social policy, but a tool for serfdom that creates hostage clients of citizens by destroying the purchasing power of their wages and deposit savings. It is a transfer of wealth from the middle class to the government.
|  | |
RATE OF CHANGE OF LIQUIDITY
Once we understand that what matters for market participants is the elusive “liquidity” and “sentiment” perception and that bullish sentiment and liquidity come from a rising true money supply, (while bearish signals arise from a decline in this measure of liquidity), then we can understand that the allegedly hawkish messages of central banks disguise a much looser policy than headlines suggest. We can therefore understand why market participants try to defend their clients from the current and future loss of purchasing power of the currency by taking more risk and accepting higher valuations for growth assets.
Most market participants are aware that higher liquidity injections will mask the current fiscal imbalances.
- Unsustainable deficit spending is money printing, which creates strong long-term pressure on the purchasing power of fiat currencies.
- Thus, market corrections are always an opportunity to buy stocks and risky assets that will normally rise in value in fiat currency terms, because the unit of measure, money, loses purchasing power.
- Once it is established that fiscal insanity will make currencies fall in value and, consequently, markets denominated in that currency rise, investors need to understand the timing and where to invest. The difficulty this time is that now we have persistent inflation and central bank losses in their bond portfolio.
Thus, timing is essential. The lag effect of a market correction and its subsequent bounce may be longer. It will happen, but we need to guess when.
| |
|
WHAT THE COMING RATE CUTS MAY MEAN
What can we learn ahead of the next bullish wave of money growth?
- First, pay attention to the components mentioned and their trends.
- Second, analyze when the Fed may start a true easing path, being realistic.
- Third, the trend now signals liquidity drying up. There may not be a recession, but monetary buying pressure is slowing down markedly. The tap is not closed, but the flow is now slow.
The Fed may cut rates in September, but that is only realizing that the economy is weaker than headlines suggest.
- A rate cut of 25 or 50 basis points is unlikely to generate an immediate burst in credit demand or rising deposits.
- Hence, the truly bullish signal would come when the Fed returns to purchasing mortgage-backed securities and treasuries.
- However, that may not happen until elections have passed and there is clarity about the next chairman of the Fed.
- We may be talking about March 2025.
Before that money growth bounces abruptly and leads to the next multiple expansion phase, we must remember the lessons of this correction.
- So-called defensive indices do not protect investors.
- Japan and Europe remain bad options in a liquidity draught.
- Cryptocurrencies do not show defensive qualities and their correlation to US tech stocks remains elevated.
- Gold is a better defense against a market correction than most risky assets, and commodities do not perform well in a slowing economy with diminishing liquidity.
Most investors will look at the recent slump with prudence, knowing they need to leave some dry powder, (less liquidity, less buying pressure), to take advantage of opportunities.
CONCLUSIONS
In this era of monetary insanity, ignoring the macroeconomic, geopolitical, and earnings’ realities may lead to excessive risk-taking and significant losses in a correction. We must consider the fundamentals when looking at buying opportunities and pay attention to when liquidity will flow back to capture the currency debasement trend that leads to the next bull market. It’s not easy. Risks accumulate slowly but manifest quickly, and we tend to blame one catalyst instead of the complacency built after years of fiscal and monetary excess.
The next wave of monetary excess will be more aggressive than the past one, that is guaranteed.
That means markets will soar again!
However, timing is key… and it may take a few painful months to arrive.
| |
|
2- CONSEQUENCES OF A 3% INFLATION REALITY
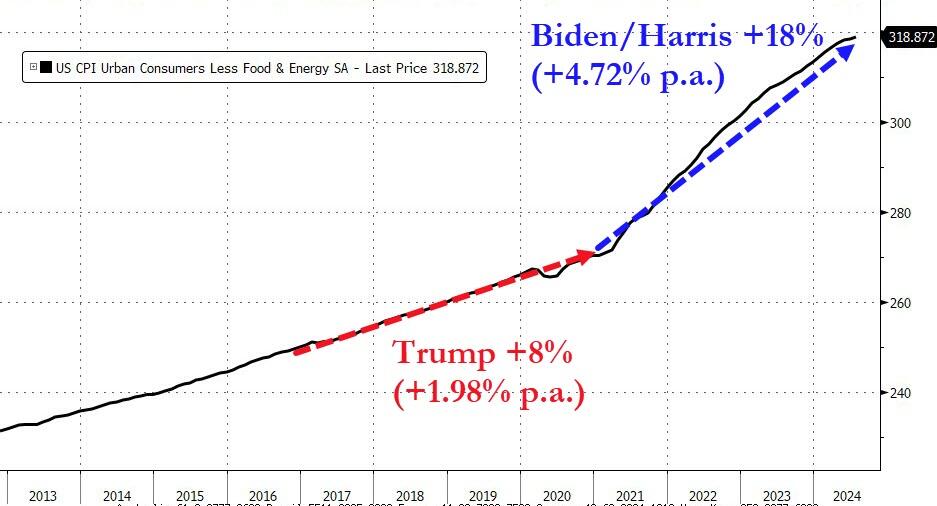
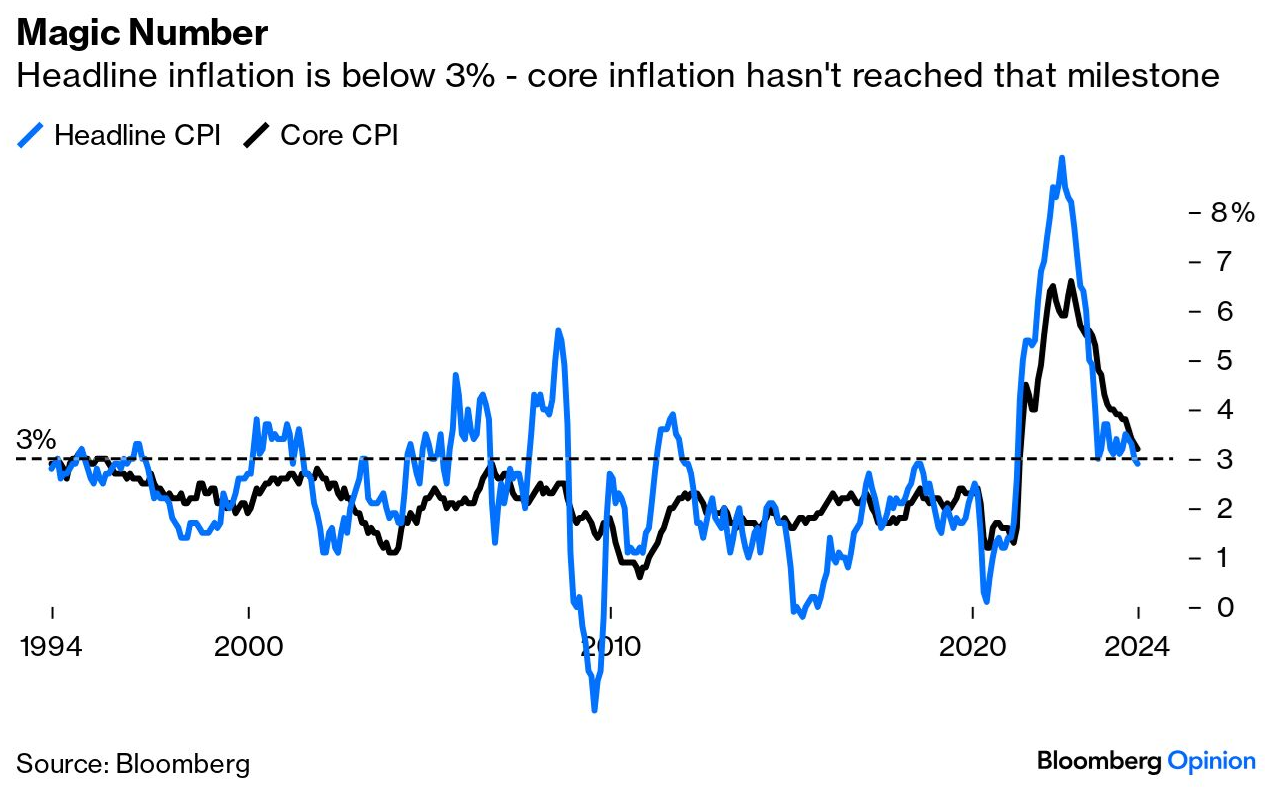
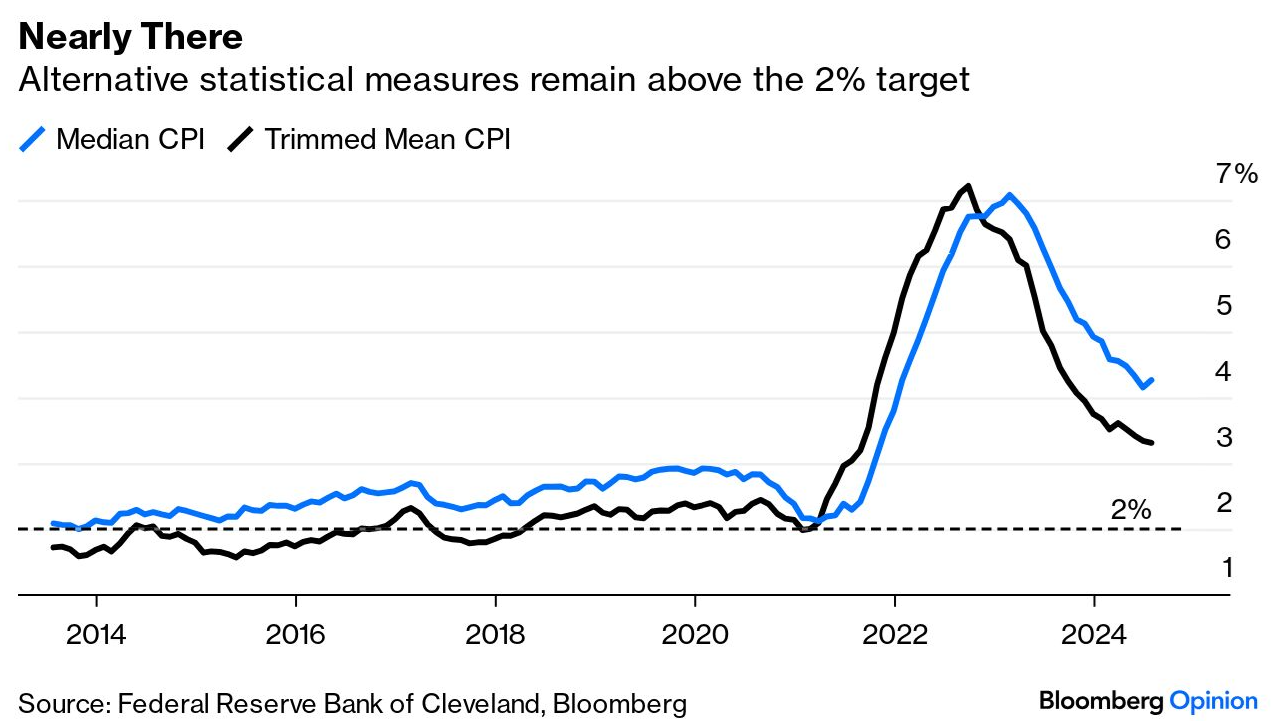
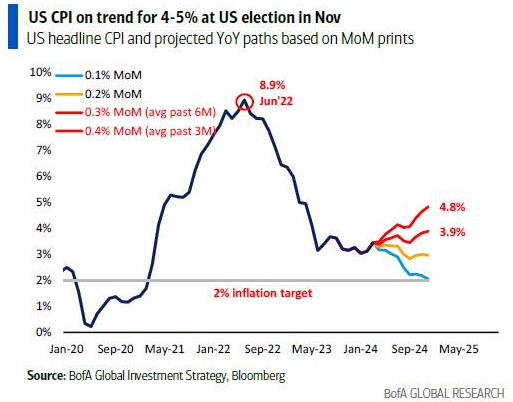
The US just published inflation data. They included a big breakthrough, with headline consumer price inflation dropping below 3% for the first time since 2021.
That’s the magic number putting price rises within the Federal Reserve’s official target range (one percentage point either side of 2%). That said, core inflation excluding food and fuel remains just above 3%. Before the current spike, it hadn’t been so high since 1994.
| |
The Cleveland Fed produces a median and trimmed mean, (which excludes outliers and averages the rest).
Neither has come down to 3%, and the median ticked up slightly, so this was less encouraging, but the trends currently appear to be in the direction the Fed wants and the markets' expectations.
Without going through a raft of Inflation numbers, it appears that 3% Inflation may be a number we see a lot of over then next few years - especially if fiscal deficits continue to expand.
|  | |
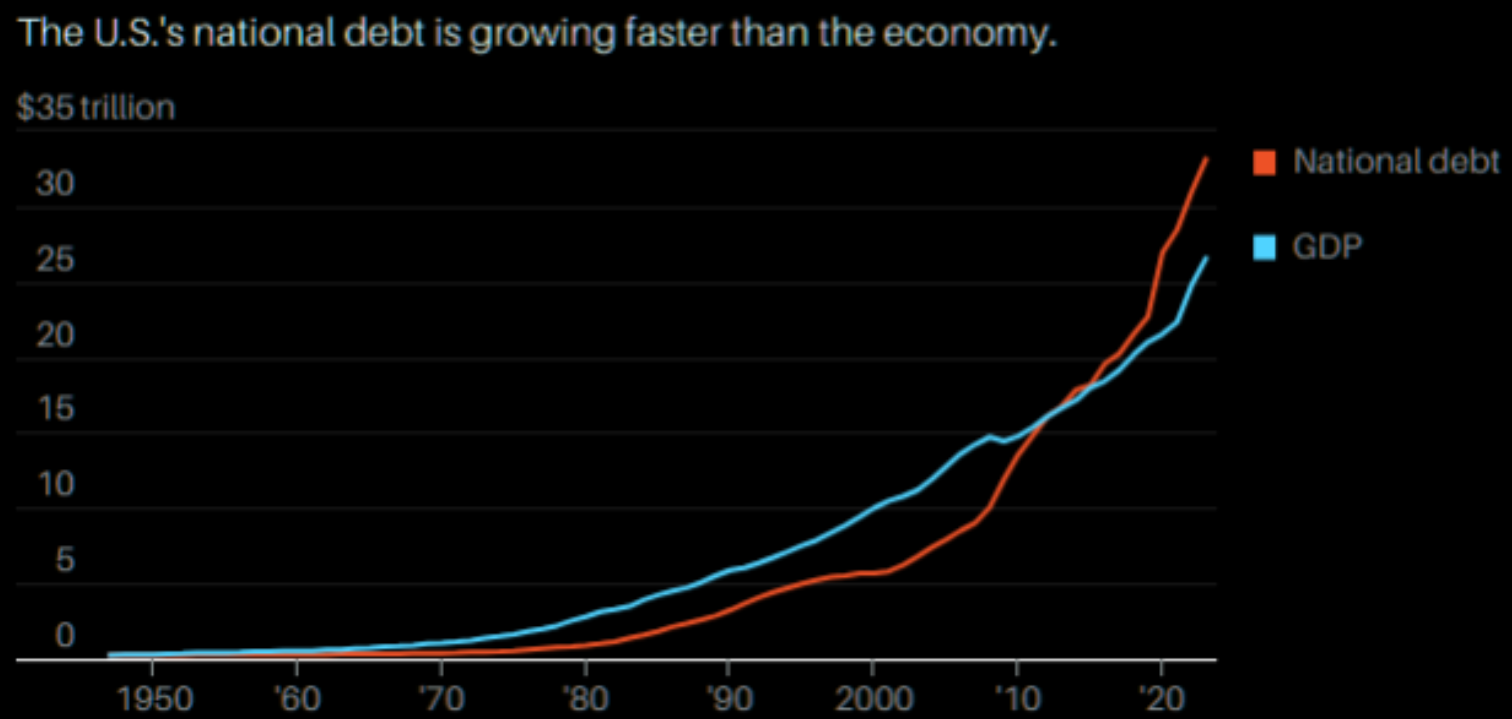
US NOMINAL GDP GROWTH
Over the last three years, the nominal growth in US GDP has been 14.2%.
U.S. GDP growth rate for 2023 was 6.30%
U.S. GDP growth rate for 2022 was 1.94%
U.S. GDP growth rate for 2021 was 5.95%
=======
14.2%
Over that same period, the US debt has grown due to $7.6T in excessive fiscal spending for a 28.2% growth = almost exactly the growth in nominal GDP growth.
In other words, it takes a rate of US debt growth equal to twice the growth of needed nominal GDP.
Assuming a target 3% REAL growth with 3% INFLATION (from above), it will require ~6% Nominal Growth.
That will require (an expanding) ~12% growth rate in the US National Debt.
That rate of growth in the national debt will likely mean it will be nearly impossible to keep Inflation below 3%!
| |
DEVELOPMENTS
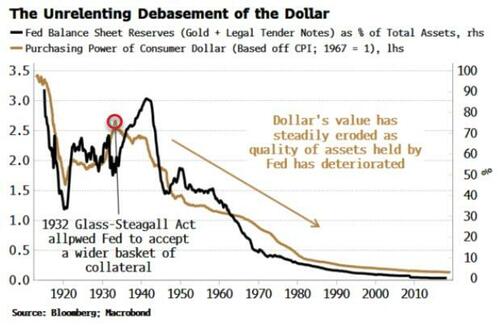
THE PATH TO FIAT CURRENCY EXTINGUISHMENT
As the amount of safe assets held by the Federal Reserve — such as gold, tender notes, and government and commercial bills — has fallen in relation to the size of its balance sheet, the purchasing power of the dollar has been relentlessly diminished. The chart to the right shows the long term correlation.
The growing problem is what will the central banks soon accept as collateral as the need to grow the Fed's asset base increases?
The Bank of England this week has shown where we may be headed. The BOE’s new “demand-led” system for reserves underscores how post-GFC, post-Covid central banking is ultimately fated to lead to further balance-sheet deterioration. As in the US, the BOE’s balance sheet has been persistently debased over the years in near lockstep with the real value of the pound.
The BOE’s new system moves away from excess reserve creation that is governed by the supply of government debt to one based on the banks’ demand for reserves through repos. There lies the rub. The BOE is shifting away from a lender or dealer of last resort to one of first resort.
This matters as it will inevitably lead to the BOE holding collateral of poorer quality than government debt outside of crises or their aftermath. As the bank says in a recent speech whose title says its all, "Let’s Get Ready to Repo!", it needs to accept a “broader range of assets” to make the system “usable for the widest range of firm business models.” This will normalize these types of assets being held on the BOE’s balance sheet (through one-week and six-month repo facilities).
The normalization of central-bank balance-sheet deterioration, and the banking and credit system’s zeal for creating collateral of poor or opaque quality (e.g. private credit), ensure fiat currencies will continue to bear the burden of asset-value depletion, with their real values facing years of further and unrelenting debasement.
| |
|
KAMALA HARRIS' ECONOMIC PLAN FOR "LOWERING COSTS FOR AMERICAN FAMILIES"
Vice President Kamala Harris unveiled several of her economic policies aimed at "lowering costs for American families," which she and her teleprompter presented at a Friday speech in North Carolina.
The highlights included:
-
Price Controls to crack down on 'corporate price-gouging' in the food and grocery industries
-
A $25,000 subsidy for first-time home buyers, under which those who have a two-year history of on-time rent payments would be eligible for "down-payment support"
- A cap on prescription drug costs
- The elimination of medical debt for millions of Americans
-
Child tax credit that would provide $6,000 per child to families for the first year of a baby's life, (after JD Vance suggested an increase from $2,000 per child to $5,000)
-
Efforts aimed at lowering the cost of rent and helping renters who are struggling financially, according to NBC News
- Harris also proposes plans to stop data firms from driving up lease rates, as well as stopping Wall Street firms from buying and flipping homes in bulk.
As part of the rollout:
1- Harris will call on Congress to pass the Preventing the Algorithmic Facilitation of Rental Housing Cartels Act, a bill introduced by Sens. Ron Wyden, D-Ore., and Peter Welch, D-Vt., that they said would prevent corporate landlords from using private equity-backed price-setting tools to raise rents dramatically in communities across the country.
2- Harris will also call on Congress to pass the Stop Predatory Investing Act, a bill introduced by Sen. Sherrod Brown, D-Ohio, and several other Democratic senators. The bill is designed to stop communities from being taken advantage of by Wall Street investors and distant landlords. The bill would curtail those practices by removing key tax benefits for major investors who acquire large numbers of single-family rental homes.
3- Harris will also call for the construction of three million new housing units via construction tax incentives - as well as a $40 billion proposal for local governments to build or preserve affordable housing units.
| |
|
GLOBAL ECONOMIC INDICATORS:
What This Week's Key Global Economic Releases Tell Us
| |
|
GLOBAL
WHAT DOES YOUR SCAN OF THE DATA BELOW TELL YOU? - THE MEDIA AVOIDS BAD NEWS!
We present the data in a way you can quickly see what is happening.
THIS WEEK WE SAW
Exp. =Expectations, Prev. =Previous
| |
|
UNITED STATES
- US PPI Final Demand MM (Jul) 0.1% vs. Exp. 0.2% (Prev. 0.2%)
- US PPI Final Demand YY (Jul) 2.2% vs. Exp. 2.3% (Prev. 2.6%, Rev. 2.7%)
- US PPI ex-Food/Energy MM (Jul) 0.0% vs. Exp. 0.2% (Prev. 0.4%, Rev. 0.3%)
- US PPI exFood/Energy YY (Jul) 2.4% vs. Exp. 2.7% (Prev. 3.0%)
- US CPI MM, SA (Jul) 0.2% vs. Exp. 0.2% (Prev. -0.1%)
- US CPI YY, NSA (Jul) 2.9% vs. Exp. 3.0% (Prev. 3.0%)
- US Core CPI MM, SA (Jul) 0.2% vs. Exp. 0.2% (Prev. 0.1%)
- US Core CPI YY, NSA (Jul) 3.2% vs. Exp. 3.2% (Prev. 3.3%)
- US Retail Sales MM (Jul) 1.0% vs. Exp. 0.3% (Rev. -0.2%)
- US Retail Control (Jul) 0.3% vs. Exp. 0.1% (Prev. 0.9%)
- US Industrial Production MM (Jul) -0.6% vs. Exp. -0.3% (Prev. 0.6%, Rev. 0.3%)
- US Manufacturing Output MM (Jul) -0.3% vs. Exp. -0.2% (Prev. 0.4%)
- US Capacity Utilization SA (Jul) 77.8% vs. Exp. 78.5% (Prev. 78.8%, Rev. 78.4%)
- US NY Fed Manufacturing (Aug) -4.7 vs. Exp. -6.0 (Prev. -6.6)
- US Philly Fed Business Index (Aug) -7.0 vs. Exp. 6.0 (Prev. 13.9)
- US Philly Fed Prices Paid (Aug) 24.0 (Prev. 19.8)
- US Philly Fed New Orders (Aug) 14.6 (Prev. 20.7)
- US Philly Fed Employment (Aug) -5.7 (Prev. 15.2)
- US Business Inventories MM (Jun) 0.3% vs. Exp. 0.3% (Prev. 0.5%)
- US NAHB Housing Market Index (Aug) 39.0 vs. Exp. 43.0 (Prev. 42.0, Rev. 41.0)
- US Export Prices MM (Jul) 0.7% (Prev. -0.5%, Rev. -0.3%)
- US Import Prices MM (Jul) 0.1% vs. Exp. -0.1% (Prev. 0.0%)
- US Initial Jobless Claims w/e 227.0k vs. Exp. 235.0k (Prev. 233.0k, Rev. 234k)
- US Continued Jobless Claims w/e 1.864M vs. Exp. 1.875M (Prev. 1.875M, Rev. 1.871M)
UK
- UK Employment Change (Jun) 97k vs. Exp. 3k (Prev. 19k)
- UK ILO Unemployment Rate (Jun) 4.2% vs. Exp. 4.5% (Prev. 4.4%)
- UK Claimant Count Unem Change (Jul) 135.0k (Prev. 32.3k, Rev. 36.2k)
- UK Avg Earnings (Ex-Bonus)(Jun) 5.4% vs. Exp. 5.4% (Prev. 5.7%, Rev. 5.8%)
- UK Avg Wk Earnings 3M YY(Jun) 4.5% vs. Exp. 4.6% (Prev. 5.7%)
- UK CPI YY (Jul) 2.2% vs. Exp. 2.3% (Prev. 2.0%); Services YY 5.2% vs. Exp. 5.5% (Prev. 5.7%); Core YY 3.3% vs. Exp. 3.4% (Prev. 3.5%)
- UK CPI MM (Jul) -0.2% vs. Exp. -0.1% (Prev. 0.1%); Services MM 0.5% vs. Exp. 0.8% (Prev. 0.6%); Core MM 0.1% vs. Exp. 0.2% (Prev. 0.2%)
- UK CPI YY (Jul) 2.2% vs. Exp. 2.3% (Prev. 2.0%)
- UK Core CPI YY (Jul) 3.3% vs. Exp. 3.4% (Prev. 3.5%)
- UK CPI Services YY (Jul) 5.2% vs. Exp. 5.5% (Prev. 5.7%)
- UK GDP Prelim QQ (Q2) 0.6% vs. Exp. 0.6% (Prev. 0.7%)
- UK GDP Prelim YY (Q2) 0.9% vs. Exp. 0.9% (Prev. 0.3%)
- UK GDP Estimate MM (Jun) 0.0% vs. Exp. 0.0% (Prev. 0.4%)
- UK GDP Estimate YY (Jun) 0.7% vs. Exp. 0.8% (Prev. 1.4%)
- UK Industrial Output MM (Jun) 0.8% vs. Exp. 0.1% (Prev. 0.2%, Rev. 0.3%)
- UK Industrial Output YY (Jun) -1.4% vs. Exp. -2.1% (Prev. 0.4%)
- UK Manufacturing Output MM (Jun) 1.1% vs. Exp. 0.1% (Prev. 0.4%, Rev. 0.3%)
- UK Manufacturing Output YY (Jun) -1.5% vs. Exp. -2.4% (Prev. 0.6%, Rev. 0.4%)
- UK Retail Sales MM (Jul) 0.5% vs. Exp. 0.5% (Prev. -1.2%, Rev. -0.9%); Retail Sales Ex-Fuel YY (Jul) 1.4% vs. Exp. 1.4% (Prev. -0.8%); Retail Sales Ex-Fuel MM (Jul) 0.7% vs. Exp. 0.8% (Prev. -1.5%, Rev. -1.3%); YY (Jul) 1.4% vs. Exp. 1.4% (Prev. -0.2%, Rev. -0.3%)
| |  |
|
EU
- EU ZEW Survey Expectations (Aug) 17.9 (Prev. 43.7)
- EU Employment Flash YY (Q2) 0.8% vs. Exp. 1.0% (Prev. 1.0%); Employment Flash QQ (Q2) 0.2% vs. Exp. 0.2% (Prev. 0.3%)
- EU GDP Flash Estimate YY (Q2) 0.6% vs. Exp. 0.6% (Prev. 0.6%); Flash Estimate QQ (Q2) 0.3% vs. Exp. 0.3% (Prev. 0.3%)
- EU GDP Flash Estimate QQ (Q2) 0.3% vs. Exp. 0.3% (Prev. 0.3%)
- EU GDP Flash Estimate YY (Q2) 0.6% vs. Exp. 0.6% (Prev. 0.6%)
- EU Industrial Production MM (Jun) -0.1% vs. Exp. 0.5% (Prev. -0.6%, Rev. -0.9%)
- EU Industrial Production YY (Jun) -3.9% vs. Exp. -3.0% (Prev. -2.9%, Rev. -3.3%)
- EU Employment Flash QQ (Q2) 0.2% vs. Exp. 0.2% (Prev. 0.3%)
- EU Employment Flash YY (Q2) 0.8% vs. Exp. 1.0% (Prev. 1.0%)
- EU Eurostat Trade NSA, Eur (Jun) 22.3B EU (Prev. 13.9B EU)
GERMANY
- German Wholesale Price Index MM (Jul) 0.3% (Prev. -0.3%)
- German Wholesale Price Index YY (Jul) -0.1% (Prev. -0.6%)
- German ZEW Economic Sentiment (Aug) 19.2 vs. Exp. 32.0 (Prev. 41.8)
- German ZEW Current Conditions (Aug) -77.3 vs. Exp. -75.0 (Prev. -68.9)
FRANCE
- French CPI (EU Norm) Final MM (Jul) 0.2% vs. Exp. 0.2% (Prev. 0.2%)
AUSTRALIA
- Australian Wage Price Index QQ (Q2) 0.8% vs. Exp. 0.9% (Prev. 0.8%)
- Australian Wage Price Index YY (Q2) 4.1% vs. Exp. 4.0% (Prev. 4.1%)
- Australian Consumer Sentiment (Aug) 2.8% (Prev. -1.1%)
- Australian NAB Business Confidence (Jul) 1.0 (Prev. 4.0)
- Australian NAB Business Conditions (Jul) 6.0 (Prev. 4.0)
- Australian Employment (Jul) 58.2k vs. Exp. 20.0k (Prev. 50.2k)
- Australian Full Time Employment (Jul) 60.5k (Prev. 43.3k)
- Australian Unemployment Rate (Jul) 4.2% vs. Exp. 4.1% (Prev. 4.1%)
- Australian Participation Rate (Jul) 67.1% vs. Exp. 66.9% (Prev. 66.9%)
JAPAN
- Japanese Corp Goods Price MM (Jul) 0.3% vs. Exp. 0.3% (Prev. 0.2%)
- Japanese Corp Goods Price YY (Jul) 3.0% vs. Exp. 3.0% (Prev. 2.9%)
- Japanese GDP QQ (Q2) 0.8% vs. Exp. 0.5% (Prev. -0.7%, Rev. -0.6%)
- Japanese GDP QQ Annualized (Q2) 3.1% vs. Exp. 2.1% (Prev. -2.9%, Rev. -2.3%)
INDIA
-
Indian CPI Inflation YY (Jul) 3.54% vs. Exp. 3.65% (Prev. 5.08%)
- Indian Industrial Output YY (Jun) 4.2% vs. Exp. 5.5% (Prev. 5.9%)
SWEDEN
- Swedish CPIF YY (Jul) 1.7% vs. Exp. 1.6% (Prev. 1.3%); Ex Energy YY (Jul) 2.2% vs. Exp. 2.0% (Prev. 2.3%)
SINGAPORE
- Singapore Non-Oil Exports MM (Jul) 12.2% vs. Exp. 2.2% (Prev. -0.4%)
- Singapore Non-Oil Exports YY (Jul) 15.7% vs. Exp. 1.2% (Prev. -8.7%)
CHINA
- Chinese Industrial Production YY (Jul) 5.1% vs. Exp. 5.2% (Prev. 5.3%)
- Chinese Retail Sales YY (Jul) 2.7% vs. Exp. 2.6% (Prev. 2.0%)
- Chinese Urban Investment (YTD) YY (Jul) 3.6% vs. Exp. 3.9% (Prev. 3.9%)
- Chinese Urban Unemployment Rate (Jul) 5.2% (Prev. 5.0%)
- Chinese House Prices YY (Jul) -5.0% (Prev. -4.5%)
| |
CURRENT MARKET PERSPECTIVE | |
|
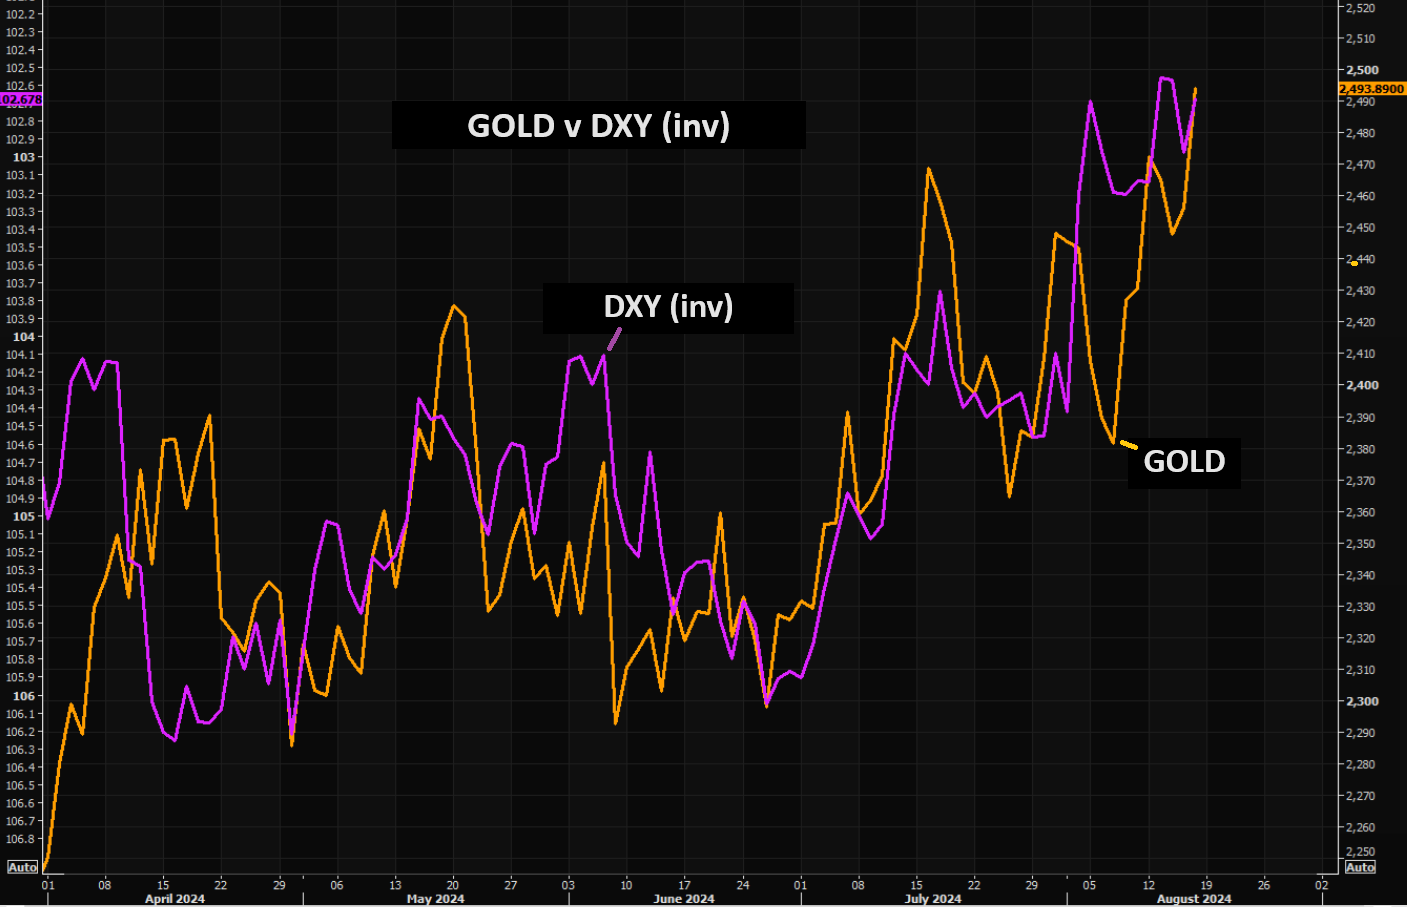
GOLD & DOLLAR MOVING TOGETHER
MARKETS PRICING IN SEPTEMBER RATE CUTS
Click All Charts to Enlarge
| |
GOLD, DOLLAR (inv): As Democrats surge ahead in Presidential polls the market senses a coming debt explosion. As a consequence, Gold and the DXY (inv) are moving together as Gold breaks consolidation range to the upside while the US Dollar begins weakening. | |
|
1 - SITUATIONAL ANALYSIS
NOTES FOR THE WEEK & FRIDAY CLOSE
- On the day, US markets were able to brush off weak Housing data, (looks like a bit of a drag from Hurricane Beryl), and underwhelming earnings from AMAT (closed -2%) to:
- Close out its best week of the year and
- 7th consecutive session in the green.
- US equities also soared this week to their best week of the year, led by a 5%-plus surge in the Nasdaq (up 12% from last Monday's lows).
- Nasdaq rallied up to a key technical resistance level - at its 50DMA and the last July high, which mirrors the rebound in Mag7 stocks (as they rallied up to the late-July highs, but couldn't break it).
- Small Caps were lifted by an ongoing short-squeeze.
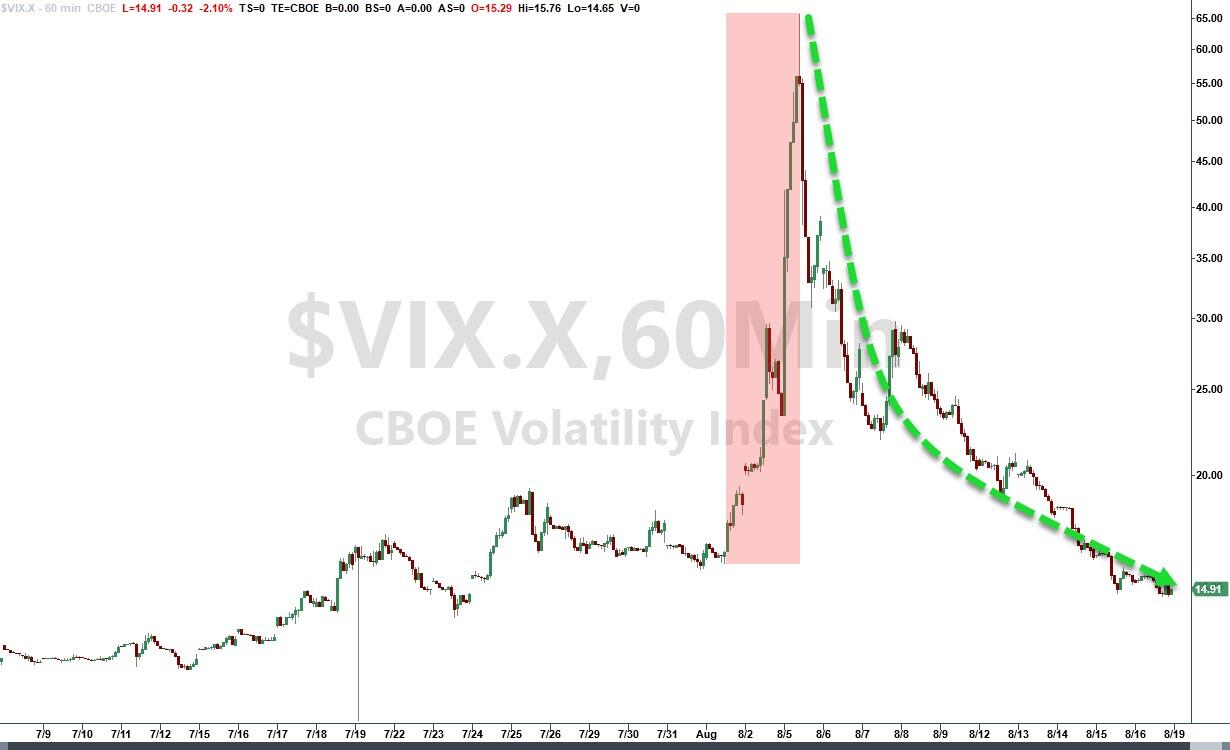
- VIX was clubbed like a baby seal on the week, extending its largest/fastest retracement ever.
| |
- The collapse of implied vol this week leaves a massive discount to the realized vol of the last month...
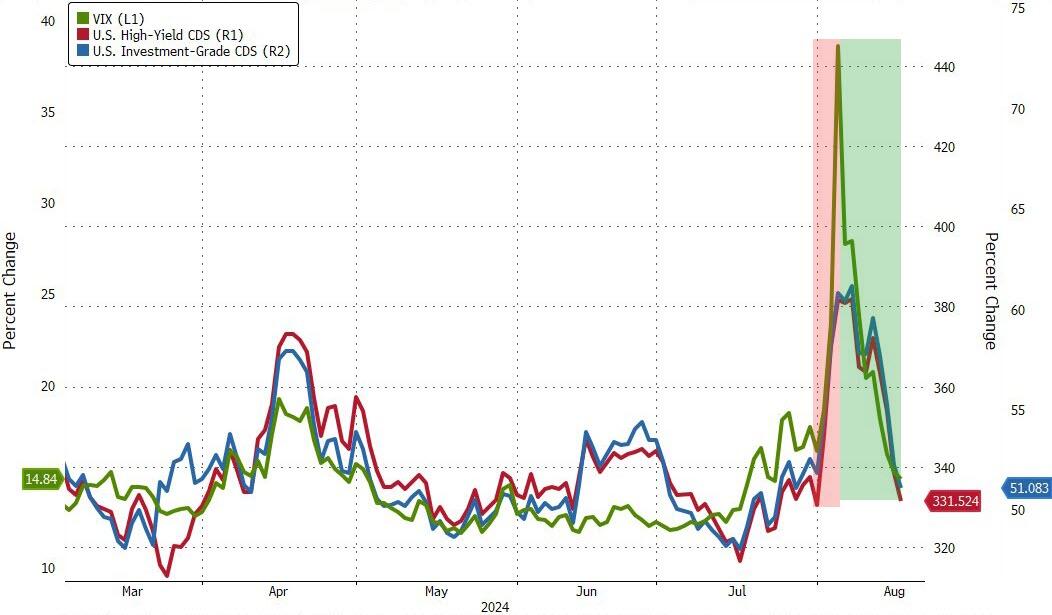
- Credit markets rallied hard this week, adjusting back from "hard landing" to "soft landing" scenarios.
| |
- Despite all the focus on jobless claims, CPI and retail sales, this week was actually a 'weak' one for US macro surprises and that sparked a hawkish drop in rate-cut expectations - back to pre-payrolls levels (less than 200bps of cuts to end-2025).
- That prompted weakness at the short-end (+1bps) of the Treasury curve on the week, (but the long-end ended 7bps lower on the week). The obvious shift was the bearish rise in yields after CPI.
- The yield curve flattened significantly on the week, with 2s10s re-inverting.
- Another choppy week for crypto, but today saw Bitcoin surge back up to $60,000 as Kamala spoke. to end the week unchanged.
- Oil prices were flat on the week after some volatile days.
- The other side of the AI-trade - copper - is not buying the euphoria in AI stocks.
- Also worth noting is that the yen carry trade was not fully embraced to lift stocks.
ASIDE
- We are sure it's just a coincidence, but on the day that Kamala Harris unveiled her price-fixing, vote-buying agenda for economic growth the dollar plunged to 5-month lows and gold soared to a record high, topping $2500 for the first time.
- Also, the plunge in the dollar and surge in stocks and gold all took place since Kamala overtook Trump in the prediction markets - All just coincidences?
| |
|
CHART RIGHT:
It's worth noting just how dramatically inverted the S&P 500's vol term structure is. With VIX liquidity at or near record lows, and gamma negative, there's still plenty of room for chaotic swings before NVDA's earnings.
| |
|
SENTIMENT
We have three supportive bids:
- The retail BTD
- The corporate buyback ($20-45 bn per week)
- The pension buy (approximately $40bn)
In addition to the above, you should consider that stabilizing markets could trigger volatility falling further, that eventually will lead to systematics buying equities - "if SPX moves 50 bps per day for a month they need to buy $170bn".
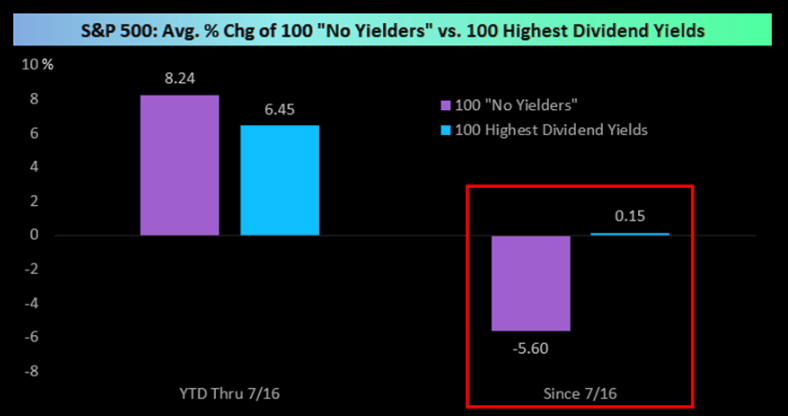
CHART RIGHT ABOVE: Additionally, since the S&P 500 peaked on July 16th, higher dividend paying stocks have been outperforming stocks that pay no dividends. As shown above right, there are exactly 100 stocks in the S&P that pay no dividend, and those stocks were down 5.6% on average from 7/16 through last Friday's close. Conversely, the 100 stocks in the index with the highest dividend yields were actually up slightly over the same time frame. If you're of the belief that interest rates will continue to fall on economic growth concerns, dividend stocks should do well in that environment.
CHART BELOW: A lot of investors don't trust this rally and still see it as a "Bear Trap".
| |
|
OBSERVATIONS WORTH NOTING
- $255 trillion: value of all global bonds & stocks today, up 2.5x since the 2008 GFC
- 6.0x: Wall St (asset prices) 6.0x the size of Main St (GDP), near all-time highs
- $313 trillion: size of global debt, now over 3x the value of world GDP
- 0: value of global debt with a negative yield, down from $18tn peak in 2020
- 100 days: US govt debt currently rising by $1 trillion every 100 days
- #1: US -- Accounts for 44% of global government bond market, 65% of global equity market
- #2: China -- 2nd largest govt bond market (14%), Japan 2nd largest equity market (12%)
- 46%: Bank of Japan owns close to half of all outstanding JGBs, up from 8% in 2008
- -54%: peak-to-trough loss in US 30-year Treasury bond over past 4 years
- 2020s: top-performing assets…US stocks (14% p.a.), commodities (12%), gold (11%)
- $125tn: global stock market capitalization, up almost 4x since GFC lows of 2008
- 20%: Europe & Japan's combined share of global equity market…was 39% in 2008
- 81%: US share of the $19tn market cap of global tech sector
- $10.4tn: market cap gain of “Magnificent 7” stocks in past 18 months
- 27%: top 5 stocks as % of S&P 500 market cap (was 18% at dotcom bubble peak)
- $544bn: market cap of SPY, world's largest ETF (was $58bn in 2004)
- -10.4%: annualized return of China equities past 4 years (worst-performing index)
- 12.3%: annualized return of Indian equities past 20 years (best-performing index)
| |
|
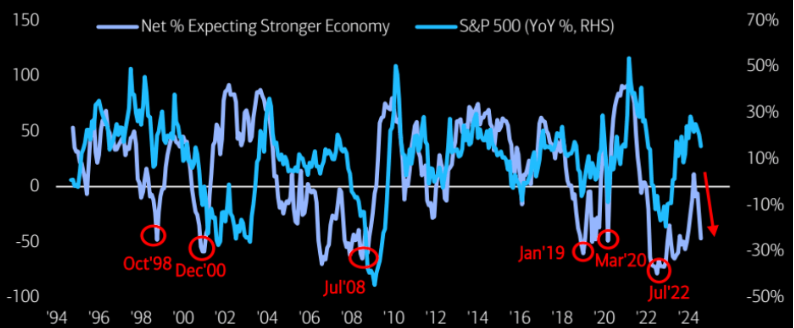
GROWTH NOW MATTERS
The narrative is now fully shifting towards whether the economy is slowing quicker than the Fed will react, and as such traders put more weight on retail sales than on this month's CPI.
The technical levels that would flip Wall St narrative from soft to hard landing have not been broken.
- 4% on 30-year Treasury
- 400bps on HY CDX
- 5050 on S&P500
All good news so far, but important now for stock leaders SOX (4600) & big tech XLK (200) to hold 200dma levels.
If levels break, traders then target 2021 highs (i.e. 10% lower).
CHART BELOW
Global growth expectations in the August survey fell a sharp 20ppt from July ...a net 47% of survey respondents expect a weaker global economy in the next 12 months.
| Growth has taken over as a driver of risk appetite and is becoming more important driver than monetary policy/inflation. | |
|
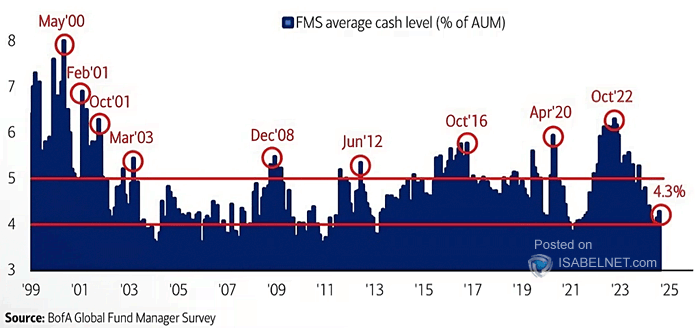
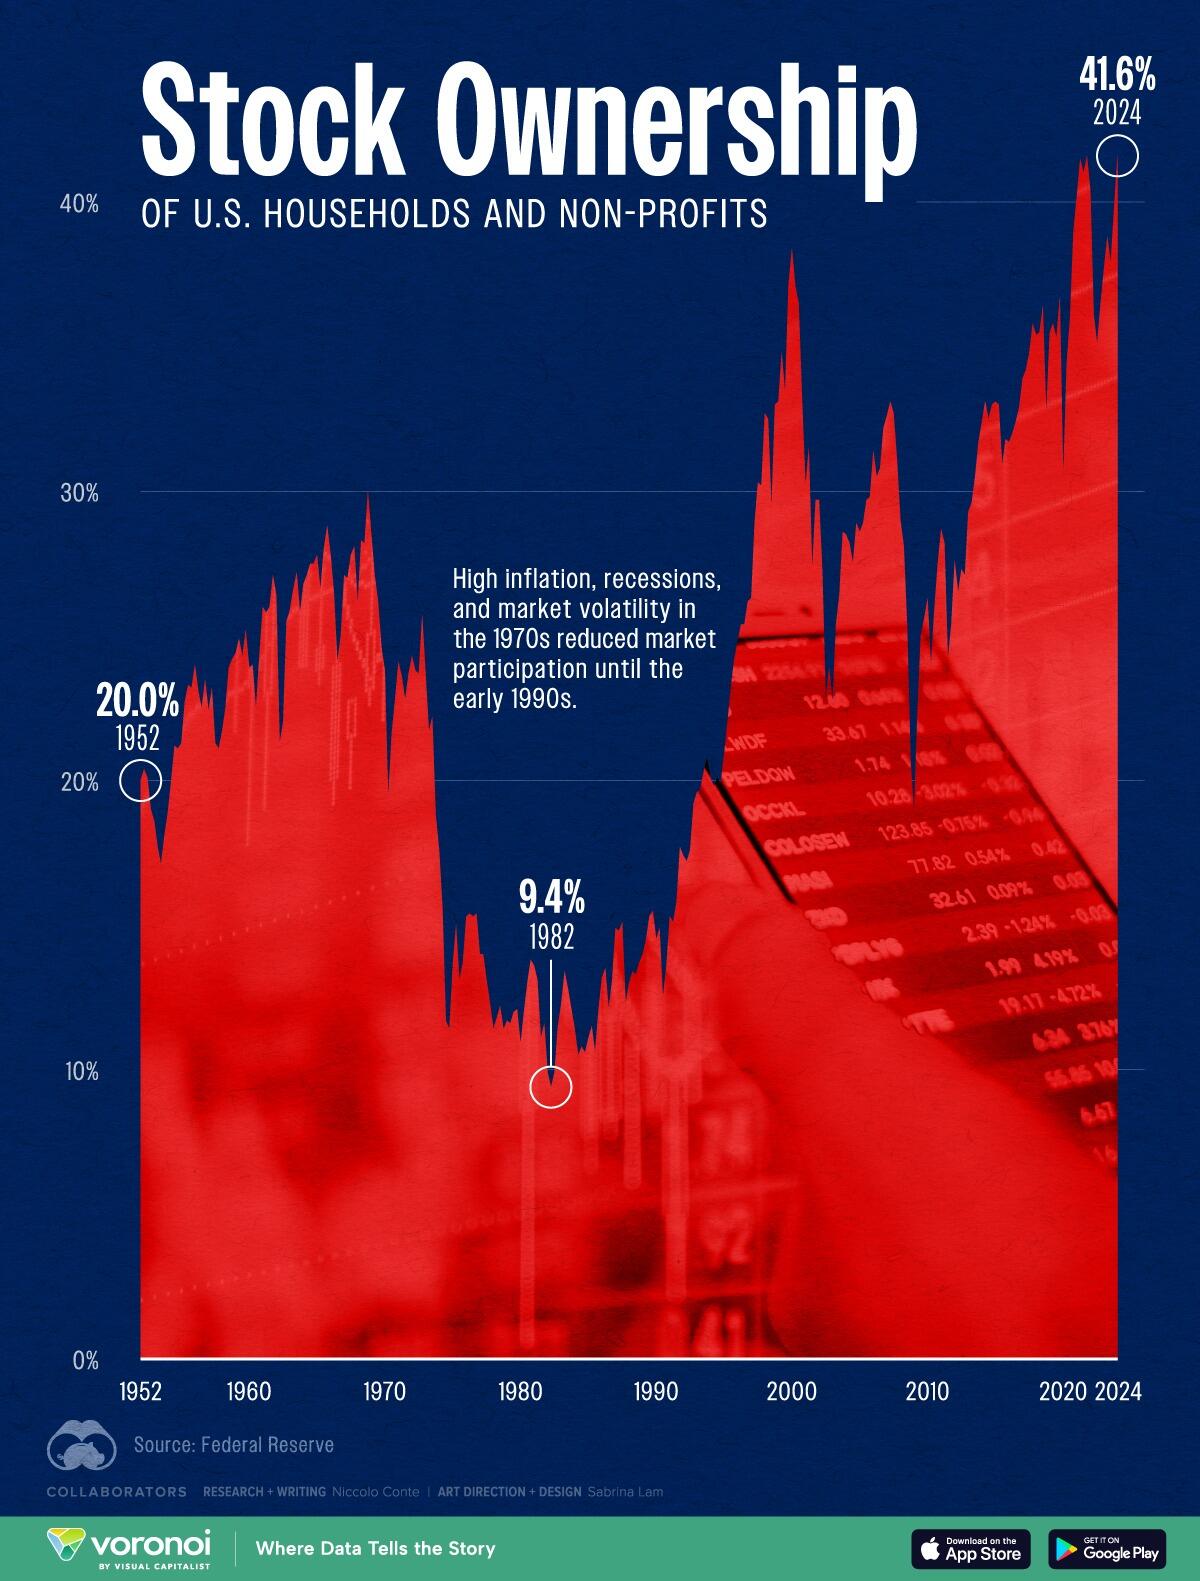
STOCK OWNERSHIP: The proportion of Americans’ financial assets invested in public stocks is nearing record highs, just shy of the peak seen in 2021. Investor confidence, a strong U.S. economy, and superior historical performance over the last several decades is driving allocations to equities. In 2024, 41.6% of U.S. households’ financial assets are tied to the stock market.
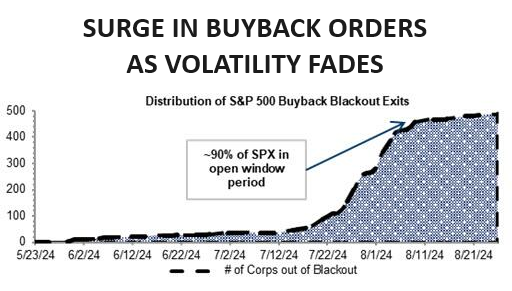
CHART BELOW: When the public is all in (chart above), Fund Managers have extremely low cash levels (chart right) and Corporate Buybacks using borrowed money are the primary market buyers left (chart below) ... it is historically a bad Omen and like Warren Buffett, time to lighten-up on Equity holdings.
| |
|
|
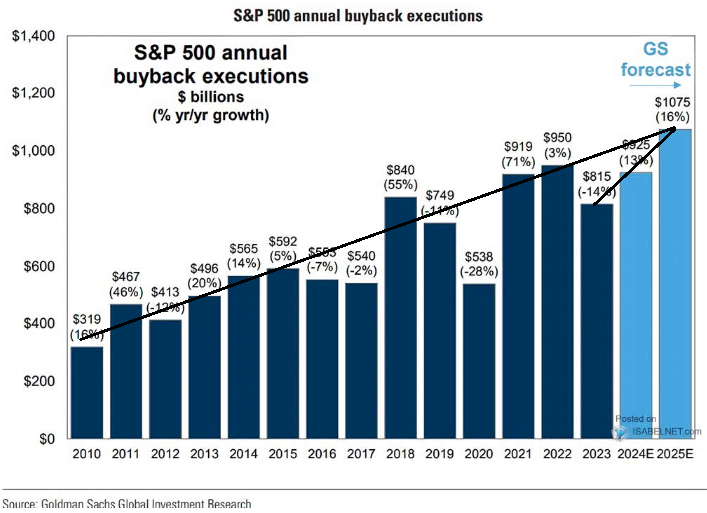
Goldman Sachs predicts a substantial rise in S&P 500 share buybacks throughout 2024 and 2025.
This growth is currently expected to be fueled by continued strong earnings from technology companies and improved financial conditions.
| |
|
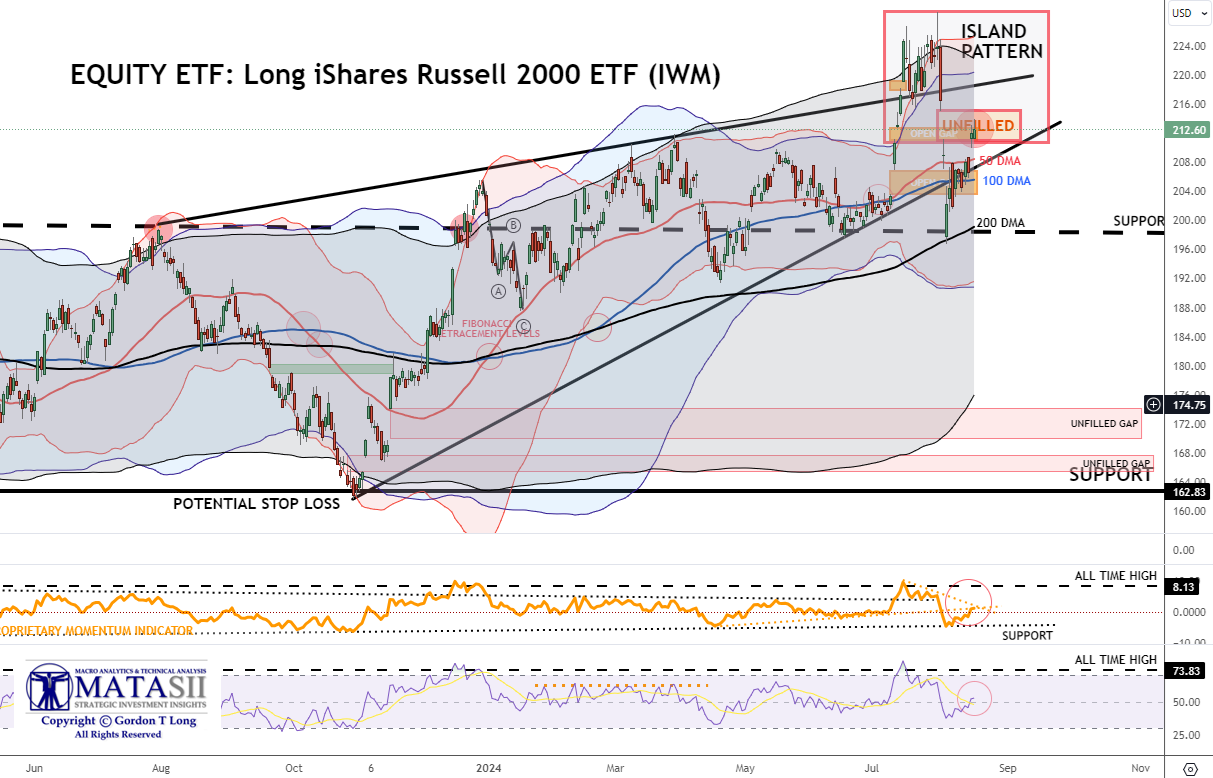
EQUITY ETF - RUSSELL 2000 (IWM)
WATCH THE RUSSELL 2000 FOR MARKET DIRECTION
ISLAND FORMATION: When the markets sold-off two weeks ago, it left the Russell (IWM) with a very Bearish Island Formation. After finding support at the 200 DMA, the IWM has quickly retraced half of the initial drop and closed Friday in the midst of closing the Island Formation's unfilled Gap (see chart below).
WHAT TO WATCH FOR
- Will Momentum (middle pane) break the current overhead resistance level (dotted orange trend line)?
- If momentum breaks overhead resistance, price may run much higher as momentum is likely to want to test long term overhead resistance as shown by the black dash trend line.
- Will price then fill the unfilled gap and therefore erase the Island Formation?
- Will price then test the underside of the ending diagonal triangle (in black) as overhead resistance?
- Will price then rise to put in a Double Top?
- Any of these could mark a major long term top for the mark. A break of a double top means the Bull market does not see a recession and the bull market has a lot further to run!
|  | |
YOUR DESKTOP / TABLET / PHONE ANNOTATED CHART
Macro Analytics Chart Above: SUBSCRIBER LINK
| |
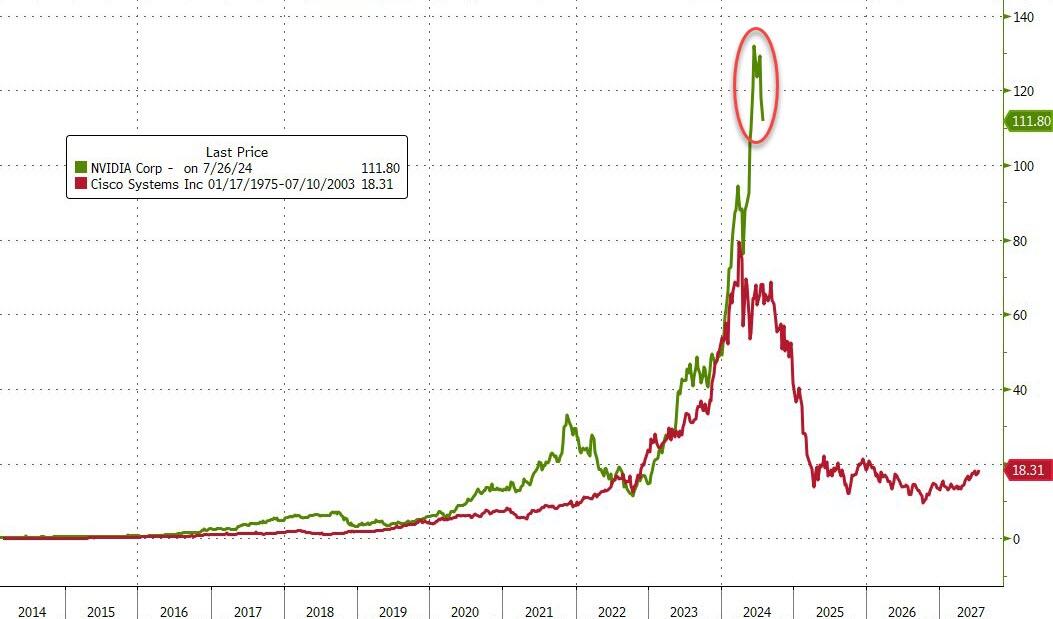
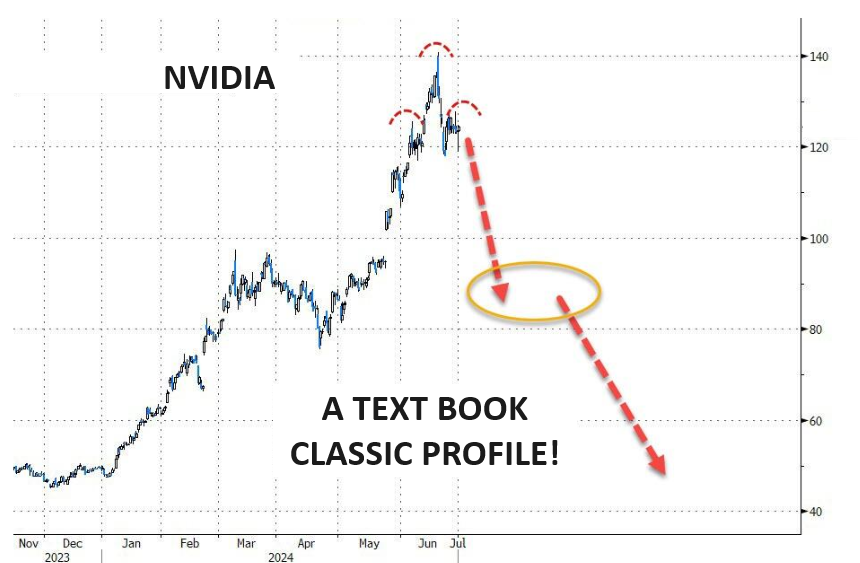
As goes NVDA, so goes the MAG-7, As Goes Mag-7 so goes The Market.
| |
CHART RIGHT: NVDA v the dominant darling CSCO of the Dotcom Bubble (for those who recall). | | |
| |
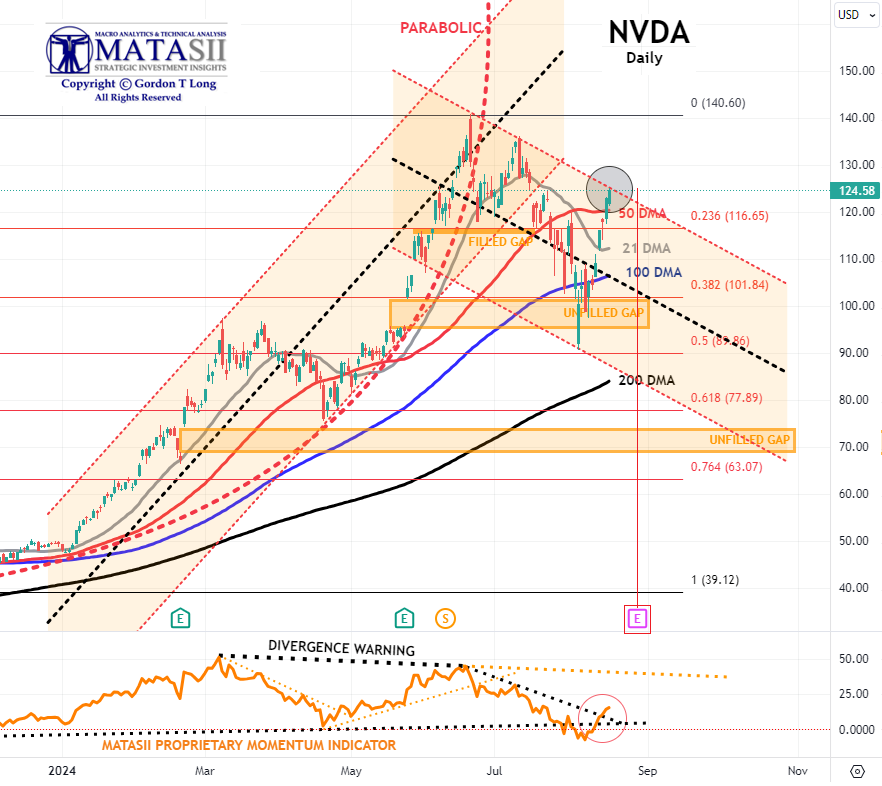
- NVDA has decidedly broken above the 50 DMA to the upper bound of the current downward trend channel.
- The MATASII Proprietary Momentum Indicator (lower pane) has also broken through its longer term support with a short term Momentum line (Dotted descending Orange Line) above it to act as overhead resistance.
- The upcoming Wednesday August 28th Earnings release date will be very important for not only NVDDA but the market overall.
- The Dotted Black Trend line in the MATASII Proprietary Momentum Indicator, (lower pane below), has been signaling this sell-down was coming for some time now.
- Divergence is normally seen as a warning to the downside and is still ahead if the Divergence isn't removed by a movement higher in Momentum.
- At some point, the major unfilled gaps (at much lower levels) must be filled. NVDA therefore may no longer become a Short to Intermediate Long Term hold, but rather a position trading stock as other competitors enter the space and force margins and the earnings growth rate contracts.
| |
|
YOUR DESKTOP / TABLET / PHONE ANNOTATED CHART
Macro Analytics Chart Above: SUBSCRIBER LINK
| |
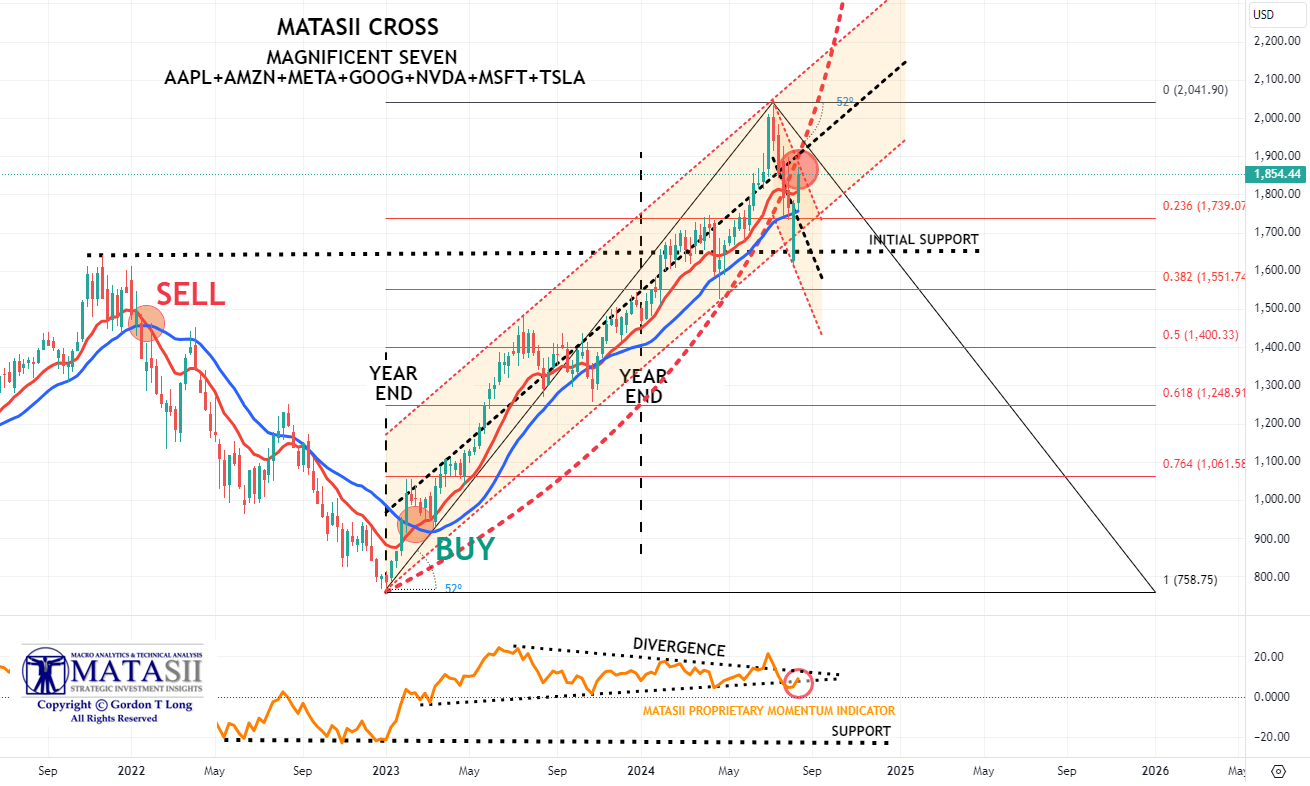
MAGNIFICENT 7
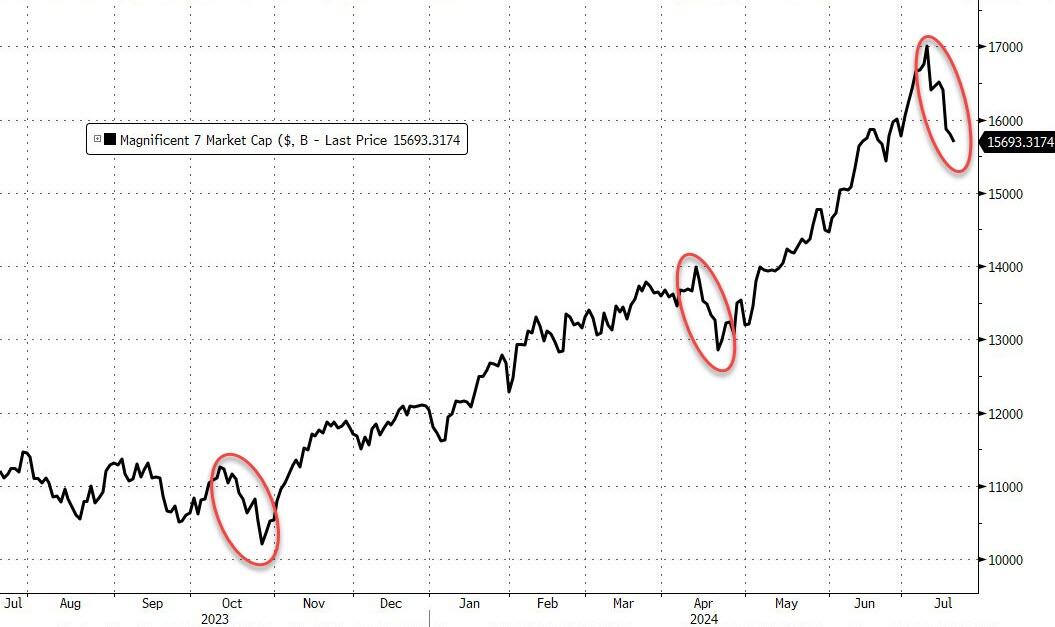
The Magnificent 7 stocks are now down an incredible $2.3 trillion market cap from their record highs.
- The basket of 'Magnificent 7' stocks bounced hard off near term support at the black dotted line labeled "initial Support" line on our chart below.
- The Intermediate Momentum Indicator trend line (Lower pane) also offered support, before being broken and is now testing the underside as temporary overhead resistance.
- As we said in our last report: "A brief counter rally may ensue next week, but it is highly likely that Longer term Momentum Support (lower pane black dashed line) will soon be tested".
- Continued caution is advised since major global "Dark Pools" have been identified as presently operating behind the scenes on the Mag-7.
| |
|
YOUR DESKTOP / TABLET / PHONE ANNOTATED CHART
Macro Analytics Chart Above: SUBSCRIBER LINK
| |
"CURRENCY" MARKET (Currency, Gold, Black Gold (Oil) & Bitcoin) | |
|
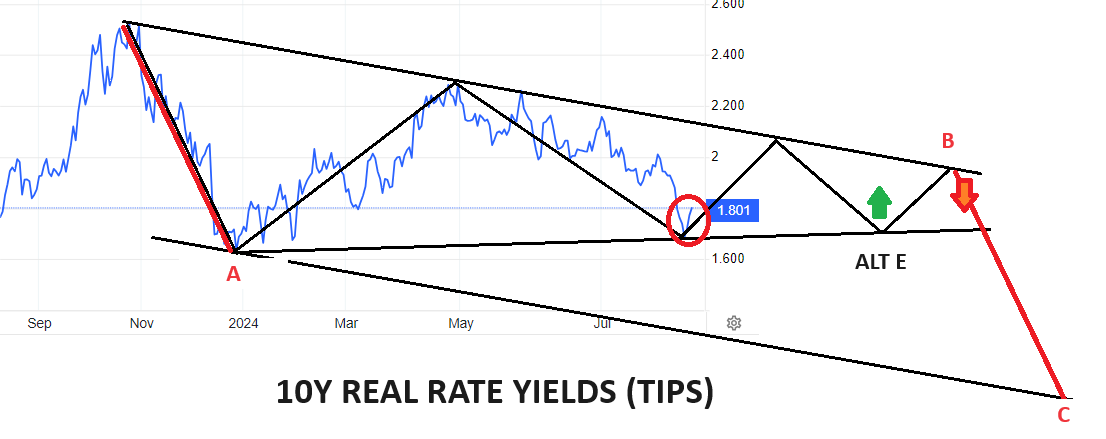
10Y REAL YIELD RATE (TIPS)
Real Rates bounced-off our lower support trend line, which gives us confidence with the two alternative counts that could occur, (shown in the chart to the right- as of close week ending 08/09/24). (LATEST)
NOTE: Gold is suggesting it will be resolved by the red line (chart right) with a fall in real rates (chart lower right) with rising Gold prices.
| |
CONTROL PACKAGE
There are TEN charts we have outlined in prior chart packages, which we will continue to watch closely as a CURRENT Control Set:
-
US DOLLAR -DXY - MONTHLY (CHART LINK)
-
US DOLLAR - DXY - DAILY (CHART LINK)
-
GOLD - DAILY (CHART LINK)
-
GOLD cfd's - DAILY (CHART LINK)
-
GOLD - Integrated - Barrick Gold (CHART LINK)
-
SILVER - DAILY (CHART LINK)
-
OIL - XLE - MONTHLY (CHART LINK)
-
OIL - WTIC - MONTHLY - (CHART LINK)
-
BITCOIN - BTCUSD - WEEKLY (CHART LINK)
-
10y TIPS - Real Rates - Daily (CHART LINK)
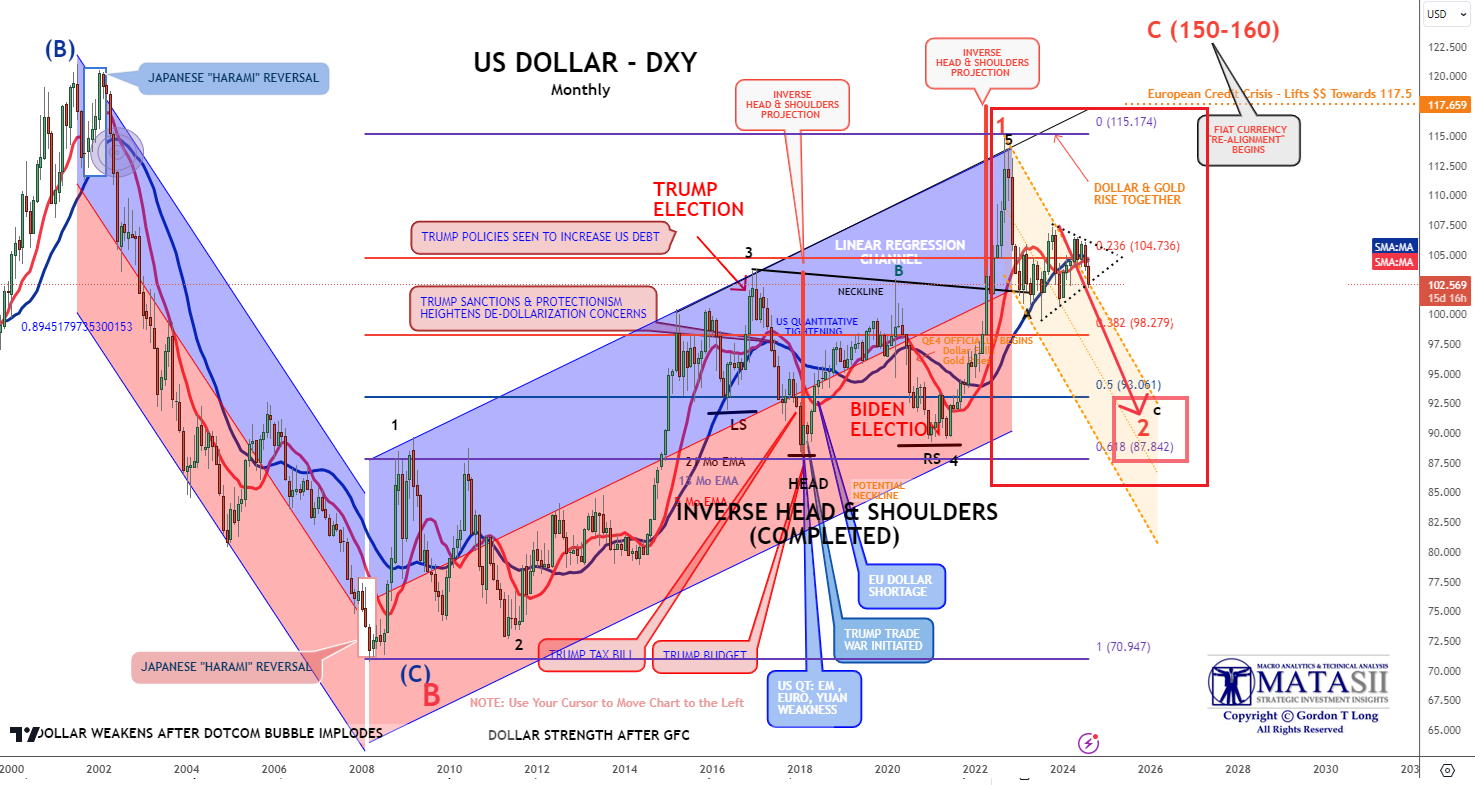
US DOLLAR - DXY - Monthly
CURRENT
- The Dollar should now be expected to fall with expectations for Fed Rate cuts.
- There are key lower support levels shown below (and on the more detailed Daily chart we showed in prior newsletters) that should be expected to offer important support.
| |
|
YOUR DESKTOP / TABLET / PHONE ANNOTATED CHART
Macro Analytics Chart Above: SUBSCRIBER LINK
| |
|
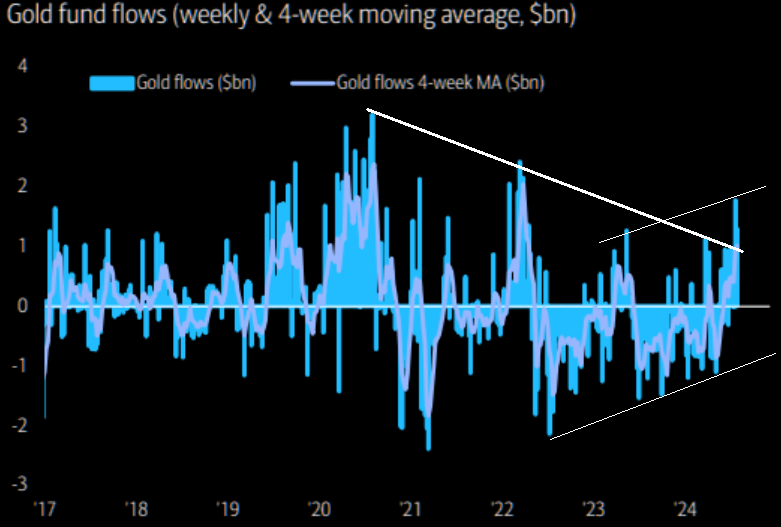
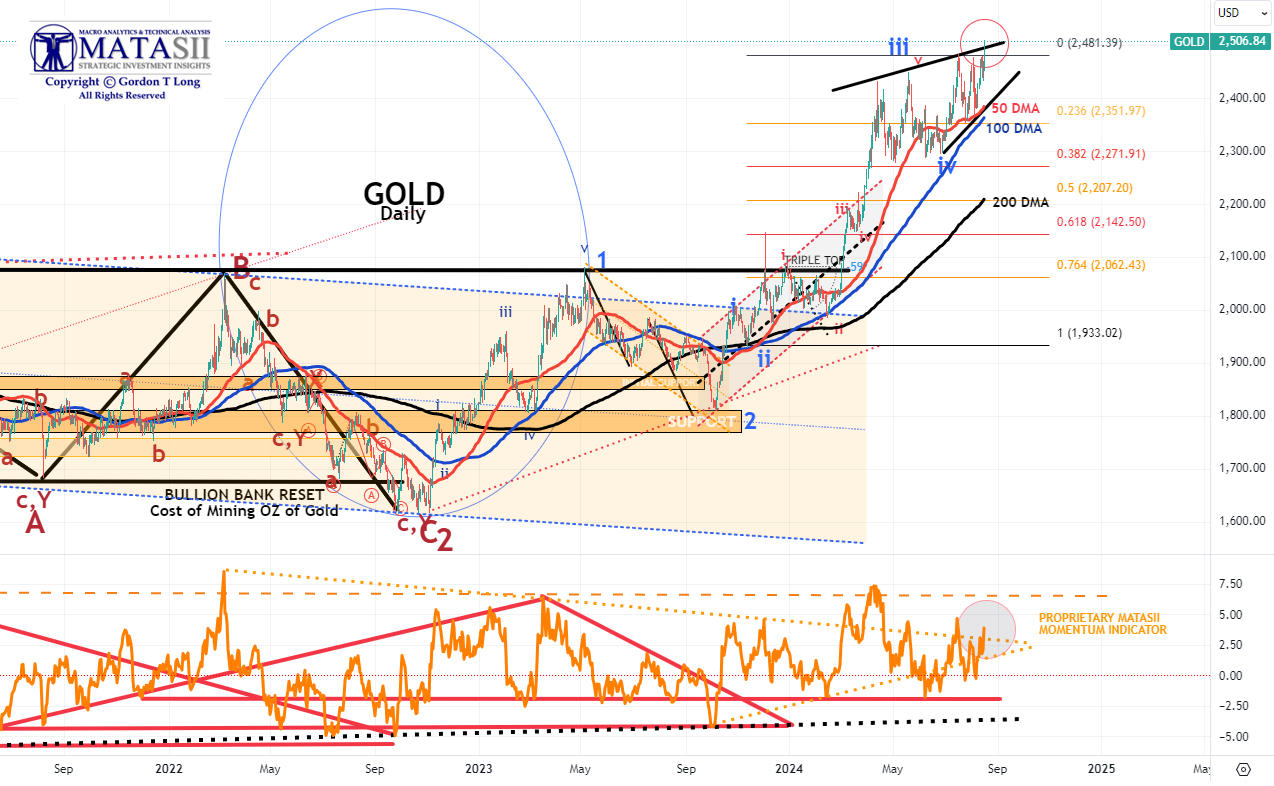
GOLD
CHART RIGHT:
We have just experienced the biggest 2-week inflow to gold since March '22.
CHART BELOW
- Gold tested and broke through its overhead resistance line (black line).
- We are beginning to get the initial framework of a rising triangle which suggests gold (if true) may be reaching towards an Intermediate term high. The Macro suggests otherwise with the dollar continuing to fall and Real Rates weakening.
- Also, the MATASII Proprietary Momentum Indicator (Lower pane) was within a "momentum wedge" which has been broken to the upside.
| |
|
YOUR DESKTOP / TABLET / PHONE ANNOTATED CHART
Macro Analytics Chart Above: SUBSCRIBER LINK
| |
|
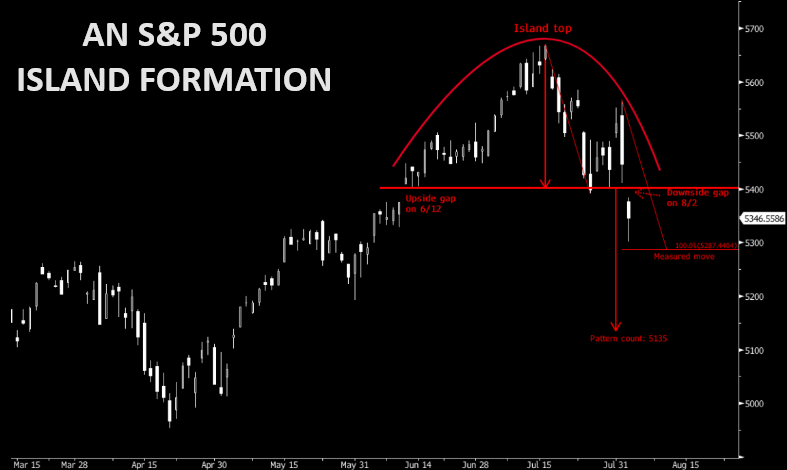
CONTROL PACKAGE
CHART RIGHT: Beware of the Island top Formation pattern in the SPX with downside projections at 5287 (measured move) and 5135 (pattern count).
There are FIVE charts we have outlined in prior chart packages that we will continue to watch closely as a CURRENT "control set":
-
The S&P 500 (CHART LINK)
-
The DJIA (CHART LINK)
-
The Russell 2000 through the IWM ETF (CHART LINK),
-
The MAGNIFICENT SEVEN (CHART ABOVE WITH MATASII CROSS - LINK)
-
Nvidia (NVDA) (CHART LINK)
| |
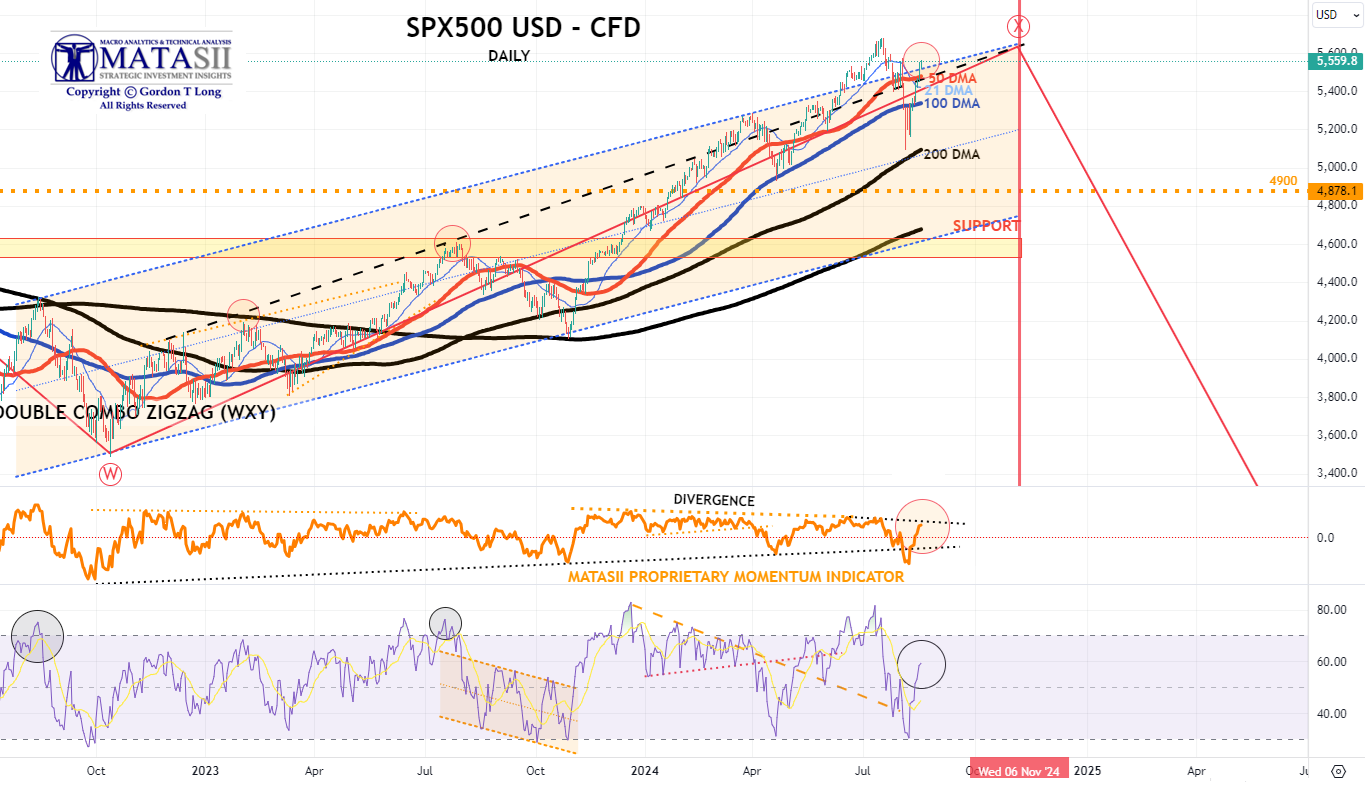
S&P 500 CFD
- The S&P 500 cfd has broken decidedly higher on dollar weakness. Many wonder if this is a Bear Market trap often accompanying a major sell-off? A sell-off that didn't test the 200 DMA?
- The MATASII Proprietary Momentum Indicator (middle pane) is currently rising again and is testing its overhead resistance level (the dotted orange trend line ) as part of a large wedge that appears soon to end.
| |
YOUR DESKTOP / TABLET / PHONE ANNOTATED CHART
Macro Analytics Chart Above: SUBSCRIBER LINK
| |
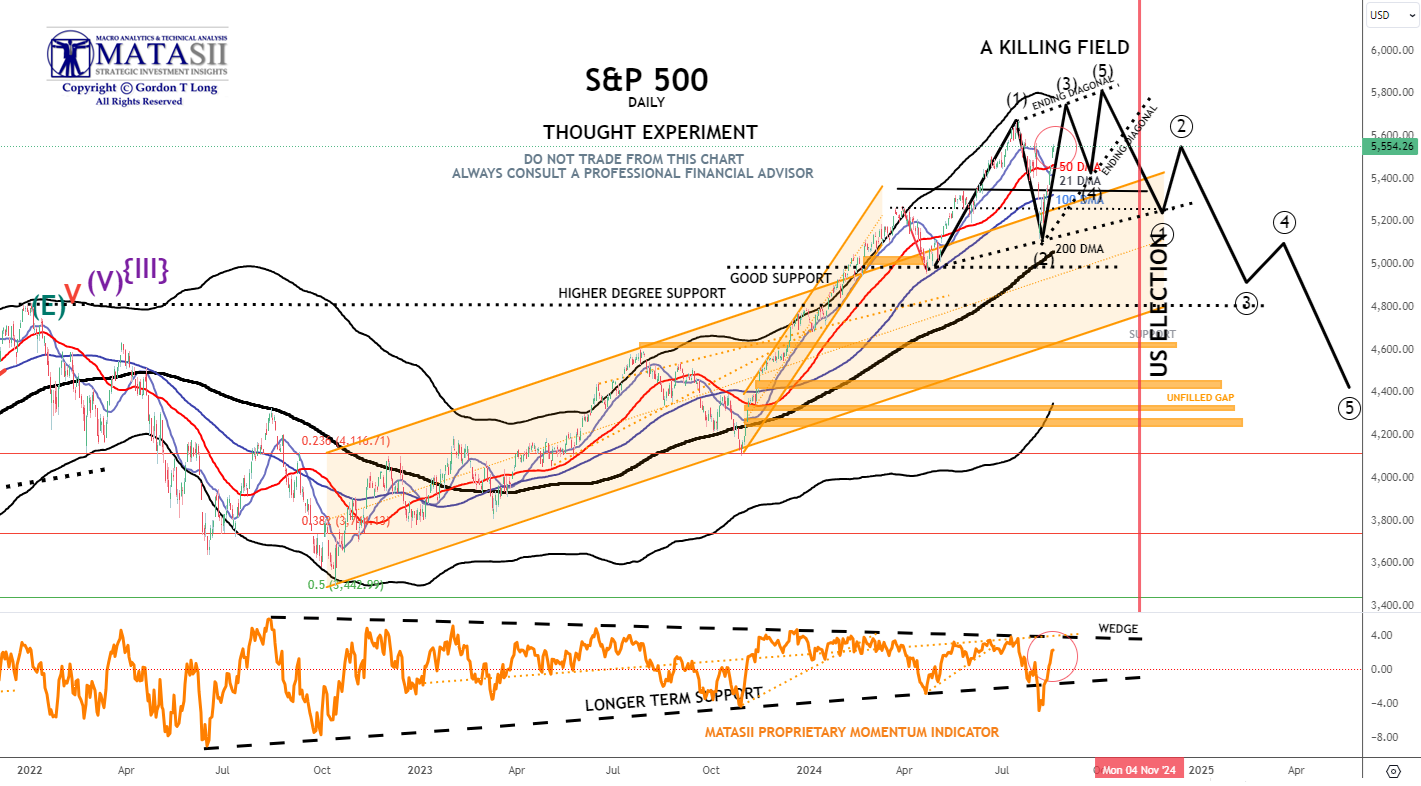
S&P 500 - Daily - Our Thought Experiment
OUR CURRENT ASSESSMENT IS THAT THE INTERMEDIATE TERM IS LIKELY TO LOOK LIKE THE FOLLOWING:
NOTE: To reiterate - "the black labeled activity shown below, between now and September, looks like a "Killing Field", where the algos take Day Traders, "Dip Buyers", the "Gamma Guys" and FOMO's all out on stretchers!"
WHY DID I CALL IT A KILLING FIELD?: "We remain in short gamma land. Dealers had to sell deltas into the 5450 support area during the July 30 move lower. The same dealers had to chase all that sold delta and much more at higher prices as they became shorter and shorter deltas as the market ripped higher yesterday. Today is another brutal day for the short gamma community as they have been forced to sell (at much lower prices) all that delta they bought yesterday. Add to it poor summer liquidity, and you realize why things are moving in an erratic way."
- The S&P 500 like the S&P 500 cfd appears to have broken decidedly higher on dollar weakness.
- The MATASII Proprietary Momentum Indicator (lower pane) supplied initial support at its longer term rising support trend line before being decisively broken before rising. This should be seen as an indication that final support has not yet been found, (likely the 200 DMA).
- The longer term Momentum Indicator wedge (dashed black lines) is narrowing. It appears the S&P 500 is looking to touch this overhead resistance level.
|  | |
YOUR DESKTOP / TABLET / PHONE ANNOTATED CHART
Macro Analytics Chart Above: SUBSCRIBER LINK
| |
STOCK MONITOR: What We Spotted
MONDAY
- Stocks ultimately closed mixed with the RUT tumbling while the majority of sectors took a hit. Individual stock weakness was offset by tech outperformance in the SPX and NDX, to see a flat close for those two indices.
- The US data highlight was the NY Fed Survey of Consumer Expectations, which saw the 1 and 5yr inflation expectations unchanged at 3.0% and 2.8%, respectively, although the 3yr expectations fell to a series low of 2.3% (prev. 2.9%).
- Meanwhile, Fed's Bowman spoke over the weekend, noting her baseline outlook is that inflation will decline further but she still sees some upside risks for inflation, also adding the rise in the unemployment rate may be exaggerating the degree of cooling in the labor market.
- Elsewhere, T-notes were bid across the curve in a steeper fashion with all eyes turning to key US data this week (PPI, CPI, Retail Sales).
- The upside today was also supported by heightened geopolitical tensions, which saw oil prices surge.
- An Iran/Hezbollah response appears imminent with Fox reporting Iran could attack Israel in less than 24 hours. Haven FX also performed well on this, with both Yen and Franc paring from worst levels, although on the day it was the Antipodes that outperformed with Kiwi traders eyeing the RBNZ later in the week.
- Gold prices surged on the aforementioned geopolitical tensions.
INFLATION BREAKEVENS: 5yr BEI +1.0bps at 2.125% 10yr BEI +0.7bps at 2.121% 30yr BEI +0.3bps at 2.153%.
REAL RATES: 10Y -- 1.7914%
STOCK SPECIFICS:
- Apple (AAPL) - Foxconn has added 50k workers at its Zhengzhou plant over the past two weeks as it prepares for the iPhone 16 launch.
- Disney (DIS) - Unveiled plans of four new cruise ships and six new themed lands.
- Starbucks (SBUX) - Activist investor, Starboard Value, has acquired a stake in the Co., WSJ reported.
- Tesla (TSLA) - Halted orders for the USD 61,000 base model of its Cybertruck, Fox News reports.
- KeyCorp (KEY) - Scotiabank announced it is to acquire a 14.9% interest in KeyCorp for USD 2.8bln, at 17.17/shr (currently, USD 17.11/shr)
- Hawaiian Electric (HE) - Agreed to settle Maui wildfire claims, aiming to resolve litigation and stabilise its future; reporting a Q2 loss of USD 1.3bln, including USD 1.7bln for wildfire liabilities.
- Eli Lilly (LLY) - Upgraded at Deutsche on high growth outlook and low beta.
- JetBlue Airways (JBLU) - Announced plans to offer USD 400mln of convertible senior notes due in 2029.
- Qualcomm (QCOM) - Downgraded at Wolfe Research.
- Johnson & Johnson (JNJ) - Gets plaintiff backing for USD 6.5bln baby power accord, Bloomberg reports. Co. cleared a key hurdle for advancing a USD 6.5bln plan to resolve thousands if lawsuits by people who say its baby power gave them cancer.
- Warner Bros. Discovery (WBD) - Olympics audience climbed 23% over Tokyo and streaming subscribers topped Tokyo by 77%.
TUESDAY
- US indices (SPX +1.7%, DJIA +1.0%, RUT +1.6%) saw broad-based gains on Tuesday in wake of the cooler-than-expected US PPI release, with the tech-heavy Nasdaq 100 (+2.5% ) outperforming and buoyed by notable strength in Nvidia (+6.5%) and Tesla (+5.3%), which saw Technology and Consumer Discretionary be the clear sectorial outperformers.
- Overall, sectors were almost exclusively in the green, with only Energy in the red and weighed on by weakness in WTI and Brent as participants potentially factor in reports that suggested Iran's response may be limited.
- As such, Middle East tensions remain front of vision, although the latest updates from Axios citing an official is that they do not expect an Iranian attack today. In addition, US President Biden stated he expects Iran to hold off on Israel retaliation if a hostage deal is reached, with talks scheduled for Thursday.
- US Treasuries were firmer across the curve, in wake of the aforementioned cool PPI data, which adds further conviction in the Fed's fight against returning inflation to 2%, although the July CPI (released Aug. 14th) will also be key in confirming whether price pressures are continuing to ease.
- Thereafter, focus will continue to be around jobs numbers/data ahead of the September 18th FOMC meeting.
- In wake of the metrics, Fed pricing moved dovishly with 108bps of cuts priced in vs. 103bps pre-data. Further on the Fed footing, Bostic (2024 voter) gave hawkish remarks, as he stated he wants to see a little more data and is willing to wait for the first rate cut, but it is coming. In the FX space, the Dollar saw notable losses to the benefit of all G10 peers, with EUR/USD testing 1.10 to the upside and USD/JPY 146.50 to the downside.
- Looking ahead, participants await RBNZ overnight, any Iran response, and US CPI (Wed) amongst others.
INFLATION BREAKEVENS: 5yr BEI -2.3bps at 2.104%, 10yr BEI -2.2bps at 2.097%, 30yr BEI -2.2bps at 2.129%.
REAL RATES: 10Y -- 1.7209%
EARNINGS:
- Home Depot (HD) - Lowered FY outlook alongside comp sales missing, though did beat on profit with revenue meeting forecasts.
- On Holding (ONON) - Reversed initial losses, albeit revenue surpassed expectations. On reversed as during conference call it noted H2 reacceleration of trends also alongside a favorable PPI release.
- Tencent Music (TME) - Revenue declined 1.7% Y/Y with MAUs in the mobile categories also shy of expected.
STOCK SPECIFICS:
- Starbucks (SBUX), Chipotle Mexican Grill (CMG) - Starbucks appointed CMG's chief Brian Niccol as its next CEO.
- Reliance (RIL IS), Disney (DIS) - Cos. offer to sell some TV channels to win antitrust nod for Indian USD 8.5bln media merger, according to Reuters citing sources.
- BHP (BHP) - Workers at its Escondida mine in Chile will begin a strike on Tuesday, after failing to reach a wage agreement.
- Occidental Petroleum (OXY) - Launched an underwritten secondary public offering of 29.6mln shares of its common stock.
- Viasat (VSAT) - Offered 11.246mln shares in a spot secondary offering, with a price range of USD 20.00-20.50/shr (Monday close: USD 21.62).
- Boeing (BA) - Will likely miss its key 737 MAX jet production target in 2024, which aims to produce 38 MAX jets a month by the end of 2024, analysts at rating agencies Moody's and S&P told Reuters.
- Illumina (ILMN) - Unveiled a strategy aimed at 8-9% sales growth by 2027 and is to focus on streamlining DNA sequencing and analysis; sees at least 10% total EPS growth over next 3 years. USD 200mln in cost cuts boosting performance.
- Google (GOOGL) - Revealed its lineup of new Pixel smartphones which includes a tensor G4 processor; Pixel 9 Pro fold starts at USD 1799; Pixel 9 Pro starts at USD 999 and Pixel 9 Pro XL starts at USD 1,099; Pixel 9 starts at USD 799.
- Boeing (BA) - Discovered a new set of problems in its 737s and further slowing deliveries, according to Fortune. Boeing confirmed in a statement to Fortune that it identified a “non-conforming component” on three already delivered airplanes, leading to their grounding. Co. noted that production hasn’t stopped at the Renton factory.
- Dell (DELL) - Upgraded at Barclays.
WEDNESDAY
- Stocks were mixed on Wednesday after CPI failed to live up to the dovishness of the PPI report on Tuesday, albeit CPI on net was still in line with expectations and there were no signs of concern within the report.
- The report did little to alter Fed expectations, with September seen as a guaranteed cut, but markets are still torn between 25 or 50bps.
- Perhaps Thursday's Retail Sales and Jobless Claims number will help cement expectations further, but the real test won't be until the August NFP report.
- Sectors were also mixed, with outperformance seen in Financials, Energy and Consumer Staples, with the latter buoyed by gains in Kellanova (K) +7% after it announced it is to be acquired by Mars.
- Underperformance was seen in Communication Services, Consumer Discretionary, Materials, and Utilities, with the former weighed on by weakness in Google (GOOGL) on continued antitrust fears.
- T-notes saw a wide range around the CPI data, between a peak of 114-02 and a trough of 113-13+, but the curve ultimately flattened on the session with attention turning to Retail Sales and Jobless Claims on Thursday.
- The Dollar was ultimately flat with NZD underperforming after the RBNZ cut rates by 25bps vs split analyst expectations for a hold or cut, albeit money markets were pricing in a cut as the more likely option.
- GBP was also sold after cooler-than-expected UK inflation data with the Euro the G10 outperformer.
- Energy prices ultimately settled in the red after a surprise crude stock build in weekly inventory data but geopolitics remains in focus with Hamas not attending cease fire negotiations this week.
INFLATION BREAKEVENS: 5yr BEI -0.8bps at 2.091%, 10yr BEI -2.1bps at 2.074%, 30yr BEI -2.2bps at 2.105%.
REAL RATES: 10Y -- 1.767%
EARNINGS
- Apple (AAPL) – Apple’s key manufacturing partner Foxconn reported better-than-expected profits in Q2, benefitting from strong demand for servers powering AI applications
- Brinker International (EAT) - Profit missed with FY25 EPS guidance disappointing.
- UBS Group ADR (UBS) - Q2 net profit more than doubled analysts expectations with revenue also beating. That said, Co. did give a cautious Q3 outlook.
- Cardinal Health (CAH) - Reported a beat on the top and bottom line, alongside upgrading its FY EPS view above expectations.
- Flutter Entertainment ADR (FLUT) - Revenue and average monthly players grew more than was expected, alongside lifting FY guidance.
- Performance Food Group (PFGC) - Bottom line surpassed expectations, with the Co. to acquire Cheney Bros for USD 2.1bln in cash.
STOCK SPECIFICS
- Kellanova (K) - Mars confirmed earlier reports that is to acquire Kellanova (K) for USD 83.50/shr in cash, for a total consideration of USD 35.9bln. Note, K closed Tuesday at USD 74.50/shr. CEO does not expect antitrust concerns on deal with Mars.
- Alphabet (GOOGL) - The DoJ is considering breaking up the Co, after a court ruling found that it monopolized online search and ads, with a ban on exclusive contracts being considered.
- Arm Holdings (ARM) - Intel sold its 1.18mln share stake in the Co. in Q2.
- Eli-Lilly (LLY) - Reportedly demands doctors stop selling copycat weight-loss drugs, according to Bloomberg.
- Johnson & Johnson (JNJ) - Is preparing to disclose supermajority support for talc bankruptcy settlement as soon as Friday, according to Reuters sources; preparing to have subsidiary seek bankruptcy protection to consummate talc settlement as soon as next week.
THURSDAY
- US indices (SPX +1.6%, NDX +2.5%, DJIA +1.4%, RUT +2.5%) saw strong gains, as did the Dollar, while Treasuries saw notable weakness in reaction to the stronger-than-expected US retail sales, as well as the fall in initial jobless claims.
- The data helped ease recent economic concerns and pushed back against expectations for a 50bp rate cut from the Fed in September, highlighted by money markets now pricing in 94bps of cuts by year-end, vs. 105bps pre-data.
- Elsewhere within the US data deluge, survey data (Empire/Philly Fed) was mixed, Industrial Production disappointed while import and export prices were a touch hotter than the prior, and the NAHB Housing Market Index fell beneath all analyst forecasts.
- Despite the strong retail sales numbers, after IP and Import/Exports, the Atlanta Fed GDPNow (Q3) estimate was revised down to 2.4% from 2.9%.
- Sectors were almost exclusively in the green with only Real Estate in the red, as Consumer Discretionary and Technology sat atop of the pile, with stellar Walmart (WMT, +6.5%) earnings arguably the stock-specific highlight.
- Elsewhere, the crude complex was firmer on Thursday, irrespective of the firmer Dollar, amid the continued backdrop of heightened geopolitical tensions, whereby the latest update on the Gaza talks in Doha, via Egypt's Al Qahera News TV citing 'informed sources', is that disagreements between parties remain big.
- In FX, safe-havens (CHF, JPY) saw notable losses against the Buck as it was weighed on by broader risk-on sentiment, while GBP was one of the better performers in the wake of Q2 GDP metrics underpinning the view that the UK economy saw a solid H1.
- On the Fed footing, Bostic (voter) is open to a September rate cut as inflation cools, while Musalem (2025 voter) said recent data has bolstered his view on inflation and the time may be nearing for a change in the policy rate.
INFLATION BREAKEVENS: 5yr BEI +5.6bps at 2.148%, 10yr BEI +4.5bps at 2.120%, 30yr BEI +3.5bps at 2.139%.
REAL RATES: 10Y -- 1.7703%
EARNINGS
- Cisco (CSCO) - Top and bottom lines beat alongside cutting 7% of its workforce. Exec sees steady demand in the latest quarter despite persistent macro uncertainty.
- Walmart (WMT) - Topped expectations in profit, revenue, and comp sales, in addition to boosting FY adj. EPS view.
- Alibaba (BABA) - Revenue fell short, with executives expecting most of its international business will break even in one to two years.
- Deere & Co (DE) - EPS and revenue exceeded expectations, as higher prices helped shield profits from slowdown in demand for new machines amid decline in crop prices and high borrowing cost.
- JD (JD) - Beat on the top and bottom line.
- Lumentum (LITE) - EPS and revenue surpassed Wall St. consensus with strong next quarter top line guidance.
STOCK SPECIFICS:
- Nvidia (NVDA) - Nvidia Blackwell GPU delay is manageable, DigiTimes reports. Separately, supplier Foxconn (HNHPF) said the development of GB200 is on track, despite recent rumors it's facing shipment delays.
- Ulta Beauty (ULTA) - Berkshire Hathaway (BRK) took a new stake in the Co.
- Boeing (BA) - Israel's El Al Airlines signed a deal to buy up to 31 737 Max craft for as much as USD 2.5bln.
- Nike (NKE) - Bill Ackman's Pershing Square took a new stake in the Co.
- Snowflake (SNOW) - Downgraded at Wells Fargo on its premium multiple being 'tougher to defend".
- Bronfman prepares bid for Paramount (PARA) parent National Amusement, according to WSJ sources; the bid could come together in coming days and he has had discussions with possible partners including Fortress and Roku (ROKU). Effort comes as interested parties have until August 21st to make rival offers for NAI in wake of Skydance deal.
- Kroger (KR) - Plans USD 1bln in price cuts after Albertsons merger, according to Bloomberg.
FRIDAY
- Stocks ultimately closed little changed with overnight/morning weakness pared after cash equity trade opened.
- Sectors were mixed with outperformance in Financials, Utilities and Communications, while downside was seen in Real Estate, Industrials and Energy.
- Index performance saw the Nasdaq flat with marginal outperformance in RUT.
- US data saw improved UoM Consumer Sentiment while inflation expectations were unchanged.
- Housing starts and building permits disappointed, which saw a revision lower to the Atlanta Fed Q3 '24 GDP Now tracker to 2.0% from 2.4% on Thursday.
- Meanwhile, Fed's Goolsbee repeated cautious remarks on the labor market.
- There was also a lot of focus on geopolitics with Hamas rejecting the latest ceasefire proposal demands.
- T-Notes were choppy, with downside in oil prices and dovish Goolsbee commentary supporting the upside, before paring as equity futures moved off lows after the cash equity open.
- Crude prices were hit after Libya's Waha oil field resumed operations.
- In FX, the Dollar was sold with soft housing data and dovish Goolsbee keeping the buck pressured while NZD and JPY outperformed.
- Attention next week turns to the Jackson Hole Economic Symposium.
INFLATION BREAKEVENS: 5yr BEI -3.8bps at 2.107%, 10yr BEI -3.7bps at 2.077%, 30yr BEI -3.6bps at 2.097%.
REAL RATES: 10Y -- 1.800%
STOCK SPECIFICS
- Applied Materials (AMAT) - Profit and revenue beat, with next quarter guidance also slightly better than expected. Nonetheless, PT was lowered at Wells Fargo on October quarter guidance slightly missing buy-side expectations.
- Autodesk (ADSK) - Said to have continued a controversial sales strategy despite pledging to stop, ignoring internal warnings, Bloomberg reports.
- Amcor (AMCR) - Top line fell short, while adj. EPS did beat. Executives said as customer demand improved it maintained focus on managing costs.
- H&R Block (HRB) - EPS and revenue surpassed Wall St. consensus, in addition to authorizing a new USD 1.5bln share buyback program and raising quarterly dividend by 17%
- Coherent (COHR) - Sales surpassed expectations, alongside a strong revenue outlook.
- Texas Instruments (TXN) - To receive up to USD 1.6bln under CHIPS Act.
- Estee Lauder (EL) - Downgraded at Bank of America, citing headwinds in its China market and softening US demand is also weighing upon shares.
- Repligen (RGEN), Maravai Lifesciences (MRVI) - RGEN reportedly approaches MRVI with an acquisition offer, according to Reuters citing sources.
- Fox (FOX), Disney (DIS), and Warner (WBD) sports service blocked for now in Fubo (FUBO) win, according to Bloomberg.
| |
CONTROL PACKAGE
There are FIVE charts we have outlined in prior chart packages that we will continue to watch closely as a CURRENT "control set":
- The 10Y TREASURY NOTE YIELD - TNX - HOURLY (CHART LINK)
- The 10Y TREASURY NOTE YIELD - TNX - DAILY (CHART LINK)
- The 10Y TREASURY NOTE YIELD - TNX - WEEKLY (CHART LINK)
- The 30Y TREASURY BOND YIELD - TNX - WEEKLY (CHART LINK)
- REAL RATES (CHART LINK)
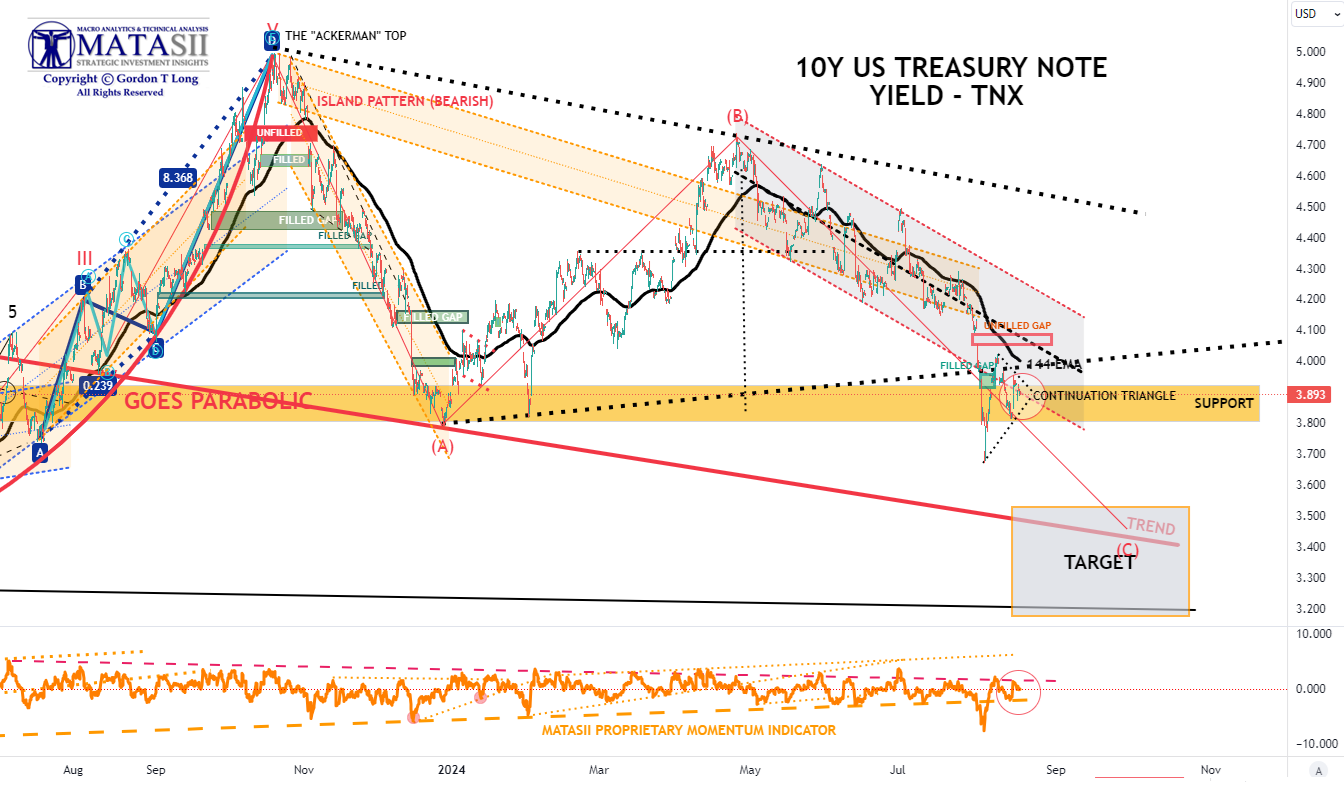
FISHER'S EQUATION = 10Y Yield = 10Y INFLATION BE% + REAL % = 2.077% + 1.800% = 3.877%
|
- The TNX appears to be putting in a "continuation triangle". This suggests yields will soon continue lower.
- The Momentum Indicator (lower pane) is also showing weakness, which should mean continued lower yields.
- The Bond Vigilante's continue to send a clear message to the Fed that they are 100 bps behind the curve.
| |
YOUR DESKTOP / TABLET / PHONE ANNOTATED CHART
Macro Analytics Chart Above: SUBSCRIBER LINK
| |
NOTICE Information on these pages contains forward-looking statements that involve risks and uncertainties. Markets and instruments profiled on this page are for informational purposes only and should not in any way come across as a recommendation to buy or sell in these assets. You should do your own thorough research before making any investment decisions. MATASII.com does not in any way guarantee that this information is free from mistakes, errors, or material misstatements. It also does not guarantee that this information is of a timely nature. Investing in Open Markets involves a great deal of risk, including the loss of all or a portion of your investment, as well as emotional distress. All risks, losses and costs associated with investing, including total loss of principal, are your responsibility.
FAIR USE NOTICE This site contains copyrighted material the use of which has not always been specifically authorized by the copyright owner. We are making such material available in our efforts to advance understanding of environmental, political, human rights, economic, democracy, scientific, and social justice issues, etc. We believe this constitutes a ‘fair use’ of any such copyrighted material as provided for in section 107 of the US Copyright Law. In accordance with Title 17 U.S.C. Section 107, the material on this site is distributed without profit to those who have expressed a prior interest in receiving the included information for research and educational purposes. If you wish to use copyrighted material from this site for purposes of your own that go beyond ‘fair use’, you must obtain permission from the copyright owner.
========
| |
MATASII'S STRATEGIC INVESTMENT INSIGHTS | |
2020 VIDEOS OUTLINING THE COMING RISE IN INFLATION, STAGLFLATION & COMMODITY PRICES | |
|
THE REGULATORY STATE
RELEASED - 01-17-24 --- 212 Page Paper
FULL 212 PAGE PDF DOWNLOAD
| |
IDENTIFICATION OF HIGH PROBABILITY TARGET ZONES | |
Learn the HPTZ Methodology!
Identify areas of High Probability for market movements
Set up your charts with accurate Market Road Maps
Available at Amazon.com
| |
The Most Insightful Macro Analytics On The Web | | | | |