|
Gordon T Long Research exclusively distributed at MATASII.com
Subscribe to Gordon T Long Research - $35 / Month - LINK
Complete MATASII.com Offerings - $55/Month - LINK
SEND YOUR INSIGHTFUL COMMENTS - WE READ THEM ALL - lcmgroupe2@comcast.net
| |
|
LONGWave - MAY 2024
Technical Analysis - 05/13/24
| |
THE GOVERNMENT NEEDS INFLATION - BUT MAYBE NOT QUITE THIS MUCH!
OBSERVATIONS: THE GOVERNMENT CAN STOP INFLATION - IF IT TRULY WANTED TO!
Tax receipts and debt-driven GDP have reached the point where they will no longer be counted on to be sufficient to extinguish the exploding US debt. We have crossed that Rubicon when the US became a "Zombie" government - a government that has to borrow to pay the interest on its existing debt.
The US government has been acutely aware that this was coming since at least the 2008 Financial Crisis. Those in the know fully realized that the only option forward would be inflation.
Up until the 2008, GFC the perception was that Financial Repression through the use of Negative Real Rates was the proven solution to excess government debt. It solved the debt problem resulting from WWII and could be counted on to do the same again. The Global Covid Shock abruptly changed everything!
Contained inflation was suddenly released. Like a coiled spring, once released it quickly becomes unmanageable! Initially the result of Supply Chain disruptions, it was stocked by relief payments, rent forbearances and government fiscal stimulus efforts. Never wanting to let a crisis go to waste, the Biden Administration saw this as an opportunity to mount a fight against Climate Change and a historic shift towards renewable energy, contributing to a ~$6.7T insertion of government spending into an already destabilized situation.
The predictable result was Inflation not seen since the 1970's. We have a 7 percent budget deficit at full employment which has previously has been unheard of. There are no free lunches and there are consequences of those policy decisions which we must now shoulder.
The government is quite willing to let the public believe that inflation is caused by greedy corporations, opportunists and any other mistaken belief. The simple truth is that inflation is first and always a Monetary event. Issuing more currency than the private sector demands, erodes purchasing power and creates a constant annual transfer of wealth from real wages and deposit savings to the government. Inflation is effectively a hidden tax that you pay not through a check to the government but by your money being worth less in buying power. Unfortunately only one in a hundred people ever grasp this.===>
| |
|
VIDEO PREVIEW (click image)
Pay-Per-View Page Link
| |
THIS WEEK WE SAW
Exp=Expectations, Rev=Revision, Prev=Previous
US
US Wholesale Sales MM (Mar) -1.3% (Prev. 2.3%, Rev. 2.0%)
US Wholesale Inventory MM (Mar) -0.4% vs. Exp. -0.4% (Prev. -0.4%)
Atlanta Fed GDPnow (Q2): 4.2% (prev. 3.3%)
US Initial Jobless Claims w/e 231.0k vs. Exp. 215.0k (Prev. 208.0k, Rev. 209k), highest since August 2023.
US Continued Jobless Claims w/e 1.785M vs. Exp. 1.785M (Prev. 1.774M, Rev. 1.768M)
===> If Biden wants to cut inflation, all he must do is eliminate the deficit by cutting expenditures. The reason why government should never oversee monetary policy and be allowed to monetize all deficits is by virtue of no administration being willing to cut its size to defend citizens’ wages. This is a result of nationalization by inflation and taxes being the goal of "big government" to create a dependent and hostage economy.
| |
========================= | |
|
WHAT YOU NEED TO KNOW!
THE GREAT BIDENOMICS DISTORTION
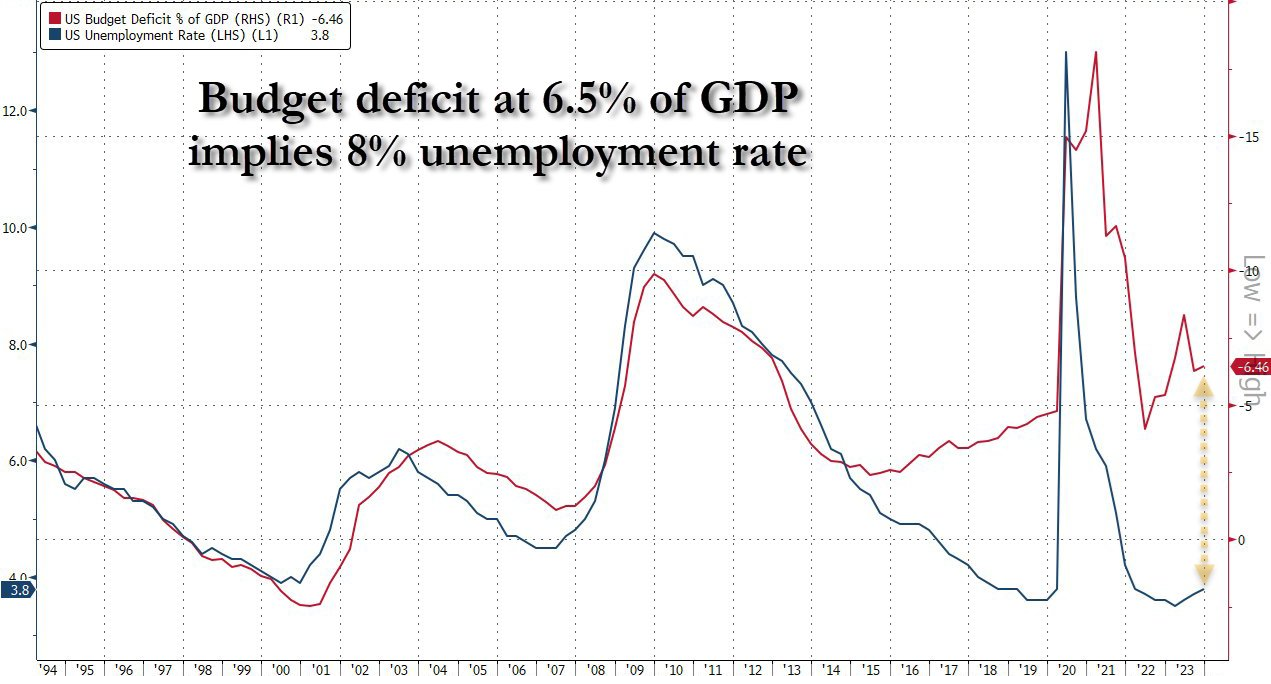
The current US budget deficit at ~6.5% of GDP is rising quickly with fiscal spending reaching $1T in the last 100 days alone. This level of spending is unprecedented with the reported US economy at full employment!. The chart to the right shows the close relationship between Employment and effectively fiscal deficit spending. The current Bidenomics distortion is unprecedented!
The already spent 6.5% deficit to GDP should be expected to be required only if unemployment was 8% - NOT 3.9%??
If the US was to economically slow, how exactly would the government try to moderate or address it? It seems this administration has already "eaten our seed corn" and will be leaving us to go hungry when the inevitable contraction arrives.
RESEARCH
- A US RECESSION IS LOOMING: THE HAPPY TALK WILL SOON END!
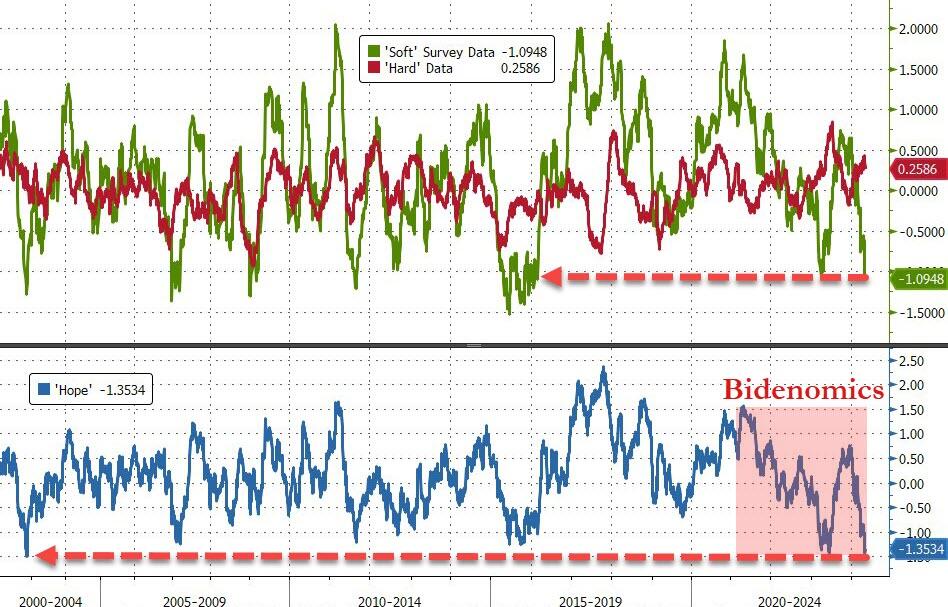
- Recession risk is increasing. This is being driven by the weakening in soft data in recent weeks, which is coinciding with hard data that remains fragile.
- Though the probability of a near-term recession is currently viewed as low, in a month’s time it could be much higher - by Q3 it is likely to be increasingly seen as a much higher probability.
- When you consider what is happening with the ISM, PMI and LEI, it is reasonable to assume that over the next 3-4 months the hard date will follow.
- Recessions follow the "S" curve which is why though they may be anticipated. They seem to occur so abruptly and are hard to time. Data is often revised lower very quickly, which is why recessions can happen faster in "revised time" than in real time.
-
THE "CRIPPLING" OF THE ENERGY SECTOR: STILL A STRONG RECESSION CATALYST!
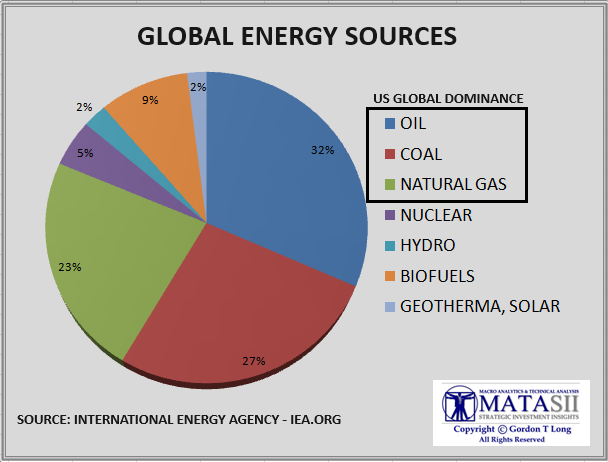
- Cheap and Abundant Energy is the cornerstone of a vibrant and healthy economy. Disruptions historically bring economic problems and wars!
- The current "War on Fossil Fuels" is clearly disruptive to US Oil production and energy industry.
- This has the clear and obvious potential for being a catalyst for serious US economic problems.
- However, for some reason it is "old news" and gets almost no mainstream news coverage? Minimally it should be watched closely versus what appears to be "don't talk about it".
- Even hard core Climate and Green Energy advocates should want to ensure the transition away is not taking the US into a economic death spiral!
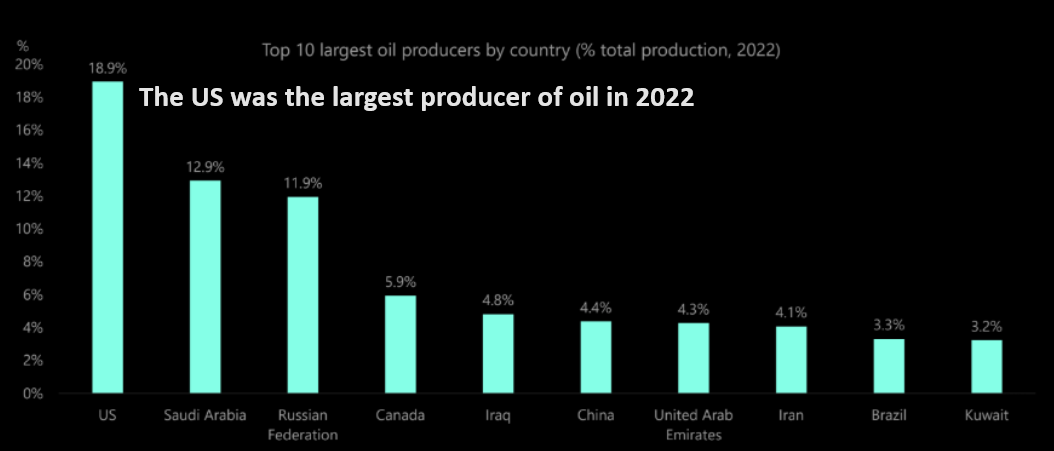
- Despite Biden's best efforts, U.S. oil production has soared to record levels, over 13 million barrels per day, boosted by commodity price increases following Russia's 2022 invasion of Ukraine.
- Investors have seen substantial returns, with mammoth ExxonMobil seeing its shares doubling since Biden's inauguration.
- These achievements have happened despite White House policies! Europe is even now reversing many of its prior energy positions out of shear necessity leaving the US alone and appearing to the world as still naively tilting at "windmills".
- We believe the direction and goal of the US is sound, however, its political implementation and plan is so amateurish as to be nothing short of laughable and doomed to what is occurring.
- It would appear that Biden quite simply can't even shoot himself in the foot at point blank distance!
| |
|
DEVELOPMENTS TO WATCH
ECONOMIC GROWTH IS A PRECIOUS COMMODITY REQUIRING CONTINUOUS ATTENTION!
- Economic Growth is hard, sustaining it even harder!
- History is replete with the fact that the stars of today are not necessarily the stars of tomorrow. Canada, Chile, Germany, South Africa and Thailand, as “breakdown nations” all carry lessons.
"Smart countries somehow turned stupid. One basic mistake or miss, and any country can find itself stuck — until it finds the leadership and vision to chart a way out.
For current stars, the message is a warning: don’t take growth for granted!"
THE NEW ACRONYMS OF A COMING CRISIS: YOLO, BNPL & "PHANTOM DEBT"
- The new development is the degree to which "Buy Now, Pay Later" (BNPL) has exploded and is being hidden by what is being identified as "Phantom Debt". This fact is camouflaging the degree to which consumer debt has degraded.
- This missing data is projected to reach almost $700 billion globally by 2028.
| |
|
GLOBAL ECONOMIC REPORTING
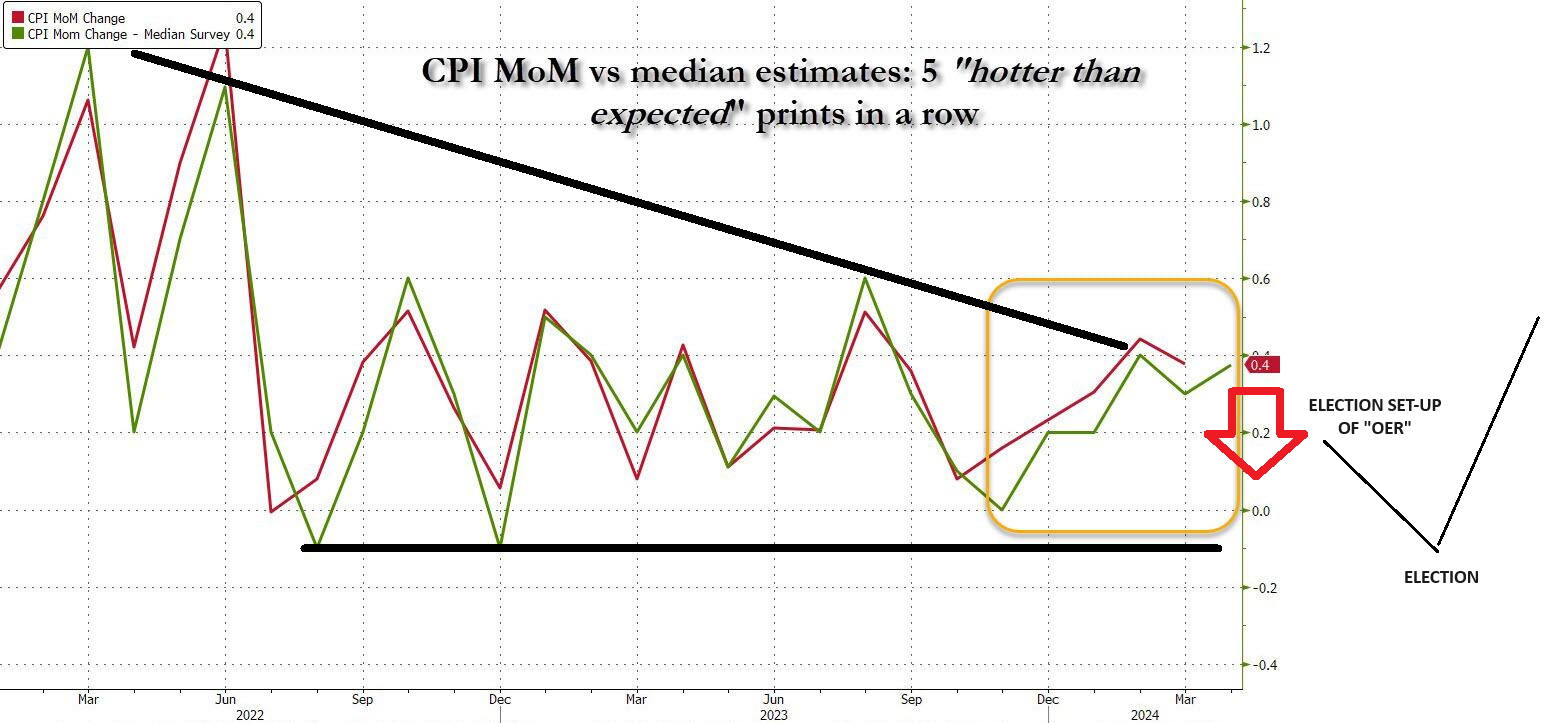
1- THE "OER" ELECTION YEAR SET-UP IS IN
- The CPI is driven by 43% of it being Owner Equivalent Rent (OER). The next 9-12 months rent/OER inflation will now begin to surprise to the downside as it catches down to stale lagged real-time data, even as rents are actually rising right now. However, the BLS won't observe this until early 2025.
2- WEEKLY JOBLESS CLAIMS
- With perfect timing for Yellen and Powell, the Initial Jobless Claims for the week ending 4th May shot up to 231k from 209k in the prior week, above the consensus of 215k and above the top end of the forecast range where the largest estimate looked for 220k.
- It is also the highest Initial Jobless Claims print since August of 2023, and the largest weekly increase since January (weather related), but before that it would be the largest increase since June last year.
| |
|
In this week's "Current Market Perspectives", we focus on the signals that sentiment, fundamentals and various markets (Credit, Bond and Equity) are currently giving us.
=========
| |
|
A US RECESSION IS LOOMING: THE HAPPY TALK WILL SOON END!
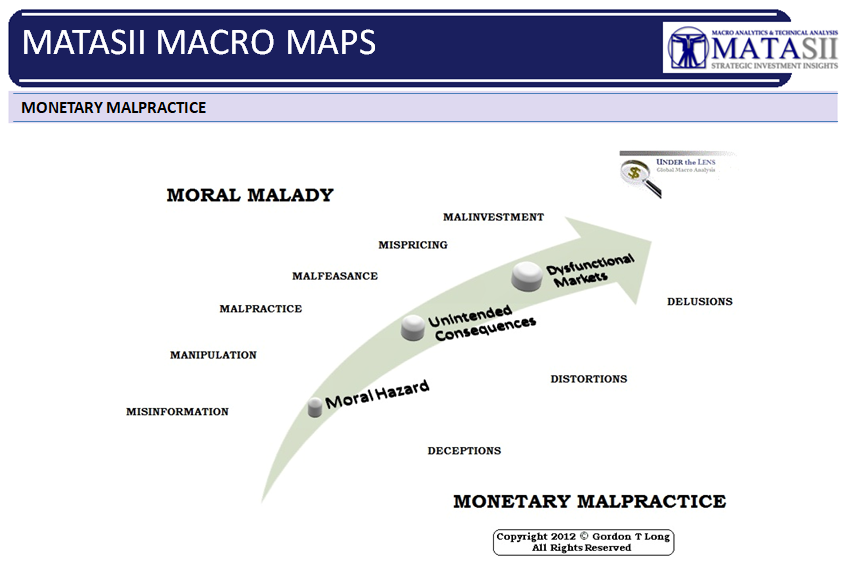
The US Business Cycle is long overdue for a downturn which normally results in a Recession. Recessions are a healthy "cleansing" process in a fully operational capitalist system as it clears out mal-investment, re-establishes effective price discovery and the repricing of risk. When this is not allowed to happen with programs such as Quantitative Easing (bringing demand forward), economic distortions lead what I have long called "Monetary Mal-Practice".
| |
|
INCREASING RECESSION RISK
Recession risk is increasing. This is being driven by the weakening in soft data in recent weeks (green survey data below), which is coinciding with hard data that remains fragile (red line). Though the probability of a near-term recession is currently viewed as low, in a month’s time it could be much higher - by Q3 it is likely to be increasingly seen as a much higher probability.
When you consider what is happening with the ISM, PMI and LEI, it is reasonable to assume that over the next 3-4 months the hard data will follow. Recessions follow the "S" curve, which is why though they may be anticipated, they seem to occur so abruptly and are hard to time. Data is often revised lower very quickly, which is why recessions can happen faster in "revised time" than in real time.
| |
 |
-
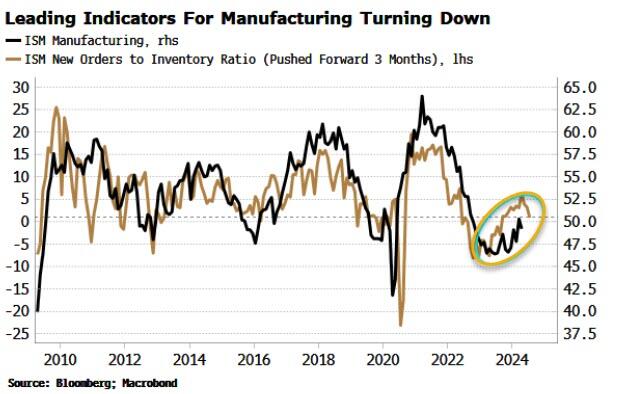
THE MANUFACTURING ISM is one of the single-most important data points for the economic and stock outlook.
- The headline survey dropped below 50 in April. It is led by the new orders-to-inventory ratio, which is turning lower and slipped below the important level of one, where orders are expected to be just enough to match inventory.
- The goods and services economies have fallen out of sync in this cycle. Normally the goods sector leads the rest of the economy into a downturn, which is why so many traditional recession indicators over-emphasized the risk of one last year. But at some point, the economy is likely to resynchronize.
- Services might also be notably slowing, as flagged by the services ISM also slipping below 50 in April. It has only done so twice before outside of a recession.
-
THE PURCHASING MANAGERS' INDEX (PMI) is a measure of the prevailing direction of economic trends in manufacturing. The PMI is based on a monthly survey of supply chain managers across 19 industries, covering both upstream and downstream activity.
- Though PMI services survey is still above 50, even though it is also turning lower. But this drop in important soft-data points comes at a time when hard data is showing signs of fragility too.
-
THE LEADING ECONOMIC INDICATOR (LEI) Recessions normally occur when both hard and soft data are contracting at the same time.
-
The Conference Board’s Leading Index indicates growth in leading hard data, which has been turning higher is still contracting, while leading soft-data is close to slipping into the contraction zone. That would be ominous for recession risk.
| |
ISM Manufacturing already in contraction | |  |
Watch Services in both the PMI and ISM | | |
|
THE "CRIPPLING" OF THE ENERGY SECTOR: STILL A STRONG RECESSION CATALYST!
THE CASUALTY OF CLIMATE CHANGE & GREEN ENERGY
Cheap and Abundant Energy is the cornerstone of a vibrant and healthy economy. Disruptions historically bring economic problems and wars! During Biden's 2000 campaign to become president he unequivocally stated that it was his intent to end the oil and gas industry in the US as part of his fight against Climate Change and to accelerate the US move towards sustainable energy. This set off alarm bells throughout the global investment community.
No matter what your feelings or politics regarding Climate Change or Green Energy, the reality is that US Policy is now completely "onboard" and fully committed. The Biden Administration has committed its legacy to being responsible for addressing this exogenous threat. This is most evident in the degree to which the Biden Administration has committed US Financial resources.
FINANCIAL COMMITTMENT
- The US has created a War Time Budget (War on Climate Change & Carbon Based Fuels), unheard of in Peace Time.
- Increased the National Debt, suspended the Debt Ceiling and took Fiscal Deficit Spending to 6.8% of GDP.
- Enacted Policies that have resulted in ~$6.7 Trillion in targeted supporting government spending.
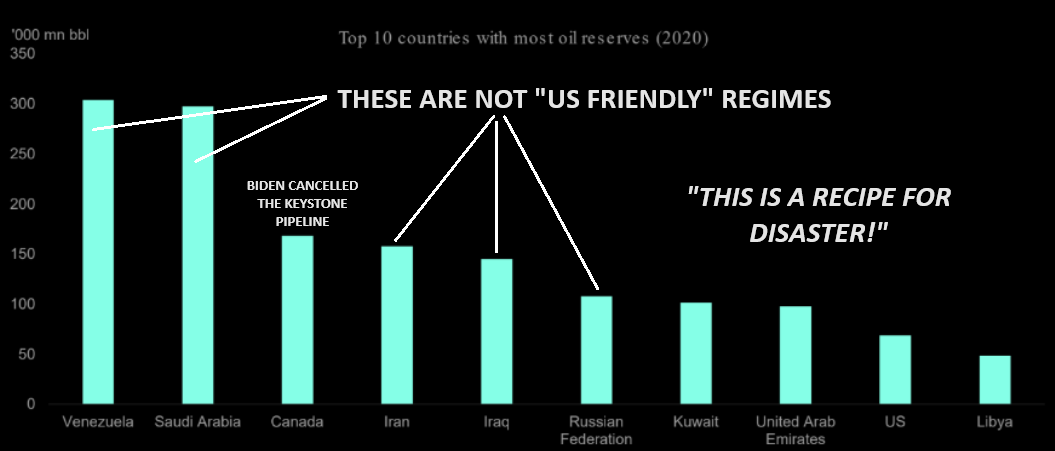
- There have been over 200 actions taken by the administration opposed to the oil and gas industry which range from shuttering the Keystone Pipeline to environmental regulations. Regulations including endangered species protections, methane leak controls, and limits on offshore leasing and new licenses for liquefying and exporting American gas.
THE US FOSSIL FUEL INDUSTRY
The current "War on Fossil Fuels" is clearly disruptive. This has the obvious potential for being a catalyst for serious US economic problems.
“It’s death by 1,000 cuts. It’s the worst presidency with regard to energy policy I’ve ever seen — and I’ve been involved in energy for 40 years, my entire career.”
Steve Pruett, chief executive of Elevation Resources, to Financial Times
However, for some reason, it is "old news" and gets almost no mainstream news coverage?
Minimally it should be watched closely versus what appears to be "don't talk about it". Even hard core Climate and Green Energy advocates should want to ensure the transition away is not taking the US into a economic death spiral??
So what has happened? Lets examine what has transpired since the Biden Administration assumed the Presidency.
|  | |
|
What Executive Orders, Acts or Laws has the Biden Administration enacted to restrict the
US fossil fuel complex?
President Joe Biden has taken significant steps to address climate change and curb the influence of the fossil fuel industry in the United States. Here are some key actions he has taken:
These actions reflect the Biden administration’s commitment to transitioning toward cleaner energy sources and addressing the challenges posed by fossil fuels.
| |
|
What are the implications of these actions for the fossil fuel industry?
President Joe Biden’s actions aimed at addressing climate change and reducing reliance on fossil fuels have significant implications for the industry. Let’s explore these implications:
- Hostility Toward Fossil Fuels: Biden’s agenda of ending the fossil fuel era is perceived as hostile by most U.S. oil and gas producers.
- His request to members of the OPEC cartel was seen as a slap in the face by domestic producers.
-
The industry remains wary of the administration’s aggressive green agenda, which aims to limit capital access for new exploration and constrain the domestic oil sector.
- Limited Influence on Domestic Production: Unlike countries with national oil companies (such as Saudi Arabia, Russia, or Venezuela), the U.S. relies on the private sector for oil and gas production.
- Shareholders demand fiscal discipline, leading CEOs to limit capital investment in new exploration.
-
The White House has limited ability to directly influence near-term domestic oil and gas production.
- Specific Policy Actions: Keystone XL Pipeline: Biden revoked approval for the Keystone XL pipeline, impacting oil transportation infrastructure.
- Moratorium on Leasing: He imposed a moratorium on oil and gas leasing on federal lands and waters, affecting approximately 25% of U.S. production.
-
Green Agenda: The administration continues to advance an aggressive green agenda, aiming to cut off capital access for new exploration and strangle the domestic oil industry.
- Mixed Signals and Industry Response: While only 9% of U.S. oil comes from federal land, oil and gas companies already own unused leases.
-
Recent auctions for new leases have received scant interest, indicating that Biden’s pivot away from fossil fuels is bad news for the industry.
- Balancing Climate Goals and Economic Realities: Biden’s administration must navigate the delicate balance between climate goals and the economic realities of the fossil fuel industry.
-
The challenge lies in phasing out fossil fuel exports, ending leasing on federal lands and managing approvals for new infrastructure projects.
In summary, Biden’s actions signal a shift away from fossil fuels, but the industry’s response and economic constraints remain critical factors in shaping the future of U.S. energy production.
How are fossil fuel companies adapting to these changes?
Fossil fuel companies are navigating a changing landscape as the Biden administration takes steps to address climate change and reduce reliance on fossil fuels. Here’s how they are adapting:
- Investment in Clean Energy: Many fossil fuel companies are diversifying their portfolios by investing in renewable energy sources.
- They are exploring opportunities in solar, wind, and hydroelectric projects to transition away from fossil fuels.
- Carbon Capture and Storage (CCS):,Some companies are researching and implementing CCS technology to capture carbon emissions from fossil fuel operations.
- By storing or utilizing captured carbon, they aim to reduce their environmental impact.
- Energy Efficiency Measures: Fossil fuel companies are adopting energy-efficient practices within their operations.
- This includes optimizing extraction processes, reducing waste, and minimizing energy consumption.
- Policy Advocacy and Lobbying: Some companies engage in policy advocacy to influence regulations and promote industry-friendly policies.
- They lobby for market-based solutions that align with their interests.
- Diversification into Non-Energy Sectors: To mitigate risks, some fossil fuel companies are diversifying into non-energy sectors.
- Investments in technology, chemicals, and renewable materials provide alternative revenue streams.
- Collaboration and Partnerships: Companies are collaborating with research institutions, startups, and other industries.
- Joint ventures and partnerships facilitate innovation and adaptation.
- Public Relations Efforts: Fossil fuel companies are enhancing their public image by emphasizing environmental initiatives.
- They communicate efforts toward sustainability and carbon reduction.
- Transition Plans: Some companies are developing transition plans to gradually shift their focus from fossil fuels to cleaner alternatives.
- These plans outline steps for diversification and sustainable practices.
In summary, fossil fuel companies are navigating a complex landscape, balancing economic realities with
environmental responsibilities.
What challenges do fossil fuel companies face in this transition?
Fossil fuel companies encounter several challenges as they navigate the transition toward cleaner energy sources and adapt to changing policies. Here are some key challenges they face:
-
Legal and Regulatory Pressures: Lawsuits against fossil fuel companies are increasing with environmental organizations, indigenous communities, and researchers seeking accountability for climate-related harm.
- Stricter regulations on emissions, pollution, and environmental impact affect their operations.
- Market Uncertainty: The shift toward renewable energy introduces market volatility for fossil fuel companies.
- Uncertainty about future demand and pricing impacts investment decisions.
- Investment Dilemma: Companies must balance long-term sustainability with short-term financial performance.
- Diverting capital from fossil fuels to renewables requires strategic planning.
- Workforce Transition: Transitioning to clean energy may lead to job displacement in fossil fuel sectors.
- Retraining and reskilling workers for new roles is essential.
- Infrastructure Challenges: Existing fossil fuel infrastructure (pipelines, refineries, etc.) may become stranded assets.
- Repurposing or decommissioning infrastructure poses logistical challenges.
- Public Perception and Reputation: Fossil fuel companies face public scrutiny due to environmental concerns.
- Building trust and improving reputation is critical.
- Financial Risks: Divestment from fossil fuels by investors affects capital availability.
- Companies must manage financial risks associated with stranded assets.
- Geopolitical Factors: Global politics impact energy markets.
- Geopolitical tensions can disrupt supply chains and affect prices.
- Technological Innovation: Companies need to invest in research and development for cleaner technologies.
- Adapting to innovations like carbon capture and storage is crucial.
- Energy Transition Policies: Policies promoting clean energy may reduce demand for fossil fuels.
- Companies must align with evolving energy policies.
In summary, fossil fuel companies face multifaceted challenges, requiring strategic planning, adaptation and a delicate balance between economic viability and environmental responsibility
| |
|
CONCLUSION
Despite Biden's best efforts, U.S. oil production has soared to record levels, over 13 million barrels per day, boosted by commodity price increases following Russia's 2022 invasion of Ukraine. Investors have seen substantial returns, with mammoth ExxonMobil seeing its shares doubling since Biden's inauguration. These achievements have happened despite White House policies! Europe is even now reversing many of its prior energy positions out of shear necessity leaving the US alone and appearing to the world as still naively tilting at "windmills".
We believe the direction and goal of the US is sound, however, its political implementation and plan is so amateurish as to be nothing short of laughable and doomed to what is occurring. It appears that Biden quite simply can't even shoot himself in the foot at point blank distance!
| |
|
DEVELOPMENTS TO WATCH
ECONOMIC GROWTH IS A PRECIOUS COMMODITY REQUIRING CONTINUOUS ATTENTION!
US WAS ABOUT "BUSINESS" - IT IS NOW INCREASINGLY ABOUT "GOVERNMENT"
Economic Growth is hard, sustaining it even harder!
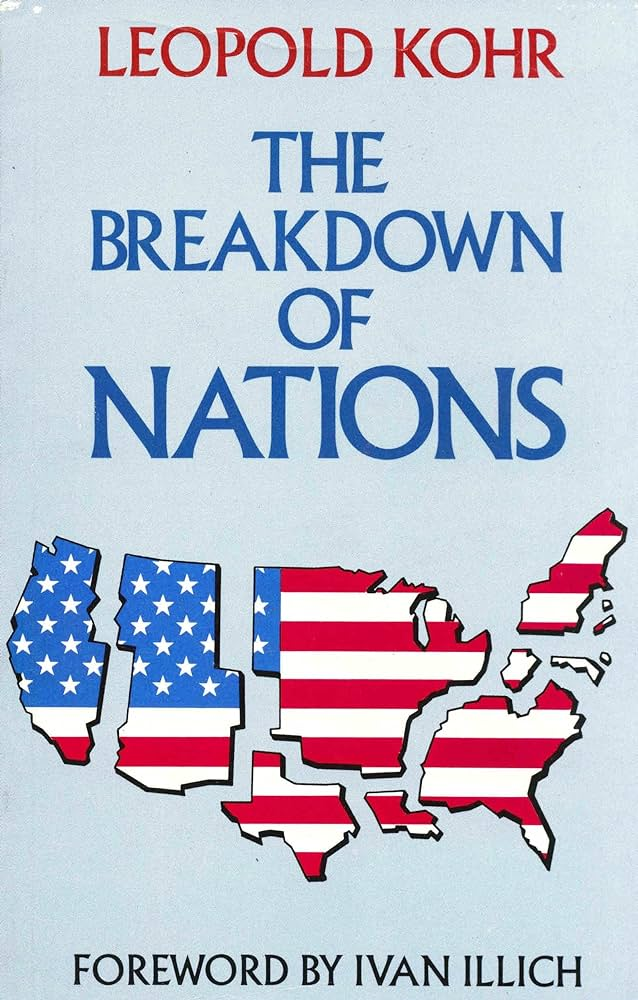
History is replete with the fact that the stars of today are not necessarily the stars of tomorrow. Canada, Chile, Germany, South Africa and Thailand, as “breakdown nations”, all carry lessons.
"Smart countries somehow turned stupid. It is that hidden traps line the path of development and can spring on nations at every income level from the middle to the rich. One basic mistake or miss, and any country can find itself stuck — until it finds the leadership and vision to chart a way out. For current stars, the message is a warning:
don’t take growth for granted!"
In The Breakdown of Nations Leopold Kohr, an economist by profession, shows that, throughout history, people living in small states are happier, more peaceful, more creative and more prosperous. Virtually all our political and social problems would be greatly diminished if the world's major countries were to dissolve back into the small states from which they sprang. Rather than making ever-larger political unions, in the belief that this will bring peace and security, we should minimize the aggregation of power by returning to a patchwork of small, relatively powerless states, where leaders are accessible to and responsive to the people. Leopold Kohr was the originator of the concept of 'the human scale', an idea later popularized by E.F. Schumacher in 'Small is Beautiful'.
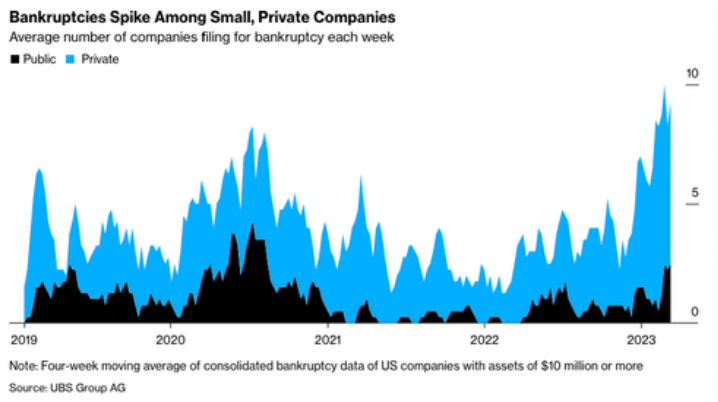
The US was built on and has been sustained by small business. Over 80% of non-Government jobs are Small Businesses.
Currently they are experiencing massive and unprecedented problems!
| |
|
THE NEW ACRONYMS OF A COMING CRISIS: YOLO, BNPL & PHANTOM DEBT
In March, I wrote a long Newsletter note "03-04-24-The Credit Addicted "YOLO" Consumer " with an extensive list of concerning data. Since then the data appears to have only degraded further!
The new development is the degree to which "Buy Now, Pay Later" (BNPL) has exploded and is being hidden by what is being identified as "Phantom Debt". This fact is camouflaging the degree to which consumer debt has degraded.
WHAT WE KNEW:
- Credit card debt across the US has hit a new record high of $1.337 trillion.
- The US savings rate has tumbled to an all time low.
- Aggregate Savings -27% since Dec 2019 - 6.4% are Seriously Delinquent (59% Y-o-Y).
- Americans are falling behind on auto loans, while credit-card delinquency rates have reached the highest since at least 2012. 1 in 12 Americans are in ARREARS on their Credit Card Balances.
- The share of credit card debts 30, 60 and 90 days late are all on the upswing.
- 23% Acquired More Debt to Pay Bills.
- There are also signs that consumers are struggling to afford their BNPL debt. A recent survey conducted for Bloomberg News by Harris Poll found that 43% of those who owe money to BNPL services said they were behind on payments, while 28% said they were delinquent on other debt because of spending on the platforms.
- Americans are no longer even charging everyday purchases they traditionally used cash and savings to pay for
- Even Middle-class households are relying on BNPL. About 42% of those with household income of more than $100,000 report being behind or delinquent on BNPL payments!
WHAT WE LEARNED
Bloomberg reports in a lengthy expose on installment debt, the major companies that provide “pay in four” products, such as Affirm Holdings, Klarna Bank and Block’s Afterpay, don’t report those loans to credit agencies.
This missing data is projected to reach almost $700 billion globally by 2028.
| |
|
GLOBAL ECONOMIC INDICATORS:
What This Week's Key Global Economic Releases Tell Us
As the Biden Administration begins its final turn for the 2024 Election run, we have laid out what both Yellen and Powell have undertaken in preparation. However, there are other players who have their "assignments". One of those is the Labor Department. Last week the BEA surprised the markets as the Unemployment Rate rose to 3.9% and precipitated falling Yield rates, right on the tail of Yellen's QRA release and Powell's FOMC assurance that "rates are not going up". Both aligned with Biden's assurance that rates are coming down by the election and within a "few" months. The next two steps are ahead:
- The OER Election Set-Up
- Weekly Jobless Claims Trend Begins Rising
1- THE "OER" ELECTION SET-UP IS IN
The CPI is driven by 43% of it being Owner Equivalent Rent (OER). The next 9-12 months rent/OER inflation will now begin to surprise to the downside as it catches down to stale lagged real-time data, even as rents are actually rising right now. However, the BLS won't observe this until early 2025.
| |
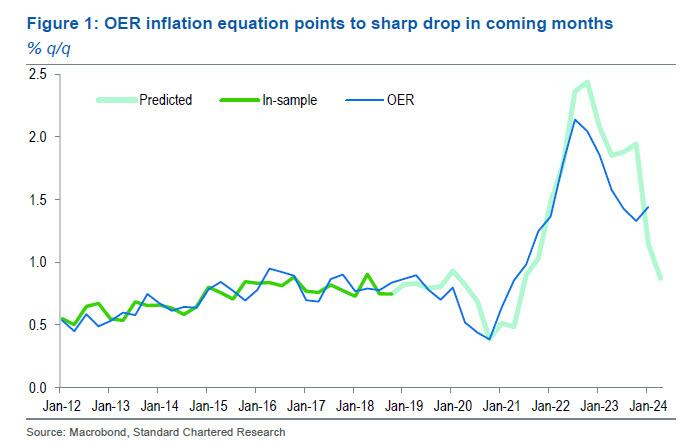
Standard Chartered's chief FX strategist Steven Englander writes he was struck by Fed Chair Powell’s confidence at the 1 May FOMC press conference that lower housing costs would likely lower core inflation over time. In a note Englander writes that "when we looked closely at shelter costs, particularly at the owner equivalent rent (OER) component, we found reason for optimism that shelter inflation could fall soon and bring down core inflation."
As shown in the chart to the right, Englander runs a regression analysis on actual and predicted OER, and finds that that "Powell’s optimism may be justified" as it points to a sharp decline in OER in coming months based on a regression that has proved stable in recent years.
| |
2- WEEKLY JOBLESS CLAIMS
- Initial Jobless Claims for the week ending 4th May shot up to 231k from 209k in the prior week, above the consensus of 215k and above the top end of the forecast range, where the largest estimate looked for 220k.
- It is also the highest Initial Jobless Claims print since August of 2023, and the largest weekly increase since January (weather related), but before that it would be the largest increase since June last year.
- Note, the 4 week average rose to 215k from 210k.
- Continued Claims for the week ending April 27th rose to 1.785mln from 1.768mln, in line with analyst forecasts.
- The unadjusted data for initial claims rose 20k to 209k, while seasonal factors had only expected a decrease of 1k.
- Note that a big rise in New York claims were behind the increase, which some suggest are seasonal factors that may unwind in the weeks ahead.
- More broadly, many analysts have been calling for a rise in jobless claims, and although this is only one jobless claims report, it does chime with several weak labor market updates seen recently, including
- the softer than expected NFP
- fall in JOLTS
- while the S&P PMI said "The more challenging business environment prompted companies to cut payroll numbers at a rate not seen since the global financial crisis if the early pandemic lockdown months are excluded."
- The Fed has acknowledged that an unexpected weakening of the labor market would justify rate cuts if inflation is not yet heading to 2% in a sustainable manner, and although we are still some way off an "unexpected weakening", the labor market is clearly showing signs of slowing down, whether this was a head-fake print or not.
| |
|
GLOBAL MACRO
WHAT DOES YOUR SCAN OF THE DATA BELOW TELL YOU? - THE MEDIA AVOIDS BAD NEWS!
We present the data in a way you can quickly see what is happening.
THIS WEEK WE SAW
Exp=Expectations, Rev=Revision, Prev=Previous
| |
|
UNITED STATES
- US Wholesale Sales MM (Mar) -1.3% (Prev. 2.3%, Rev. 2.0%)
- US Wholesale Inventory MM (Mar) -0.4% vs. Exp. -0.4% (Prev. -0.4%)
- Atlanta Fed GDPnow (Q2): 4.2% (prev. 3.3%)
- US Initial Jobless Claims w/e 231.0k vs. Exp. 215.0k (Prev. 208.0k, Rev. 209k), highest since August 2023.
- US Continued Jobless Claims w/e 1.785M vs. Exp. 1.785M (Prev. 1.774M, Rev. 1.768M)
CHINA
- Chinese Caixin Services PMI (Apr) 52.5 vs. Exp. 52.5 (Prev. 52.7); Composite PMI (Apr) 52.8 (Prev. 52.7)
- Chinese Trade Balance (USD)(Apr) 72.35B vs. Exp. 77.5B (Prev. 58.55B)
- Chinese Exports YY (USD)(Apr) 1.5% vs. Exp. 1.5% (Prev. -7.5%)
- Chinese Imports YY (USD)(Apr) 8.4% vs. Exp. 4.8% (Prev. -1.9%)
- Chinese Trade Balance (CNY)(Apr) 513.5B (Prev. 415.9B)
- Chinese Exports YY (CNY)(Apr) 5.1% (Prev. -3.8%)
- Chinese Imports YY (CNY)(Apr) 12.2% (Prev. 2.0%)
JAPAN
- Japanese Overall Labor Cash Earnings YY (Mar) 0.6% vs. Exp. 1.5% (Prev. 1.8%)
- Japanese All Household Spending MM (Mar) 1.2% vs. Exp. -0.3% (Prev. 1.4%)
- Japanese All Household Spending YY (Mar) -1.2% vs. Exp. -2.4% (Prev. -0.5%)
UK
- UK BRC Retail Sales YY (Apr) -4.4% (Prev. 3.2%)
- UK BRC Total Sales Y/Y (Apr) -4.0% (Prev. 3.5%)
- UK S&P Global PMI: Composite - Output (Apr) 54 (Prev. 52.6); Global Construction PMI (Apr) 53 vs. Exp. 50.0 (Prev. 50.2)
- UK BRC Retail Sales YY (Apr) -4.4% (Prev. 3.2%); Total Sales Y/Y -4.0% (Prev. 3.5%)
- UK Halifax House Prices MM (Apr) 0.1% (Prev. -1.0%, Rev. -0.9%); YY 1.1% (Prev. 0.30%, Rev. 0.4%)
- UK S&P Global Construction PMI (Apr) 53 vs. Exp. 50.0 (Prev. 50.2)
- UK RICS Housing Survey (Apr) -5.0 vs. Exp. -2.0 (Prev. -4.0, Rev. -5.0)
- UK GDP Estimate MM (Mar) 0.4% vs. Exp. 0.10% (Prev. 0.10%, Rev. 0.2%); YY 0.7% vs. Exp. 0.30% (Prev. -0.20%, Rev. 0.0%). Click here for more details.
- UK GDP Prelim QQ (Q1) 0.6% vs. Exp. 0.4% (Prev. -0.3%); YY 0.2% (Prev. -0.2%)
AUSTRALIA
- Australian Retail Trade (Q1) -0.4% vs. Exp. -0.2% (Prev. 0.3%, Rev. 0.4%)
SWITZERLAND
- Swiss Unemployment Rate Adj. (Apr) 2.3% vs. Exp. 2.3% (Prev. 2.3%)
NORWAY
- *Norwegian Core Inflation YY (Apr) 4.4% vs. Exp. 4.3% (Prev. 4.5%)**; Consumer Price Index YY (Apr) 3.6% vs. Exp. 3.5% (Prev. 3.9%)
HUNGARY
- Hungarian CPI YY (Apr) 3.7% vs. Exp. 3.7% (Prev. 3.6%)
| | |
|
EU
- EU HCOB Composite Final PMI (Apr) 51.7 vs. Exp. 51.4 (Prev. 51.4); HCOB Services Final PMI (Apr) 53.3 vs. Exp. 52.9 (Prev. 52.9)
- EU HCOB Services Final PMI (Apr) 53.3 vs. Exp. 52.9 (Prev. 52.9)
- EU Sentix Index (May) -3.6 vs. Exp. -5.0 (Prev. -5.9)
- EU Producer Prices MM (Mar) -0.4% vs. Exp. -0.4% (Prev. -1.0%, Rev. -1.1%)
- EU Producer Prices YY (Mar) -7.8% vs. Exp. -7.7% (Prev. -8.3%, Rev. -8.5%)
- EU Retail Sales MM (Mar) 0.8% vs. Exp. 0.7% (Prev. -0.5%, Rev. -0.3%)
- EU Retail Sales YY (Mar) 0.7% vs. Exp. -0.2% (Prev. -0.7%, Rev. -0.5%)
GERMANY
- German HCOB Services PMI (Apr) 53.2 vs. Exp. 53.3 (Prev. 53.3)
- German HCOB Composite PMI (Apr) 50.6 vs. Exp. 50.6 (Prev. 50.5)
- German HCOB Construction PMI (Apr) 37.5 (Prev. 38.3); France HCOB Construction PMI (Apr) 41.5 (Prev. 41.0); Italian HCOB Construction PMI (Apr) 48.5 (Prev. 50.3); EU HCOB Construction PMI (Apr) 41.9 (Prev. 42.4)
- German Trade Balance, EUR, SA (Mar) 22.3B vs. Exp. 22.2B (Prev. 21.4B); Exports MM 0.9% vs. Exp. 0.4% (Prev. -2.0%); Imports MM 0.3% vs. Exp. -1.0% (Prev. 3.2%)
- German Industrial Orders MM (Mar) -0.4% vs. Exp. 0.4% (Prev. 0.2%, Rev. -0.8%)
- Manheim Used Vehicle Value Index (Apr) -14.0% Y/Y (prev. -14.7%)
- German Industrial Orders MM (Mar) -0.4% vs. Exp. 0.4% (Prev. 0.2%)
- German Trade Balance (EUR)(Mar) 22.3B vs. Exp. 22.2B (Prev. 21.4B)
- German Exports MM SA (Mar) 0.9% vs. Exp. 0.4% (Prev. -2.0%)
- German Imports MM SA (Mar) 0.3% vs. Exp. -1.0% (Prev. 3.2%)
- German Industrial Output MM (Mar) -0.4% vs. Exp. -0.6% (Prev. 2.1%, Rev. 1.7%)
- German Industrial Output MM (Mar) -0.4% vs. Exp. -0.6% (Prev. 2.1%, Rev. 1.7%)
ITALY
- Italian Retail Sales SA MM* (Mar) 0.0% (Prev. 0.1%); Retail Sales NSA YY (Mar) 2.0% (Prev. 2.4%)
- Italian Industrial Output MM SA (Mar) -0.5% vs. Exp. 0.3% (Prev. 0.1%); Industrial Output YY WDA (Mar) -3.5% (Prev. -3.1%)
FRANCE
- French HCOB Services PMI (Apr) 51.3 vs. Exp. 50.5 (Prev. 50.5)
- French HCOB Composite PMI (Apr) 50.5 (Prev. 49.9)
- French Trade Balance, EUR, SA (Mar) -5.473B (Prev. -5.244B, Rev. -5.614B); Non-Farm Payrolls QQ (Q1) 0.2%; Imports, EUR (Mar) 57.698B (Prev. 56.296B, Rev. 56.366B); Exports, EUR (Mar) 52.224B (Prev. 51.052B, Rev. 50.752B); Current Account (Mar) 1.3B (Prev. 0.9B, Rev. 0.3B)
SPAIN
- Spanish CPI YY Flash NSA (Apr) 3.3% (Prev. 3.2%)
- Spanish HICP Flash YY (Apr) 3.4% vs. Exp. 3.3% (Prev. 3.3%)
- Spanish Ind Output Cal Adj. YY (Mar) -1.2% (Prev. 1.5%, Rev. 1.3%)
| |
CURRENT MARKET PERSPECTIVE | |
|
COMING WEEK IS ABOUT INFLATION (CPI, PPI)
THE FOLLOWING WEEK IS ABOUT NVIDIA EARNINGS
Click All Charts to Enlarge
| |
|
FIRST INFLATION THEN NVIDIA: The market will be focused on Inflation next week with the release of the April CPI and PPI. We expect Inflation (OER) to weaken which should be good for equities. This is likely to prepare NVIDIA nicely for its earnings the following week (May 22nd)! Any disappointment will have a major market impact.
As goes NVDA, so goes the MAG-7!
| |
|
1 - SITUATIONAL ANALYSIS
Only 9.5B shares traded and $487B in terms of notional. This week had the 1st, 2nd and 4th lightest notional days of the year. The composite value traded on the week was down ~67 vs the YTD average, and total volume traded was down ~13%.
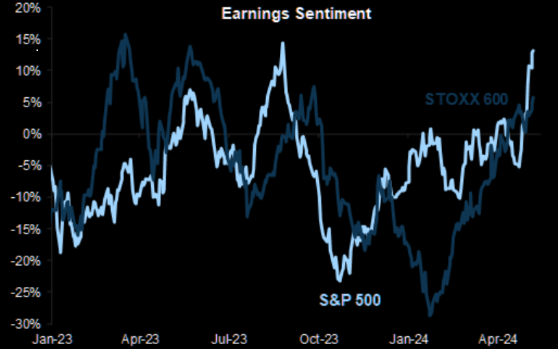
Not a good sign when earnings sentiment in the US is going up "rocket" like (see chart right), with nearly 90% of S&P 500 companies having now reported Q1 earnings.
RECAP
- 78% beat EPS estimates
- 8% Surprising positively
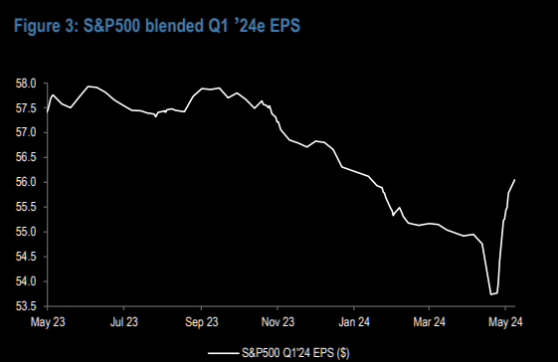
- 5% Y-o-Y EPS growth (Chart Below)
| |
"AS GO THE BANKS, SO GO THE MARKETS" | |
|
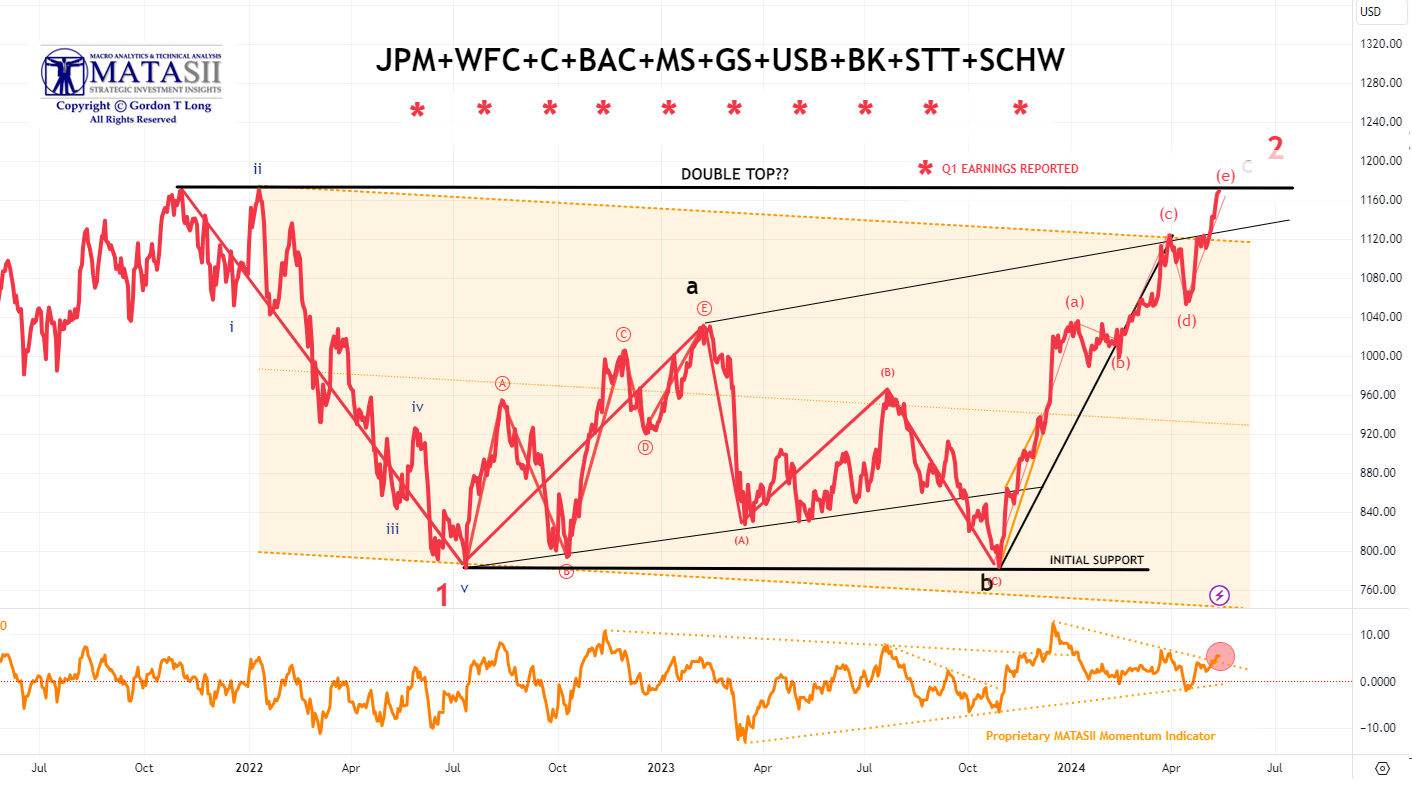
MATASII BANKING STOCK INDEX
- Bank stocks, though initially weak on earnings release, have been trending up ever since.
- The MATASII Bank Stock Index broke through two overhead resistance trend lines this week before achieving the Double Top we felt was in the cards and this equity market could potentially correct any further.
- The MATASII's Proprietary Momentum Indicator (lower pane) has pushed through its overhead resistance trend line.
-
A decisive break of this Double Top and markets are headed higher. On the other hand, we have stretched for an Ending Double Top?
| |
|
YOUR DESKTOP / TABLET / PHONE ANNOTATED CHART
Macro Analytics Chart Above: SUBSCRIBER LINK
| |
|
2 - FUNDAMENTAL ANALYSIS
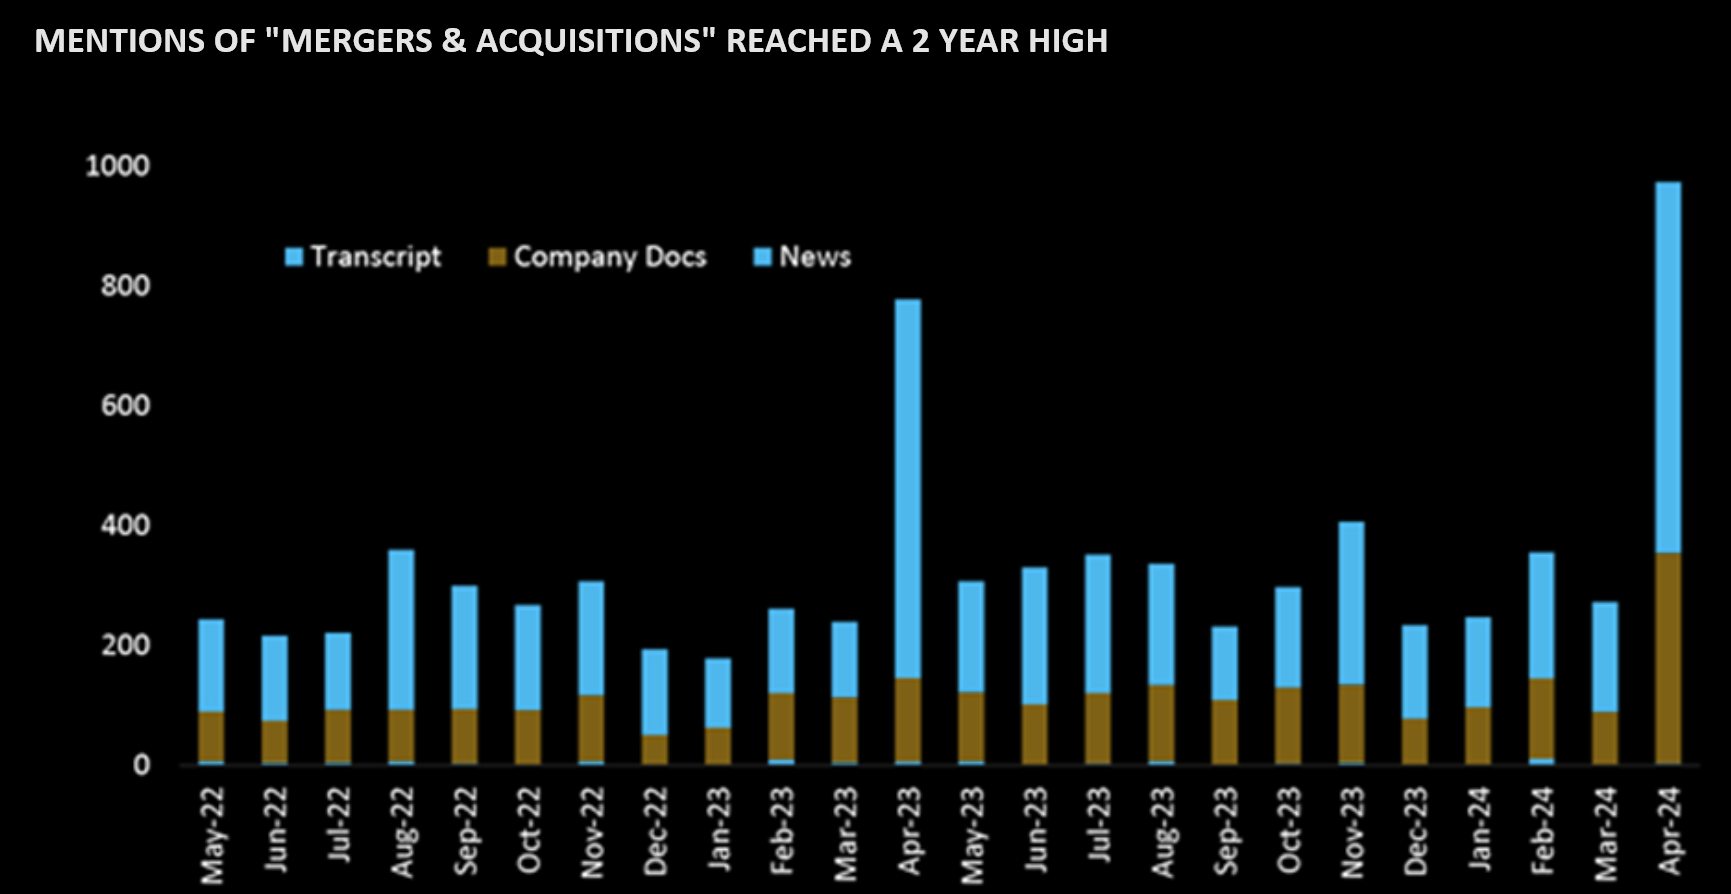
THE M&A FEVER STARTING TO SHOW
M&A prospects have been re-ignited particularly in the metals due to:
- Escalating supply stress across several commodities,
- A strengthening demand narrative for metals like copper, and
- A sharp de-rating of mining equities during 1Q24 to GFC/COVID lows.
In fact, mentions of “Mergers & Acquisitions” in industry discussions have picked-up considerably in April to >3x the average of the last two years (according to data retrieved from Alpha Sense).
NOTE: ALL OF THE ABOVE ARE "LATE-CYCLE" CHARACTERISTICS
| |
WHAT IS KEEPING THE MARKET BUOYANT: CORPORATE BUYBACKS
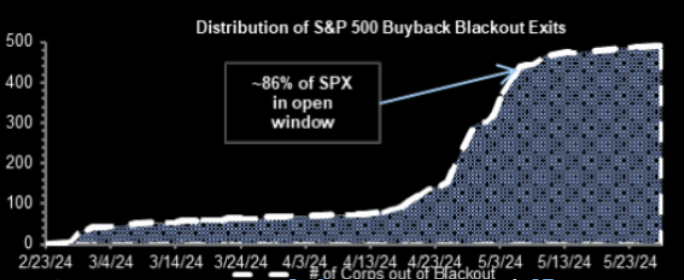
We are now in an open window, estimated to run through 6/14/24. As of end of the week, ~92% will be in the open window. Buyback volumes last week finished 1.4x vs 2023 YTD ADTV. Active week for new repurchase authorizations with 46 programs authorized this week for $144.5B.
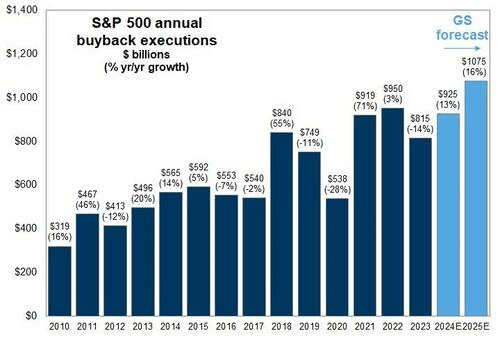
There is more than $1 trillion in Corporate Buybacks slated for 2024, many buybacks remain to complete. Such is particularly the case with Google adding another $70 billion to that total.
| |
|
FED RATE CUTS FOLLOWS THE 2Y T-BILL
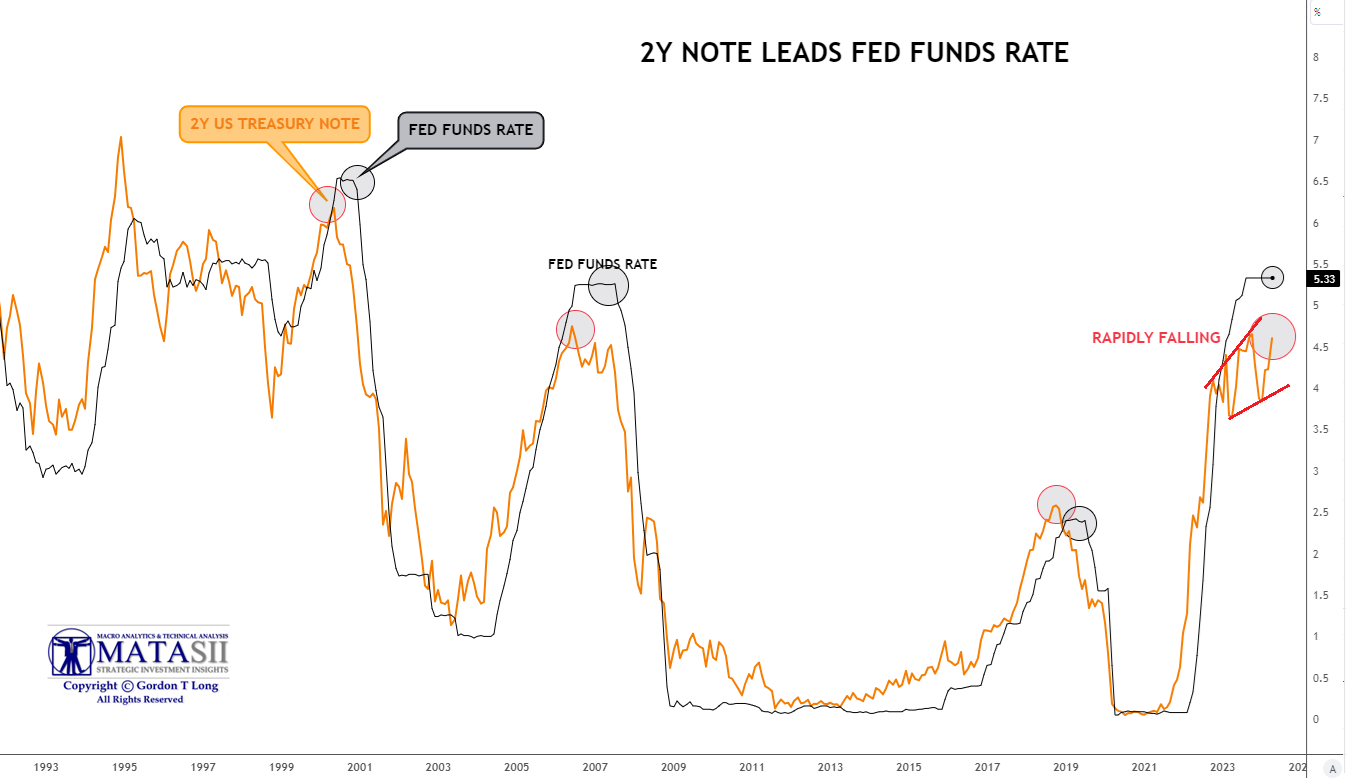
As the chart below illustrates, the Fed never leads with Rate Cuts, but historically always follows the 2 Year Treasury Note.
There is a noticeable difference in the typical manner in which this unfolds. Normally once the 2Y notes start to fall in yield, it is steadily downward. Once the Fed begins to follow, it typically catches up and surpasses the low end of the 2Y Note yield.
This time the 2 Year Note, after initially sending a triggering signal, has been rising back towards the "capped" Fed Funds Rate.
| |
|
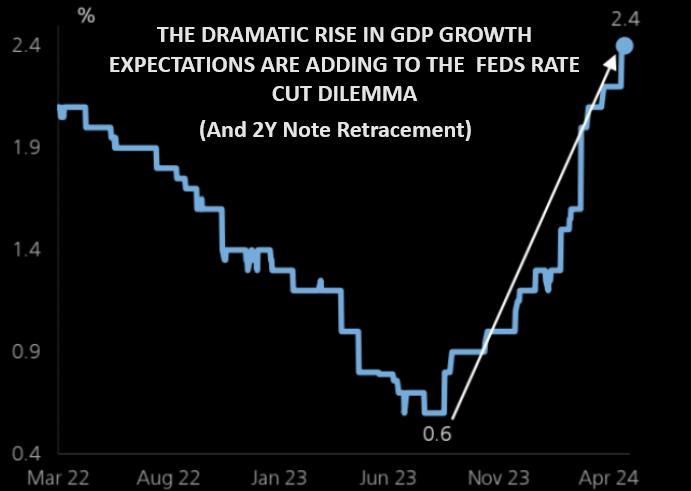
We don't see this as the Fed having any great insight, but rather the banking and finance complex realizing that government Fiscal spending is behaving in a manner not previously seen. There appears to be little concern about government deficit spending as a percentage of GDP being a concern in this election year.
6% has been considered an upper bound, but now 8% and higher may be in the cards. This is resulting in the Fed having to guide that rates will be "Higher for Longer" in its fight to rein in inflation. This is forcing 2Y notes to retrace some of its downward movement.
Our read is that the Fed would rather leave its inflation fight in this election to focus on not allowing the economy to fall into a major slowdown and widespread layoffs occurring prior to the election. The May Labor Report was an important indication that the labor market is coming under stress as the Unemployment Rate picked up to 3.9%. We believe 4% is the trigger level for the Fed and the 2 Year Note.
| |
|
3 - SPECIAL SECTION
As the market temporarily stalls, the breadth is broadening with major moves underway.
IN A QUIET MARKET HERE IS WHERE THE MONEY IS BEING MADE:
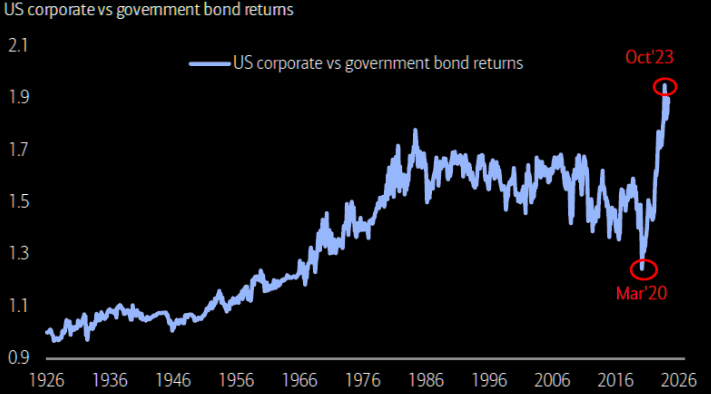
US CORPORATE BONDS
This has been the biggest outperformance of corporate over government bonds in 100 years
| |
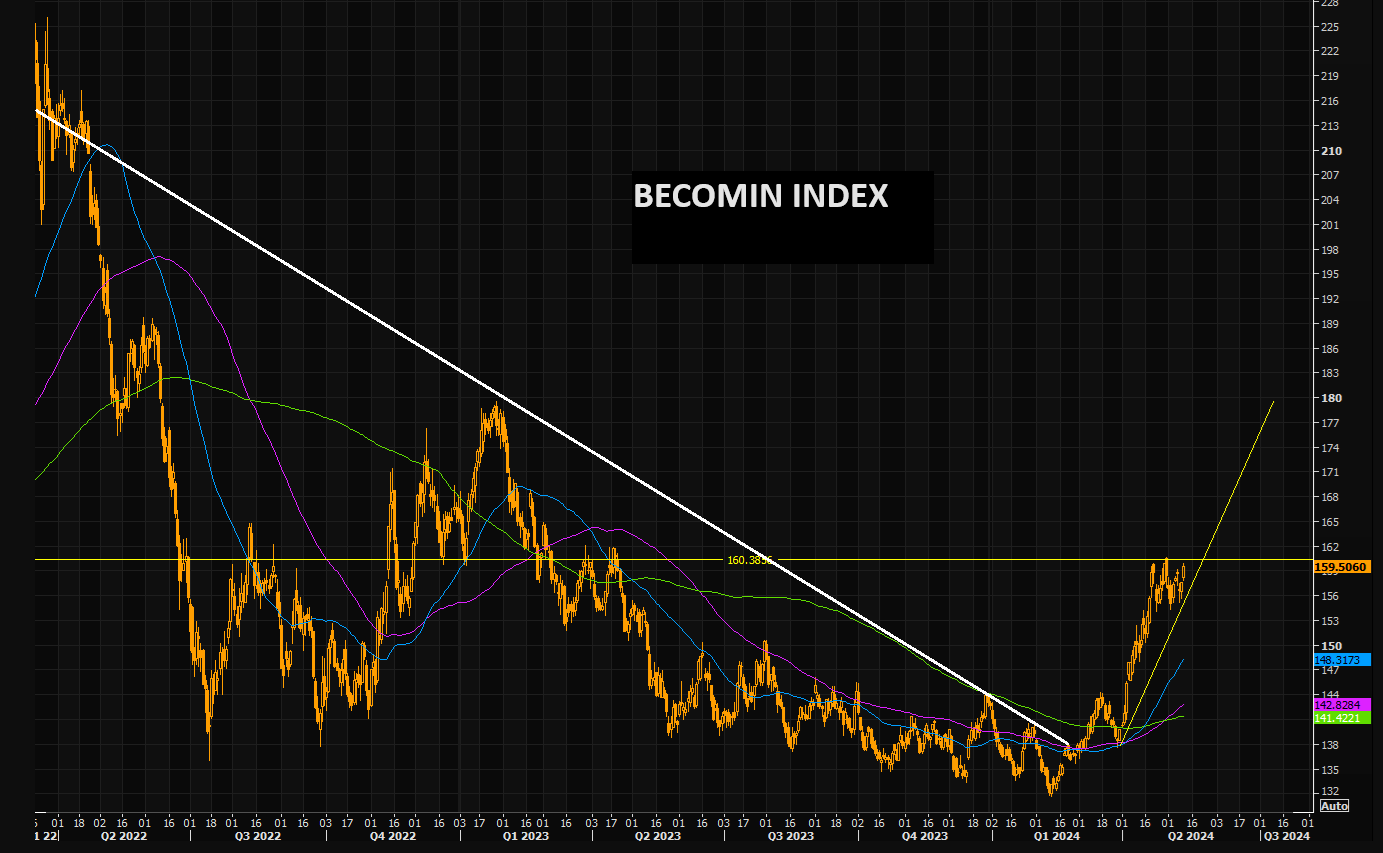
METALS
BCOMIN index (aluminum, copper, nickel and zinc) is pushing recent highs again (Chart Right).
This space has been in fire over the past weeks, but zoom out and you realize things could get much more squeezy.
Note that the 100 day just crossed above the 200 day as well.
CHART BELOW
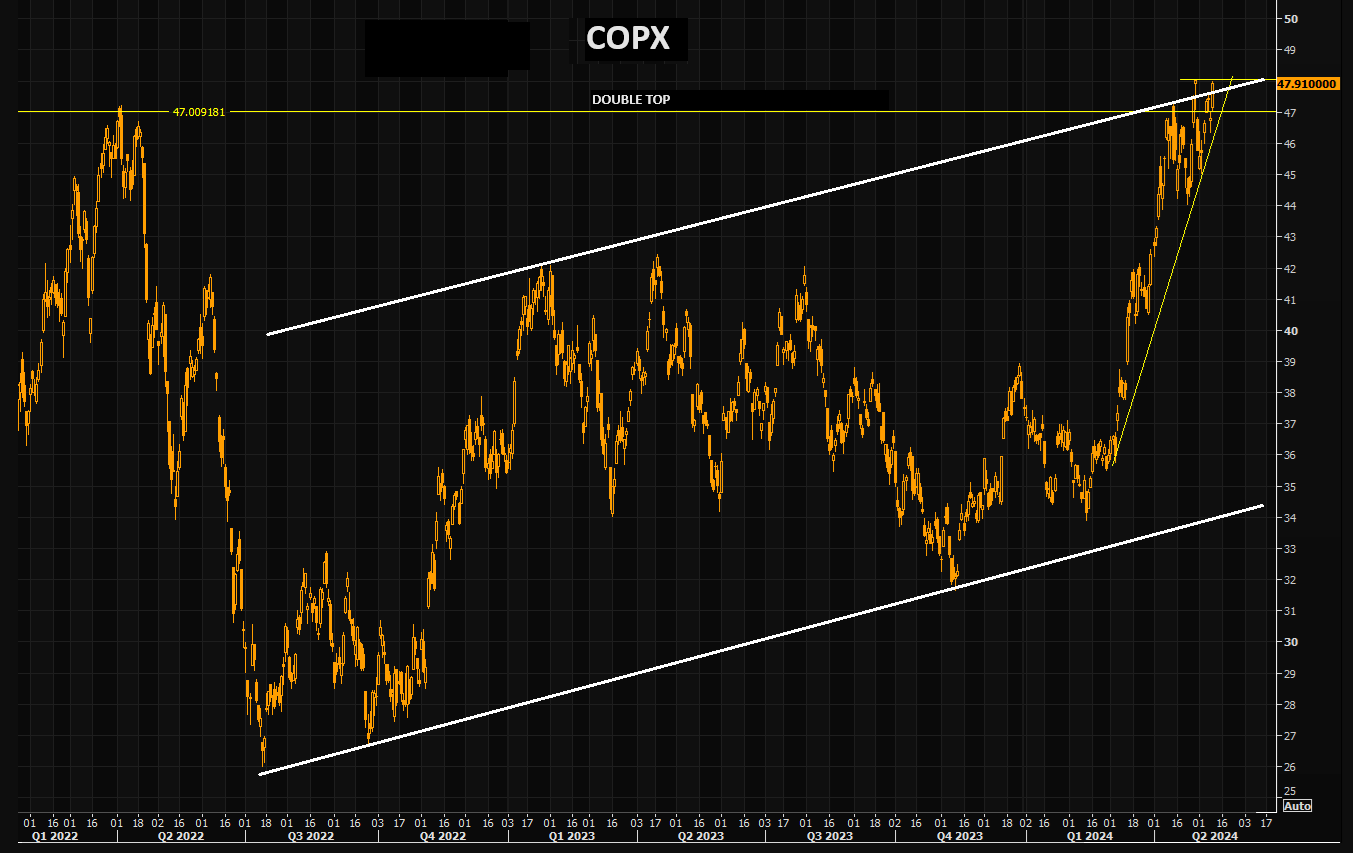
Copper, the "AI play-with-a-Lag" continues to perform very well. The metal is taking out new recent highs. The latest bounce on the 21 day was perfect. The direct AI plays such as NVDA have given way to more indirect themes. Chart shows Copper vs NVDA.
| |
GOLD MINERS (GDX)
GDX just closed above big short term resistance levels.
There is one more level to consider, the highs from 2023 at $36.
A close above and things could get even more squeezy for this "forgotten" sector.
Worth recalling is UBS' logic from early April "...GDX is still 50% vs 2011 and sees a case for GDX call options."
| |
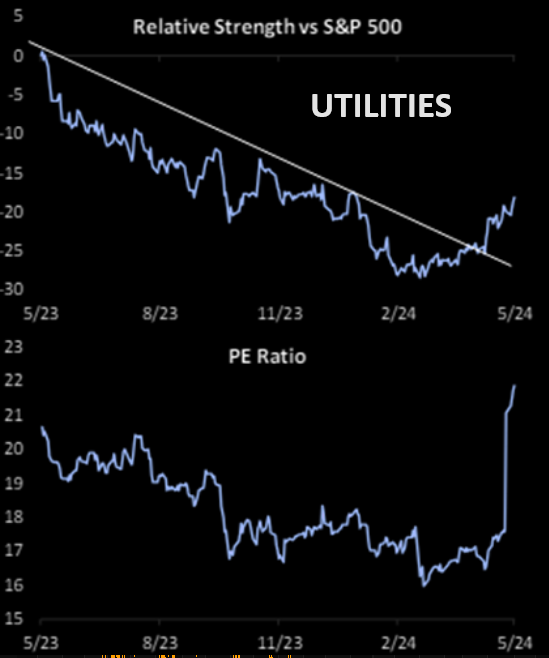
UTILITIES
The Utilities sector has been the second best of the eleven S&P 500 sectors so far in 2024, and it's the best performing sector so far in May.
The XLU Utilities RSI is at 78...printing another new recent high. with momentum that has taken most by surprise.
Additionally, the gap between XLU and the US 10 year inverse has widened even more.
| |
4 - TECHNICAL ANALYSIS
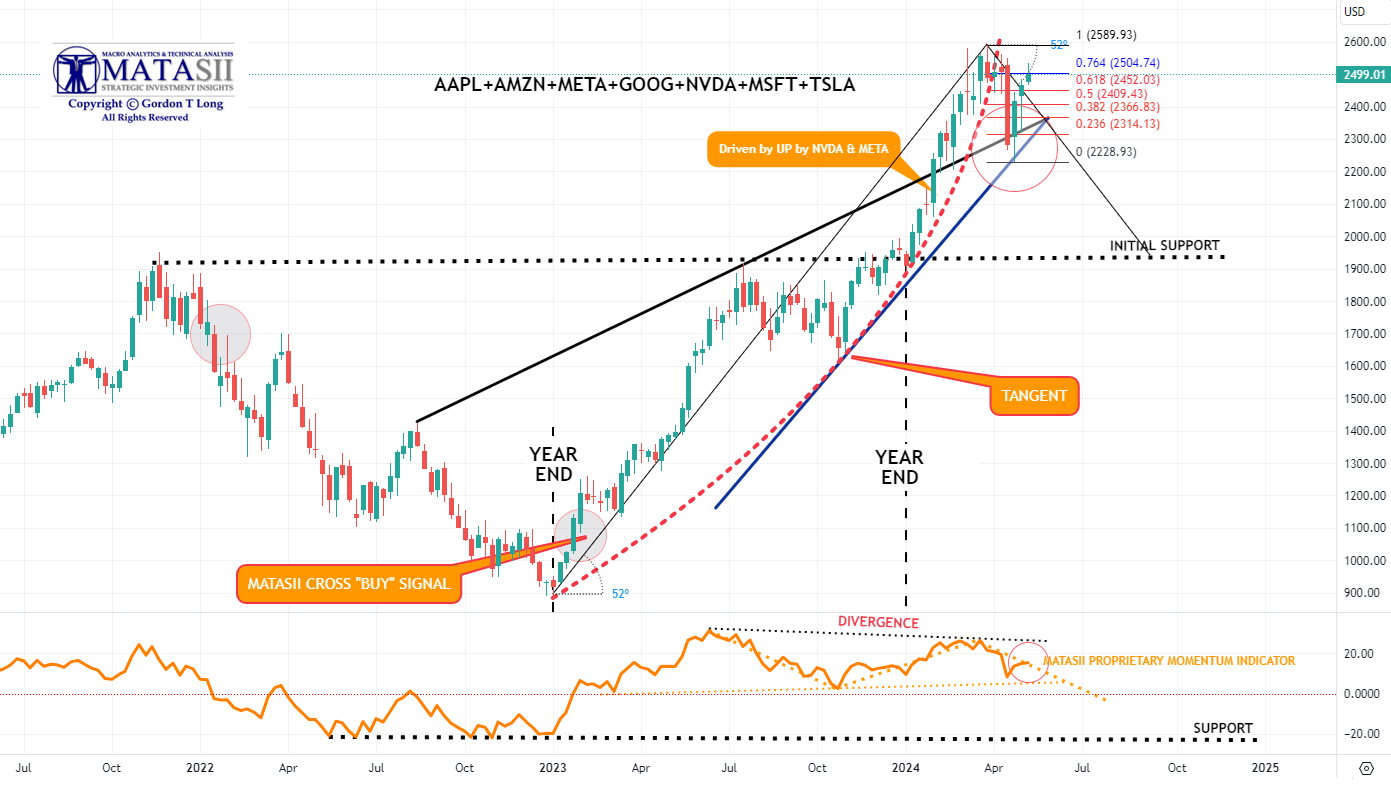
MAGNIFICENT 7
Total CAPEX + R&D for the Magnificent Seven this year is expected to total $348bn (think about that for a second).
Here’s another way to frame it: the Magnificent 7 is reinvesting 61% of their operating free cash flow back into
CAPEX + R&D!
- We were reaching the vertical lift part of the parabolic (geometric) lift shown by the dashed red line, before falling off and then retracing after the release of the Labor Report last Friday.
- In the short term, Momentum (bottom pane) is testing the overhead Momentum trend line resistance level (dotted orange line).
| |
YOUR DESKTOP / TABLET / PHONE ANNOTATED CHART
Macro Analytics Chart Above: SUBSCRIBER LINK
| |
|
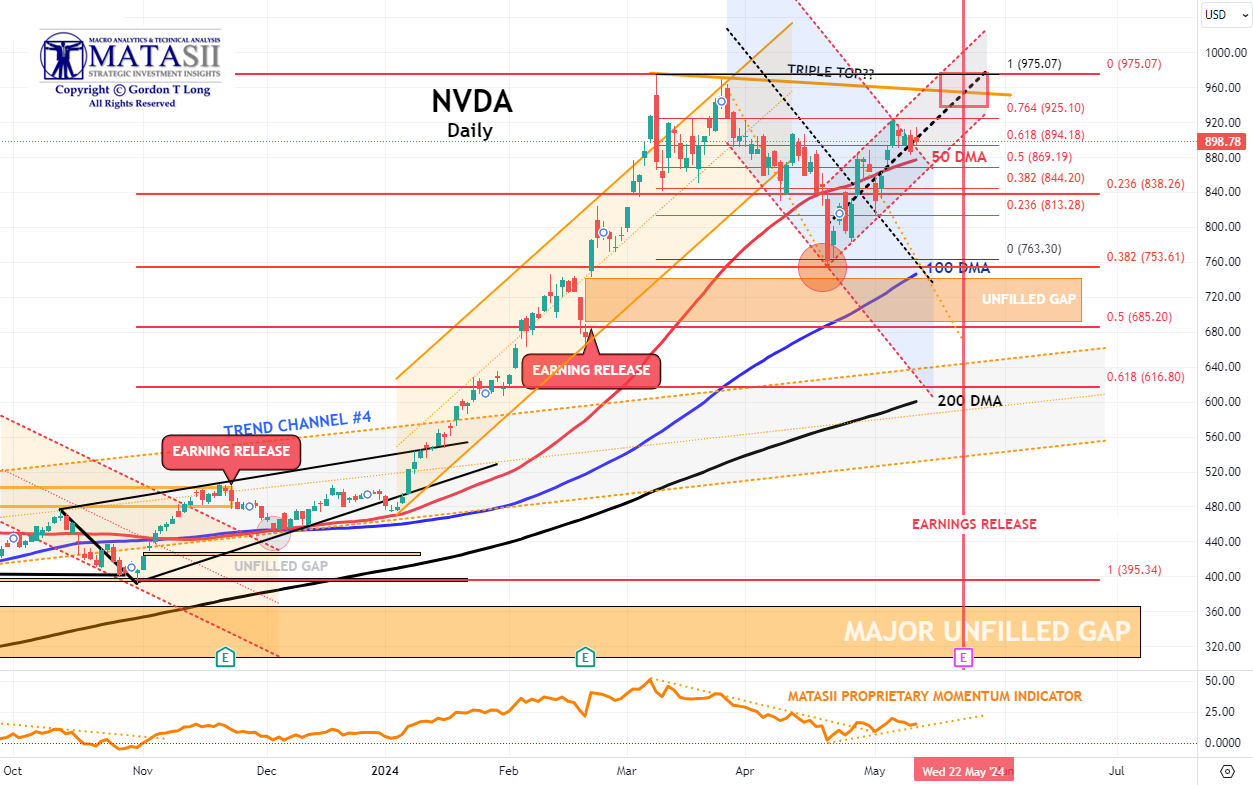
NVDA - Daily
- NVDA again broke through the overhead 50 DMA on a retest to reach a 76.4% Fibonacci Retracement level. Normally when this level of Fibonacci is reached a Double Top follows. Double Tops normally result in Market Resistance before being possibly broken. Typically they are signs of short to Intermediate Term Tops.
- NVDA Momentum (lower pane) has also broken through its overhead resistance trend line (dotted orange trend line).
- This counter rally has been noticeably strong for NVDA as it prepares for its May 22nd Earnings release.
- The pattern is currently suggesting we are in a corrective wave 2 of what may be a downward 5 count.
- With earnings release fast approaching (marked by the red "E" box at the bottom of the pane), this potentially could be a set-up for NVDA to move towards its 200 DMA for support. Even strong earnings could be found to "disappoint" on any newly surfacing concerns?
- A decisive break of the Double Top and we are likely to see the Bulls take control of the market!
| |
|
YOUR DESKTOP / TABLET / PHONE ANNOTATED CHART
Macro Analytics Chart Above: SUBSCRIBER LINK
| |
|
"CURRENCY" MARKET (Currency, Gold, Black Gold (Oil) & Bitcoin)
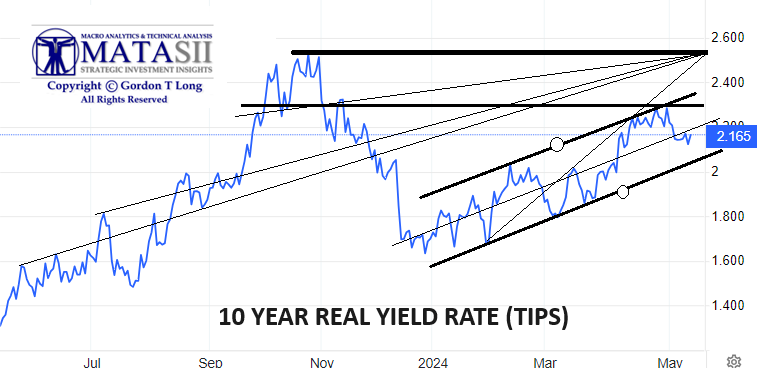
CHART RIGHT: Real Rates reached our initial overhead resistance level of 2.25% before falling off hard with last Friday's Labor Report.
This weeks Jobless Claims added to the downward movement.
TRADING RANGE: Equity markets reacted to labor market pressures associated with a weakening Jobs Report (Friday).
Yields & Rates will likely test the lower trend line (chart above right) as it waits on the next CPI report scheduled for release on May 15th.
CONTROL PACKAGE
There are TEN charts we have outlined in prior chart packages, which we will continue to watch closely as a CURRENT Control Set:
-
US DOLLAR -DXY - MONTHLY (CHART LINK)
-
US DOLLAR - DXY - DAILY (CHART LINK)
-
GOLD - DAILY (CHART LINK)
-
GOLD cfd's - DAILY (CHART LINK)
-
GOLD - Integrated - Barrick Gold (CHART LINK)
- SILVER - DAILY (CHART LINK)
-
OIL - XLE - MONTHLY (CHART LINK)
-
OIL - WTIC - MONTHLY - (CHART LINK)
-
BITCOIN - BTCUSD -WEEKLY (CHART LINK)
-
10y TIPS - Real Rates - Daily (CHART LINK)
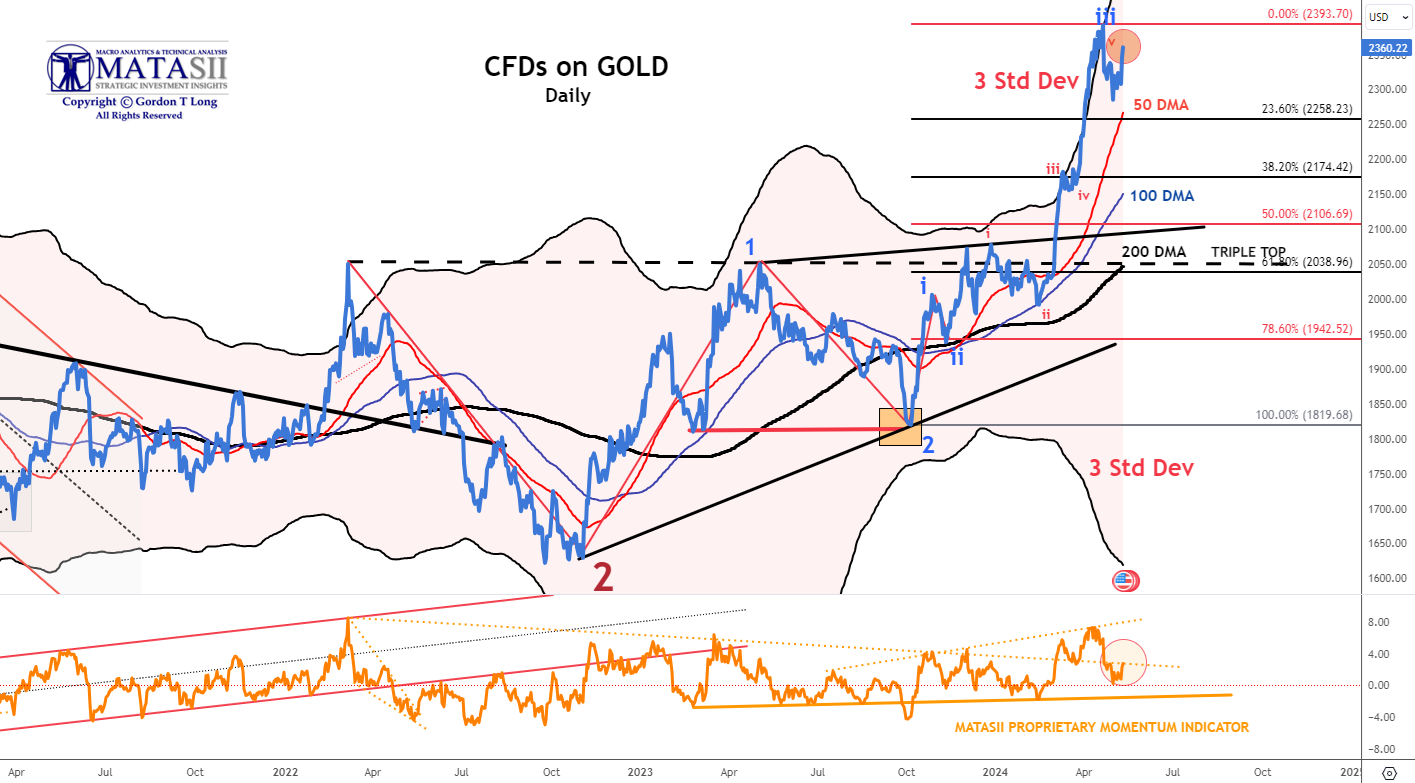
GOLD (cfd) - DAILY
- Gold pulled back on Monday finding initial support at the 23.6% Fibonacci Retracement level. (The CFD did not!)
- Gold Momentum (lower pane) for the cfd found support slightly lower at the dotted orange trend line.
- Gold Momentum for the cfd has now reached an overhead resistance level (dotted orange line in lower pane).
|  | |
YOUR DESKTOP / TABLET / PHONE ANNOTATED CHART
Macro Analytics Chart Above: SUBSCRIBER LINK
| |
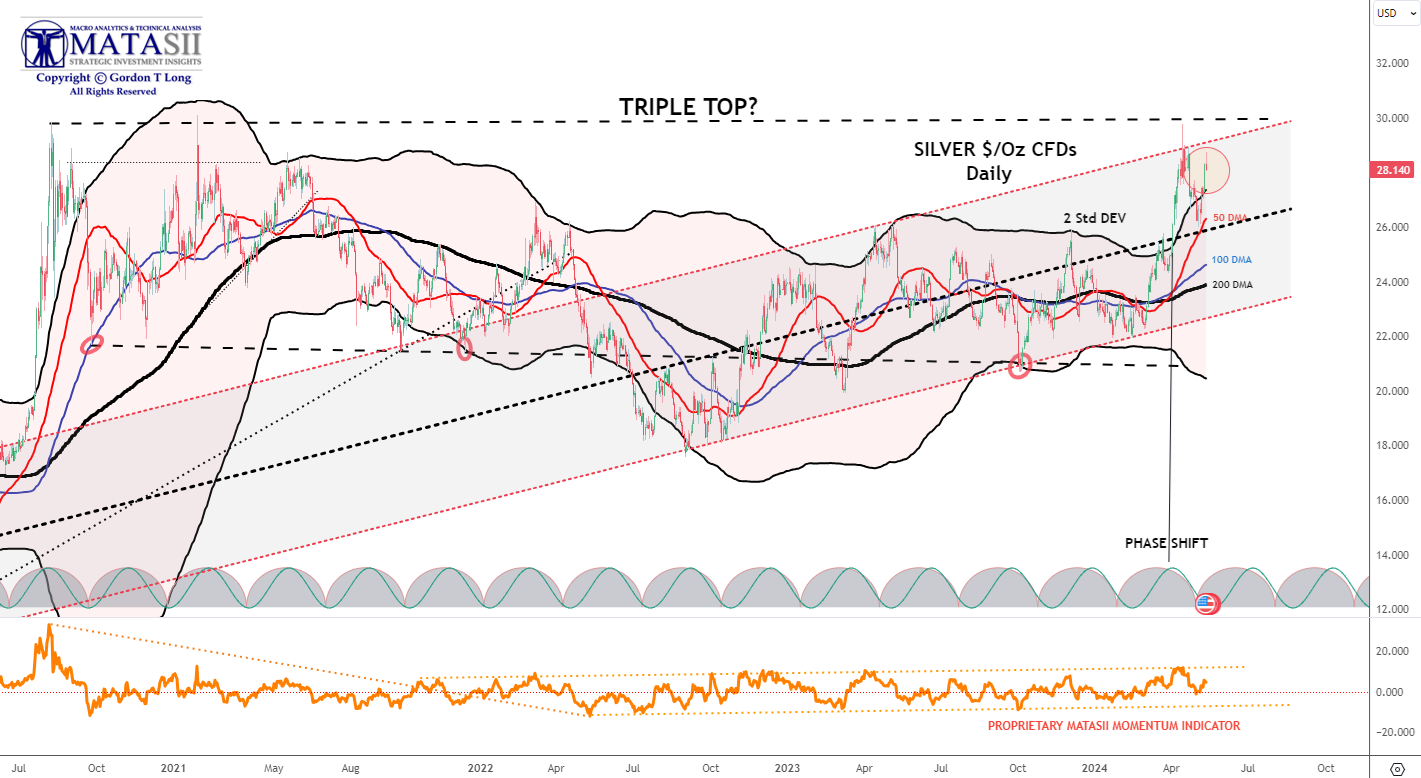
SILVER - Daily
- Silver came off its upper trend channel boundary (shaded channel) and moved quickly back towards its 2 Standard Deviation Bomar Band (Black Line) before rebounding.
- The 50 / 100 / 200 DMAs are widely spread and normally need to be tightened as part of a corrective consolidation before Silver heads higher.
- The MATASII Proprietary Momentum Indicator (lower pane) offered initial support.
-
The pattern suggests Silver (like the Gold Miners) is building for a Break-Out. (NOTE: A Fed Pivot to lower rates can be expected to weaken the dollar which is normally Bullish for Precious Metals priced in US Dollars.)
| |
|
YOUR DESKTOP / TABLET / PHONE ANNOTATED CHART
Macro Analytics Chart Above: SUBSCRIBER LINK
| |
|
US EQUITY MARKETS
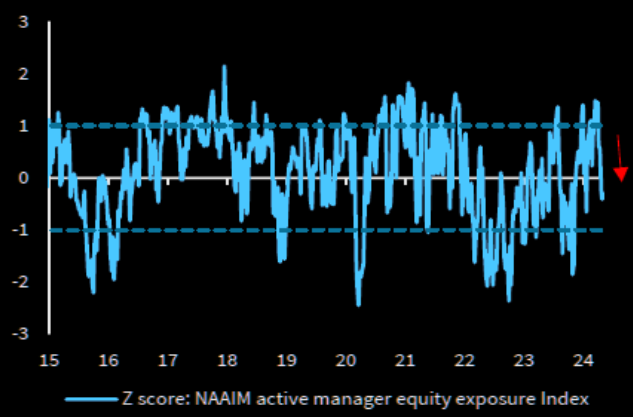
"The backdrop today is neither Goldilocks nor stagflation. the domestic economy, however, is still plodding forward. So, if I had to make a bet for now, I’d simply take the over on US nominal growth. With that comes some high class challenges and a choppy tape, but there’s still plenty to do in the seams. and, again, I certainly would not pick a fight with the best parts of the market at this end of the range" - Goldman Sachs
CHART RIGHT: Active managers have been reducing risk.
CONTROL PACKAGE
There have FIVE charts we have outlined in prior chart packages that we will continue to watch closely as a CURRENT "control set":
|
- The S&P 500 (CHART LINK)
- The DJIA (CHART LINK)
- The Russell 2000 through the IWM ETF (CHART LINK)
- The MAGNIFICENT SEVEN (CHART ABOVE WITH MATASII CROSS - LINK)
- Nvidia (NVDA) (CHART LINK)
| |
S&P 500 CFD
- The S&P 500 cfd bounced off its 100 DMA once again to only subsequently retrace to test an upper trend line (black dashed trend line),
- Momentum (lower pane) also bounced off its lower support to a more neutral level. Bothe the MATASII Momentum Indicator and RSI suggest there is little more to go on this upward leg.
- Expect the Moving Averages (50/100/200 DMA) to narrow and tighten.
- We have a trading range set-up as the market looks for more guidance and corporate buybacks to resume.
| |
YOUR DESKTOP / TABLET / PHONE ANNOTATED CHART
Macro Analytics Chart Above: SUBSCRIBER LINK
| |
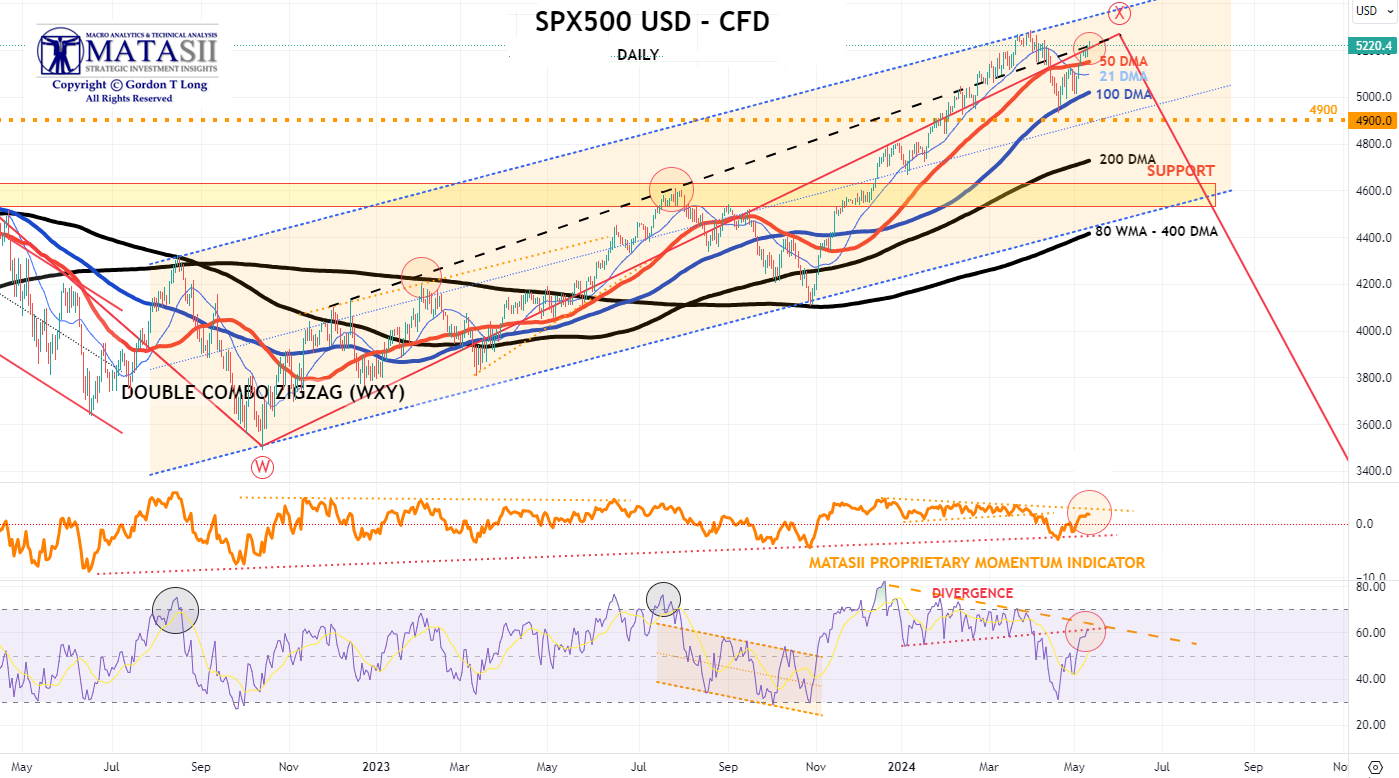
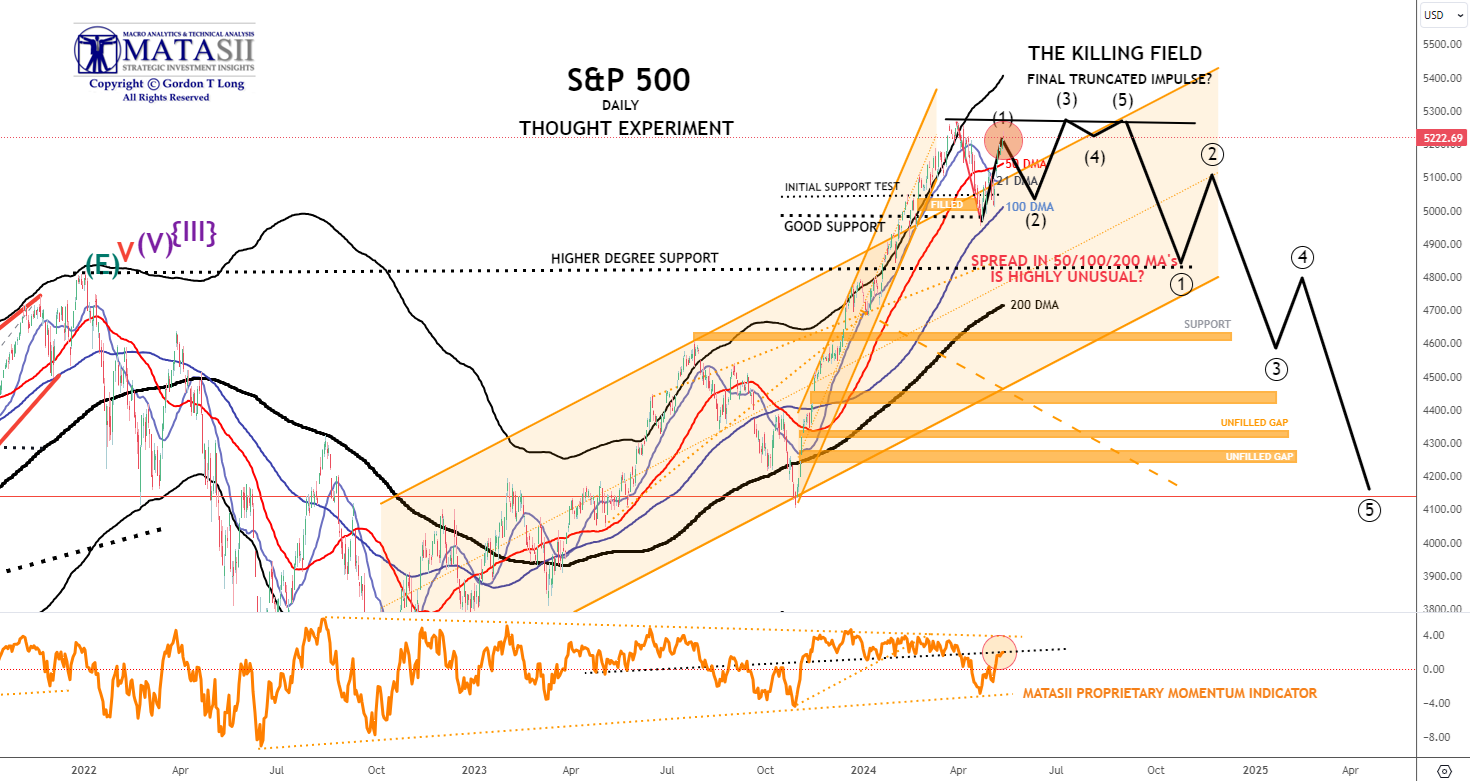
S&P 500 - Daily - Our Thought Experiment
Our Thought Experiment, which we have discussed many times previously in the way of a projection, suggests we have put in a near term top and will now consolidate before possibly completing one final small impulse higher OR put in a final Wave 5 of a higher degree.
NOTE: To reiterate what I previously wrote - "the black labeled activity shown below, between now and July, looks like a "Killing Field" where the algos take Day Traders, "Dip Buyers", the "Gamma Guys" and FOMO's all out on stretchers!"
- The S&P 500 bounced off its 100 DMA once again to only subsequently retrace to test its 50 DMA (and above) a second time.
- Momentum (lower pane) also found support at its lower trend support line before retracing to an overhead resistance trend line. From a momentum perspective the S&P 500 appears that it may still have further upside to go.
- We appear to be in a short term trading range as the market looks for more guidance and corporate buybacks to resume.
- The 50/100/200 DMA bands are unusually wide and normally markets will narrow the gaps in a consolidation / corrective action.
- It will take a major new catalyst to keep the bands this separated.
OUR CURRENT ASSESSMENT IS THAT THE INTERMEDIATE TERM IS LIKELY TO LOOK LIKE THE FOLLOWING: (NOTE - The black projection has not been changed since prior posts so as to serve as a reference)
|  | |
YOUR DESKTOP / TABLET / PHONE ANNOTATED CHART
Macro Analytics Chart Above: SUBSCRIBER LINK
| STOCK MONITOR: What We Spotted | |
BOND MARKET
CONTROL PACKAGE
There have FIVE charts we have outlined in prior chart packages that we will continue to watch closely as a CURRENT "control set":
- The 10Y TREASURY NOTE YIELD - TNX - HOURLY (CHART LINK)
- The 10Y TREASURY NOTE YIELD - TNX - DAILY (CHART LINK)
- The 10Y TREASURY NOTE YIELD - TNX - WEEKLY (CHART LINK)
- The 30Y TREASURY BOND YIELD - TNX - WEEKLY (CHART LINK)
- REAL RATES (CHART LINK)
FISHER'S EQUATION = 10Y Yield = 10Y INFLATION BE% +REAL % = 2.34% + 2.165% = 4.505%
- The TNX broke downward through support at its 144 EMA (solid black moving average) on last Friday's Labor Report. It appears to have found near term support which it bounced off of.
| |
YOUR DESKTOP / TABLET / PHONE ANNOTATED CHART
Macro Analytics Chart Above: SUBSCRIBER LINK
| |
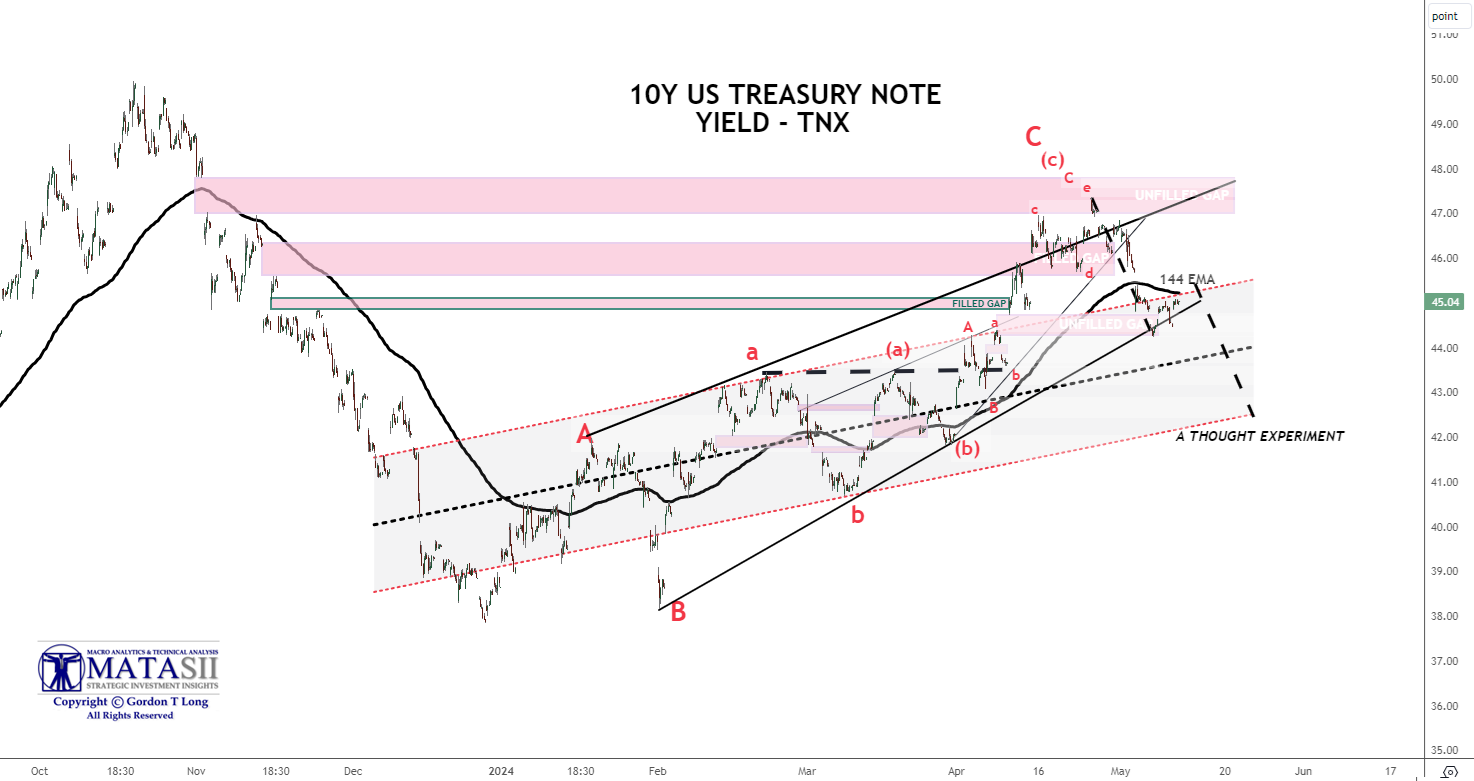
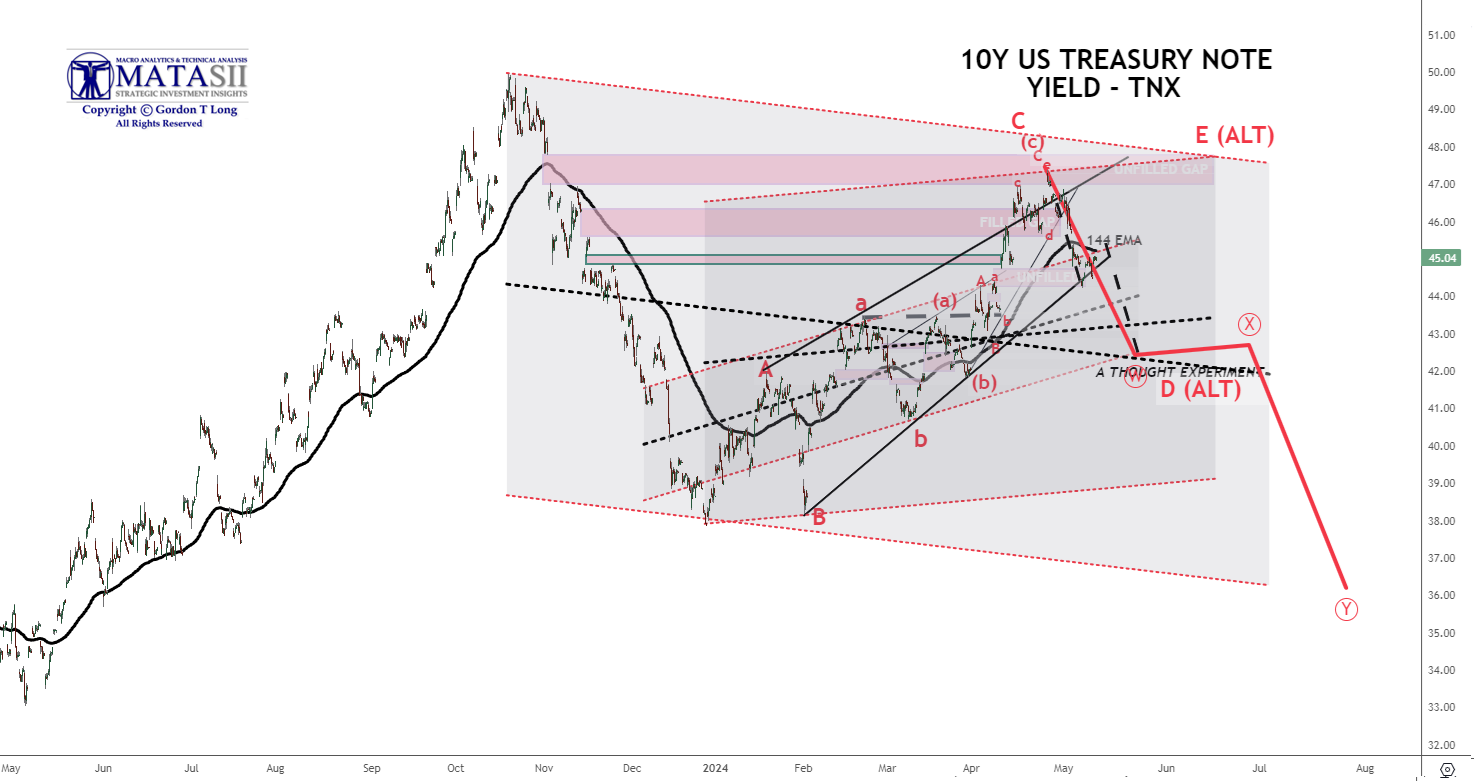
TNX THOUGHT EXPERIMENT
- We outline a projective "Thought Experiment" with dashed black lines suggesting an "ABC" corrective pattern before yields establish a final Intermediate top in yields
| |
YOUR DESKTOP / TABLET / PHONE ANNOTATED CHART
Macro Analytics Chart Above: SUBSCRIBER LINK
| |
NOTICE Information on these pages contains forward-looking statements that involve risks and uncertainties. Markets and instruments profiled on this page are for informational purposes only and should not in any way come across as a recommendation to buy or sell in these assets. You should do your own thorough research before making any investment decisions. MATASII.com does not in any way guarantee that this information is free from mistakes, errors, or material misstatements. It also does not guarantee that this information is of a timely nature. Investing in Open Markets involves a great deal of risk, including the loss of all or a portion of your investment, as well as emotional distress. All risks, losses and costs associated with investing, including total loss of principal, are your responsibility.
FAIR USE NOTICE This site contains copyrighted material the use of which has not always been specifically authorized by the copyright owner. We are making such material available in our efforts to advance understanding of environmental, political, human rights, economic, democracy, scientific, and social justice issues, etc. We believe this constitutes a ‘fair use’ of any such copyrighted material as provided for in section 107 of the US Copyright Law. In accordance with Title 17 U.S.C. Section 107, the material on this site is distributed without profit to those who have expressed a prior interest in receiving the included information for research and educational purposes. If you wish to use copyrighted material from this site for purposes of your own that go beyond ‘fair use’, you must obtain permission from the copyright owner.
========
| |
MATASII'S STRATEGIC INVESTMENT INSIGHTS | |
2020 VIDEOS OUTLINING THE COMING RISE IN INFLATION, STAGLFLATION & COMMODITY PRICES | |
IDENTIFICATION OF HIGH PROBABILITY TARGET ZONES | |
Learn the HPTZ Methodology!
Identify areas of High Probability for market movements
Set up your charts with accurate Market Road Maps
Available at Amazon.com
| |
The Most Insightful Macro Analytics On The Web | | | | |