|
Gordon T Long Research exclusively distributed at MATASII.com
SEND YOUR INSIGHTFUL COMMENTS - WE READ THEM ALL - lcmgroupe2@comcast.net
| |
| |
MARCH 31st - THE LAST DAY!
EXPANDED MATASII COVERAGE FOR THE OLD PRICE
Subscribe to Gordon T Long Research - $35 / Month - LINK
Complete MATASII.com Offerings - $55/Month - LINK
| | | | |
APRIL 2025
UnderTheLens
Macro Analytics - 03/31/25
| |
US R&D HAS FALLEN SERIOUSLY BEHIND CHINA
OBSERVATIONS: US & CHINA LEADERSHIP VISIONS ARE INCREASINGLY A PROBLEM
LEADERSHIP NEEDS TO PREPARE US FOR A NEW WORLD
Since the Bush 1 era the world has been preoccupied by:
- GLOBALIZATION - Labor Arbitrage through industrialized Supply Chains
- FINANCIALIZATION - Global cross border finance built on low low rates and easy central bank financial conditions.
- MODERN MERCANTILISM - Export countries using surging currency reserves to lower consumer lending rates, strengthen the US dollar and capture dominant market shares for competitive advantage.
I have spoken and written about all three many times. The casualty of this thinking is the US middle and working class paid the price as their standard of living became increasingly difficult to sustain, while the wealthy with assets and export lead countries have reaped historical rewards and become wealthy.
TWO DIFFERENT VIEWS
President Trump's recent two Executive Memorandums (which I wrote about in a prior newsletter) and China's Xi Jinping "Made In China 2015" plan clearly view the future differently.
CHINA'S XI JINPING -
- Manufacturing Leadership
-
High End Equipment but Low End Cost to Own
- Open Source Software - DeepSeek
-
Creates Revenue through Market Share
- Same strategy as now but going "upscale"
- Manufactured in China with advanced new manufacturing technologies
- Razor thin margins
- Exposed to foreign import tariffs
- Needs large Scale adoption for pricing advantage and therefore must dominate globally
TRUMPS FOCUS -
- Originates in America
-
A Product = Hardware, Software or Service
- US is the Market - Anything else is a bonus
-
Creates Jobs - Not necessarily Manufacturing but Service, Agriculture, Heath, Retail et al. that create value
THE REAL BAD NEWS -
It is a simple fact that AI, AI Agents, Robotics and Technology advancements will take away Jobs at an increasingly unprecedented rate. Having a job may potentially become the new American Dream!
As a result Tariffs are not going to be just a US strategy, but every nation will endeavor to use any technique possible to protect jobs as Guaranteed Basic Income becomes an increasing burden to nations as unemployment rises. What one of these directions recognizes is that 21st Century is going to be about Job Creation.
That is the bad news, but it is also the solution for America which Vice President JD Vance spelled out at the March 18th America Dynamism Summit. ===>
| | |
VIDEO PREVIEW (click image)
Pay-Per-View Page Link
| |
THIS WEEK WE SAW
Exp=Expectations, Rev=Revision, Prev=Previous
US
US Rich Fed Comp. Index (Mar) -4.0 (Prev. 6.0)
US Rich Fed Services Index (Mar) -4.0 (Prev. 11.0)
US Rich Fed Mfg Shipments (Mar) -7.0 (Prev. 12.0)
US Durable Goods (Feb) 0.9% vs. Exp. -1.0% (Prev. 3.2%, Rev. 3.3%)
US Durables Ex-Transport (Feb) 0.7% vs. Exp. 0.2% (Rev. 0.1%)
US Non-def. Cap Ex-Air (Feb) -0.3% vs. Exp. 0.2% (Prev. 0.8%, Rev. 0.9%)
US Core PCE Prices Final (Q4) 2.6% vs. Exp. 2.7% (Prev. 2.7%)
===> Vance's focus is the value of Jobs and Labor!
- We should embrace the future head-on. We shouldn't be afraid of artificial intelligence and we shouldn't be fearful of productive new technologies. We should seek to dominate them.
- In any dynamic society, technology is going to advance.
-
In a healthy economy, technology should be something that enhances, rather than supplants, the value of labor.
-
When we innovate, we do sometimes cause labor market disruptions. That has -- that happens. But the history of American innovation is that we tend to make people more productive, and then we increase their wages in the process. And I think all of us believe that's a good thing.
-
It dignifies our workers. It boosts our standard of living. It strengthens our workforce and the relative value of its labor.
- Innovation is key to winning the worldwide manufacturing competition -- competition to giving our workers a fair deal, and to reclaiming our heritage via America's great industrial comeback. And I believe that's what we're on the cusp of -- a great American industrial comeback.
- Because innovation is what increases wages. It's what protects our homelands, and I know we have a lot of defense technology companies here. It's what saves troops' lives on the battlefield.
-
We can only win by doing what we always did: protecting our workers and supporting our innovators, and doing both of those things at the same time.
- The Trump Administration's great plan for staging the great American manufacturing comeback is simple. You're making interesting new things here in America? Great. Then we're going to cut your taxes. We're going to slash regulations. We're going to reduce the cost of energy so that you can build, build, build.
-
Our goal is to incentivize investment in our own borders -- in our own businesses, our own workers and our own innovation. We don't want people seeking cheap labor. We want them investing and building right here in the United States of America.
| | |
WHAT YOU NEED TO KNOW!
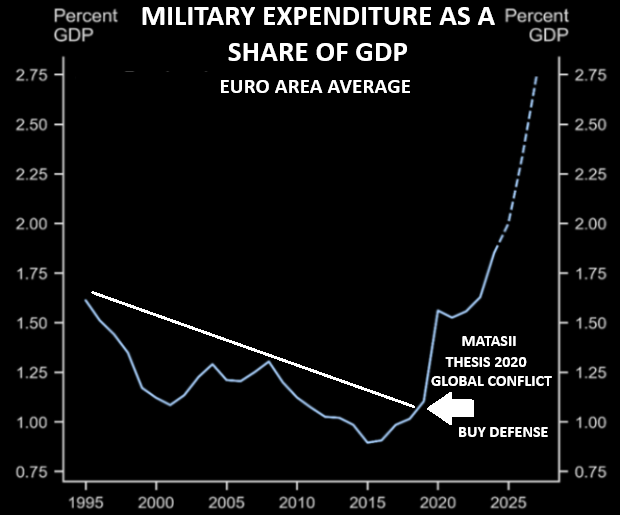
DEFENSE SECTOR BECOMES A HOT INVESTMENT THEME
Global military spending is presently less than half the average observed during the Cold War.
- EU Defense & Aerospace socks surged 21% with troubled EU Banks suddenly becoming darlings, surging 14%.
- As European Defense Stocks in Q1 became arguably the new Magnificent Seven.
- Money flows headed for the EU with inflows in 4 weeks being the largest in 10 years.
- Germany currently only spends 7% of what the US does for defense. Germany legislation just approved ~ $800B primarily for Defense build-up.
| | |
RESEARCH - MARKET DRIVERS
1- US R&D HAS FALLEN SERIOUSLY BEHIND CHINA
- Inadequate Investment describes investment in America! It is about its rate of growth, where the money is invested and who is making the investments.
- It also clear that the US is quickly losing its position as the world's most powerful economy, because it invests far too little.
- Dangerously deficient government investment is primarily to blame!
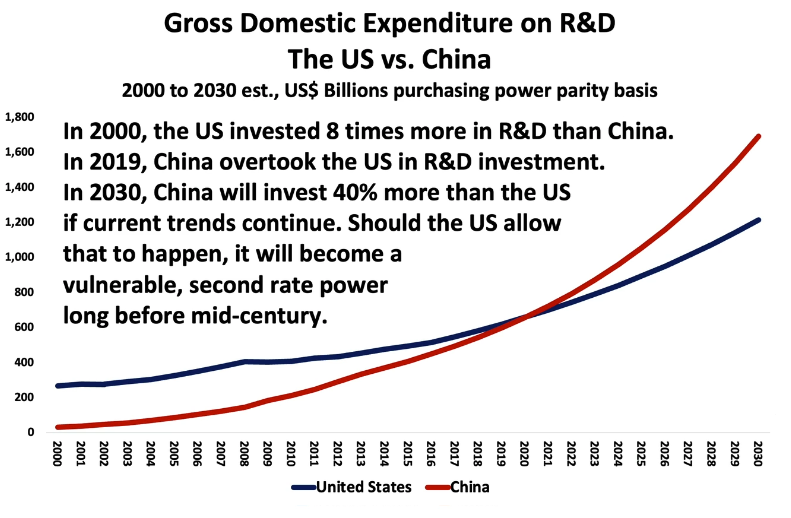
- In 2019 China overtook the US to become the World Leader in R&D. While a great deal of extraordinary work in R&D is being done in the US, current levels are insufficient because China is simply investing more.
- China is also investing smarter because they have a plan – it is called Made in China 2025, initiated in May 2015.
- The cornerstone of that plan was to win the AI Race.
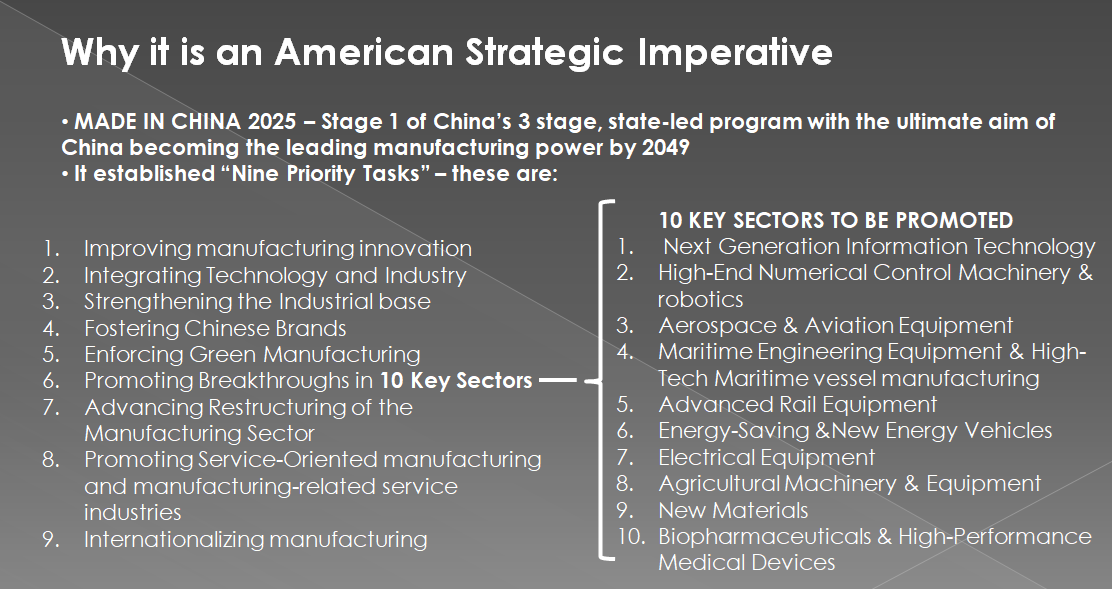
- Made in China 2025 is Stage One of an ambitious three stage, state led program with the ultimate aim of making China the world’s leading manufacturing power by 2049.
- It has established nine Priority Tasks and 10 Key Sectors to promote.
- The central problem is the US doesn’t have a plan nor feels one is needed, because the private sector will do that.
- The issue is this race is about the winner takes all!
THE US MUST IMMEDIATELY START INVESTING MORE IN R&D.
2- THE COMING "AI" AGENT MARKET EXPLOSION
- AI agents are seen to be the next big step in artificial intelligence.
- AI agents are software systems that use AI to pursue goals and complete tasks on behalf of users. They show reasoning, planning and memory, and have a level of autonomy to make decisions, learn and adapt.
- In artificial intelligence, an intelligent agent is an entity that perceives its environment, takes actions autonomously to achieve goals, and may improve its performance through machine learning or by acquiring knowledge.
- In order of simplest to most advanced, there are 5 main agent types:
- Simple reflex agents - the simplest agent form that grounds actions on current perception ...
- Model-based reflex agents ...
- Goal-based agents ...
- Utility-based agent. ...
- Learning agents...
| | |
DEVELOPMENTS TO WATCH - POLICY DRIVERS
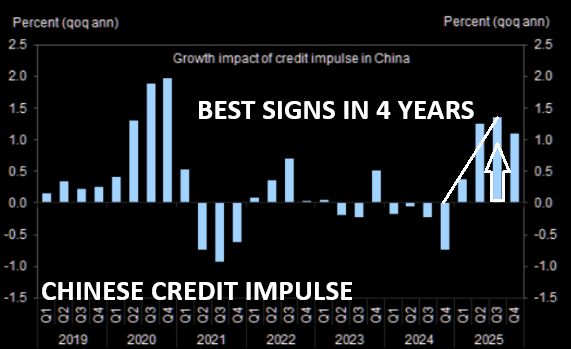
1- CHINA'S STRATEGY UNFOLDING IN GLOBAL MARKETS
- President Xi Jinping triumphantly proclaimed four years ago that “the East is rising and the West is declining.”
- While the world’s second largest economy hasn’t exactly evolved the way he had predicted, Xi’s dream scenario of a bullish China, bearish US seems to be playing out in financial markets.
- Expectations among international asset managers for the Chinese economy are improving, while perceptions of US growth have deteriorated sharply, according to two latest polls
published recently by Bank of America, reflecting the massive asset-allocation rotations underway.
2- TRUMP'S PLAN TO RESTRUCTURE THE GLOBAL TRADING SYSTEM
- A major shift in the United States global economic policy is underway.
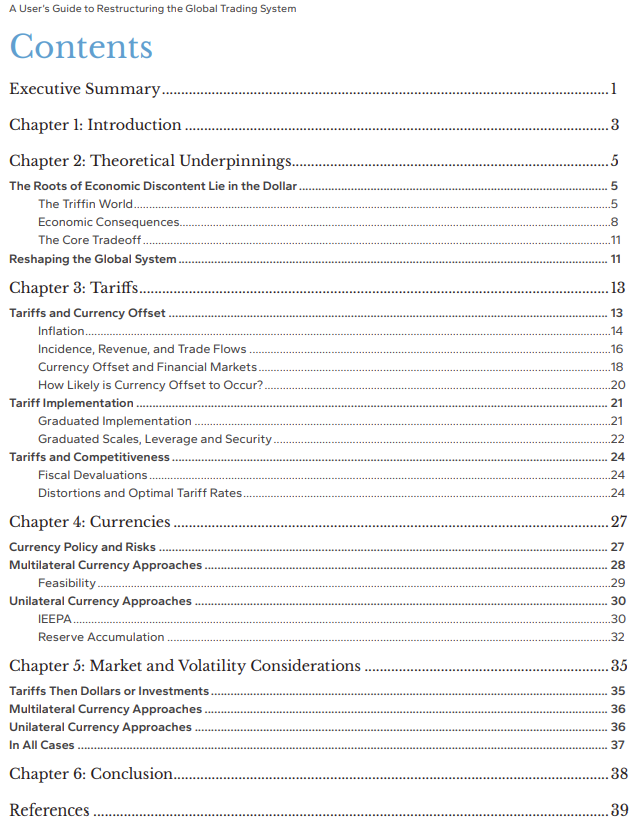
- In November, Stephen Miran—now Chairman of President Trump’s Council of Economic Advisers —published a paper titled "A User’s Guide to Restructuring the Global Trading System". That document appears to be the blueprint for the sweeping international economic strategy President Trump is now putting into action.
- This strategy is bold. It’s aggressive. And it has already begun to shake the foundations of the post-WWII international order. According to Miran’s paper, the U.S. may be preparing to use tariffs and the threat of military disengagement to pressure its trading partners into accepting a massive economic restructuring.
- If successful, this could re-industrialize the United States.
- If it fails, it could bring about an economic catastrophe of historic proportions.
| | |
GLOBAL ECONOMIC INDICATORS - ECONOMIC DRIVERS
LIBERATION WEEK - UNFOLDING TRUMP TARIFFS
- Trump has so far enacted tariff changes that have lifted the trade-weighted average tariff rate on all US imports by around 5.5-6.0%-points. While re-rerouting of trade will decrease the effectiveness of tariffs over time, the current level is already close to the highest since the second world war.
- We recap:
- What has occurred
- What is Expected Next week as "Liberation Week"
- Reciprocal Tariffs
- Value Added Tax (VAT)
- EU Specific Tariffs & Targets
| | RESEARCH - MARKET DRIVERS | | |
1- US R&D HAS FALLEN SERIOUSLY BEHIND CHINA
INADEQUATE INVESTMENT
Inadequate Investment describes investment in America! It is about its rate of growth, where the money is invested and who is making the investments.
It also clear that the US is quickly losing its position as the world's most powerful economy, because it invests far too little.
Dangerously deficient government investment is primarily to blame!
| | |
WE ARE LIVING IN A COMPLETELY NEW POLICY ENVIRONMENT
THE OLD WORLD:
• Gold Backed Money
• Balanced Trade
• Large Budget Deficits
• Excessive Money Creation
... actually did more harm than good.
THE US AS A COUNTRY IS NOT TAKING FULL ADVANTAGE OF THE NEW WORLD:
• Large Scale Government Investment is POSSIBLE
• New Investable Global Industries and Technologies AVAILABLE
• Financing of Large Scale Money Creation SOUGHT
• The Delivery of a Technological Revolution is POSSIBLE
… would deliver higher rates of economic growth, but also
… solve intractable global problems,
… radically improve the well being of everyone.
| | |
THE US STRATEGIC IMPERATIVE
The United States can and must make a multi-trillion-dollar investment in new industries and technologies over the next
10 years in order to ignite a technological revolution that would turbocharge economic growth, consolidate the country’s geopolitical preeminence and vastly enhance human wellbeing, not only in the US, but all around the world!”
Richard Duncan
The Money Revolution
THE US MUST AGAIN BE SEEN AS THE PLACE TO INVEST IN
FIXED INVESTMENTS & CAPITAL STOCK
MUST MAKE AMERICA AN ATTRACTIVE INVESTMENT - AGAIN!
INSTITUTIONAL INVESTMENTS ARE STRATEGIC & LONG TERM
| | |
THE COUNTRY IS IMPORTANT
Business Friendly v Hostile
ENTERED AS INVESTMENTS NOT TRADES
Liquidity is Somewhat Restricted (PE)
GLOBAL SEARCH
How Much To Invest
What & Where to Invest
How to Structure The Investments
| |  | |
ASSESS TO REMOVE
Political Pressures
The Threat of Taxation
Regulations
Chances of Nationalization
Confiscation to Fund the Government
MUST REWARD NOT DE-INCENT
Tax Treatment
Limit Regulatory hurdles
| | |
THE US IS LOSING ITS POSITION AS THE WORLD’S MOST IMPORTANT ECONOMY,
BECAUSE IT NOW INVESTS TOO LITTLE!
• The rate of growth of the US Capital Stock has been slowing since WWII and has been particularly weak since 2008.
• The average annual growth rate since 1926 has been 2.5% a year.
• In 2019 it was 1.6% and the highest growth rate in a decade.
• The growth in Capital Stock has slowed, because investment has been weak for fixed assets, (Tangible Assets used in the production of Income).
Insufficient Government investment is to blame.
• Government investment in fixed assets declined from 7.1%of GDP in 1961 to only 3.5% of GDP in 2019.
• US Government Spending is being used for Consumption or Transfer Payments for a 70% Consumption Economy versus Fixed Assets.
| |
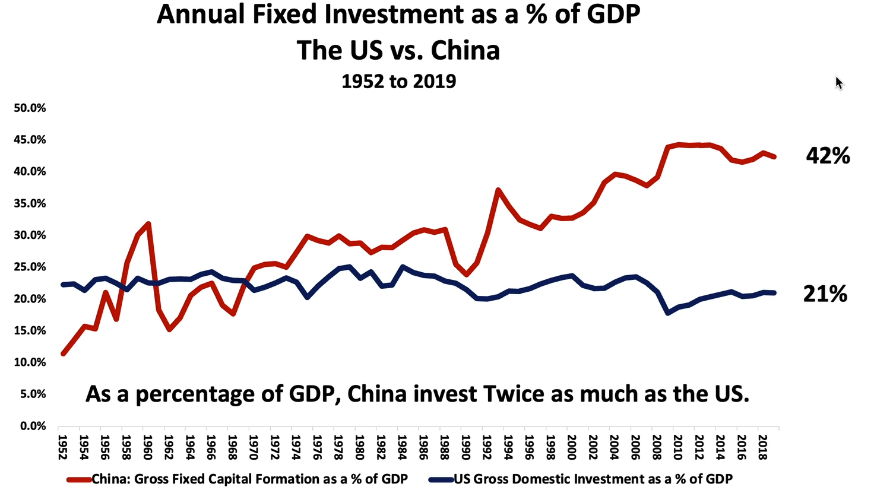
THE US IS LOSING ITS POSITION AS THE WORLD’S MOST IMPORTANT ECONOMY, BECAUSE IT NOW INVESTS TOO LITTLE!
• In 2019 China invested twice as much as the US relative to the size of economy.
• Investment in China accounted for 42% of Chinese GDP whereas US investment made up only 20% of US GDP.
• China is growing much more rapidly than the US Economy.
• Investment creates Capital and Capital Generates Income.
• China has been investing more relative to the size of the economy since 1970.
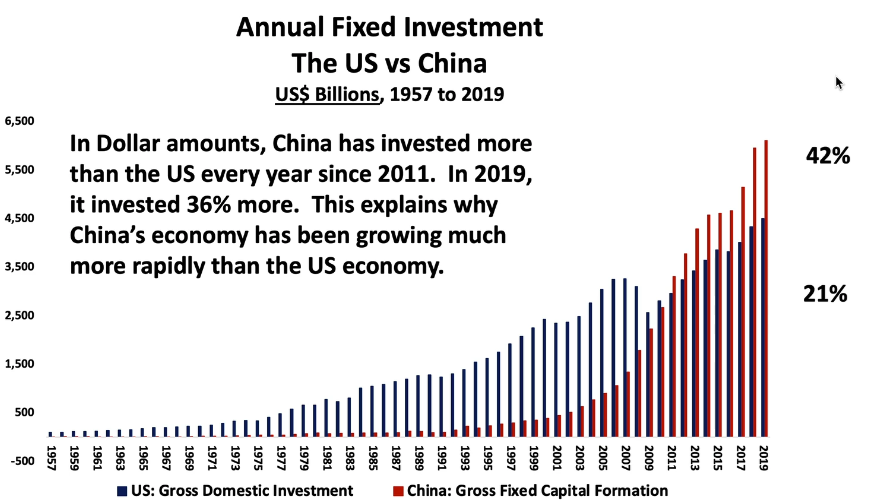
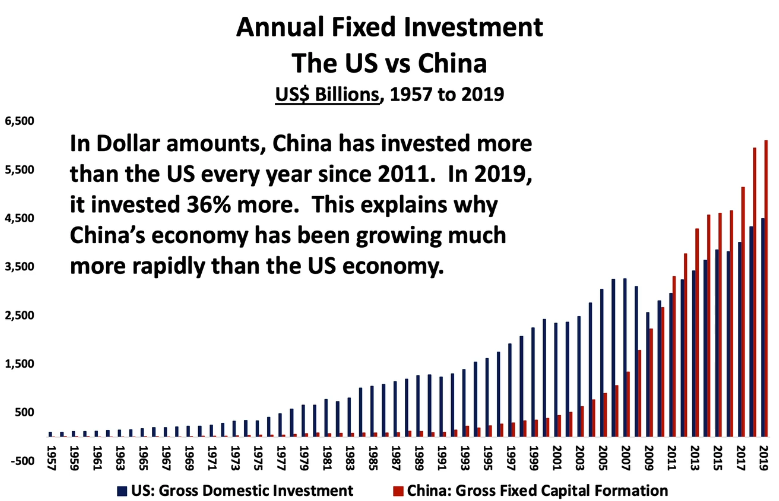
• China is now actually Investing much more than the US.
• In 2019 China Invested 36% more or -$1.6 TRILLION more than the US did!
• China is now investing more in fixed income than the US and has every year since 2011.
• If this trend continues China will soon overtake the US to become the preeminent global super power!
| |
THE US MUST IMMEDIATELY START INVESTING MORE IN R&D.
• In 2019 China Overtook the US to become the World Leader in R&D.
• While a great deal of extraordinary work in R&D is being done in the US, current levels are insufficient because China is simply investing more.
• They are also investing smarter because they have a plan – it is called Made in China 2025, initiated in May 2015.
• The cornerstone of that plan was to win the AI Race.
• Made in China 2025 is Stage One of an ambitious three stage, state led program with the ultimate aim of making China the world’s leading manufacturing power by 2049.
• It has established nine Priority Tasks and 10 Key Sectors to promote.
• The central problem is the US doesn’t have a plan nor feels one is needed, because the private sector will do that.
• The issue is this race is about the winner takes all!
| |
THE US MUST IMMEDIATELY START INVESTING MORE IN R&D
• If China wins the AI Race, as it did the 5G Race, then China will rule the world.
• The first country to achieve artificial general intelligence, the point where machines can perform any task that a human can, is likely to have the rest of the world at its mercy.
• At that point AI will quickly accelerate exponentially beyond human intelligence.
• This is the Space Race to the power of infinity?
• The Industrial Revolution enabled western Europe to conquer most of the rest of the world.
•The AI Race is a Winner Take All!
•The winner will have the 21st Century Equivalent of a Nuclear Weapons Monopoly!
• China has a plan to win that race!
| |
2- THE COMING "AI" AGENT MARKET EXPLOSION
AI agents are seen to be the next big step in artificial intelligence.
AI agents are software systems that use AI to pursue goals and complete tasks on behalf of users. They show reasoning, planning and memory, and have a level of autonomy to make decisions, learn and adapt.
In artificial intelligence, an intelligent agent is an entity that perceives its environment, takes actions autonomously to achieve goals and may improve its performance through machine learning or by acquiring knowledge.
In order of simplest to most advanced, there are 5 main agent types:
- Simple reflex agents - the simplest agent form that grounds actions on current perception ...
- Model-based reflex agents ...
- Goal-based agents ...
- Utility-based agents ...
- Learning agents...
ChatGPT for example is not a true AI agent, but rather a large language model that acts as a co-pilot or assistant. It can engage in conversations and help with tasks, but it lacks the ability to work independently or take actions on its own.
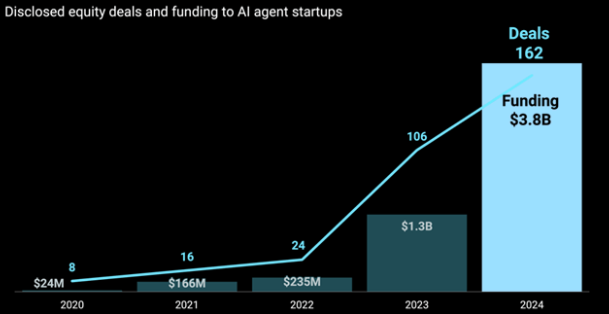
AI AGENTS TAKE CONTROL
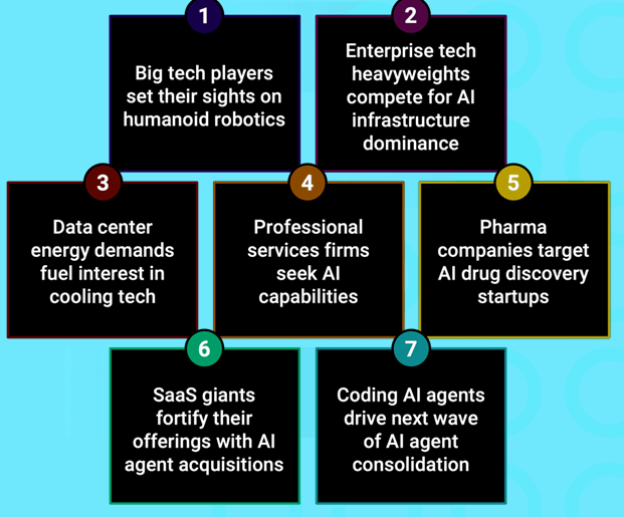
AI will be the driving force behind tech M&A deals in 2025. From AI agent consolidation to big tech’s next battlefield, expect to see big deals in 2025.
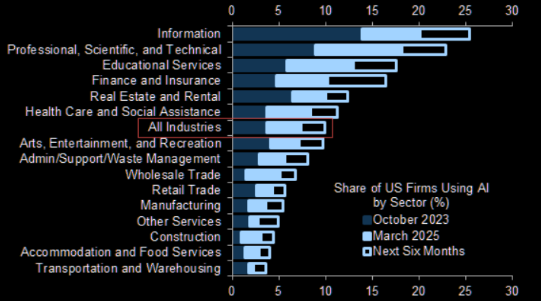
AI ADOPTION RATE - HIGHER
7.4% of firms across all industries have adopted AI, up from 6.1% last quarter.
| | |
Goldman Sachs:
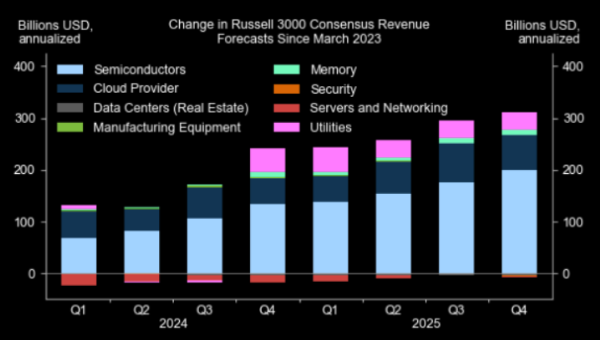
"Thematically, our 1Q25 AI Adoption Tracker shows that AI-related investment growth remains strong, especially for
semi stocks."
| | |
AI agents have definitely entered the conversations.
AI AGENTS TAKE CONTROL
Here is a sample prediction on agents in commerce and how it can transform the experience across the 5 stages of the customer journey.
| | |
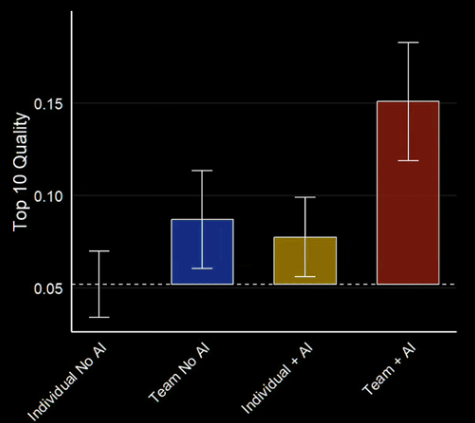
AI COMPETITIVE EDGE
Teams using AI are around three times more likely to produce top-tier solutions than teams without AI, while traditional specialist advantages fade when AI assistance becomes universal.
AI AGENTS TO BE PART OF OUR FUTURE
CB Insights:
"AI will be the driving force behind tech M&A deals in 2025. From AI agent consolidation to big tech’s next battlefield, we highlight 7 areas where we expect to see deals this year."
| | |
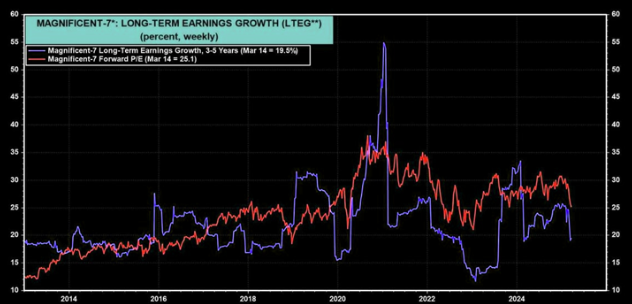
...since the Magnficent-7 stocks' long-term earnings expectations and valuation multiples already have realigned closer to historical averages without a bear market or recession, we think further downside for the AI trade is limited...
| | DEVELOPMENTS TO WATCH - POLICY DRIVERS | | |
1- CHINA'S STRATEGY UNFOLDING IN GLOBAL MARKETS
President Xi Jinping triumphantly proclaimed four years ago that “the East is rising and the West is declining.”
While the world’s second largest economy hasn’t exactly evolved the way he had predicted, Xi’s dream scenario of a bullish China, bearish US seems to be playing out in financial markets.
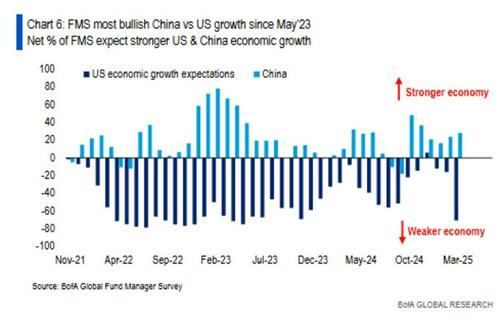
Expectations among international asset managers for the Chinese economy are improving, while perceptions of US growth have deteriorated sharply, according to two latest polls published recently by Bank of America, reflecting the massive asset-allocation rotations underway (chart above right).
| |
A net 28% respondents in the bank’s Global Fund Manager Survey saw China’s growth prospects improving, up for a second straight month, according to BofA strategists including Michael Hartnett and Elyas Galou. Meanwhile, the net share of respondents optimistic about the US economy slumped to minus 71%, the lowest since May 2023.
The net share of respondents who expect higher global growth driven by the US, rather than China or the EU, also plummeted to minus 44% from negative 2%. The survey was conducted March 7-13, with 171 participants managing assets worth $426 billion.
Current market sentiment — less than two months into the new US administration — represented a sea change from early 2025. In BofA’s January survey conducted before US President Donald Trump’s inauguration, the share of fund managers bullish about Chinese growth was at a multi-month low. Outlook for Chinese equities improved markedly in the poll conducted Feb. 7-13, with confidence in Hong Kong’s stock indexes on par with that in the Nasdaq Composite.
| |
Balance of payments data also seem to corroborate the strong appetite for Chinese assets from overseas buyers. Foreign purchases of onshore securities jumped to a record high in February, with net flows flipping to positive for the first time since September. Offshore investors also increased their holdings of Chinese government bonds and negotiable CDs issued by domestic banks.
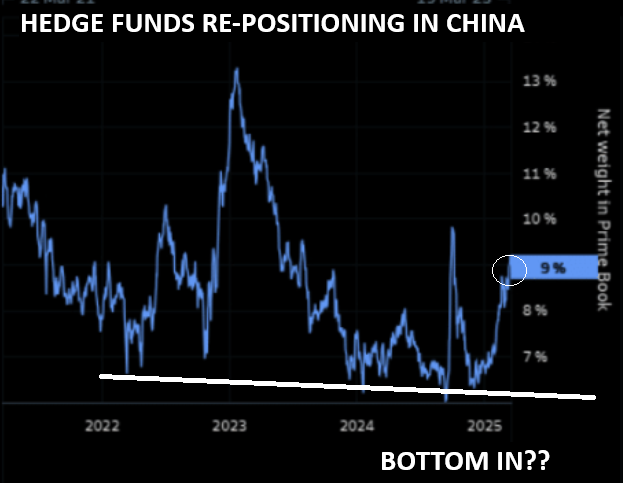
In a separate Asia Fund Manager Survey, conducted by BofA between March 7 and 13 with 107 respondents, structural bearishness toward China collapsed to a record low. Asia-focused institutional investors seem to believe this time is different, and they are “abandoning their search for opportunities elsewhere to look back into China,” the US bank said. China leapfrogged to the second most favored market when it comes to asset allocation across Asia, with a net 9% respondents saying they are overweight the country.
| | |
2- TRUMP'S PLAN TO RESTRUCTURE THE GLOBAL TRADING SYSTEM
A major shift in the United States global economic policy is underway.
In November, Stephen Miran—now Chairman of President Trump’s Council of Economic Advisers —published a paper titled "A User’s Guide to Restructuring the Global Trading System". That document appears to be the blueprint for the sweeping international economic strategy President Trump is now putting into action.
This strategy is bold. It’s aggressive. And it has already begun to shake the foundations of the post-WWII international order. According to Miran’s paper, the U.S. may be preparing to use tariffs and the threat of military disengagement to pressure its trading partners into accepting a massive economic restructuring.
If successful, this could re-industrialize the United States.
If it fails, it could bring about an economic catastrophe of historic proportions.
If you want to understand how this could impact asset prices, the global trading system and the future of U.S. economic policy, my colleague Richard Duncan has put out a 37 minute 57 slide video covering the following:
| | |
• The core goals of Trump’s international economic strategy
• The mechanics of the new tariff campaign
• How Dollar Devaluation fits into the plan
• The potential consequences for the U.S., its allies and the global economy
You might consider subscribing to Richard's services using a special MATASII subscriber promo code "flows".
For a Special 55% subscription discount,
worth US$275 off the $500 subscription price.
When prompted, use the special GordonTLong.com ONLY
offer coupon code:
"flows"
| | |
GLOBAL ECONOMIC INDICATORS - ECONOMIC DRIVERS
What This Week's Key Global Economic Releases Tell Us
| | |
1- LIBERATION WEEK - Unfolding Trump Tariffs
Trump has so far enacted tariff changes that have lifted the trade-weighted average tariff rate on all US imports by around 5.5-6.0%-points. While re-rerouting of trade will decrease the effectiveness of tariffs over time, the current level is already close to the highest since the second world war.
SO FAR ENACTED:
-
CHINA: A 20%-point increase to tariffs against China.
-
STEEL & ALUMINUM: Has set up a 25% tariff on steel and aluminium imports as well partial tariffs against Mexico and Canada.
- The rate for Canadian energy and potash imports is 10% and 25% for all other imports.
- Part of the increase for so called USCMA-compliant goods:
- Has been delayed until next week, which means only around 50% and 60% of respective Mexican and Canadian imports have been affected thus far.
- USCMA compliance requires a product to, for example, have a certain percentage of its value originated from North America.
EXPECTED NEXT WEEK:
-
END CANADA MEXICO EXEMPTIONS: The largest expected tariff increases next week come in the form of ending the exemptions for Mexican and Canadian imports, which would levy tariffs on $428b worth of new goods.
-
CAR & TRUCK PARTS: Trump also announced that 25% tariffs on cars and car parts will take effect from April 2nd.
- Domestic value added to USCMA-compliant car and car part imports would be exempted from the tariffs, but otherwise the measures would target all imports and stack on top of any other measures.
- Mexico, which accounts for the largest share of all US car imports, would be affected the worst.
- All car and car part imports are worth $286b and together with the expansion of other tariffs, the effective average tariff rate could increase by another 5% points to around 13%.
-
PHARMACEUTICALS & SEMICONDUCTORS: He has also pre-announced plans to sanction imports of pharmaceuticals and semiconductors with a rate of ‘25% or higher’, but has not specified the timing or other details for now. The potential FX impact of the former in FX Strategy - CHF, EUR and DKK at biggest risk from a US pharma tariff, 26 March.
-
VENEZEULA OIL & GAS: Trump announced 25% ‘secondary’ tariffs on countries buying oil and gas from Venezuela from April 2nd.
- In the past, China has been by far the largest buyer of Venezuelan oil, but as the extent of these measures remains highly uncertain, their impact is not included in the figures presented in this paper.
The Tax Foundation has estimated that fully enacted tariffs on China, Mexico, Canada, steel and aluminium as well as car and car parts would weigh on US GDP by a total of 0.5%. Trump has also threatened to apply tariffs on agricultural products next week, but has refrained from specifying the exact scope or size of the measures.
RECIPROCAL TARIFFS
Next week, markets will be paying close attention to both expanding the existing tariffs as well as the introduction of the first, so-called reciprocal tariffs. The largest uncertainty relates to the threatened reciprocal tariffs.
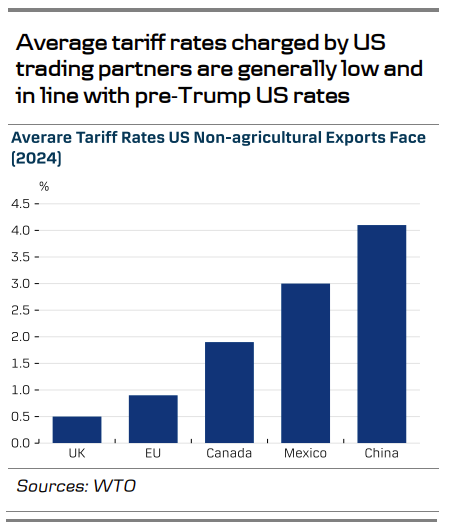
At the beginning of his term, Trump ordered a comprehensive study into unfair trade practises against the US. The results are due to be published next week, and they will provide a guideline for the reciprocal measures. The reciprocal approach should not automatically lead to large increases in tariffs against the most important trading partners of the US. For instance, the latest WTO data suggests that the trade-weighted average tariff rate that the EU charges for non-agricultural goods exports from the US is only 0.9% (vs. 1.4% the other way around).
VALUE-ADDED TAX
That said, the basis of the reciprocal measures remains unclear. As an example, Trump has previously likened EU’s value added taxes to discriminatory tariffs against the US, as the average EU VAT rate (21.6%) is higher than the average US sales tax (6.6%). While the idea makes little economic sense given that the sales tax can be charged several times on the full price of a product during its value chain, it highlights how difficult it is to make firm predictions on the level of future tariffs.
Recent media sources have suggested that the administration is looking – at least initially – to take a more narrow focus on only the countries with the largest trade imbalances. This is in line with earlier comments from the Secretary of Commerce Howard Lutnick, who said back in February that the measures would be applied on a country-by-country basis.
Looking at economies which have the largest absolute trade surpluses against the US, and which have not yet been hit with tariffs, EU and Vietnam are high up on the list. Looking at countries which have seen the largest increases in trade surplus against the US since Trump’s 1st term, South Korea also stands out.
Finally, when looking at countries which have both a sizable trade surplus against the US as well as relatively high existing tariffs against US exports, India is looking vulnerable (a position the local authorities have been quick to realize, according to Reuters).
EU SPECIFIC TARGETS
All together, we cannot rule out that Trump announces first EU-specific tariffs already next week. A 25% tariff on all EU imports would lift the effective average tariff rate by another 4.5-5.0% all the way to 17-18% - the highest since early 1930s.
Another 10%-point increase on Chinese tariffs is out of the question.
| |
|
GLOBAL
WHAT DOES YOUR SCAN OF THE DATA BELOW TELL YOU? - THE MEDIA AVOIDS BAD NEWS!
We present the data in a way you can quickly see what is happening.
THIS WEEK WE SAW
Exp. =Expectations, Prev. =Previous
| | |
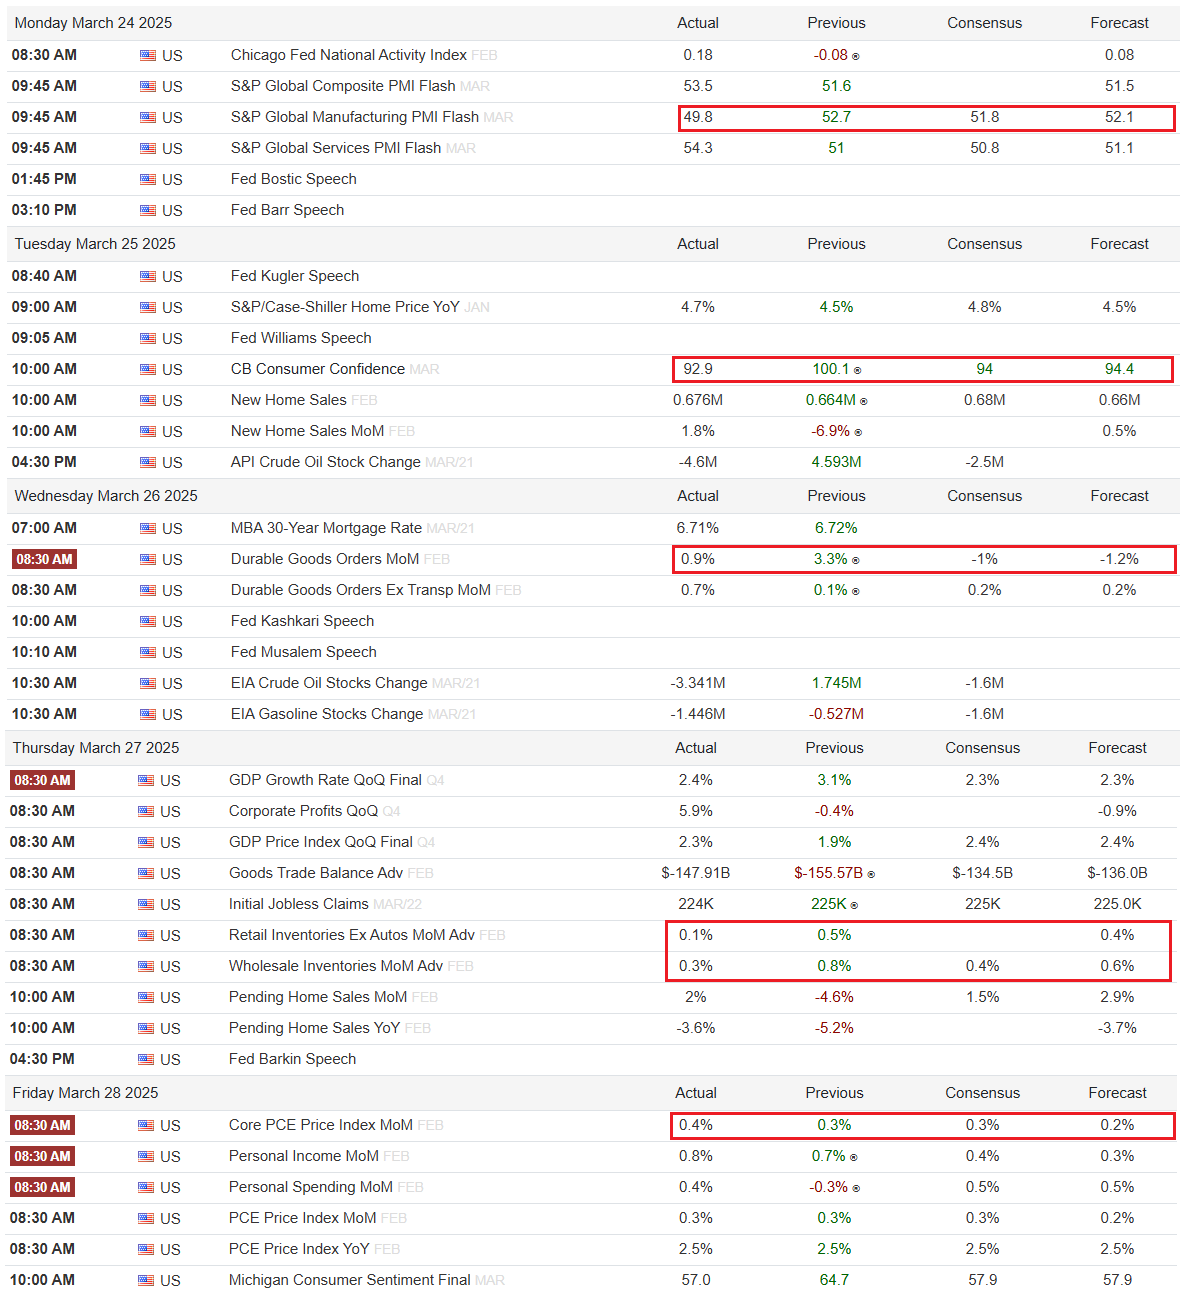
UNITED STATES
- US S&P Global Manufacturing PMI Flash (Mar) 49.8 vs Exp. 51.7 (Prev. 52.7)
- US S&P Global Services PMI Flash (Mar) 54.3 vs Exp. 50.8 (Prev. 51.0)
- US S&P Global Composite PMI Flash (Mar) 53.5 (Prev. 51.6)
- US Consumer Confidence (Mar) 92.9 vs. Exp. 94.0 (Prev. 98.3; Rev. 100.1)
- US Building Permits Change MM (Feb) -1.0% (Prev. -1.2%)
- US New Home Sales-Units (Feb) 0.676M vs. Exp. 0.679M (Prev. 0.657M, Rev. 0.664M)
- US CaseShiller 20 MM SA (Jan) 0.5% vs. Exp. 0.4% (Prev. 0.5%)
- US CaseShiller 20 YY NSA (Jan) 4.7% vs. Exp. 4.8% (Prev. 4.5%)
- US Rich Fed Comp. Index (Mar) -4.0 (Prev. 6.0)
- US Rich Fed Services Index (Mar) -4.0 (Prev. 11.0)
- US Rich Fed Mfg Shipments (Mar) -7.0 (Prev. 12.0)
- US Durable Goods (Feb) 0.9% vs. Exp. -1.0% (Prev. 3.2%, Rev. 3.3%)
- US Durables Ex-Transport (Feb) 0.7% vs. Exp. 0.2% (Rev. 0.1%)
- US Non-def. Cap Ex-Air (Feb) -0.3% vs. Exp. 0.2% (Prev. 0.8%, Rev. 0.9%)
- US GDP Final (Q4) 2.4% vs. Exp. 2.3% (Prev. 2.3%)
- US Core PCE Prices Final (Q4) 2.6% vs. Exp. 2.7% (Prev. 2.7%)
- US Adv Goods Trade Balance (Feb) -147.91B (Prev. -155.57B)
- US Wholesale Inventories Adv (Feb) 0.3% (Prev. 0.8%)
- US Retail Inventories Ex-Auto Adv (Feb) 0.1% (Prev. 0.5%)
- US Pending Sales Change MM (Feb) 2.0% vs. Exp. 1.0% (Prev. -4.6%)
- US Pending Homes Index (Feb) 72.0 (Prev. 70.6)
- US KC Fed Manufacturing (Mar) 1.0 (Prev. -13.0)
- US KC Fed Composite Index (Mar) -2.0 (Prev. -5.0)
- US Initial Jobless Claims 224k vs. Exp. 225k (Prev. 223k, Rev. 225k)
- US Continued Jobless Claims 1.856M vs. Exp. 1.888M (Prev. 1.892M, Rev. 1.881M)
CHINA
- Chinese Industrial Profits YTD (Feb) -0.3% (Prev. -3.3%)
JAPAN
- Japanese JibunBK Manufacturing PMI Flash SA (Mar) 48.3 (Prev. 49.0)
- Japanese JibunBK Services PMI Flash SA (Mar) 49.5 (Prev. 53.7)
- Japanese JibunBK Composite PMI Flash SA (Mar) 48.5 (Prev. 52.0)
- Japanese Services PPI (Feb) 3.00% (Prev. 3.10%)
- Tokyo CPY YY (Mar) 2.9% vs Exp. 2.8% (Prev. 2.9%)
- Tokyo CPY Ex. Fresh Food YY (Mar) 2.4% vs Exp. 2.2% (Prev. 2.2%)
- Tokyo CPY Ex. Fresh Food & Energy YY (Mar) 2.2% vs Exp. 2.0% (Prev. 1.9%)
AUSTRALIA
- Australian Manufacturing PMI (Mar P) 52.6 (Prev. 50.4)
- Australian Services PMI (Mar P) 51.2 (Prev. 50.8)
- Australian Composite PMI (Mar P) 51.3 (Prev. 50.6)
- Australian Weighted CPI YY (Feb) 2.4% vs. Exp. 2.5% (Prev. 2.5%)
- Australian CPI Annual Trimmed Mean YY (Feb) 2.70% (Prev. 2.80%)
| | |
EU
- EZ Flash PMIs: Manufacturing (Mar) 48.7 vs. Exp. 48.4 (Prev. 47.6); Services (Mar) 50.4 vs. Exp. 51.0 (Prev. 50.6); Composite (Mar) 50.4 vs. Exp. 50.5 (Prev. 50.2)
- EU HCOB Manufacturing Flash PMI (Mar) 48.7 vs. Exp. 48.4 (Prev. 47.6)
- EU HCOB Services Flash PMI (Mar) 50.4 vs. Exp. 51.0 (Prev. 50.6)
- EU HCOB Composite Flash PMI (Mar) 50.4 vs. Exp. 50.5 (Prev. 50.2)
- EU Money-M3 Annual Growth (Feb) 4.0% vs. Exp. 3.8% (Prev. 3.6%)
- EU Loans to Non-Fin (Feb) 2.2% (Prev. 2.0%); Households (Feb) 1.5% (Prev. 1.3%)
-
EU Consumer Confid. Final (Mar) -14.5 vs. Exp. -14.5 (Prev. -14.5); Selling Price Expec (Mar) 11.4 (Prev. 9.8, Rev. 10.2); Cons Infl Expec * (Mar) 24.4 (Prev. 21.1, Rev. 21.4)
GERMANY
- German Flash PMIs: Manufacturing (Mar) 48.3 vs. Exp. 47.3 (Prev. 46.5); Services (Mar) 50.2 vs. Exp. 51.5 (Prev. 51.1); Composite (Mar) 50.9 vs. Exp. 51.0 (Prev. 50.4)
- German HCOB Manufacturing Flash PMI (Mar) 48.3 vs. Exp. 47.3 (Prev. 46.5)
- German HCOB Services Flash PMI (Mar) 50.2 vs. Exp. 51.5 (Prev. 51.1)
- German HCOB Composite Flash PMI (Mar) 50.9 vs. Exp. 51.0 (Prev. 50.4)
- German Ifo Expectations New (Mar) 87.7 vs. Exp. 87.5 (Prev. 85.4); Ifo Current Conditions New (Mar) 85.7 vs. Exp. 85.5 (Prev. 85.0); Ifo Business Climate New (Mar) 86.7 vs. Exp. 86.7 (Prev. 85.2)
- German Unemployment Chg. SA (Mar) 26.0k vs. Exp. 10.0k (Prev. 5.0k); Unemployment Total SA (Mar) 2.922M (Prev. 2.886M)
FRANCE
- French Flash PMIs: Manufacturing (Mar) 48.9 vs. Exp. 46.5 (Prev. 45.8); Services (Mar) 46.6 vs. Exp. 46.0 (Prev. 45.3); Composite (Mar) 47.0 (Prev. 45.1).
- French HCOB Manufacturing Flash PMI (Mar) 48.9 vs. Exp. 46.5 (Prev. 45.8)
- French HCOB Services Flash PMI (Mar) 46.6 vs. Exp. 46.0 (Prev. 45.3)
- French HCOB Composite Flash PMI (Mar) 47.0 (Prev. 45.1)
- French Consumer Confidence (Mar) 92.0 vs. Exp. 94.0 (Prev. 93.0)
- French CPI (EU Norm) Prelim MM (Mar) 0.2% vs. Exp. 0.40% (Prev. 0.10%); YY (Mar) 0.9% vs. Exp. 1.1% (Prev. 0.9%)
- French CPI Prelim MM NSA (Mar) 0.2% vs. Exp. 0.30% (Prev. 0.00%); YY NSA (Mar) 0.8% vs. Exp. 0.90% (Prev. 0.80%)
SPAIN
- Spanish HICP Flash MM (Mar) 0.7% vs. Exp. 0.90% (Prev. 0.40%); YY (Mar) 2.2% vs. Exp. 2.6% (Prev. 2.9%)
- Spanish CPI MM Flash NSA (Mar) 0.1% vs. Exp. 0.35% (Prev. 0.40%); YY Flash NSA (Mar) 2.3% vs. Exp. 2.40% (Prev. 3.00%)
UK
- UK Flash Manufacturing PMI (Mar) 44.6 (Prev. 46.9)
- UK Flash Services PMI (Mar) 53.2 (Prev. 51.0)
- UK Flash Composite PMI (Mar) 52.0 (Prev. 50.5)
- UK CPI YY (Feb) 2.8% vs. Exp. 2.9% (Prev. 3.0%); Core CPI YY (Feb) 3.5% vs. Exp. 3.6% (Prev. 3.7%); Services YY (Feb) 5.0% vs. Exp. 4.9% (Prev. 5.0%)
- UK Retail Sales MM (Feb) 1.0% vs. Exp. -0.4% (Prev. 1.7%, Rev. 1.4%); Ex-Fuel MM (Feb) 1.0% vs. Exp. -0.5% (Prev. 2.1%, Rev. 1.6%)
- UK Retail Sales YY (Feb) 2.2% vs. Exp. 0.5% (Prev. 1.0%, Rev. 0.6%); Ex-Fuel YY (Feb) 2.2% vs. Exp. 0.4% (Prev. 1.2%, Rev. 0.8%)
- UK GDP YY (Q4) 1.5% vs. Exp. 1.4% (Prev. 1.4%); ONS adds that UK GDP has been revised up by 0.1pp for each quarter between Q4-2023 and Q2-2024
| | CURRENT MARKET PERSPECTIVE NEWSLETTERS | | |
IMPORTANT MESSAGES FROM THE
TECHNICAL ANALYSIS NEWSLETTER
NOTHING GOOD HAPPENS BELOW THE 200 DMA
MARKETS DON'T CRASH AT EXTREME FEAR LEVELS
BIG PICTURE
| | |
CLICK TO ENLARGE
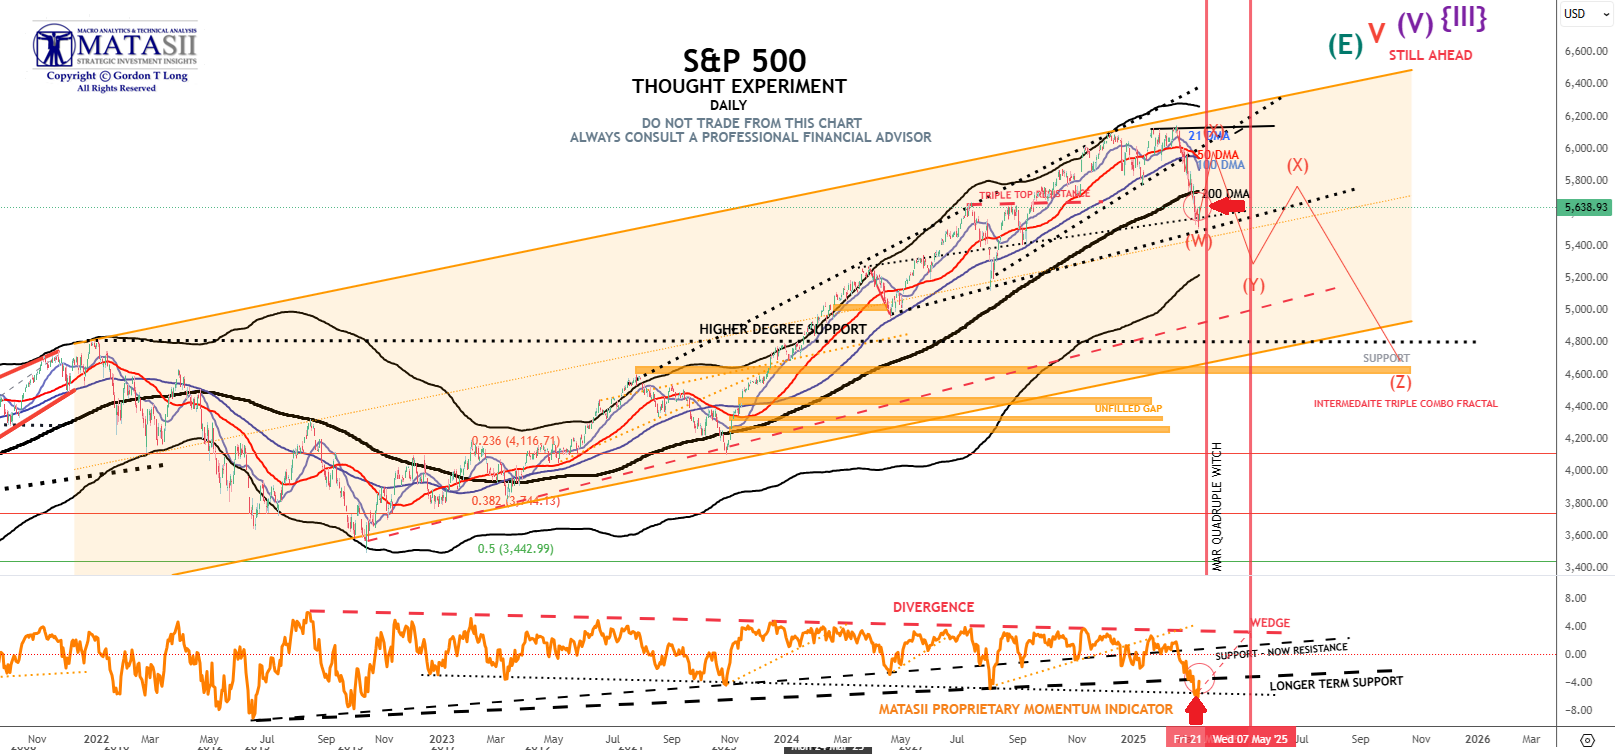
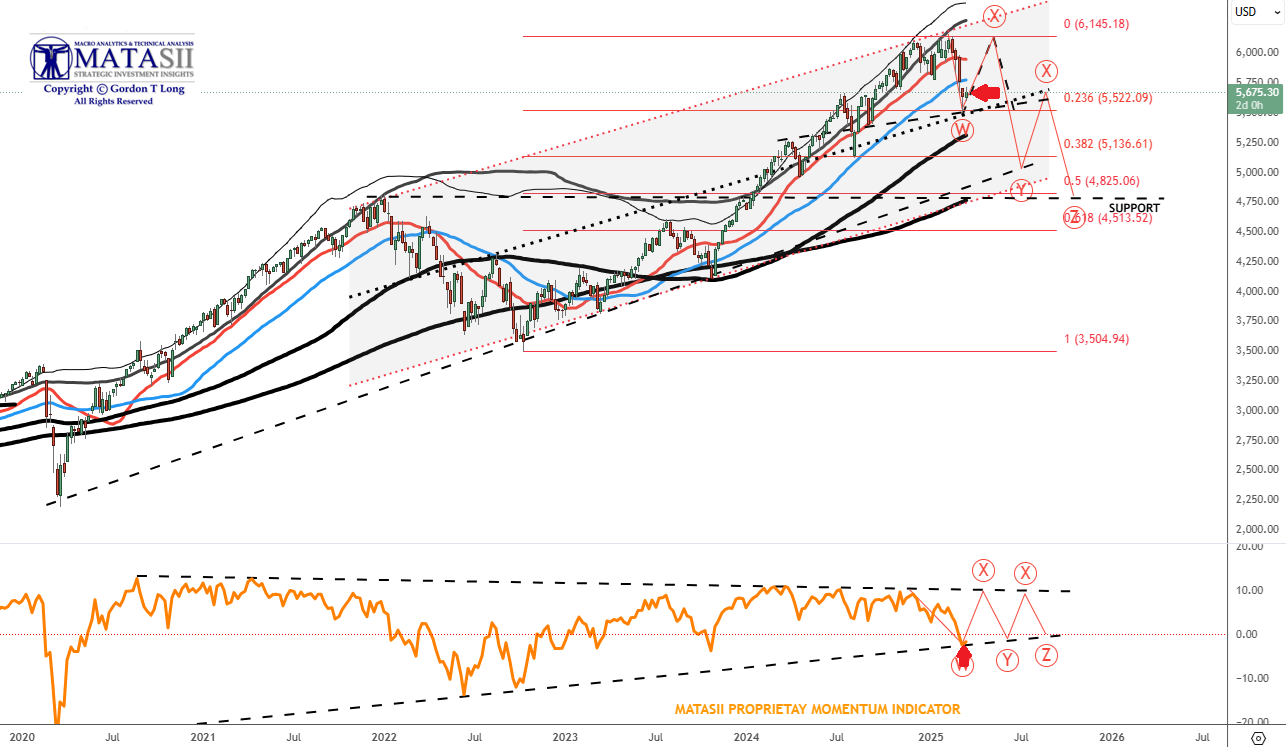
A MAJOR CORRECTIVE IN A BULL MARKET
S&P 500 - DAILY - ABOVE
We have entered a period of Stagflation & Market Rotation. It will likely last until this time next year. It will evolve in three waves as part of an Elliott Wave Triple Combo Pattern.
Short Term the SPX below the 200 day and the 50 crossing the 100 day is not a great set up for the bulls in the near term. More downside BUT a potential S&P 500 entry at 5300 with cash above 4% (done), lower RSI (a little lower to go) and "Tariff Week" behind us.
| |
THREE STAGES
Three down legs divided by 2 major counter rallies.
1- TARIFFS - First Wave Down
- The "W" Leg
- "W" is Nearing Completion
2- STAGFLATION - Second Wave Down
3- RECESSION - THIRD WAVE
S&P 500 - WEEKLY - RIGHT
CLICK TO ENLARGE
DURATION OF CORRECTIVE: ~ 1 YEAR
| | MATASII'S STRATEGIC INVESTMENT INSIGHTS | | 2020 VIDEOS OUTLINING THE COMING RISE IN INFLATION, STAGLFLATION & COMMODITY PRICES | | IDENTIFICATION OF HIGH PROBABILITY TARGET ZONES | |
Learn the HPTZ Methodology!
Identify areas of High Probability for market movements
Set up your charts with accurate Market Road Maps
Available at Amazon.com
| | The Most Insightful Macro Analytics On The Web | | | | |