|
Gordon T Long Research exclusively distributed at MATASII.com
Subscribe to Gordon T Long Research - $35 / Month - LINK
Complete MATASII.com Offerings - $55/Month - LINK
SEND YOUR INSIGHTFUL COMMENTS - WE READ THEM ALL - lcmgroupe2@comcast.net
| |
|
CURRENT MARKET PERSPECTIVE
NOTE: You Are Missing our Subscriber Mid-Week Update - You Are working with only half the info!
| |
|
AN UNCHARACTERISTIC DESTABILIZING FOMC
THE FED SIGNALS INFLATION & EMPLOYMENT ISSUES AHEAD
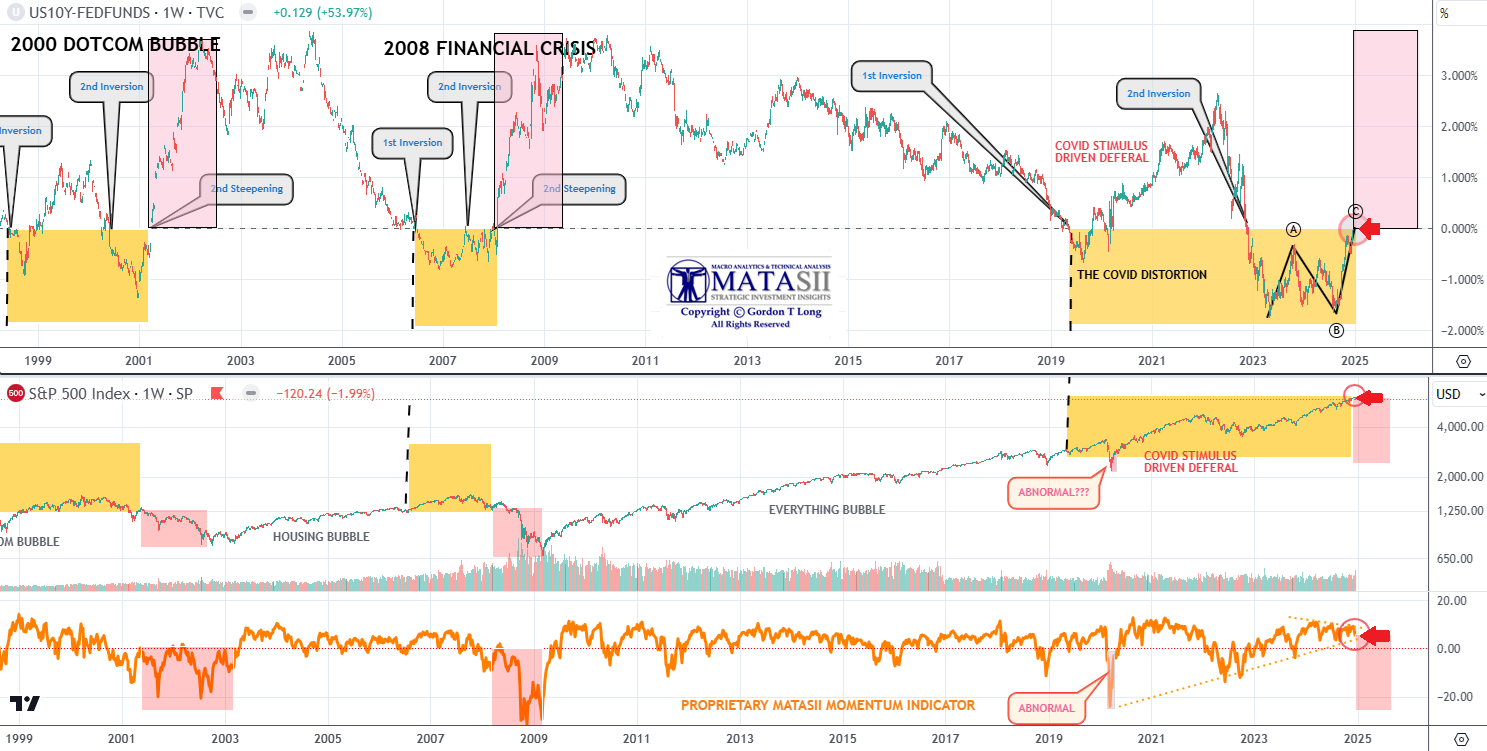
THIS CHART SAVED US FROM THE DOTCOM BUBBLE BURST AND THE GFC
-- WILL IT AGAIN? --
| |
|
CHART ABOVE: The 10Y-FFR Yield Curve Is at that critical point of un-inverting when the Fed & equity market can detect the timing of the down move.
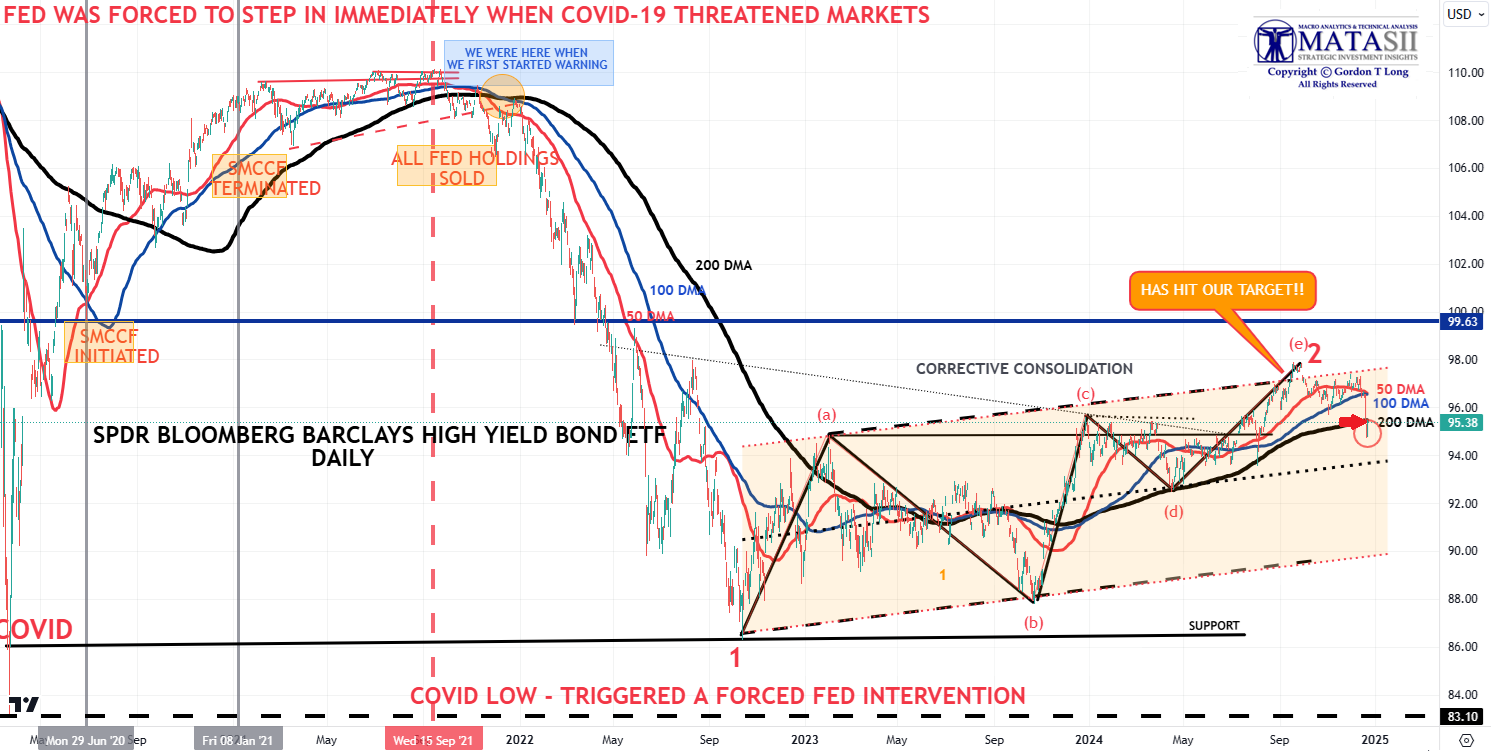
CHART RIGHT: The High-Yield Credit market identified by the JNK makes its move down with the 50 DMA about to cross the 100 DMA to the downside
.
CREDIT ALWAYS LEADS
The Credit markets have sent the Fed a clear signal that the "gig" is up! Markets are headed lower OR the Fed must modify its policy stance. The Fed must:
-
Recognize and acknowledge worsening Inflation and Unemployment is ahead.
- Real Economic Stagnation has moved to Stagflation.
- The Fed must take control of the bond market before it takes control of the stock market.
- End QT
- Begin the process of signaling to the financial markets that QE & YCC are ahead.
| |
|
1- SITUATIONAL ANALYSIS
"BE CAUTIOUS WHEN OTHERS ARE NO LONGER FEARFUL!"
| |
|
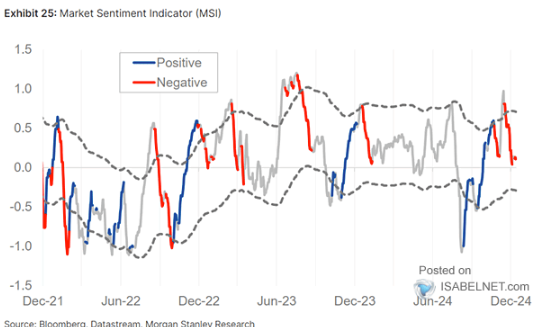
NEW--1- MARKET SENTIMENT INDICATOR - 12/20/24
Morgan Stanley’s current market sentiment indicator reflects a risk-negative outlook.
| |
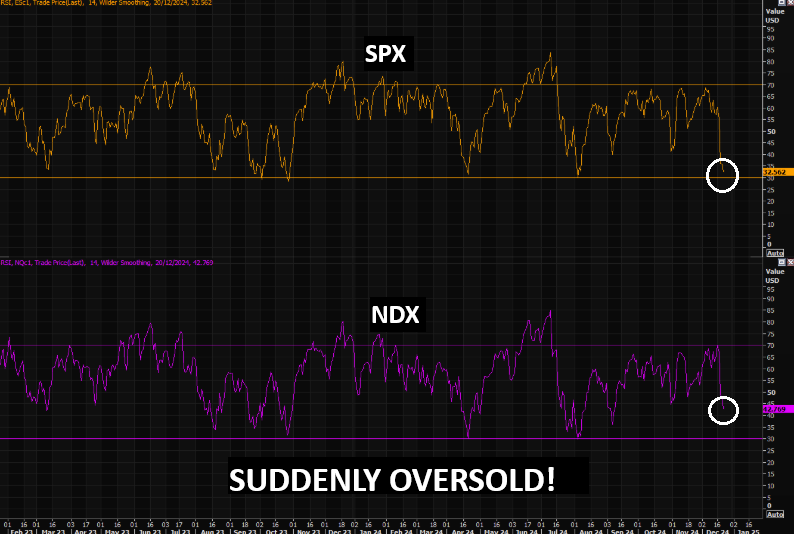
NEW--2- OVERBOUGHT/OVERSOLD INDICATOR - 12/20/24
Suddenly Oversold! SPX and NASDAQ futures at the most oversold levels in long time.
| |
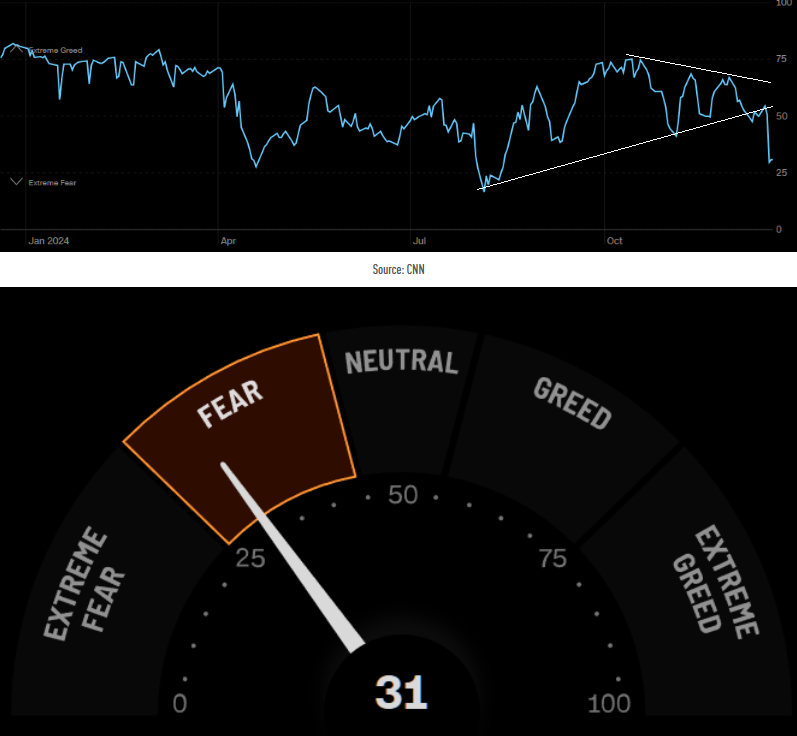
NEW--3- CNN FEAR-GREED INDEX - 12/19/24
That was quick!! Fear made a strong comeback. The question is whether or not we see extreme fear kick in.
| |
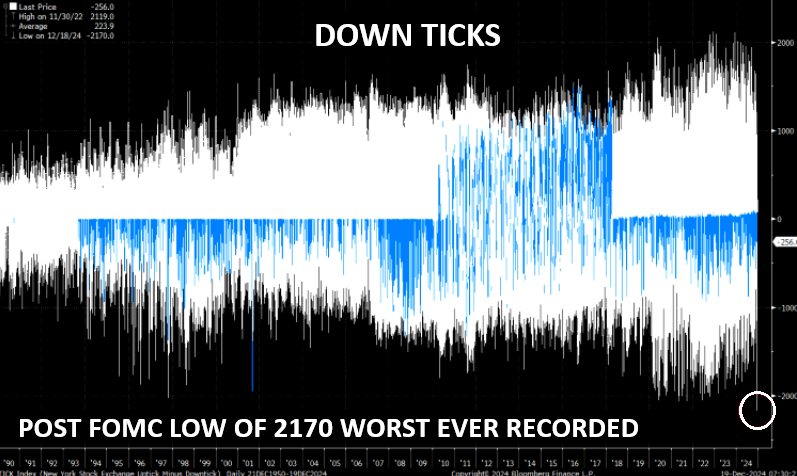
NEW--4-DOWNTICKS - 12/19/24
Post-FOMC Announcement low of 2170 was the worst EVER recorded!
| |
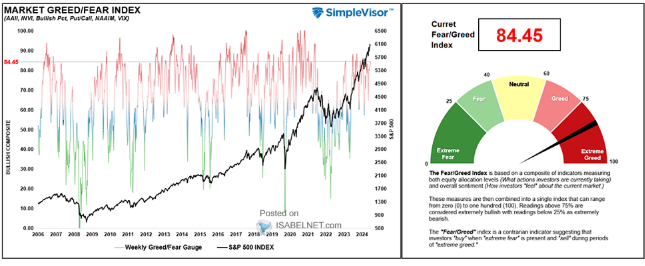
NEW --5- GREED - FEAR INDEX - 12/16/24
(AAII, INVI, BULLISH PCT, PUT/CALL, NAAIM, VIX)
The Market Greed/Fear Index has soared to 84.45, signaling a high level of investor optimism and excitement, akin to the thrill of children discovering an ice cream truck nearby.
| |
|
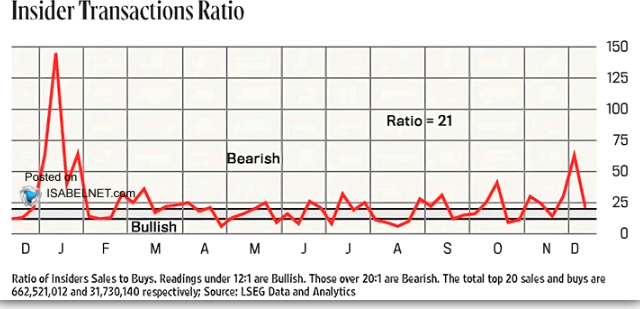
NEW--6- INSIDER TRANSACTION RATIO - 12/16/24
The Insider Transactions Ratio remains in bearish territory, indicating ongoing caution among corporate insiders.
| |
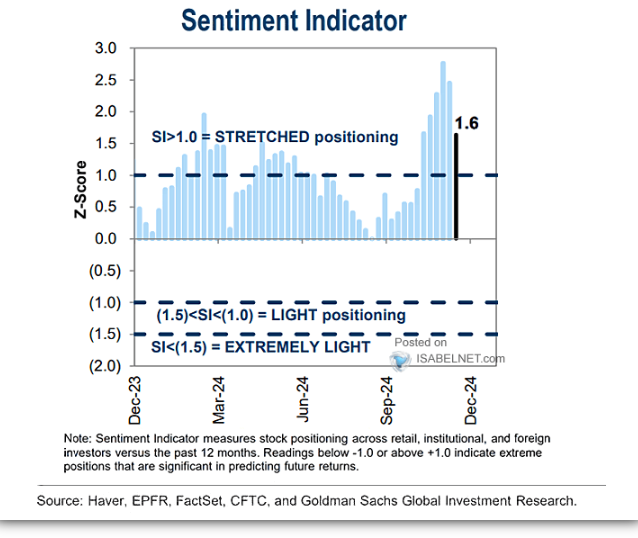
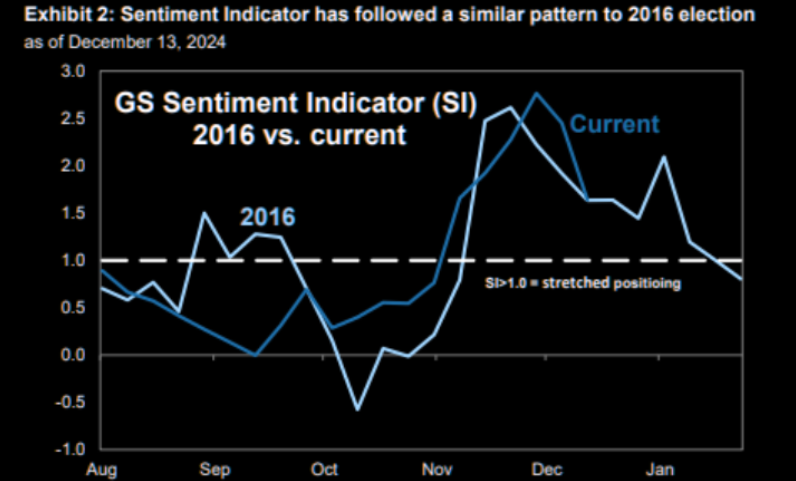
NEW--7- SENTIMENT INDICATOR & STOCK POSITIONING - 12/16/24
While the GS sentiment indicator indicates less extreme readings, it continues to point to a potentially overconfident market outlook.
| |
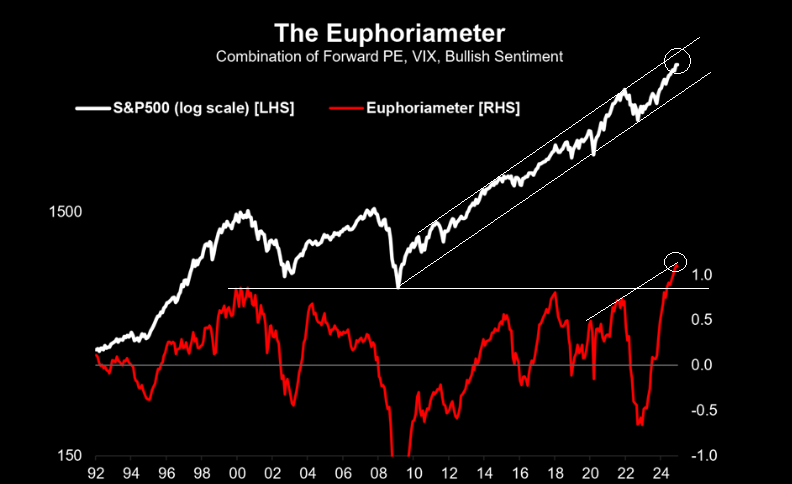
NEW--8- EUPHORIAMETER - 12/16/24
S&P 500 & COMBINATION OF FORWARD PE,VIX & BULLISH SENTIMENT
Bullish sentiment among investors in the U.S. stock market only continues to soar, reaching new all-time highs.
| |
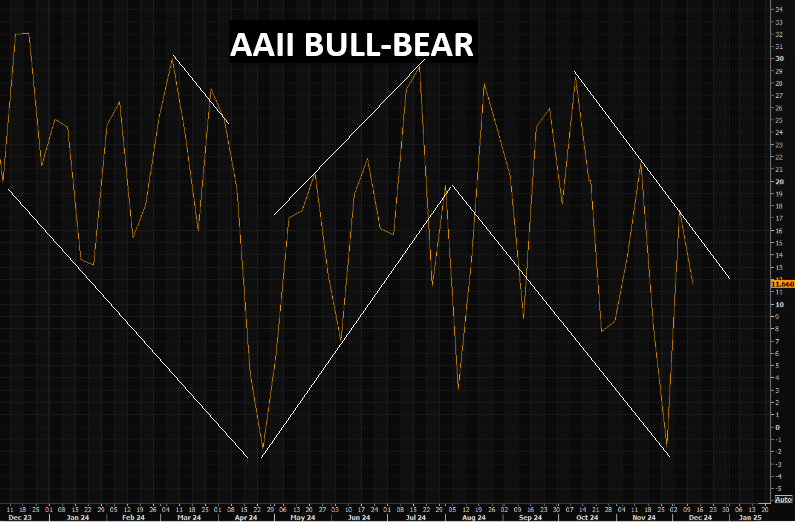
9- AAII BULL-BEAR - 12/13/24
No huge changes in the latest AAII sentiment reading. Chart shows a small move lower in the spread.
| |
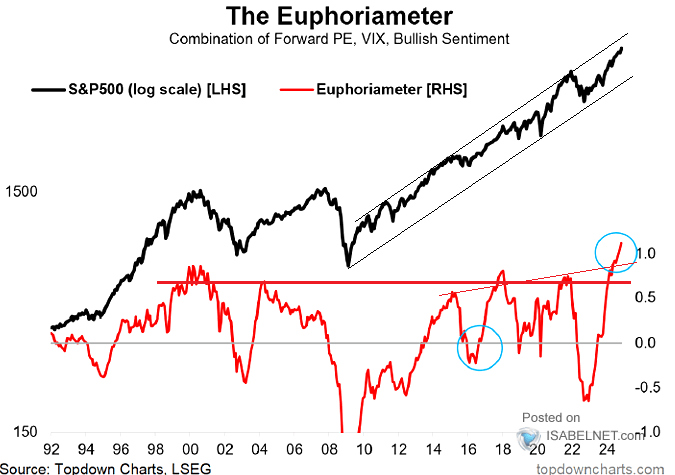
10- EUPHORIAMETER - 12/13/24
S&P 500 & COMBINATION OF FORWARD PE,VIX & BULLISH SENTIMENT - Bullish sentiment among investors in the U.S. stock market only continues to soar, reaching new all-time highs.
| |
B- FUND FLOWS - ETFs, FUND MANAGERS, HEDGE FUNDS, REBALANCING & ROTATION | |
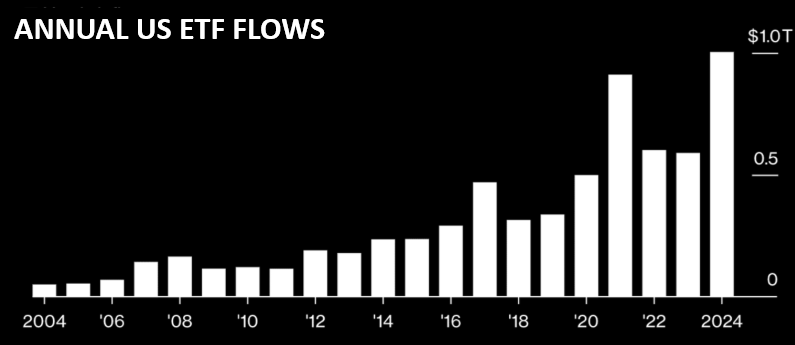
FIRST $1 TRILLION ANNUAL ETF FLOWS | |
RECORD FLOWS EVERYWHERE! | |
|
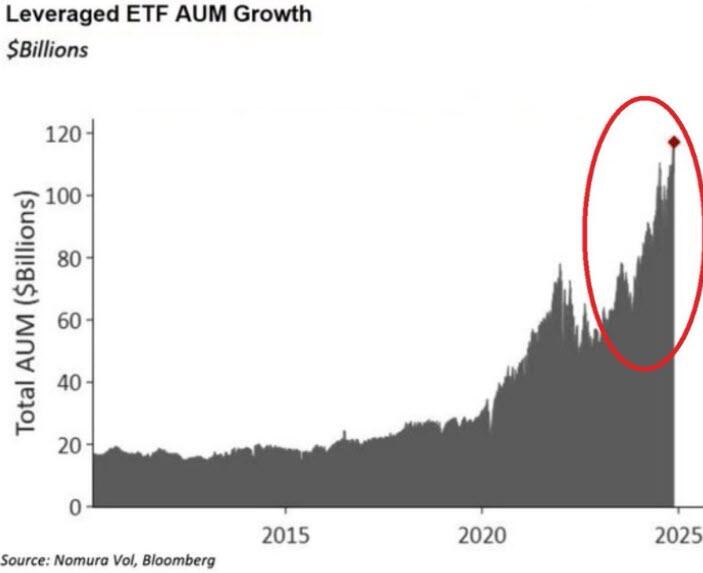
LEVERAGED ETF AUM GROWTH
The market is long stocks, but with gusto, or as it’s called in financial circles - “leverage”. Growth in leveraged ETFs has skyrocketed. Why suffer the indignity of only a 185% year-to-date return in Nvidia when you can attempt to double it with a "souped-up" ETF?
| |
|
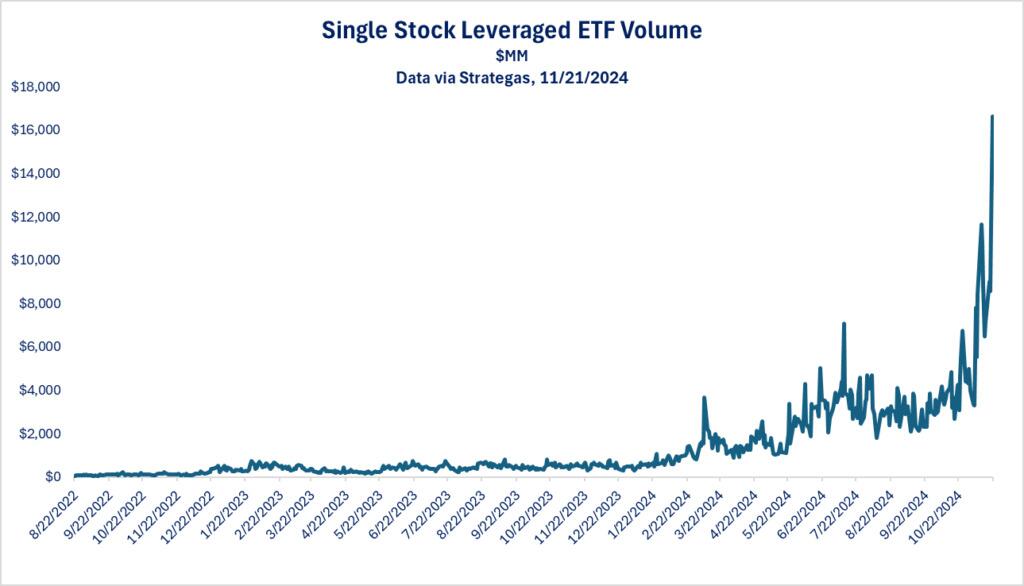
SINGLE STOCK LEVERAGED ETF VOLUME
The newest speculation and leverage tool of choice is leveraged single-stock ETFs. These funds, designed to amplify the daily performance of a single stock, were developed to meet investor demand for an easy-to-understand product. For example, GraniteShares’ NVDL offers 2x exposure to Nvidia and has seen soaring trading activity. While the ETF can double the returns of Nvidia on any given day, it also doubles the losses. Such instruments are inherently risky, especially in volatile market conditions. Their popularity reflects an increasing appetite for speculative investments, often at the expense of prudent, long-term decision-making.
| |
C- PATTERNS - Wedges, Trading Ranges, Ending Diagonals, ATH (All Time Highs / Lows) | |
|
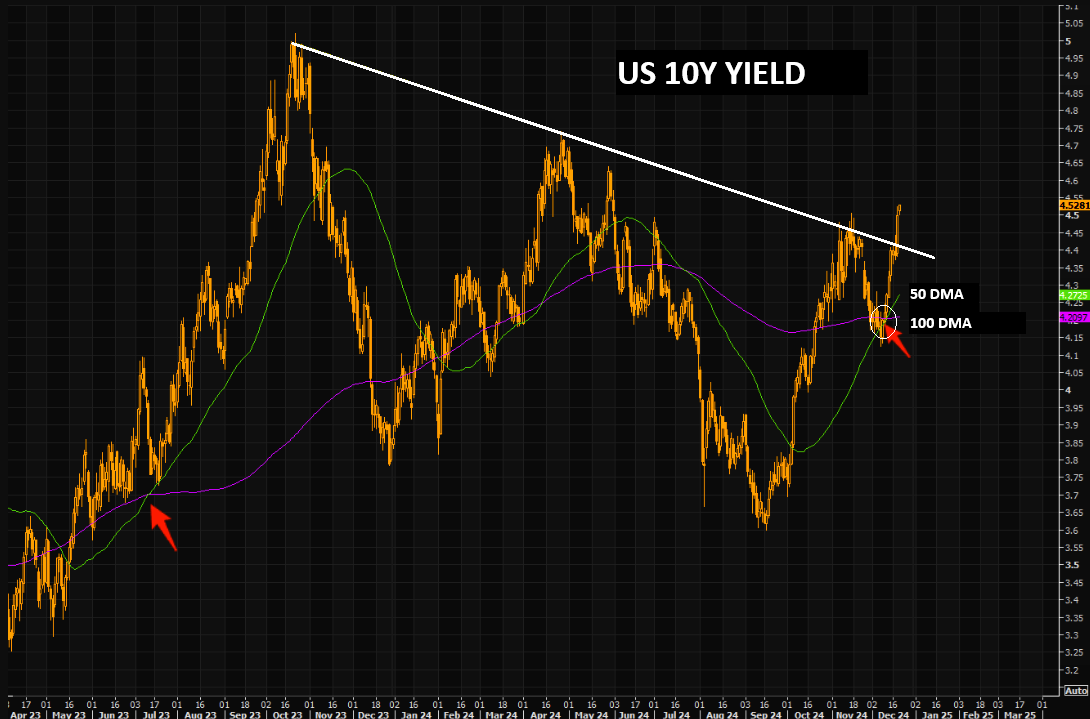
THREE MAJOR GOLDEN CROSSES
1- 10Y UST
The negative trend was crushed Post FOMC Wednesday. The 10 year is up 40 bps from the low print on Dec 9.
| |
|
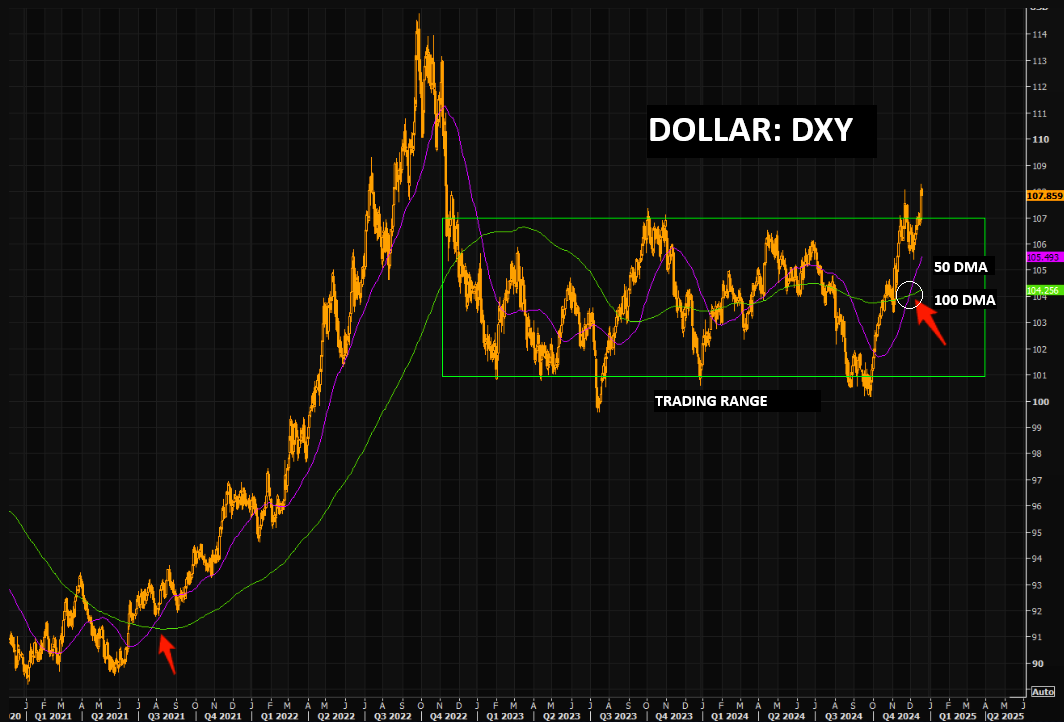
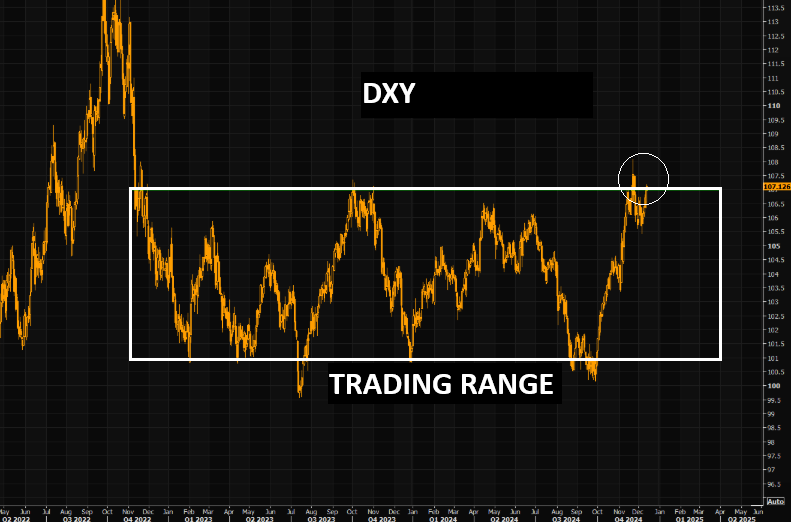
2- US DOLLAR
DXY closed well above the range in Wednesday's brutal session. We got a golden cross here as well not long ago. Last time a similar cross occurred was back in Q3 2021 when the dollar caught massive bids.
| |
|
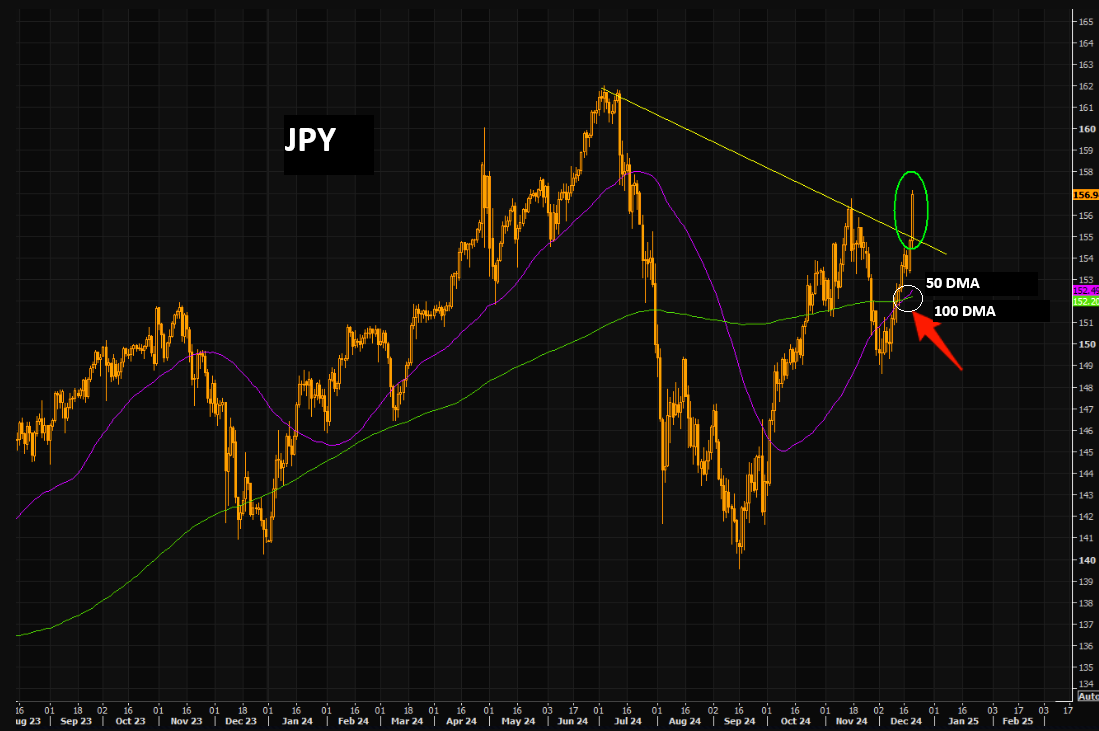
JAPAN'S JPY
A massive JPY move. JPY put in a massive candle. Note the golden cross. This is a very fluid situation for the world's third biggest currency.
| |
|
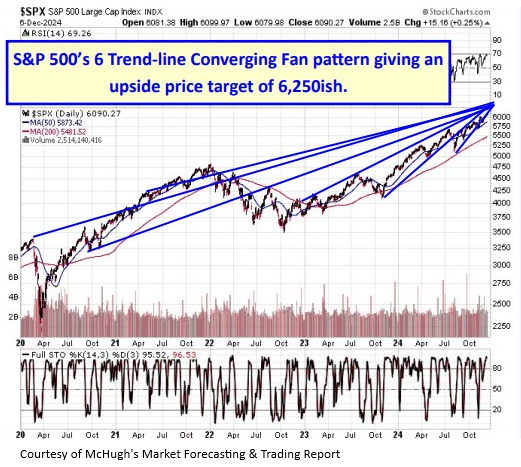
S&P 500 CONVERGING FAN PATTERN: There are at least 6 trend-lines, with at least 2 touchpoints, from 2020 that all converge around 6,250ish around December 2024 / January 2025 for the S&P 500. This gives a potential upside price target for the S&P 500, which also happens to agree with three different completing Rising Wedge patterns of differing degrees of trend, If the above
pattern is correct, the S&P 500 should soon top and decline.
| |
|
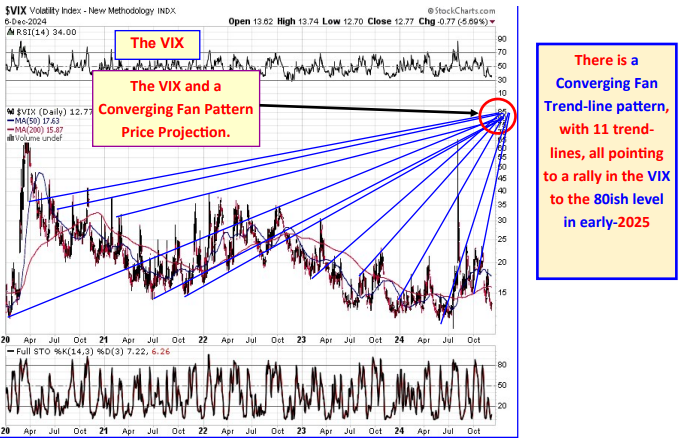
Typically, when the VIX rises, the stock market declines. For example, the VIX rose 10 points, 50 percent, on Friday, November 26th, 2021’s stock market selloff, the day after Thanksgiving 2021. Above we show a Converging Fan Trend-line pattern, with 11 trend-lines, each having at least 2 touchpoints of tops or bottoms, all pointing to a singularity price and time point of 80ish for the VIX toward the beginning of 2025.
WE TARGET THESE CONVERGENT PATTERNS TO HAVE AN APEX AT APPROX. THE JANUARY 2025 OPEX.
NOTE: THE RESULT MAY BE THE BEGINNING OF A
DOUBLE TOP OR DOOM TOP.
| |
D- INDICATORS - Phi Mates, Bradley Numbers, Fibonacci Clusters & Others | |
|
Next Phi Mate Turn Date
- February 13th, 2025, +/- a few days
Phi Clusters
Next Bradley Model Turn Date
Hindenberg Omen
- A new Official Hindenburg Omen occurred Friday, November 1st, 2024. It has 5 observations, and warns of a potential stock market plunge sometime between November 2024 and March 1st, 2025.
- There is also a 5-observation Official H.O. observation on the clock from September 6th, 2024 through January 2025.
| |
|
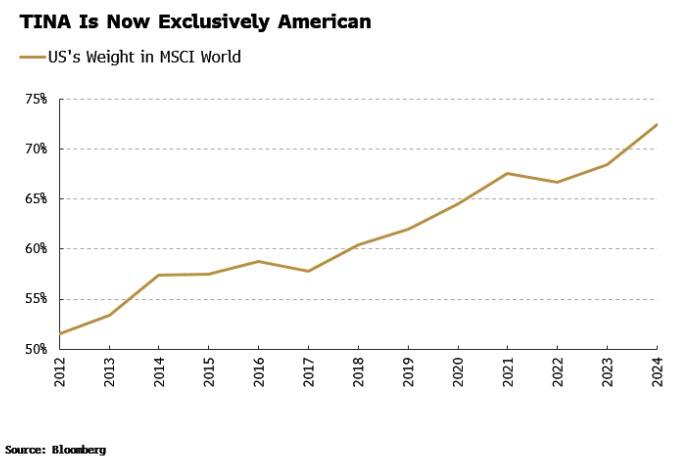
TINA (There Is No Alternative) -
NOW EXCLUSIVELY AMERICAN
The market’s near record overweight in equities raises portfolio rebalancing risk, with investors selling stocks to buy bonds. US equities are the only game in town. A lack of global alternatives in high-quality companies is pushing more and more capital into the US stock market. The US has risen to a megalithic high on three-quarters of the MSCI World index, from just over half in 2012.
TINA now applies exclusively to stocks from the US.
| |
|
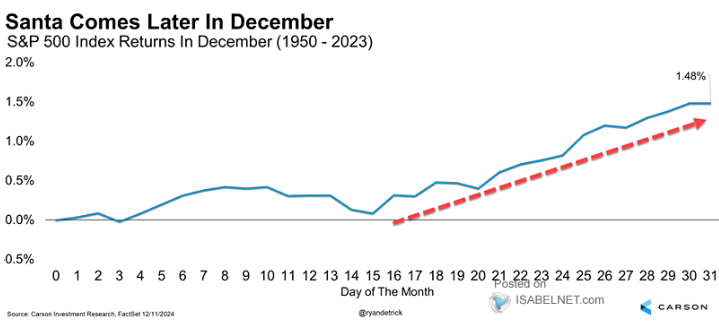
SANTA CLAUS' "SEASONALITY" RUDOLF JUST GOT SICK!
S&P 500 Index Returns in December Bulls were buzzing with excitement before Powell FOMC presser. While December is typically strong for U.S. stocks, with the majority of gains usually occurring after the 15th, it suddenly hit a wall!!
| |
|
|
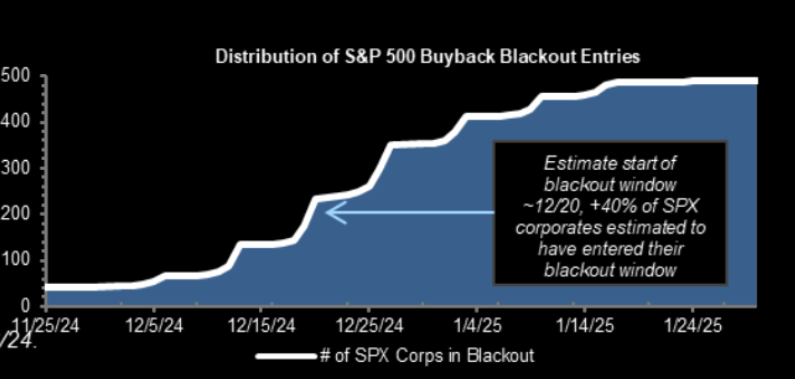
CHART RIGHT: Couple this above with the fact that the big bid is fading. GS estimates that 40% of companies will be in the black out window as of December 20...and it will fade further.
| |
2016 ELECTION YEAR SENTIMENT INDICATOR COMPARISON: Additionally, Sentiment has fallen lately, tracking 2016 quite closely! | |
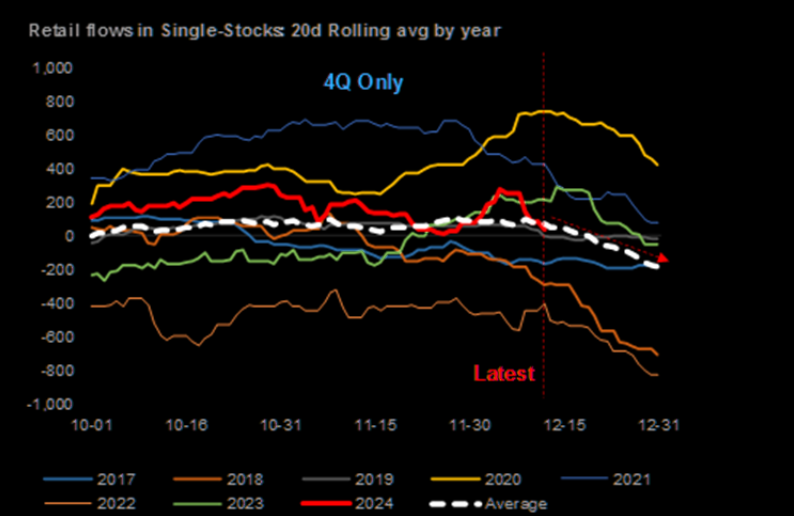
YE RETAIL SELLING PATTERN: Retail Army normally sells ahead of Christmas. The chart below shows retail flow in single stock in Q4. | |
|
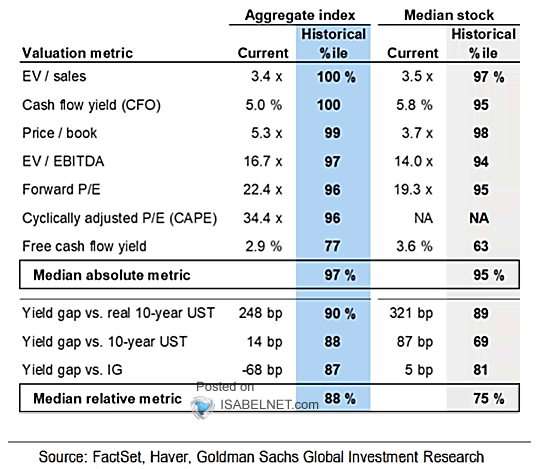
PROFIT MARGINS
- The S&P 500’s quarterly profit margin rose q/q for a third straight quarter to a nine-quarter high of 12.6% in Q3 from 12.4% in Q2.
- The profit margin improved q/q for just four of the 11 sectors, down from six in Q2. But Communication Services (20.1%) and Consumer Discretionary (10.0) delivered post-pandemic or record highs, the first for any sector since Q3-2023.
- Among the remaining nine sectors, Utilities (17.4%) improved to a 12-quarter high, Energy (8.5) fell to 13-quarter low, and Real Estate (25.8) dropped to a seven-quarter low.
- Information Technology’s 25.9% margin is the highest overall and exceeded Real Estate’s in Q3 for the first time ever.
| |
|
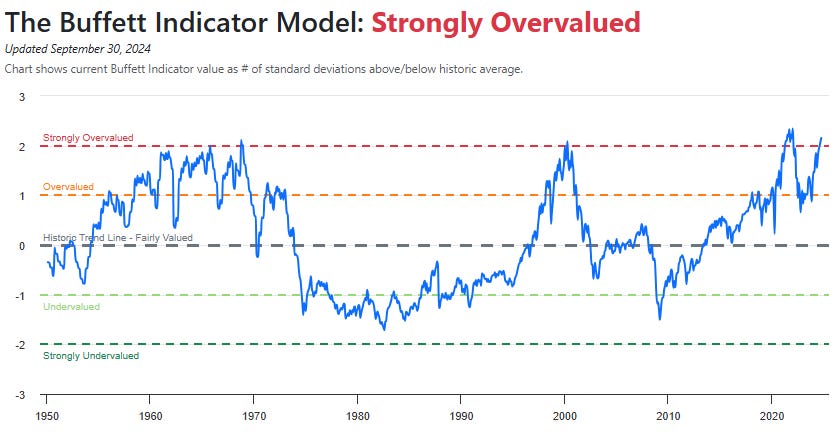
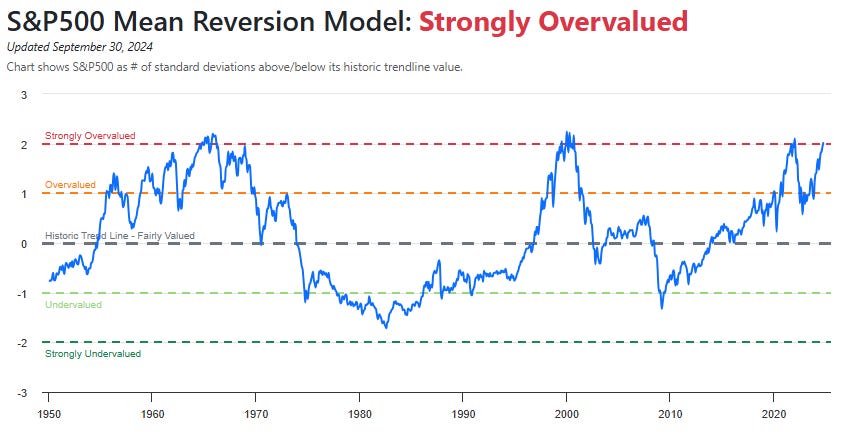
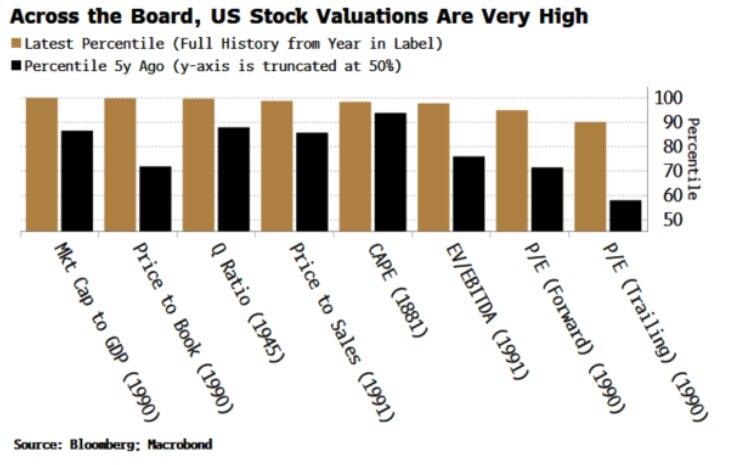
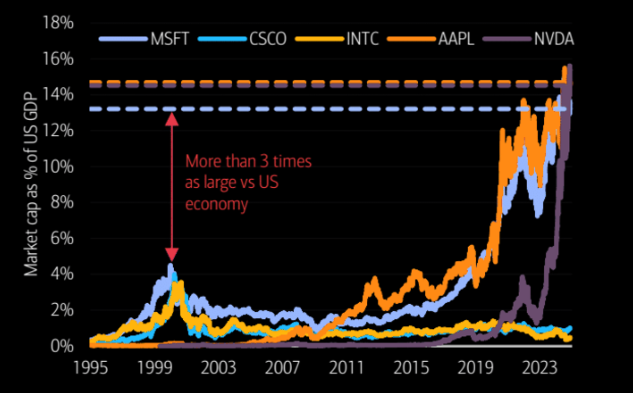
CHART RIGHT
Market is at extremes as measured by normal metrics.
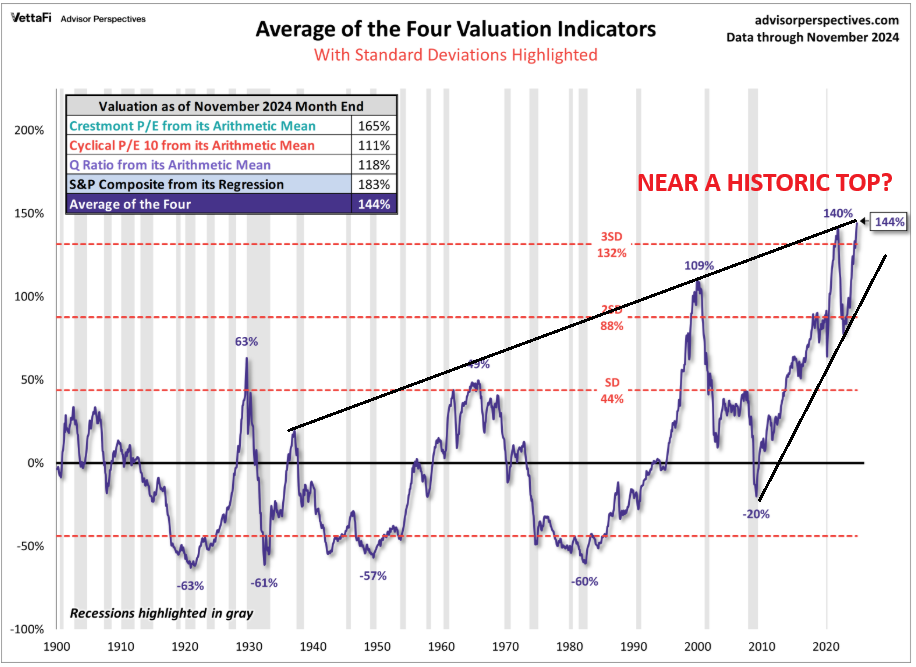
CHART BELOW
At the end of November, the average of the four is 144% — up from 140% in September. The current average is more than 3 standard deviations above its historical mean, signaling a highly overvalued market.
NOTE: With a record year in 2024, it can be expected that investors are not selling for Capital Gains tax reasons until after the new year. After the Santa Claus Rally is over and before the January OPEX, be cautious!
| |
|
NOTE
NEW IMAGE CHANGES ARE LABELED WITH A BLUE TRIPLE ***STAR***
OLD IMAGE CHANGES ARE LABELED WITH A RED TRIPLE ***STAR***
OLD IMAGES REFLECT MINIMAL CHANGE (Wasted Time!) but Narrative is ALWAYS updated.
ALL IMAGES UPDATED WEEKLY (EITHER THE MID-WEEK OR WEEKEND REPORTS)
REMEMBER: SIMPLY CLICK YOUR LIVE SUBSCRIBER LINK TO SEE THE LATEST CHART.
| |
|
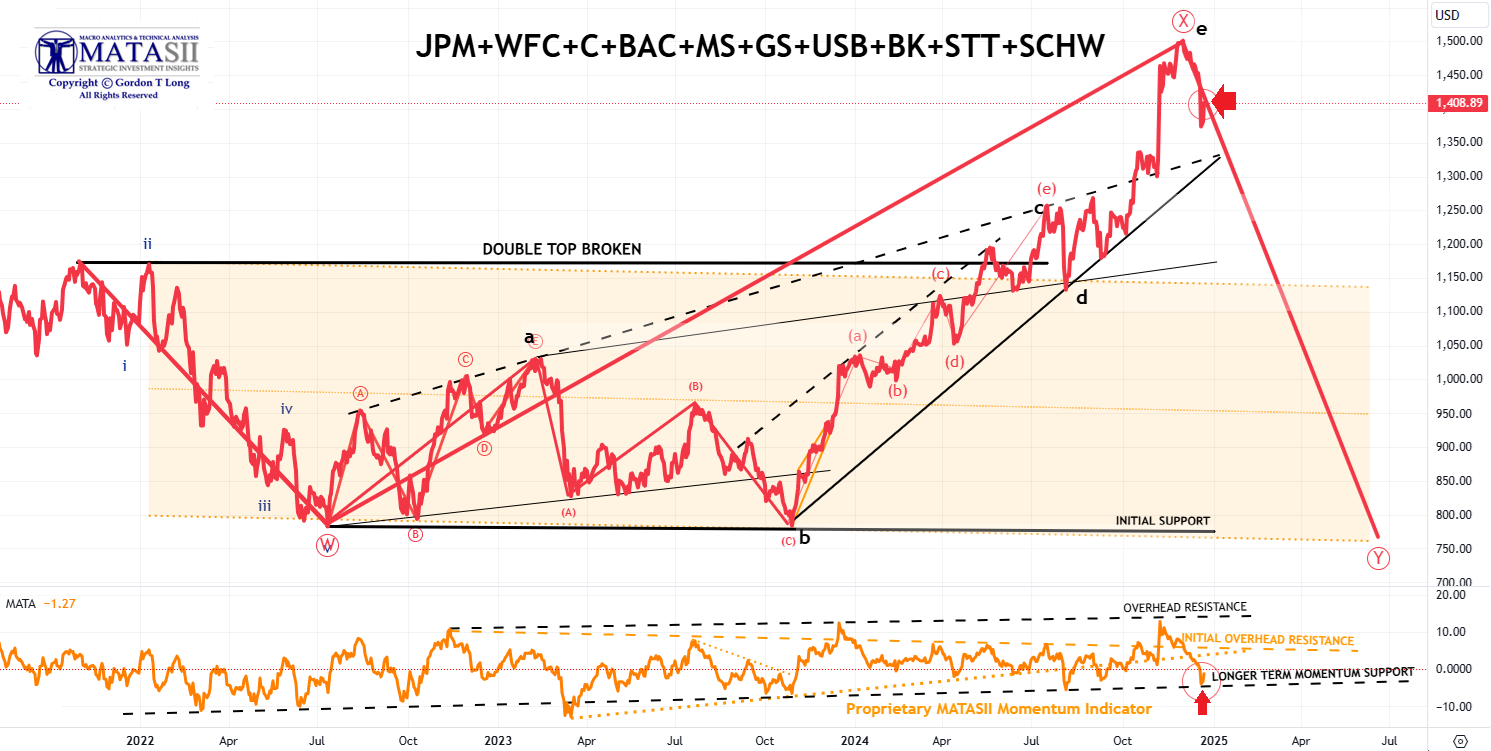
***THE MATASII BANK INDEX***
- The MATASII Bank Index dropped violently Wednesday after the FOMC presser. It closed at 1408.89 up +27.93 (+2.02%) on Friday's close.
- In the bottom panel, the MATASII Proprietary Momentum Indicator found support Wednesday at the lower support level shown by a dashed black trend line and highlighted by the red arrow. It has moved up on Thursday and Friday.
| |
|
YOUR DESKTOP / TABLET / PHONE ANNOTATED CHART
Macro Analytics Chart Above: SUBSCRIBER LINK
| |
|
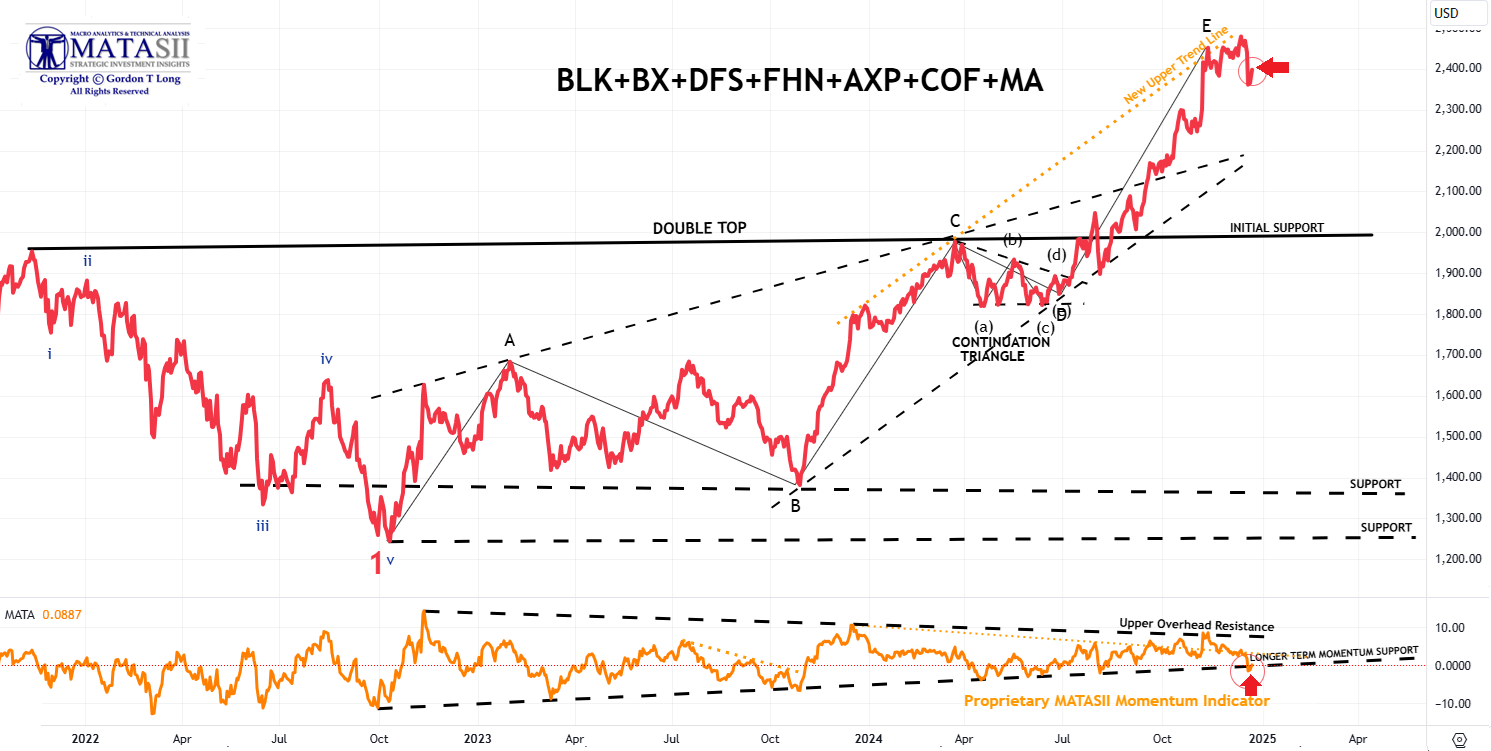
***THE MATASII FINANCIAL INDEX***
- The MATASII Financial Index dropped violently Wednesday after the FOMC presser closing at 2361.558 down -78.14(-3.20%). It closed Friday at 2397.96 up +32.16 (+1.36%) from Thursday close.
- In the bottom panel, the MATASII Proprietary Momentum Indicator found support slightly below the lower support level shown by a dashed black trend line and highlighted by the red arrow on Wednesday before rising Thursday and Friday.
- Both the Banking and Financial Index have generally mirrored each other since the Trump election win.
| |
|
YOUR DESKTOP / TABLET / PHONE ANNOTATED CHART
Macro Analytics Chart Above: SUBSCRIBER LINK
| |
|
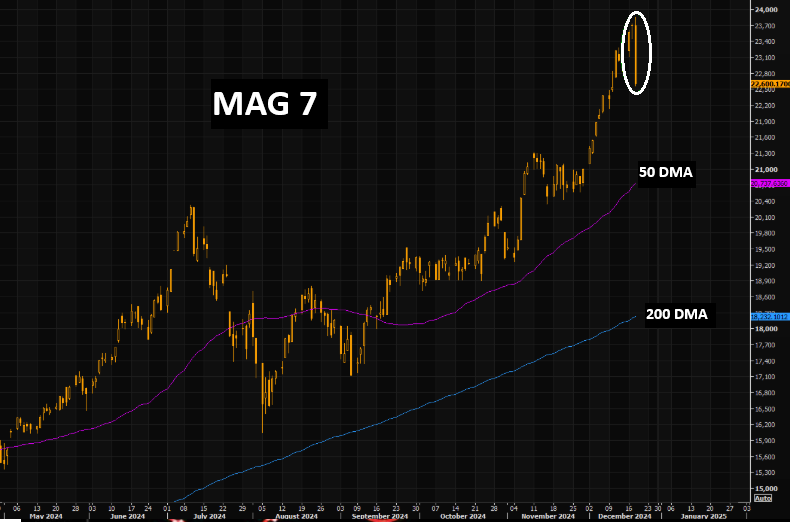
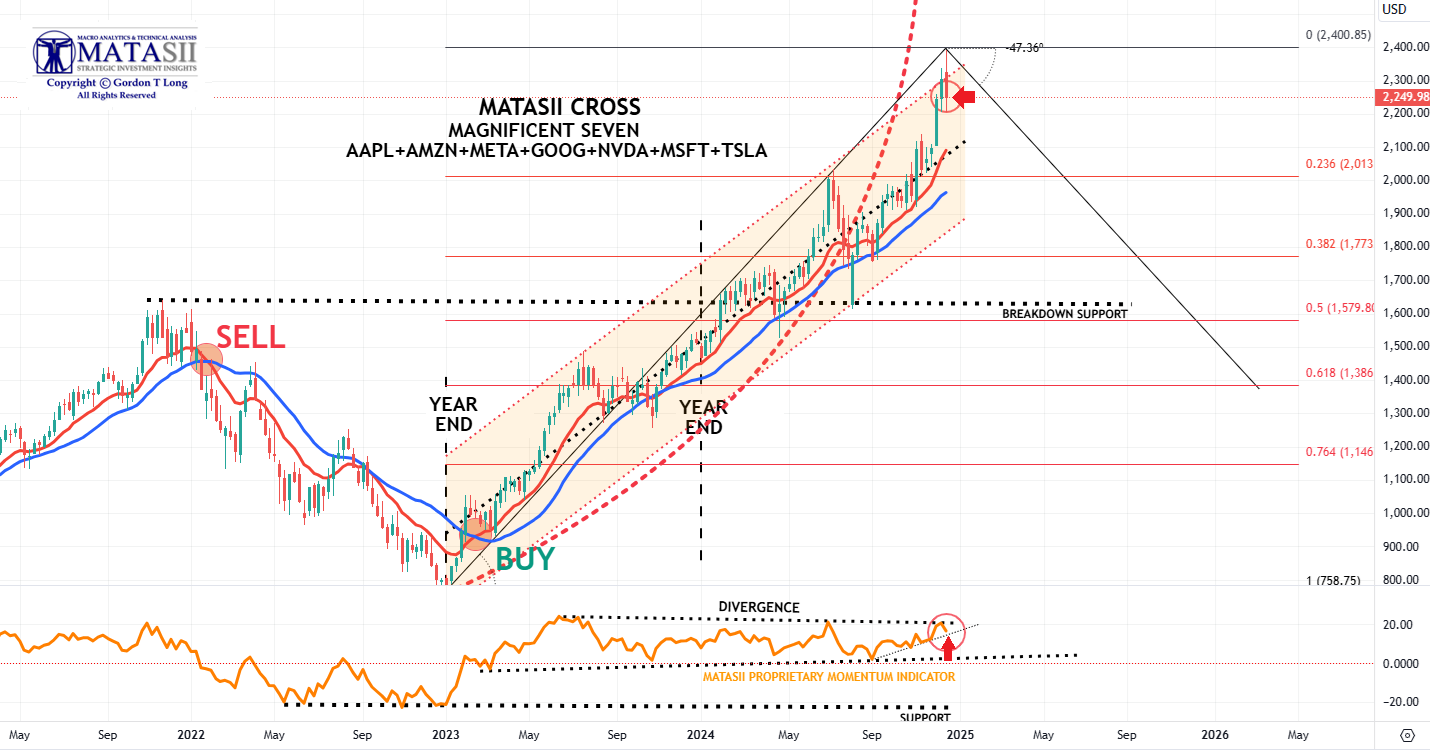
CHART RIGHT: MAG-7 putting in the biggest down candle we can recall. Despite today's puke, the MAG is still way above the 50 day, not to mention the 200 day.
CONTROL PACKAGE
- APPLE - AAPL - DAILY (CHART LINK)
- AMAZON - AMZN - DAILY (CHART LINK)
- META - META - DAILY (CHART LINK)
- GOOGLE - GOOG - DAILY (CHART LINK)
- NVIDIA - NVDA - DAILY (CHART LINK)
- MICROSOFT - MSFT - DAILY (CHART LINK)
- TESLA - TSLA - DAILY (CHART LINK)
| |
***MAGNIFICENT 7***
CHART RIGHT: This chart makes the 2000 Dotcom Bubble look like a "minor warm-up"?
CURRENT DAY'S VIEW:
- The Mag-7 fell strongly Wednesday to close at 2262.34, down -103.56 (-4.32%). The Mag-7 closed down on Friday at 2249.98 -12.23 (-0.54%).
- Meanwhile the MATASII Proprietary Momentum Indicator (lower panel) found support shown by the lightly colored orange rising trend line and marked by the red arrow.
| |
YOUR DESKTOP / TABLET / PHONE ANNOTATED CHART
Macro Analytics Chart Above: SUBSCRIBER LINK
| |
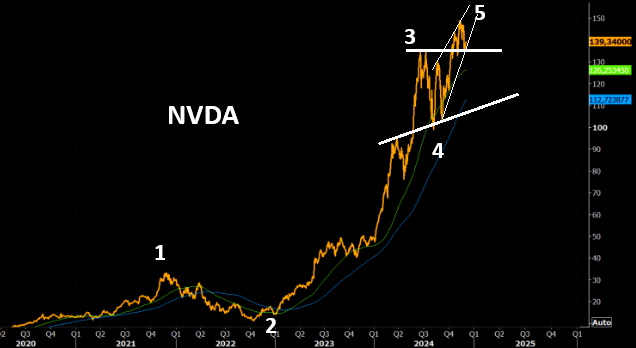
***NVIDIA - NVDA - DAILY***
AS GOES NVDA SO GOES THE MAG-7!
AS GOES THE MAG-7 SO GOES THE MARKET!
| |
|
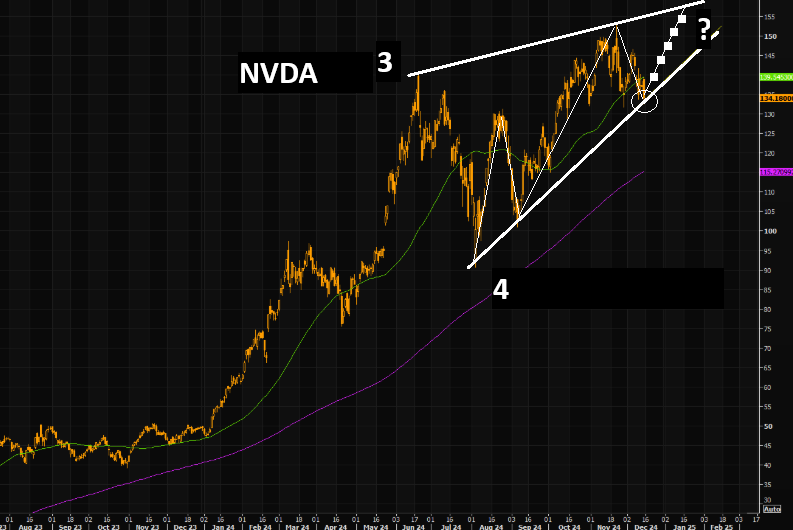
CHART RIGHT: NVDA is very close to a near term top that will result in a test of lower support levels, (solid white lines). Chart Right.
With a market cap of $3.61tn and nearly as big as the entire DAX and CAC combined, earnings are going to be a big event. To give you a scale for their astonishing earnings trajectory over such a short period of time, at the recent lows in Jan 2023 Nvidia earned $4.4bn over the preceded last 12m. However, today the consensus will see them earn $61.4bn over the last 12 months. Then, by the time we hit 2027, they are expected to earn $118.1bn LTM.
| |
|
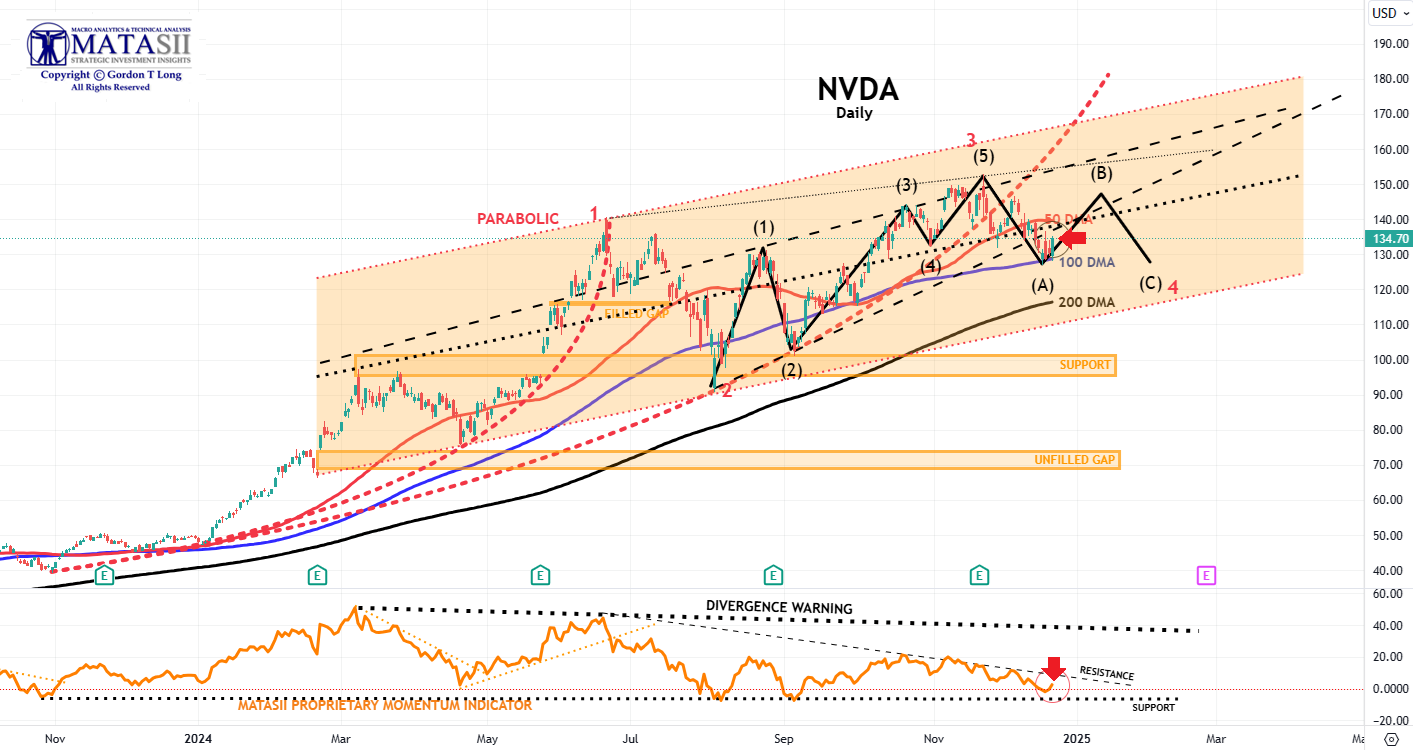
CHART RIGHT: We have not closed this much below the 50 day since September. Also worth noting is that the trend line since August lows comes in right here. NVDA can't afford to close much lower.
Today's Note:
- NVDA fell Wednesday to close at 128.91 down -1.48 (-1.14%). It closed Friday at 134.7 up +4.02 (+3.08%).
- NVDA has found initial support at the 100 DMA.
- The NVDA MATASII Momentum indicator (black dotted line) in the lower panel appears to be what will be required to complete this leg down.
Longer Term Note:
- At some point, the major unfilled gaps (at much lower levels) must be filled. We anticipate a likely test of the 200 DMA in Q4 2024 or Q1 2025.
- NVDA therefore may no longer become a Short to Intermediate Long Term hold, but rather a position trading stock, as other competitors enter the space, force margins and the earnings growth rate contracts.
| |
|
YOUR DESKTOP / TABLET / PHONE ANNOTATED CHART
Macro Analytics Chart Above: SUBSCRIBER LINK
| |
|
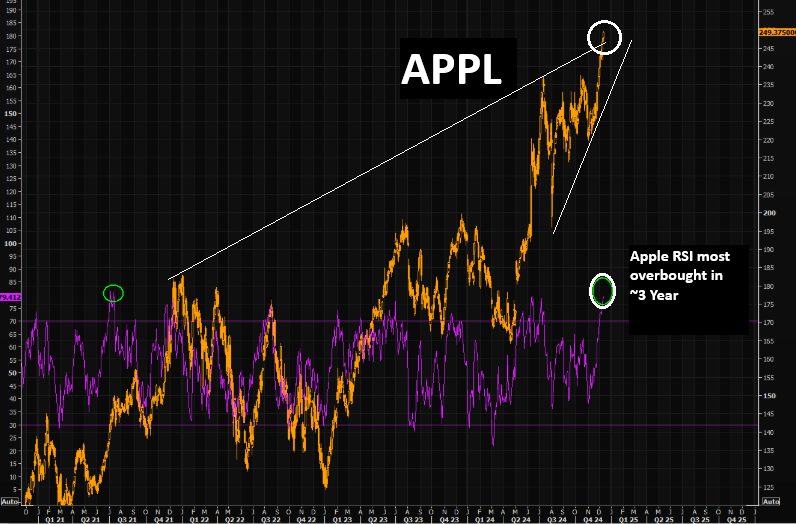
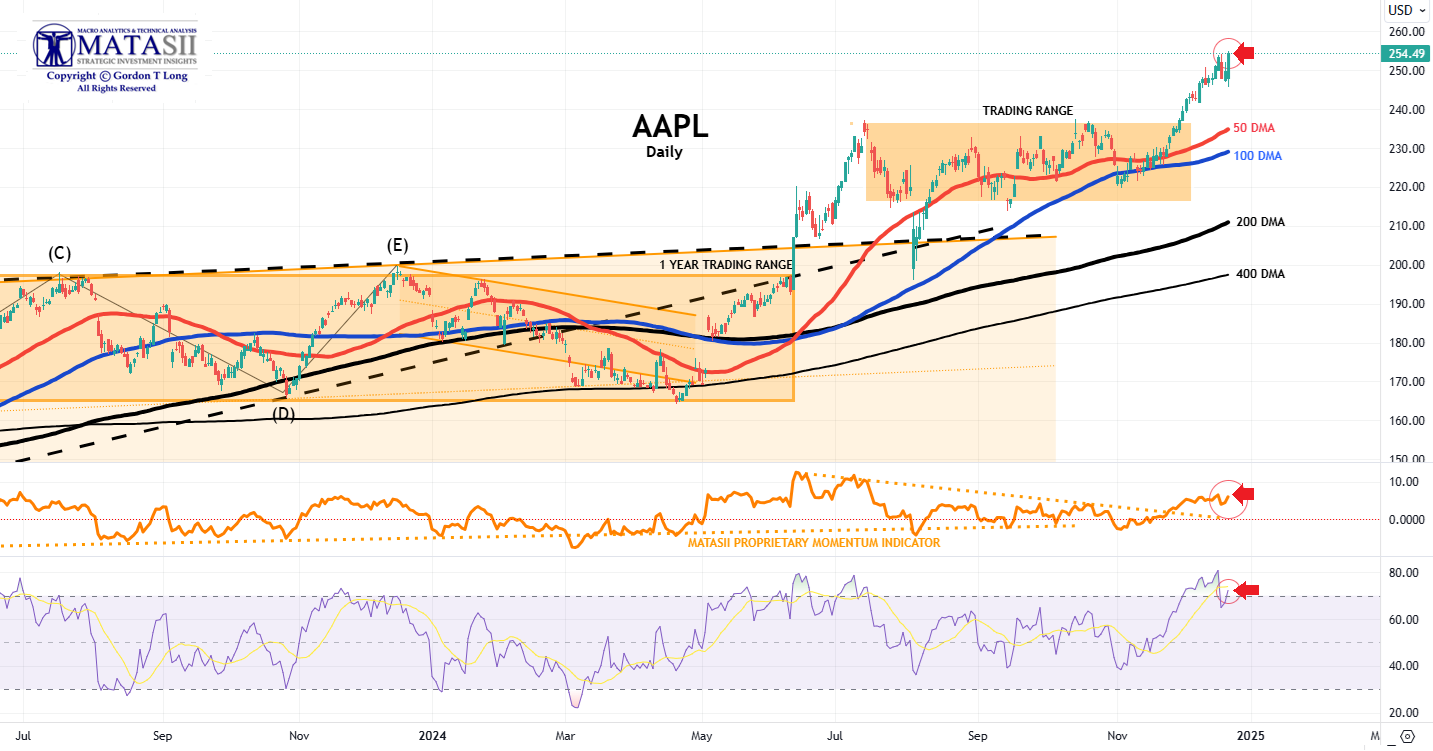
***APPLE - APPL - DAILY***
CHART RIGHT:
APPL has had a significant lift, but appears to be putting in a potential ending diagonal pattern.
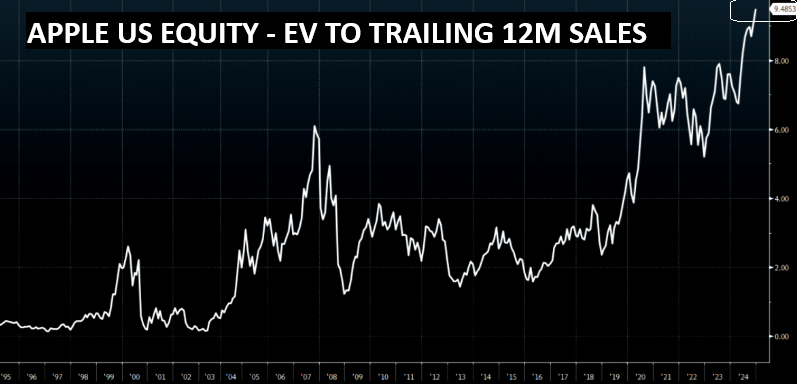
CHART BELOW
You’re paying 10x sales now to buy Apple stock.
| |
|
Today's Note:
- APPL was down modestly Wednesday ending at 248.05 -5.43 (-2.14%), but closing up Friday at 254.49 +4.70 (+1.88%).
- APPL initially found overhead resistance early last week at its MATASII Momentum Indicator (middle panel), shown by the dotted black trend line, but blew through it at week's end. It has continued to rise though is flattening out.
- Apple RSI is at the most overbought levels in "modern times". It might be time for mighty Apple to catch some breath?
| |
|
YOUR DESKTOP / TABLET / PHONE ANNOTATED CHART
Macro Analytics Chart Above: SUBSCRIBER LINK
| |
|
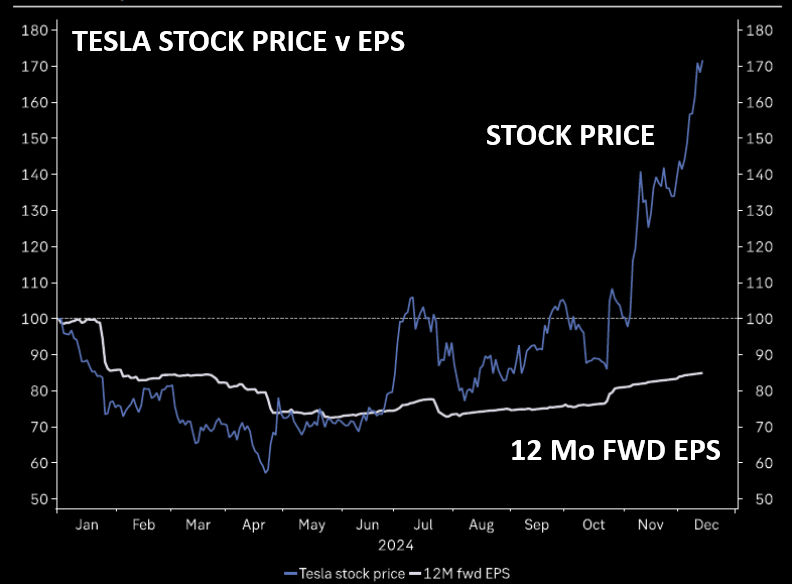
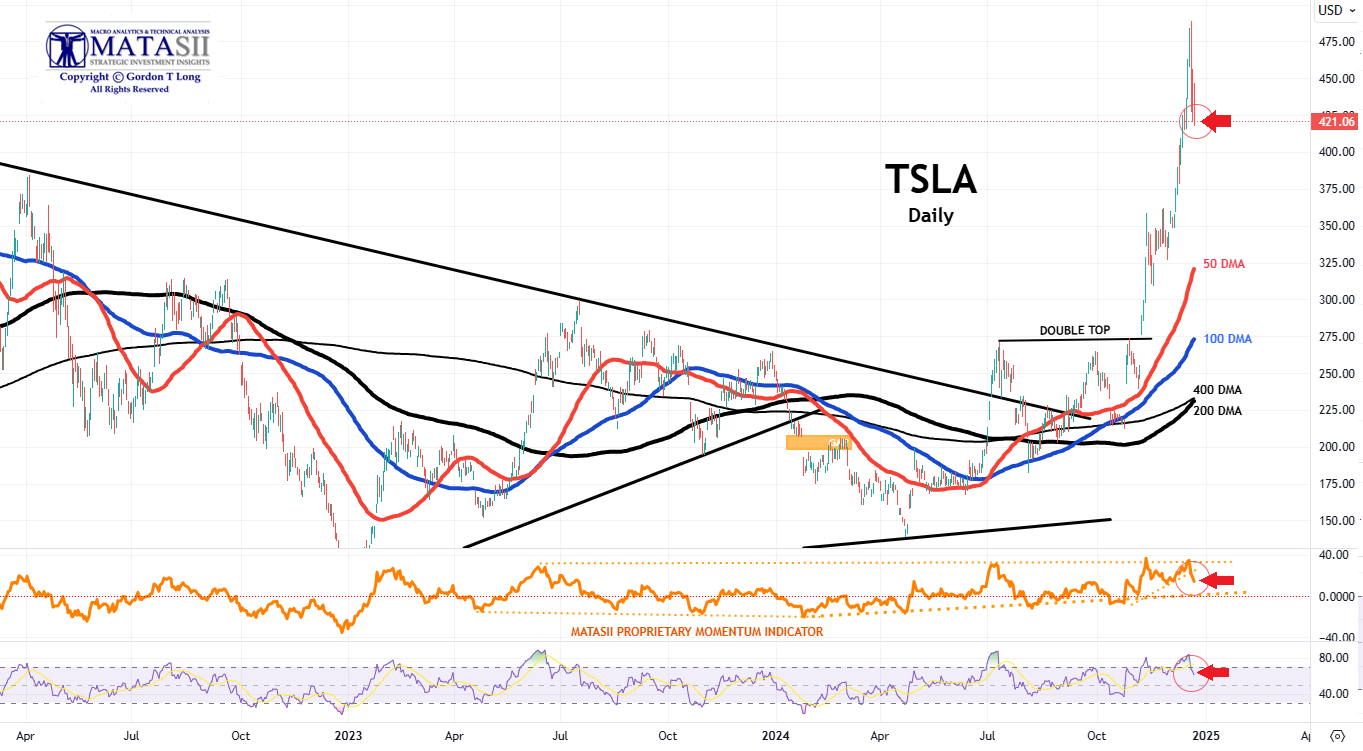
***TESLA - TSLA - DAILY***
CHART RIGHT: Major Decoupling - Tesla takes off despite soft earnings –why?
Today's Note:
- TSLA fell sharply Wednesday to close at 440.13 down +39.73 (-8.28%). It was down again by Friday close at 421.06 -15.11 (-3.46%).
- TSLA initially found Momentum support at a rising orange dotted trend line which it broke through quite hard.
- We suspect Support will be found lower at the rising 50 DMA level since this an aggressively technically traded stock.
| |
|
YOUR DESKTOP / TABLET / PHONE ANNOTATED CHART
Macro Analytics Chart Above: SUBSCRIBER LINK
| |
|
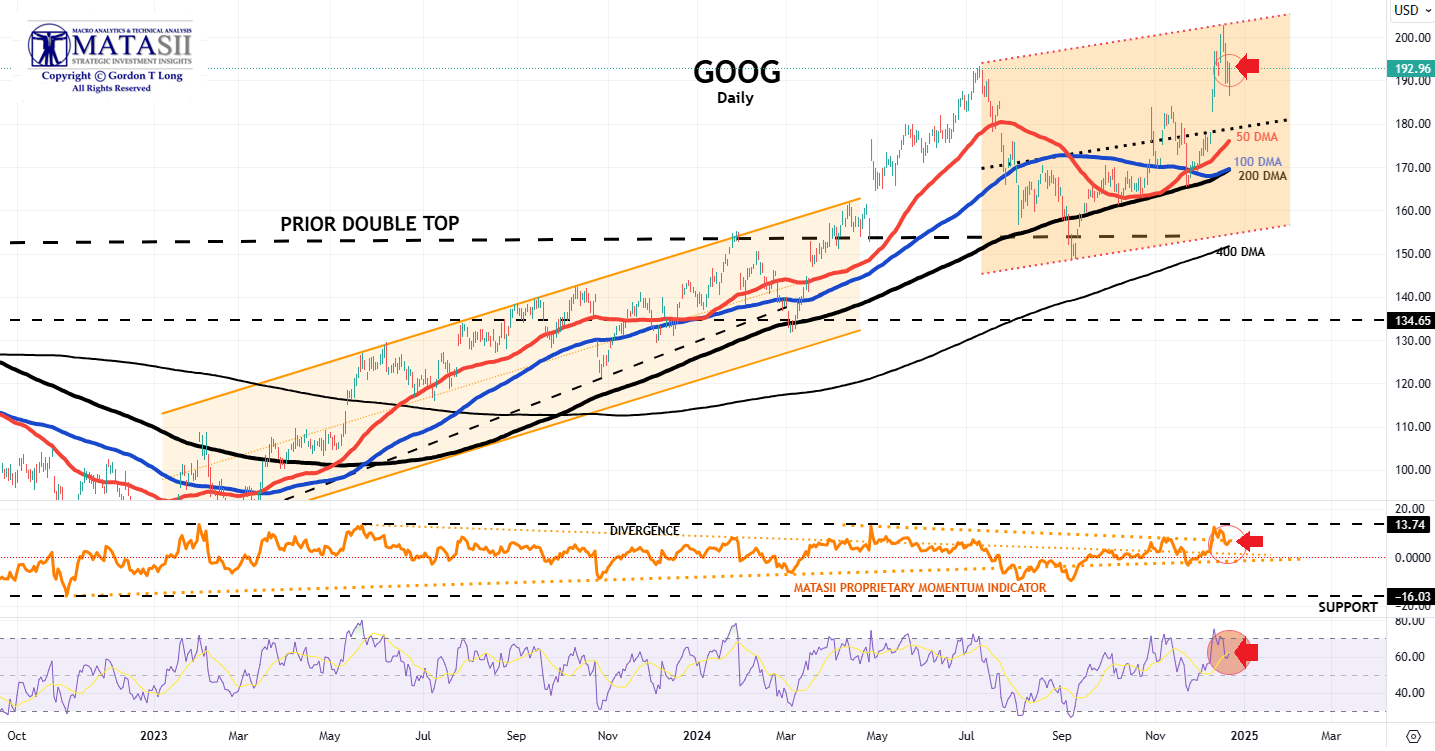
***GOOGLE - GOOG - DAILY***
Today's Note:
- GOOG closed Wednesday lower at 190.15 down -6.97 (-3.54%), but rising by Friday to close up at 192.96 +3.26 (+1.72%).
- GOOG has found initial support at its MATASII Momentum Indicator (middle panel) shown by the light orange dotted trend line and maked by the red arrow.
| |
|
YOUR DESKTOP / TABLET / PHONE ANNOTATED CHART
Macro Analytics Chart Above: SUBSCRIBER LINK
| |
"CURRENCY" MARKET (Currency, Gold, Black Gold (Oil) & Bitcoin) | |
|
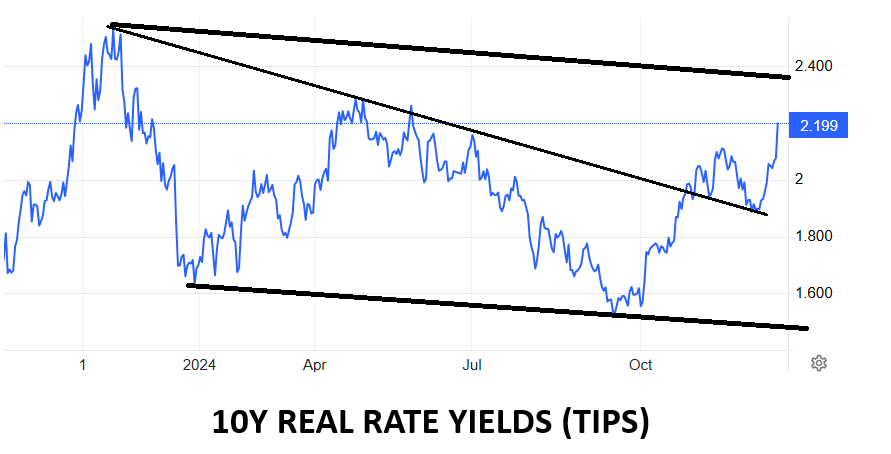
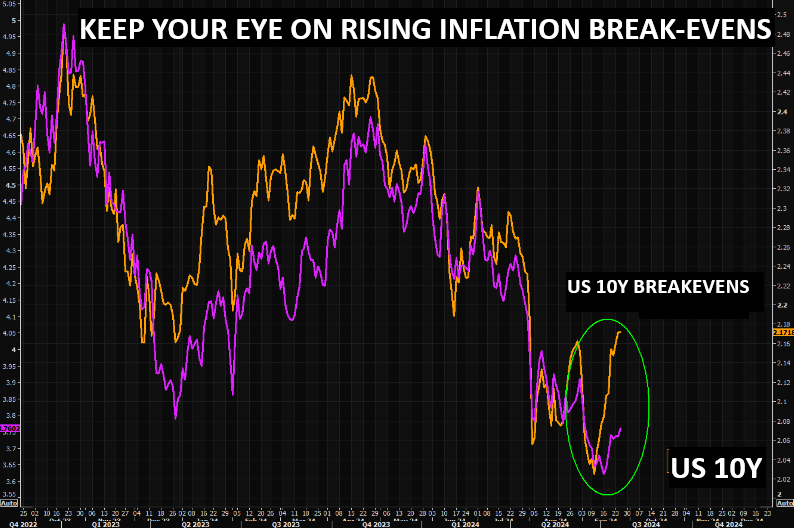
10Y REAL YIELD RATE (TIPS)
Real Rates have broken through its descending trend wedge channel line, (shown in the chart to the right - as of close 12/18/24). (LATEST)
The latest US NY Fed SCE has seen inflation expectations increase across the forecast horizon.
| |
CONTROL PACKAGE
There are TEN charts we have outlined in prior chart packages, which we will continue to watch closely as a CURRENT Control Set:
-
US DOLLAR -DXY - MONTHLY (CHART LINK)
-
US DOLLAR - DXY - DAILY (CHART LINK)
-
GOLD - DAILY (CHART LINK)
-
GOLD cfd's - DAILY (CHART LINK)
-
GOLD - Integrated - Barrick Gold (CHART LINK)
- SILVER - DAILY (CHART LINK)
-
OIL - XLE - MONTHLY (CHART LINK)
-
OIL - WTIC - MONTHLY - (CHART LINK)
-
BITCOIN - BTCUSD -WEEKLY (CHART LINK)
-
10y TIPS - Real Rates - Daily (CHART LINK)
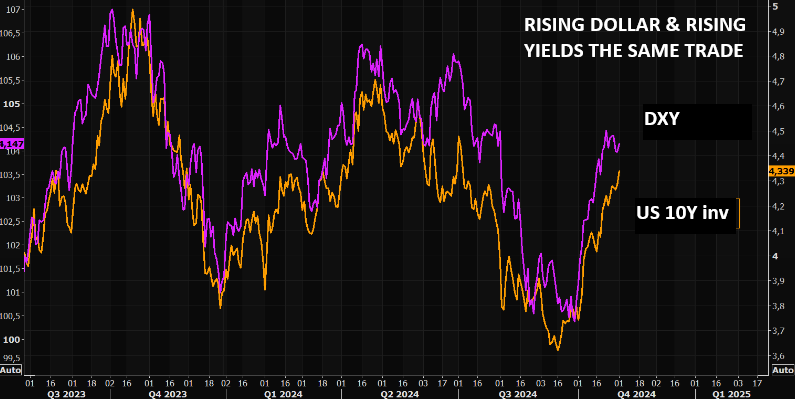
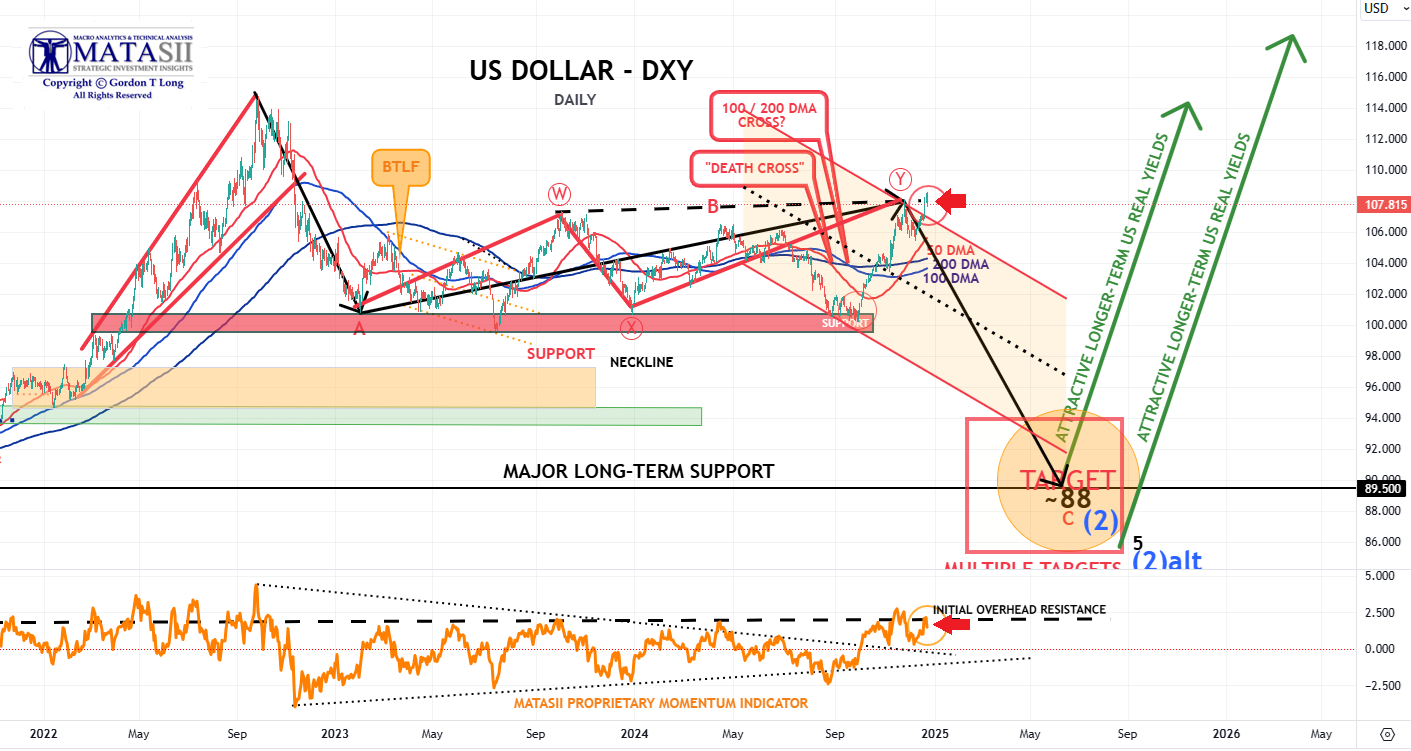
***US DOLLAR - DXY - DAILY***
CHART RIGHT: Moving in Tandem -- Rising Treasury Yields and a Rising Dollar are currently the same trades!
| |
CHART RIGHT: Mighty dollar trades like a cork in water....you press it down, but it pops straight back up again. A close above the huge 107 area and things risk going very dynamic. By now most have learnt to sell the resistance....and we risk a vacuum to the upside, should we take out recent highs.
IMPORTANT - THE US ELECTION HAS POTENTIALLY MADE MAJOR CHANGES IN THE PERCEPTION THE US$ .
THERE IS A STRONG CHANCE THAT THE LOWS BELOW ARE
NO LONGER VALID.
| |
CURRENT DAY'S VIEW:
- The dollar ripped higher, now up 4% since the election to its highest since Sept 2022 (and above the COVID crisis highs.
- The dollar closed Friday at 107.815 down -0.61 (-0.56%).
- The dollar found overhead resistance at the MATASII Momentum Indicator's dashed black trend line marked by the red arrow.
| |
|
YOUR DESKTOP / TABLET / PHONE ANNOTATED CHART
Macro Analytics Chart Above: SUBSCRIBER LINK
| |
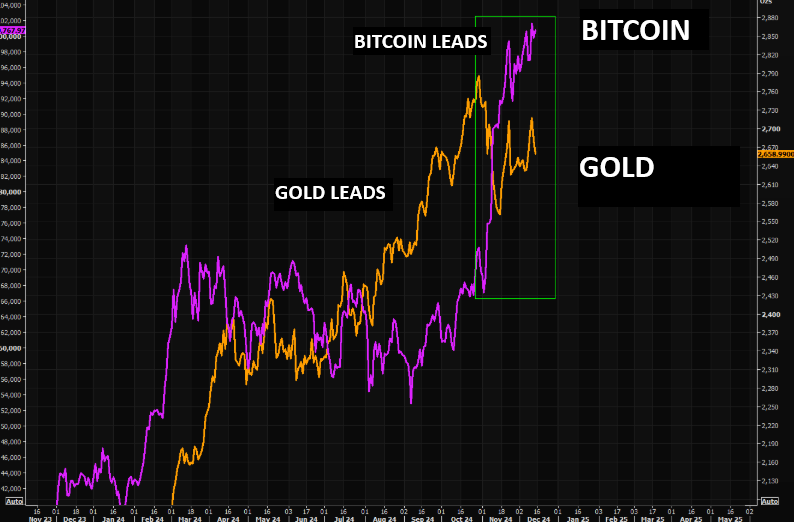
***GOLD***
GOLD v BITCOIN
Digital vs physical gold are living in two different realities post Trump winning the election and the spread is getting even wider. Gold led prior to Nov 6th - then BTC led.
| |
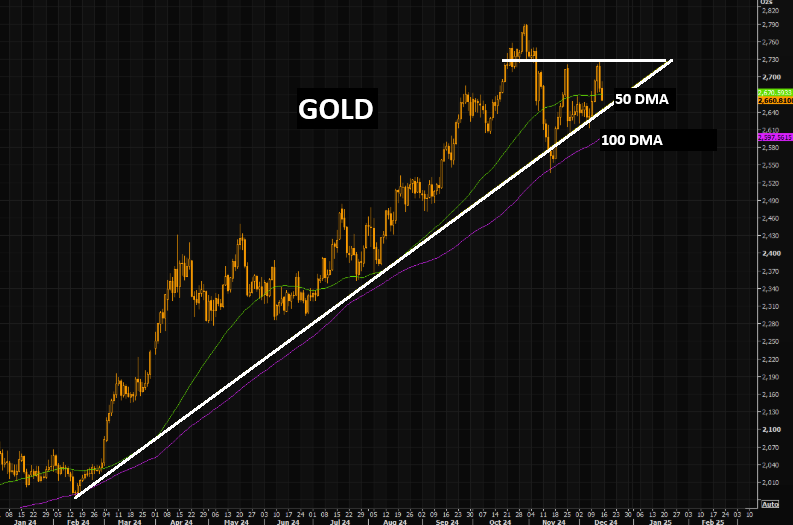
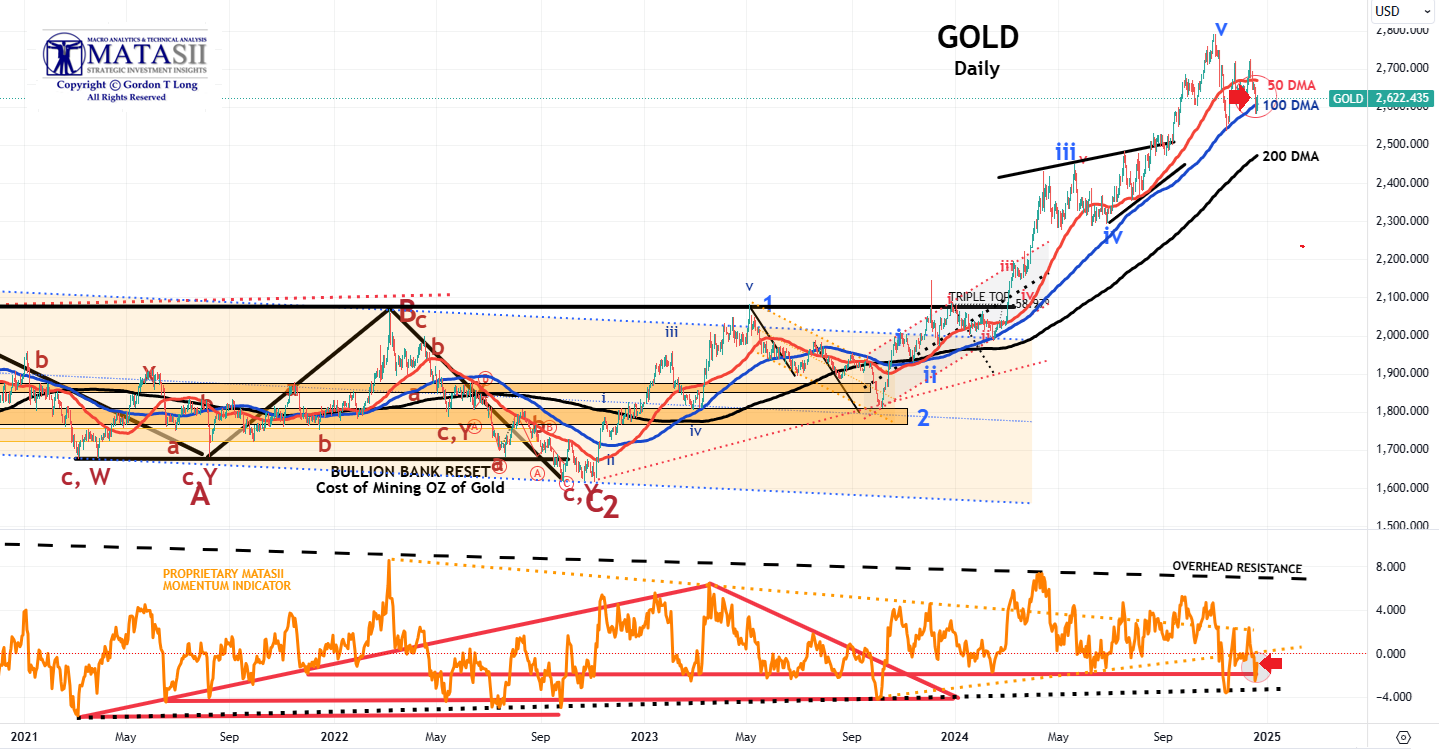
CHART RIGHT:
- Gold - back to the break out?
- Gold's powerful up move has been all reversed.
- Note we are back below the 50 day again, trading close to the big long term trend line.
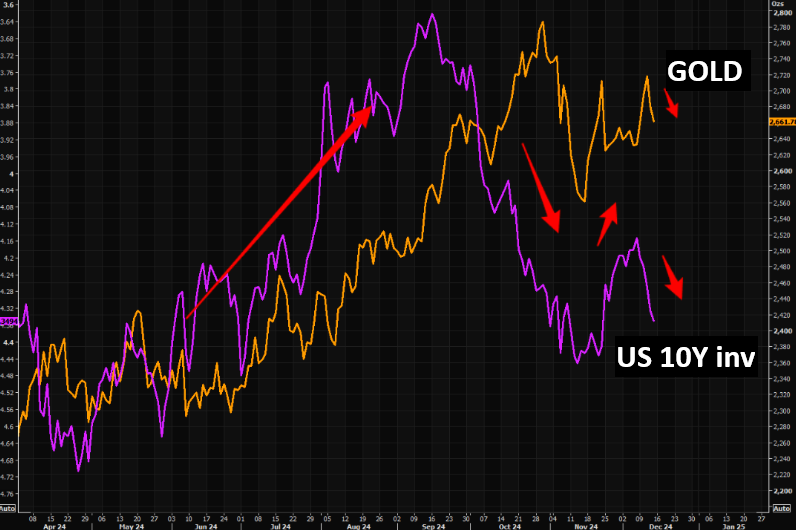
CHART RIGHT BELOW:
- It looks like rates matter after all.
- Rates Rise, Gold Falls.
2024 is (so far) gold's best year since 1979.
| |
|
CHART BELOW:
- Gold was monkey hammered back below its 100DMA.
- Gold closed Friday at 2622 up 28.85 (+1.11%).
-
Gold has recently been supported and further boosted by the PBoC resuming Gold purchases in November after a six-month halt.
- Support was found again at the 100 DMA and the MATASII Momentum Indicator (marked by the red arrow in the lower panel).
| |
|
YOUR DESKTOP / TABLET / PHONE ANNOTATED CHART
Macro Analytics Chart Above: SUBSCRIBER LINK
| |
|
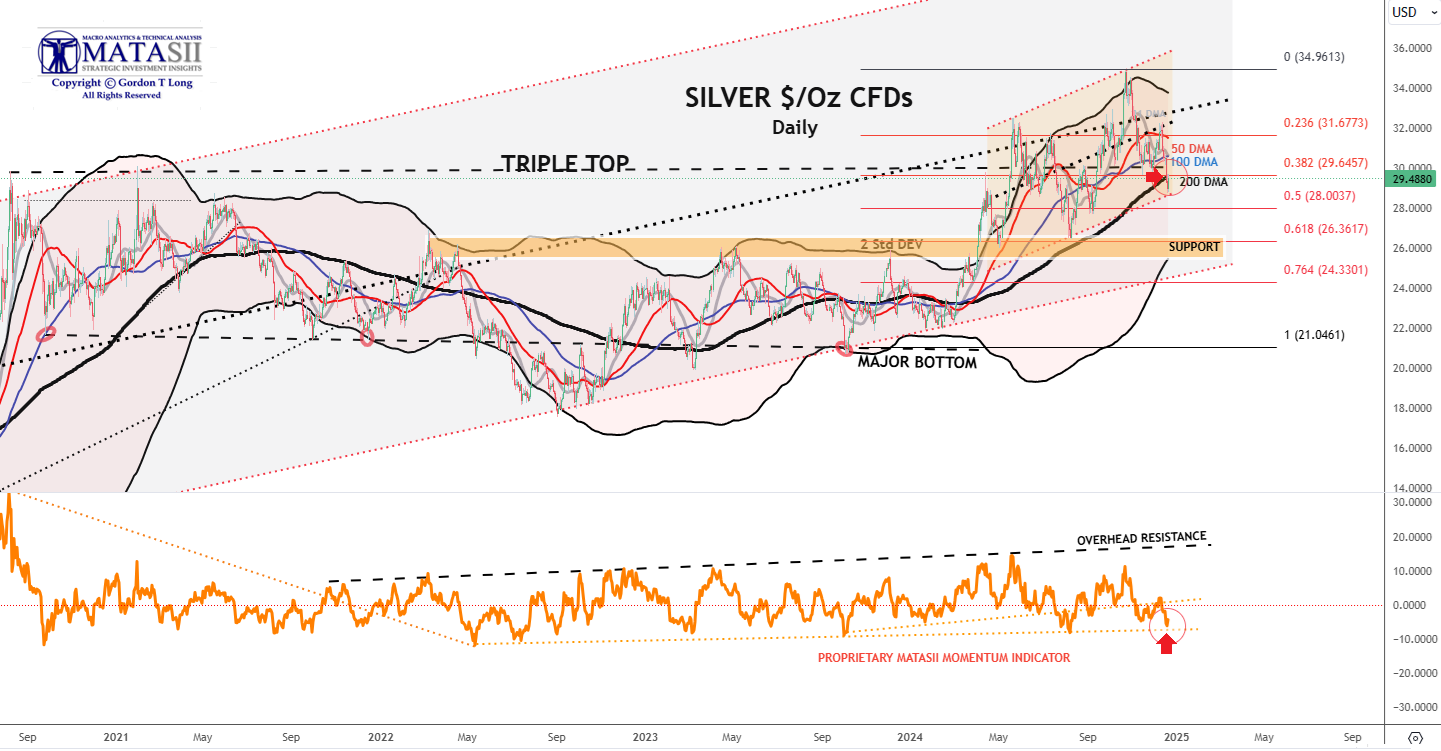
***SILVER***
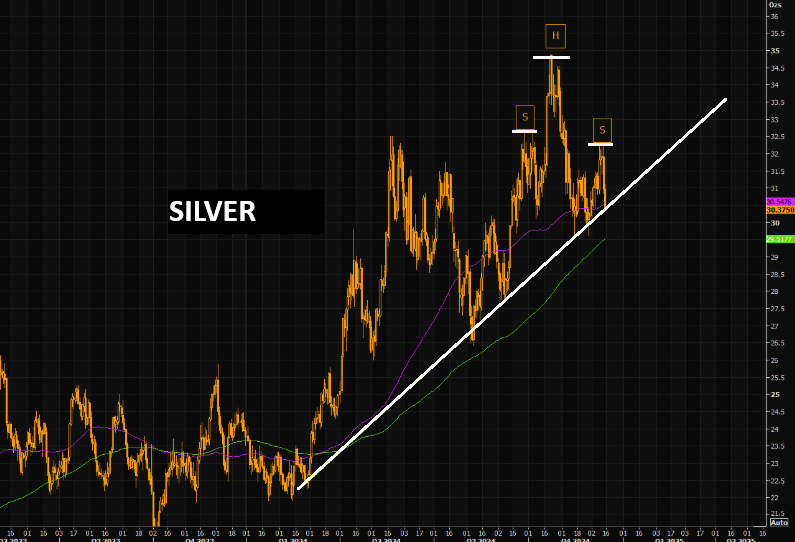
CHART RIGHT:
Silver is down to the longer term trend line and trading just below the 100 day moving average. Watch closely, should the massive head and shoulders formation "kick in".
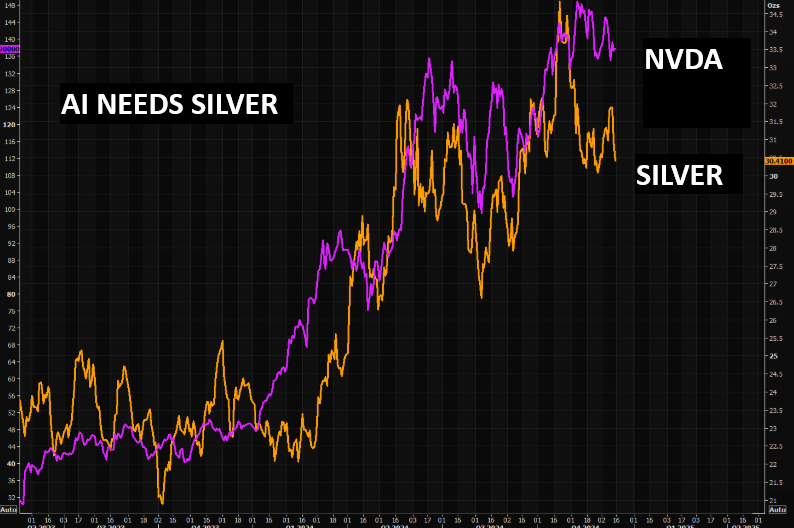
CHART RIGHT BELOW:
AI needs silver for their circuit boards. Silver has been tracking NVDA surprisingly close. Both are now weakening!
| |
CHART BELOW:
- Silver found support at the 200 DMA at $29.488 up 0.479 (+1.65%).
- In the lower panel we see Silver had broken overhead resistance of the MATASII Momentum Indicator (orange dotted trendline) before pulling back to a lower support trend line marked by the red arrow.
| |
|
YOUR DESKTOP / TABLET / PHONE ANNOTATED CHART
Macro Analytics Chart Above: SUBSCRIBER LINK
| |
|
CONTROL PACKAGE
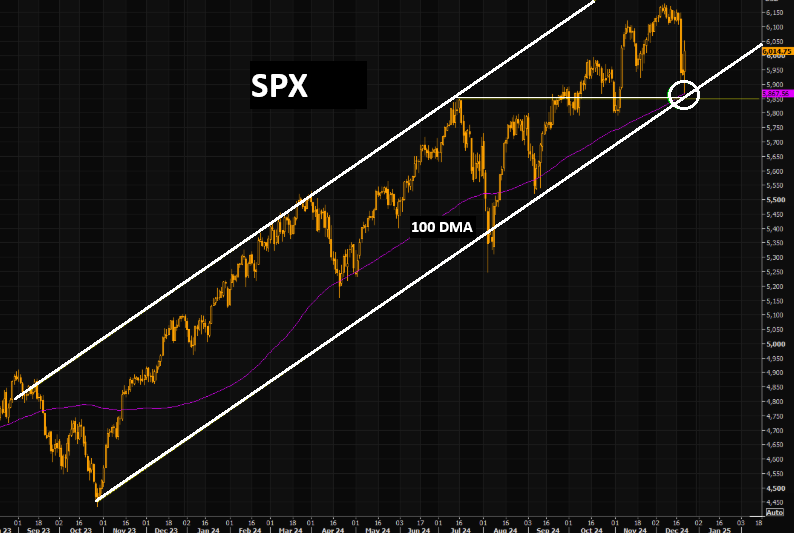
CHART RIGHT: The SPX reversed exactly on the 100 day moving average and the trend channel lows.
There are FIVE charts we have outlined in prior chart packages that we will continue to watch closely as a CURRENT "control set":
- The S&P 500 (CHART LINK)
- The DJIA (CHART LINK)
- The Russell 2000 through the IWM ETF (CHART LINK)
- The MAGNIFICENT SEVEN (CHART ABOVE WITH MATASII CROSS - LINK)
- Nvidia (NVDA) (CHART LINK)
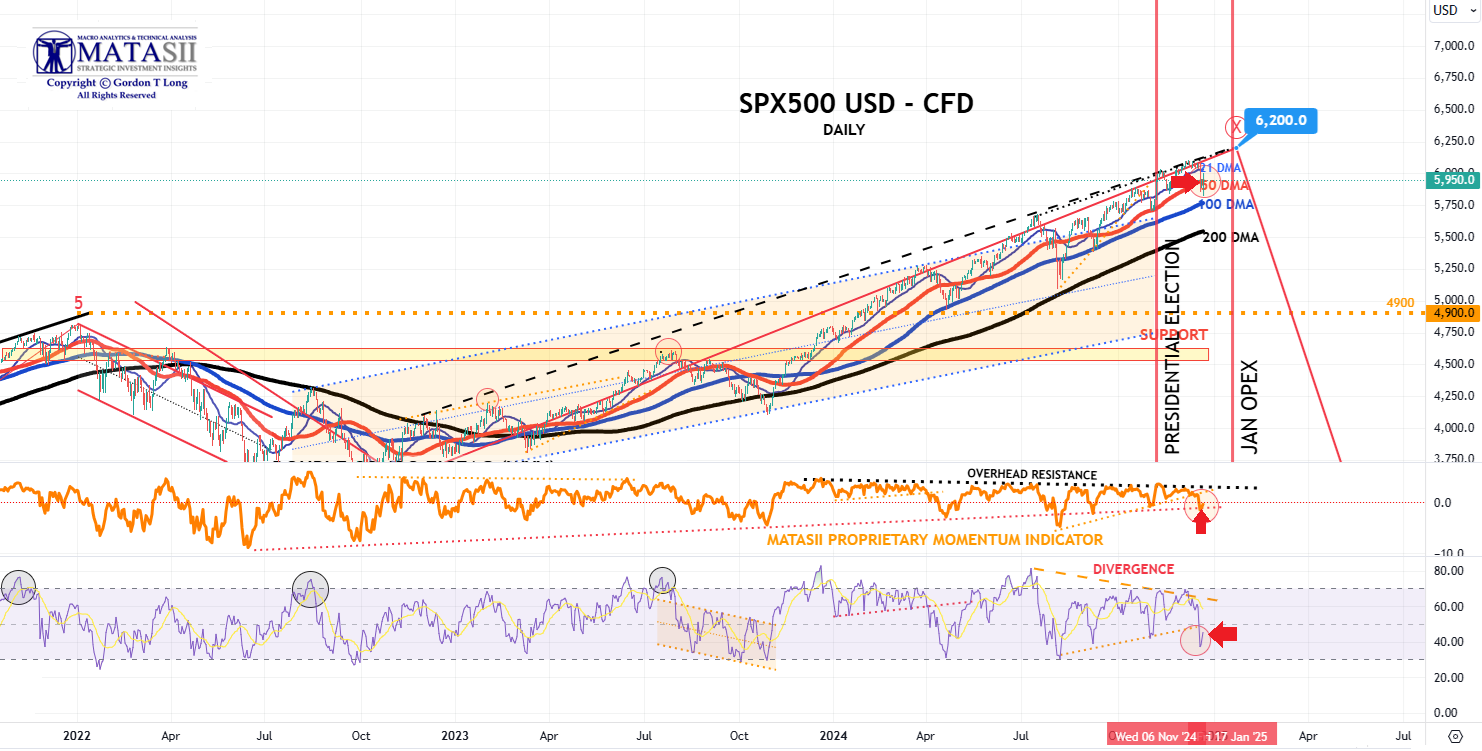
***S&P 500 CFD***
- The S&P 500 cfd closed up Friday at 5950.0 +53.4 (+0.91%).
- Price support was found with the 50 DMA.
- The MATASII Proprietary Momentum Indicator (middle panel) found support at a rising orange dotted trend line marked by the red arrow.
| |
YOUR DESKTOP / TABLET / PHONE ANNOTATED CHART
Macro Analytics Chart Above: SUBSCRIBER LINK
| |
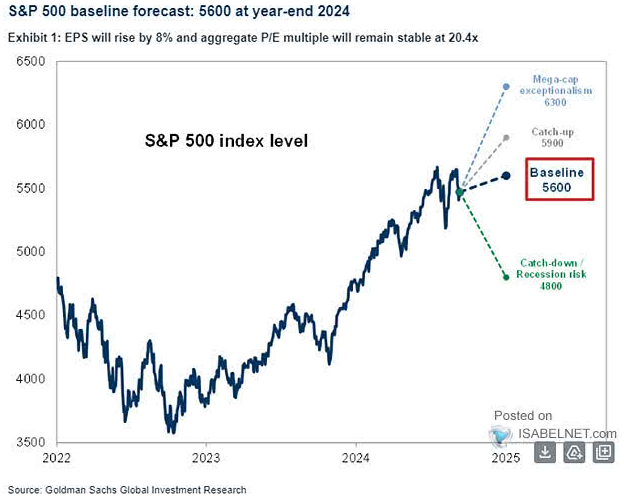
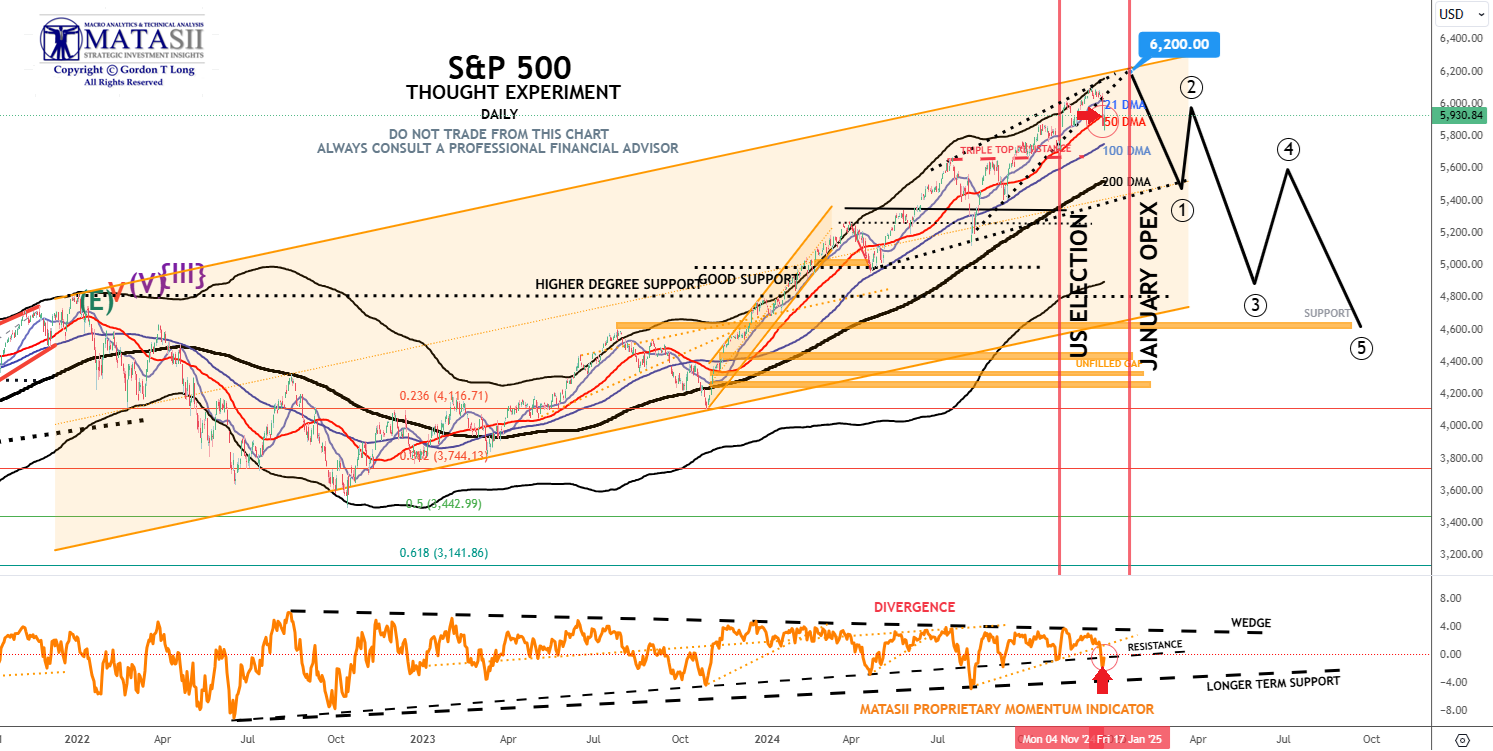
***S&P 500 - Daily Our Thought Experiment***
OUR CURRENT ASSESSMENT IS THAT THE INTERMEDIATE TERM IS LIKELY TO LOOK LIKE THE FOLLOWING:
CHART RIGHT: In its base case scenario, Goldman Sachs projects a year-end 2024 price target of 5,600 for the S&P 500 index, supported by robust earnings growth and a stable price-to-earnings ratio.
NOTE: To reiterate - "the black labeled activity shown below, between now and September, looks like a "Killing Field", where the algos take Day Traders, "Dip Buyers", the "Gamma Guys" and FOMO's all out on stretchers!"
- The S&P 500 cfd closed up Friday at 5950.0 +53.4 (+0.91%).
- Price support was again found with the 50 DMA.
- The MATASII Proprietary Momentum Indicator (middle panel) broke support at a rising black dashed trend line marked by the red arrow.
| |
YOUR DESKTOP / TABLET / PHONE ANNOTATED CHART
Macro Analytics Chart Above: SUBSCRIBER LINK
| STOCK MONITOR: What We Spotted | |
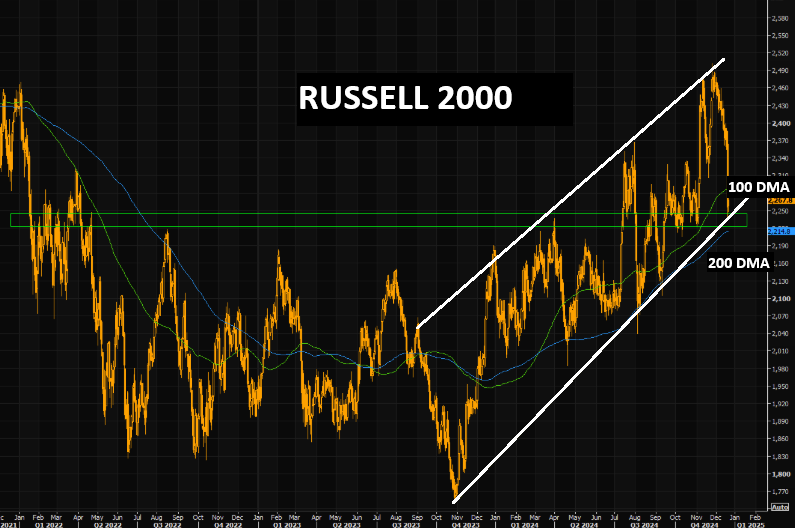
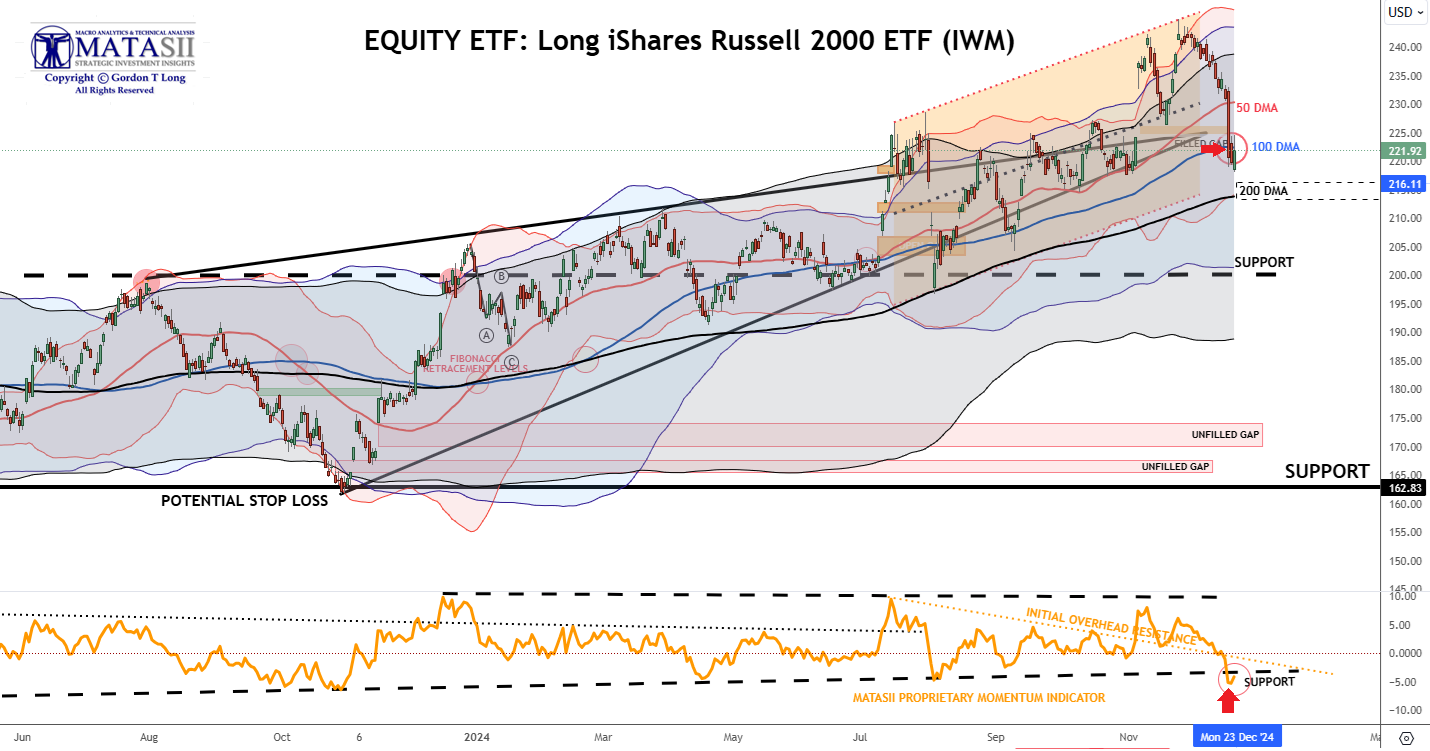
***IWM - LONG iShare Russell 2000 ETF - Daily***
CHART RIGHT: The Russell is trading well below the pre election bull. Note the index took out the 100 day during yesterday's puke. The longer term trend line, the big break out area, as well as the 200 day (slightly lower) all come in around these levels.
Jefferies sees Russell 2000 hitting 2715 by year-end 2025, representing a 13.5% increase.
- The firm thinks small caps will outperform large caps, both in terms of earnings growth and share price performance.
- Three further supportive things:
- 1. High-yield spreads near 2007 levels; balance sheets are stronger today.
- 2. Federal Reserve easing cycle supports smaller companies through lower borrowing costs.
- 3. Increased M&A activity, particularly in sub-$1B companies, expected to accelerate and broaden.
- The IWM - LONG iShare Russell 2000 ETF close Friday at 221.92 up 2.06 (+0.94%).
- The IWM initially has found near term support at the 100 DMA and initially at the Proprietary Momentum Indicator 's (lower panel) major support shown by the black dashed line (which is now acting as overhead resistance).
| |
YOUR DESKTOP / TABLET / PHONE ANNOTATED CHART
Macro Analytics Chart Above: SUBSCRIBER LINK
| |
LOWER BOND YIELDS CORRECTLY SPOT A WEAKER MACRO
CONTROL PACKAGE
There are FIVE charts we have outlined in prior chart packages that we will continue to watch closely as a CURRENT "control set":
- The 10Y TREASURY NOTE YIELD - TNX - HOURLY (CHART LINK)
- The 10Y TREASURY NOTE YIELD - TNX - DAILY (CHART LINK)
- The 10Y TREASURY NOTE YIELD - TNX - WEEKLY (CHART LINK)
- The 30Y TREASURY BOND YIELD - TNX - WEEKLY (CHART LINK)
- REAL RATES (CHART LINK)
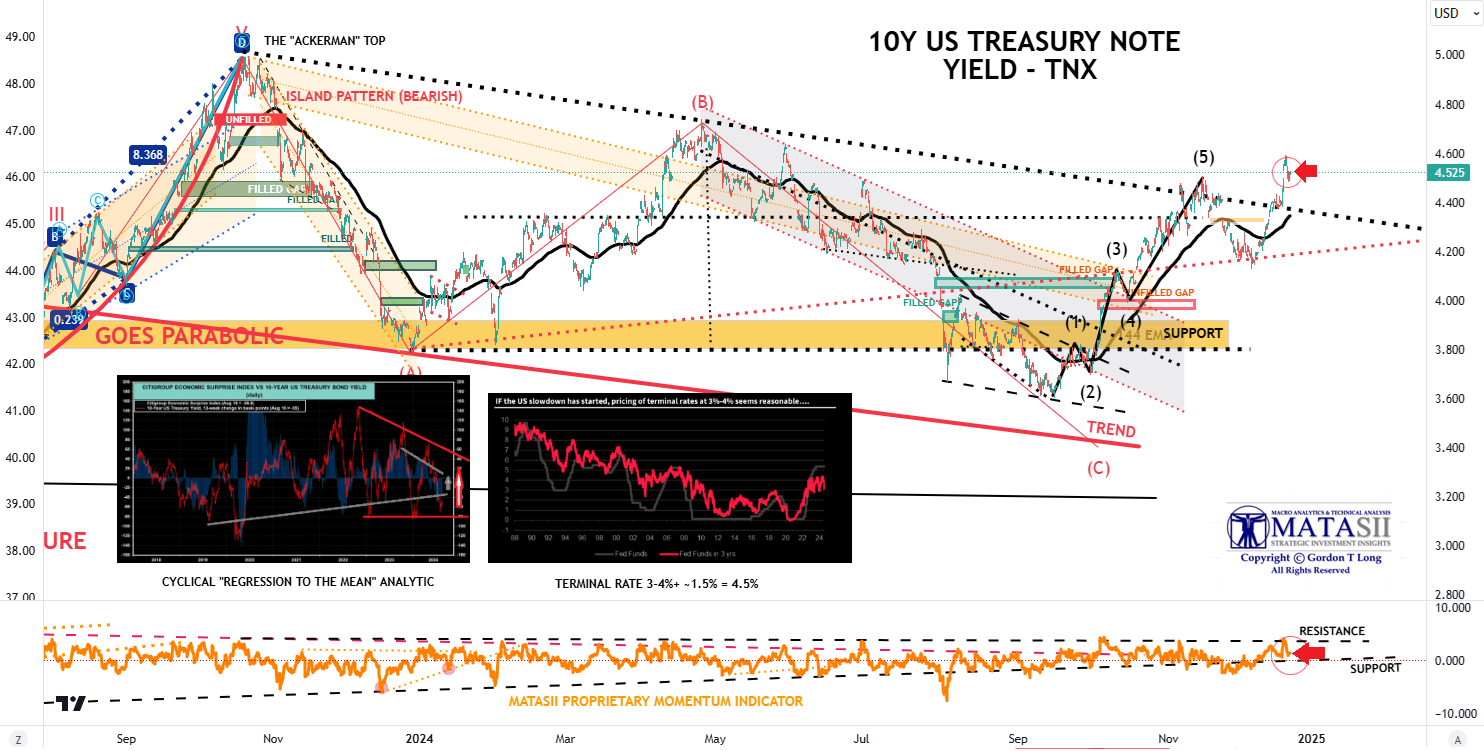
FISHER'S EQUATION = 10Y Yield = 10Y INFLATION BE% + REAL % = 2.395% + 2.13% = 4.525%
| |
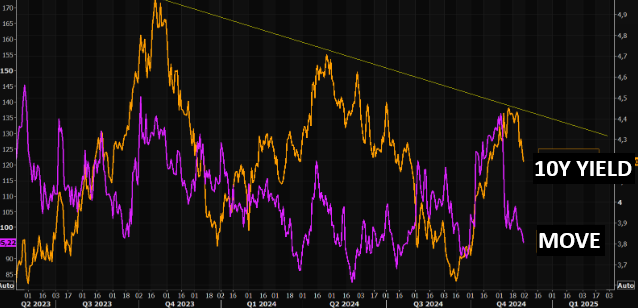
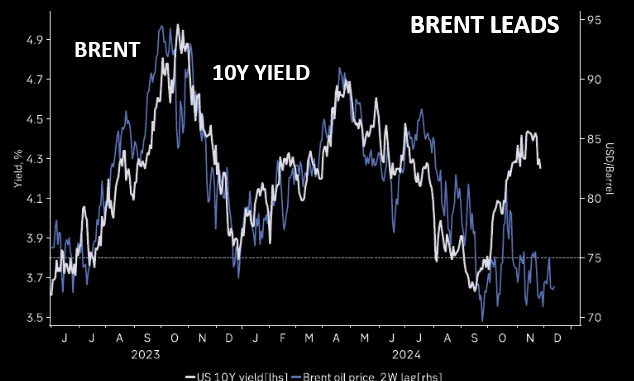
CHART BELOW:
Yields following Brent Crude lower as the MOVE index (Chart right) also moves lower.
| |
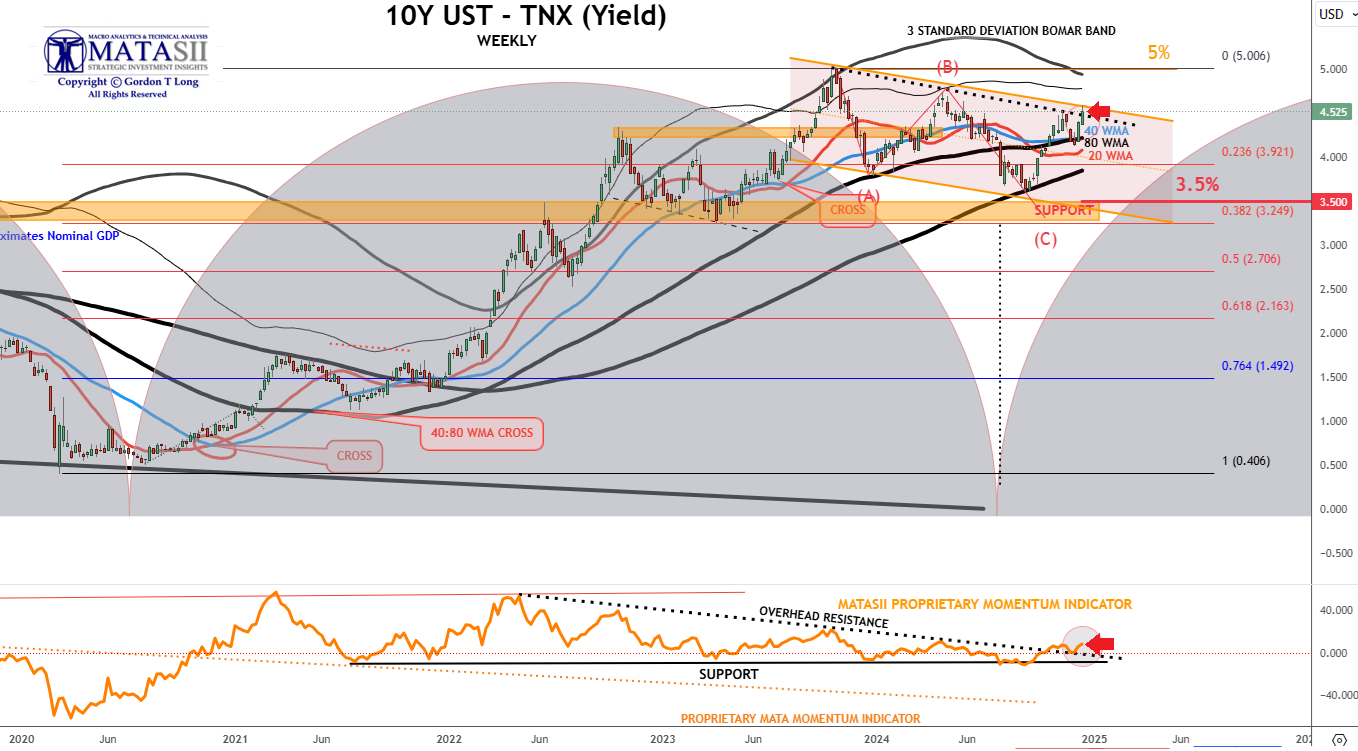
***10Y UST - TNX - WEEKLY***
CURRENT DAY'S VIEW:
- Yields rose this week to close Friday at 4.525% down -0.046 (-1.01) for the day.
- We are now at the upper channel trend line with the MA's potentially about to cross the the upside.
- The Proprietary MATASII Momentum Indicator's (lower pane) overhead resistance levels shown by the dotted black line and highlighted by the red arrow has been broken to the upside.
- We are likely headed higher which should place further pressures on the equity market.
| |
YOUR DESKTOP / TABLET / PHONE ANNOTATED CHART
Macro Analytics Chart Above: SUBSCRIBER LINK
| |
***10Y UST - TNX - HOURLY***
CURRENT DAY'S VIEW:
- A Golden Cross occurred on the Daily chart (Chart Link) with the 50 DMA crossing to the upside the 200 DMA.
- Yields rose this week to close Friday at 4.525% down -0.046 (-1.01) for the day.
- The Proprietary MATASII Momentum Indicator (lower pane) is now showing momentum above its longer term support level (dashed black line) marked by the red arrow.
| |
YOUR DESKTOP / TABLET / PHONE ANNOTATED CHART
Macro Analytics Chart Above: SUBSCRIBER LINK
| |
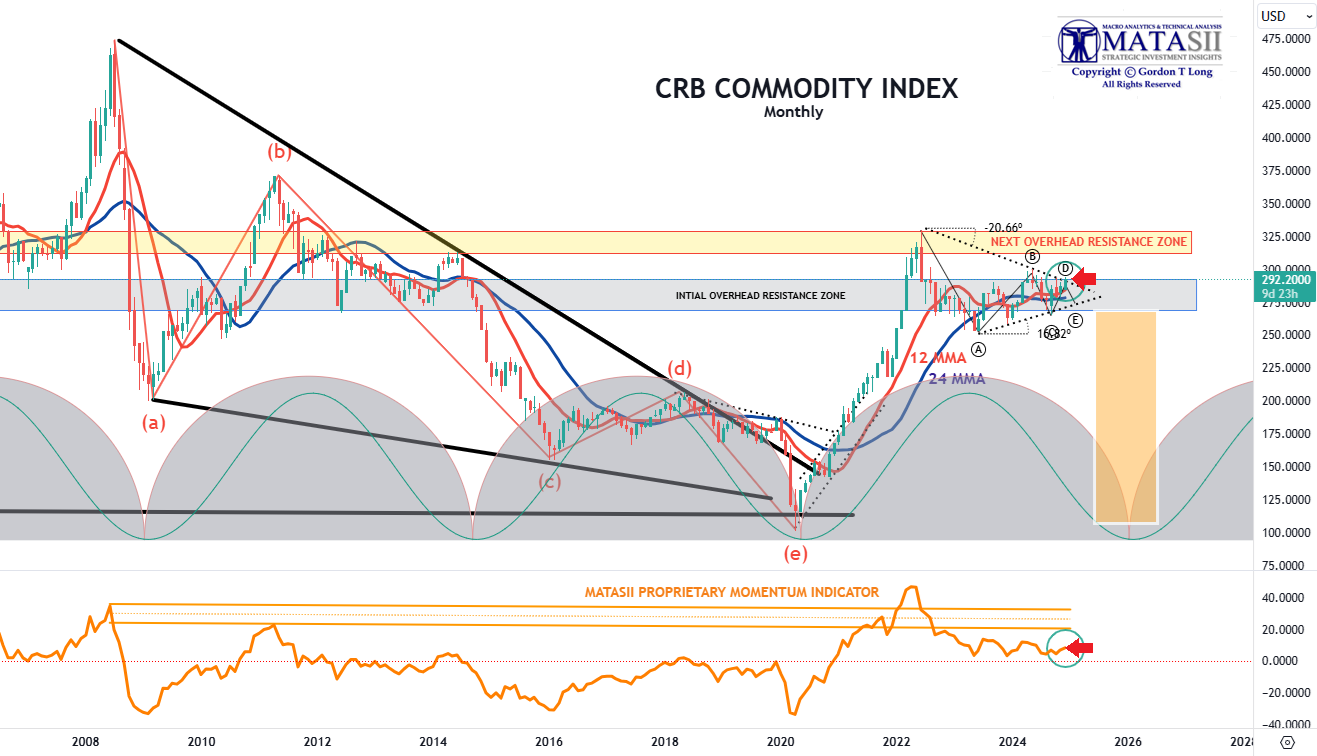
***CRB COMMODITY INDEX - MONTHLY***
- The overall Commodity Indexes, as measured by the CRB Commodity, reflect a Corrective / Consolidation is presently nearing completion.
- However, many of the individual sectors (not shown here) have already completed the Corrective / Consolidation and broken higher over the last 30-60 days.
- Examples:
- Invesco DB Agricultural Fund (DBA)
- VanEck Agribusiness (MOO)
- Food Producers (FT350 Food Producers - NMX45)
- Teucrium Agricultural Fund ETV (TAGS)
- Advisory Shares Restaurant ETF (EATZ)
- Invesco Food & Beverage ETF (PBJ)
- Teucrium Wheat Fund ETV (WEAT)
- Teucrium Corn Fund ETV (CORN)
- Teucrium Soybean Fund ETV (SOTB)
- Teucrium Sugar Fund ETV (CANE)
| |
YOUR DESKTOP / TABLET / PHONE ANNOTATED CHART
Macro Analytics Chart Above: SUBSCRIBER LINK
| |
NOTICE Information on these pages contains forward-looking statements that involve risks and uncertainties. Markets and instruments profiled on this page are for informational purposes only and should not in any way come across as a recommendation to buy or sell in these assets. You should do your own thorough research before making any investment decisions. MATASII.com does not in any way guarantee that this information is free from mistakes, errors, or material misstatements. It also does not guarantee that this information is of a timely nature. Investing in Open Markets involves a great deal of risk, including the loss of all or a portion of your investment, as well as emotional distress. All risks, losses and costs associated with investing, including total loss of principal, are your responsibility.
FAIR USE NOTICE This site contains copyrighted material the use of which has not always been specifically authorized by the copyright owner. We are making such material available in our efforts to advance understanding of environmental, political, human rights, economic, democracy, scientific, and social justice issues, etc. We believe this constitutes a ‘fair use’ of any such copyrighted material as provided for in section 107 of the US Copyright Law. In accordance with Title 17 U.S.C. Section 107, the material on this site is distributed without profit to those who have expressed a prior interest in receiving the included information for research and educational purposes. If you wish to use copyrighted material from this site for purposes of your own that go beyond ‘fair use’, you must obtain permission from the copyright owner.
========
| |
IDENTIFICATION OF HIGH PROBABILITY TARGET ZONES | |
Learn the HPTZ Methodology!
Identify areas of High Probability for market movements
Set up your charts with accurate Market Road Maps
Available at Amazon.com
| |
The Most Insightful Macro Analytics On The Web | | | | |