Following President Biden's inspiration, President Trump has started his presidency by signing dozens of executive orders to implement his agenda. His recent plan to pause all federal grant spending may affect $3 Trillion of federal government outlays. Perhaps the next recession will crystallize around a slowdown in government spending. | |
Market Update - February 2025 | |
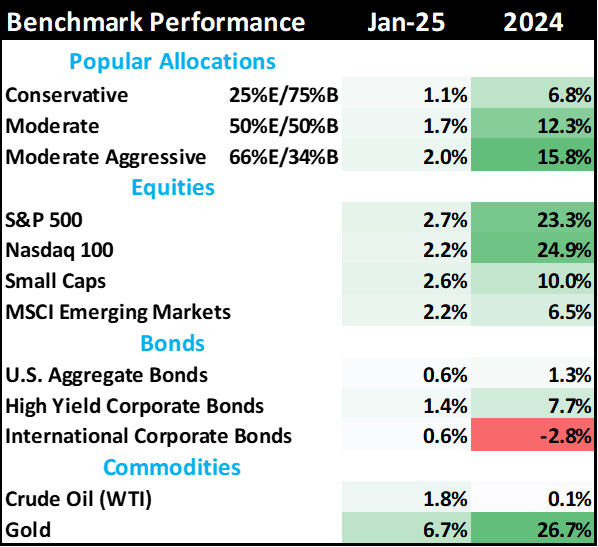
- Equities rose in January as President Trump rolled out his economic agenda focused on imposing stiff import tariffs, cutting taxes and trimming spending.
- Financials, Health Care, Basic Materials and Industrials did quite well in this environment. Technology, Consumer Staples and Real Estate lagged significantly. The behavior of these sectors doesn't provide us any insight into where we are in the economic cycle.
- Bond markets did not move much during January. There is a tug of war between the bullish forces of falling inflation and budget cuts offset by President Trump's plan to push deregulation, stimulate growth and encourage economic growth. Remember, bond markets want a slowly growing economy with minimal inflation.
- The stock and bond markets are waiting for President Trump's tax and spending plan to roll out. So far, the only significant economic policies rolled out are those regarding tariffs.
| |
Table 1: Market performance estimates as of 1/31/2025 (LIMW) | |
President Trump's new policies | |
|
The stock and bond markets are watching President Trump closely. Equity investors want to see taxes cut and growth stimulus of one sort or another. Bond investors want to see policies that curtail inflation and growth.
The new president has provided both groups with policies that are a bit of a conundrum:
The equity conundrum:
- Promises to cut taxes or at least maintain the 2017 tax cuts. (GOOD - this helps maintain profit margins)
- Steps to increase tariffs to encourage local business (BAD - most large companies import a lot of product from overseas, so this hurts margins)
- Cut government spending that does not follow the law (BAD - government stimulus spending on immigrants and green energy have propped up economic growth and employment)
The bond conundrum
- Cut taxes and provide pro-growth deregulation (BAD - this will prop up inflation)
- Cut spending that doesn't follow the law (GOOD - government spending has been a big support for economic growth and inflation)
- Impose tariffs that raise costs and inflation (BAD - rising inflation is bad for bonds)
How these policies are enforced and implemented will dramatically affect economic growth in 2025 and beyond. This will be in addition to current Fed policies to slow down economic growth.
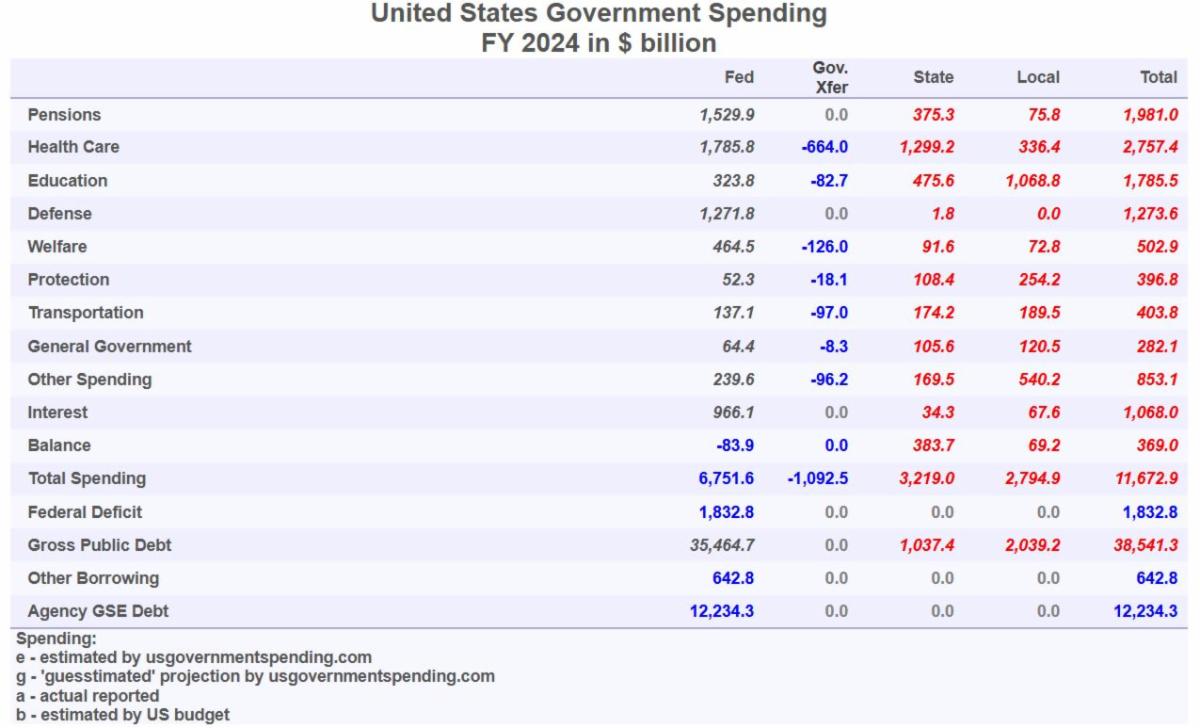
On top of that is the enormous size of the budget. Is there any stomach to significantly cut the spending? Historically, spending rarely goes down.
Table 2: Where the 2024 Federal budget was spent in 2024 (usgovernmentspending.com)
| |
The housing market indicates difficult times are ahead | |
|
Housing is considered a key cyclical sector and a leading indicator for the broad economy. Despite its small size relative to other parts of the economy, it is very sensitive to interest rates and past bank lending behavior.
If we avoid recession this year, it will be one of the few times the housing industry has experienced a downtown WITHOUT the broad economy following suit.
Here are a few interesting charts that show how things are going.
| |
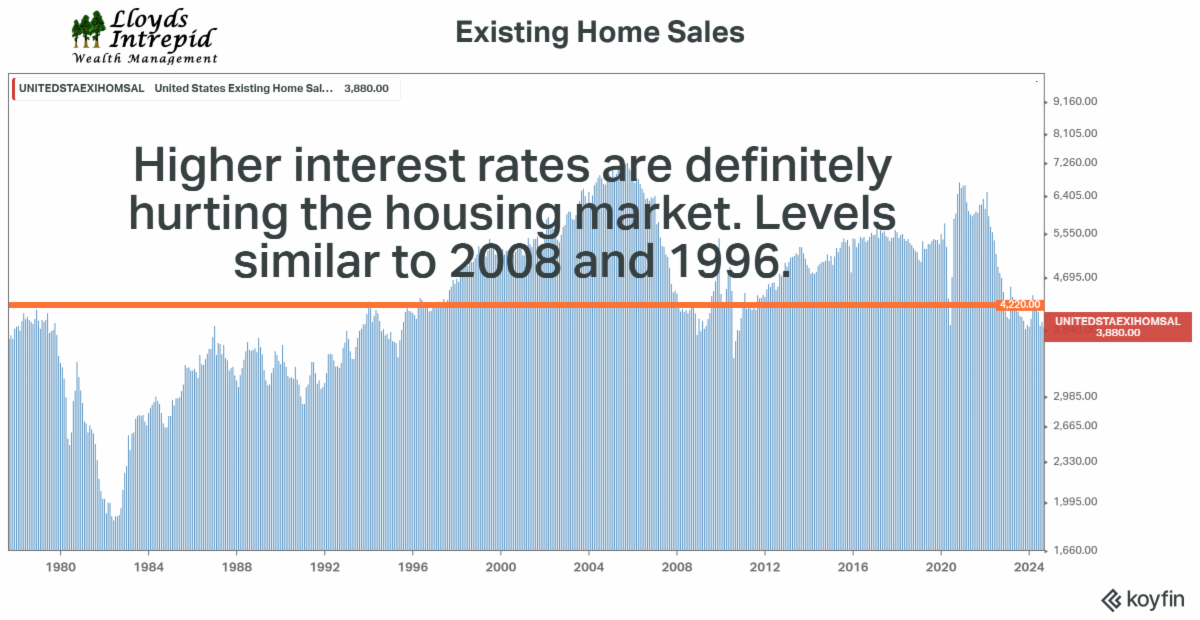
Figure 1: Existing home sales 1978 - 2025 (LIWM) | |
|
High mortgage rates are an impediment to housing sales. People can't move because they would be giving up a low-interest rate mortgage and taking on a high interest rate mortgage. So, they stay put.
Unfortunately for the rest of the economy, each house transaction generates tons of fees and capital expenditures as houses are inspected, repaired or upgraded. That activity is slowing significantly. Lowes and Home Depot talked about this all through 2024.
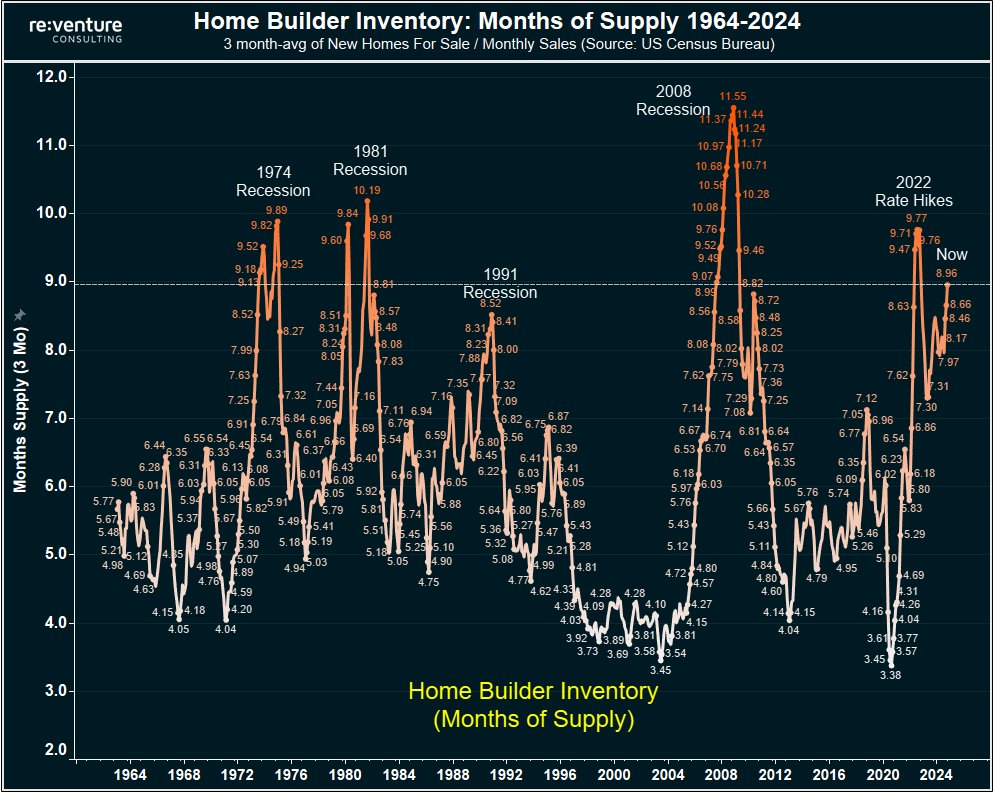
Figure 2: Home builder inventory (Re:venture)
| |
|
Home builder inventories are getting really, really high. This implies less building and spending until either 1) mortgage rates fall, stimulating demand, 2) prices fall to clear inventory, or 3) home builders start defaulting on their loans.
So far, home builders have chosen to subsidize mortgages instead of cutting prices to move their inventory.
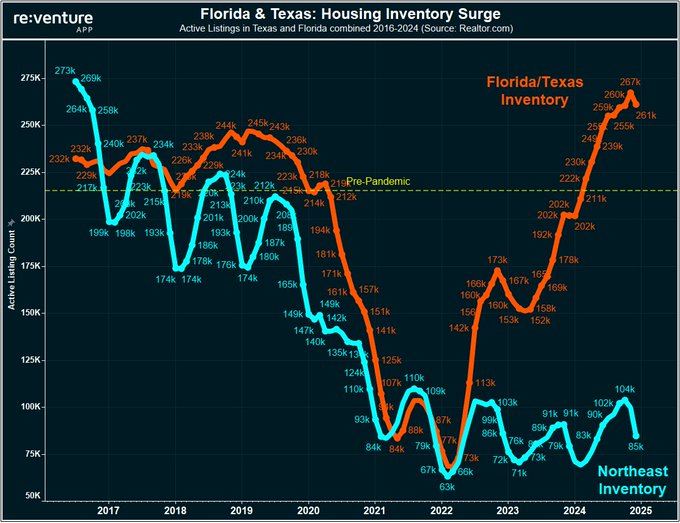
Figure 3: Regional inventory surging in Texas and Florida (Re:venture)
| |
|
It is easy to see where the home builders have focused their energy: Texas and Florida. Despite a good economy, migration from the coasts and major companies relocating to both of these states, housing inventory is surging in these regions.
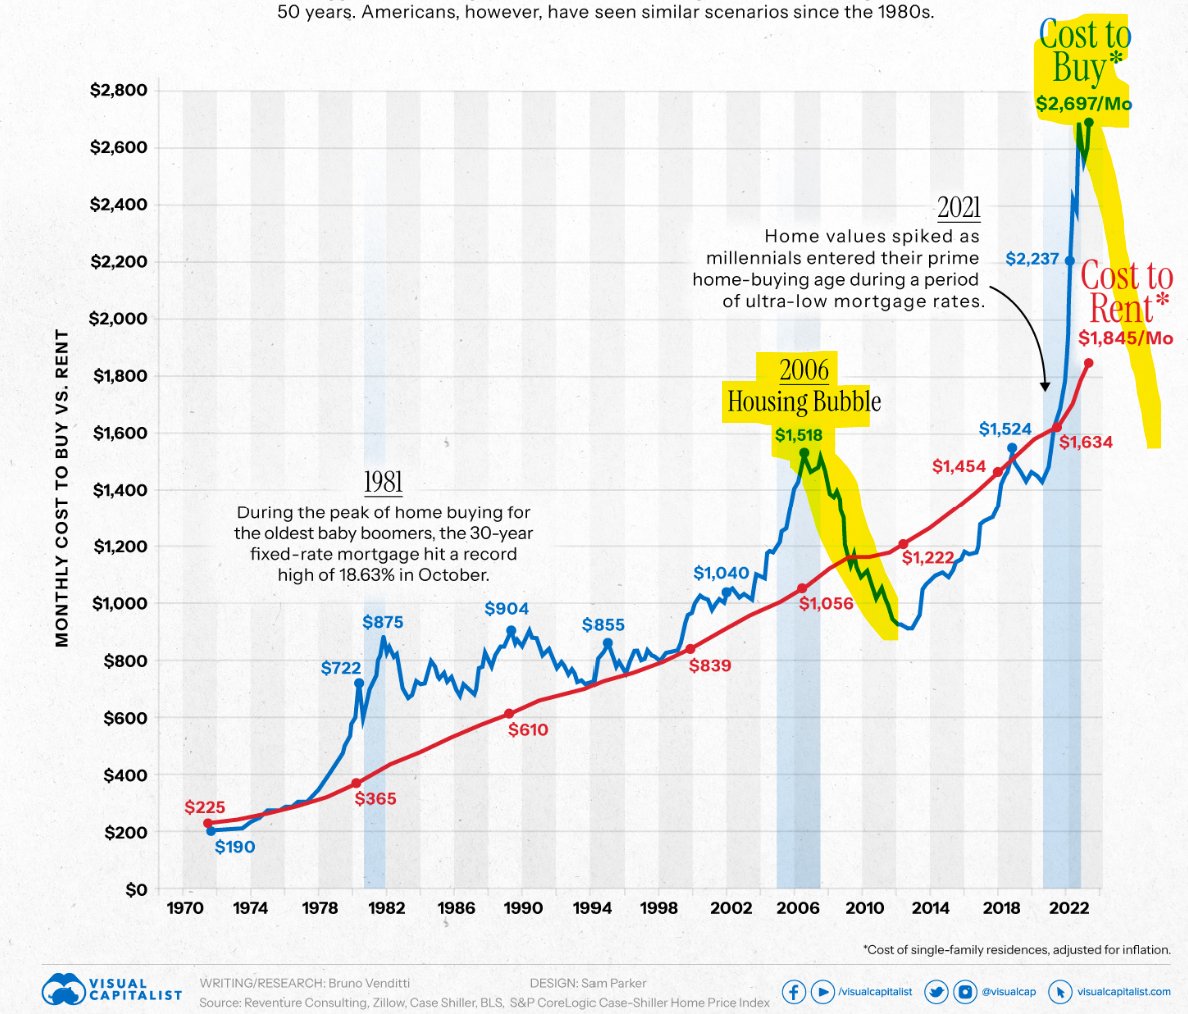
Figure 4: Monthly cost to Buy versus Rent (Visual Capitalist)
| |
Finally, the combination of high home prices and high mortgage rates has dramatically increased the cost of ownership compared to renting. This discouraged family formation and birth rates which in imply poor economic demand for consumer goods over the next 10-20 years. For those of you who have raised children, you know that providing for a child generates a lot of needed expenditures on food, health care, clothing education and shelter. No children, no spending. | |
Interest rates, Fed policy, and our abnormal economic cycle | |
|
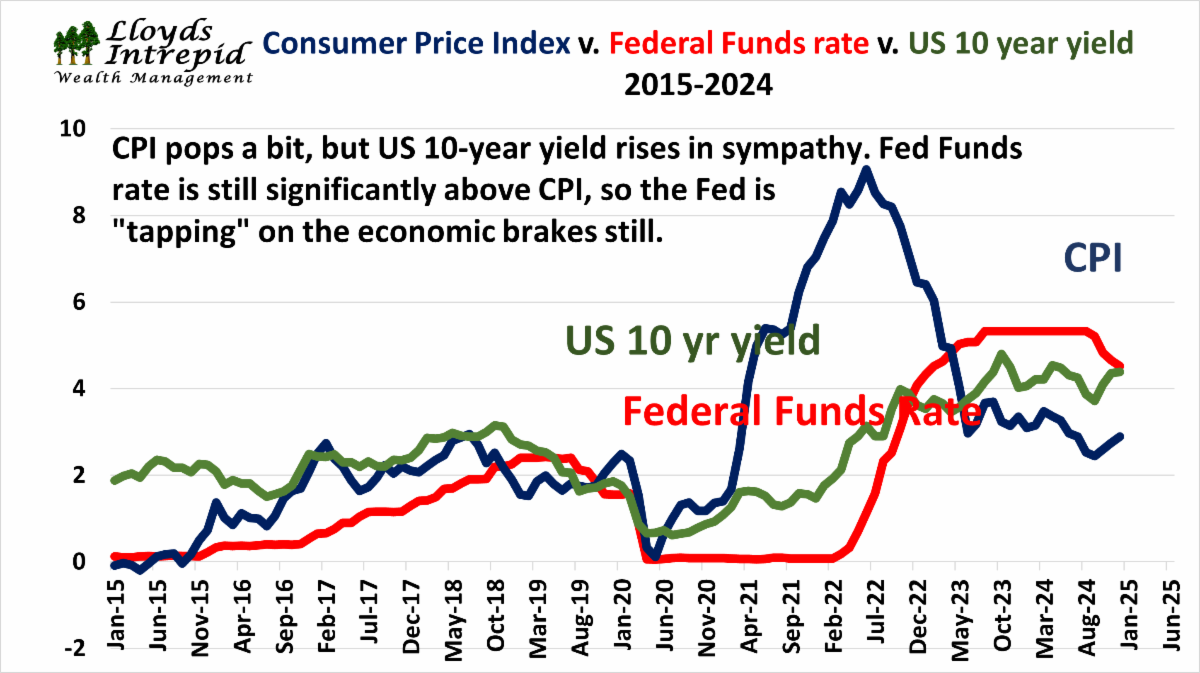
The Fed must be very frustrated. Headline inflation has fallen from 9.0% to 2.8% with the Federal Funds rate of 4.25% holding significantly higher than CPI (consumer price inflation). In the pre-pandemic world, this Fed policy would be considered contractionary and geared toward slowing economic growth.
However, despite the threat of higher-for-longer interest rates and contraction of the Fed's balance sheet, the equity market has risen significantly. Other forces than the Federal Reserve must be at work driving markets.
Figure 5: Consumer Price Index, Federal Funds Rate, and 10-year Treasury yields (LIWM)
| |
|
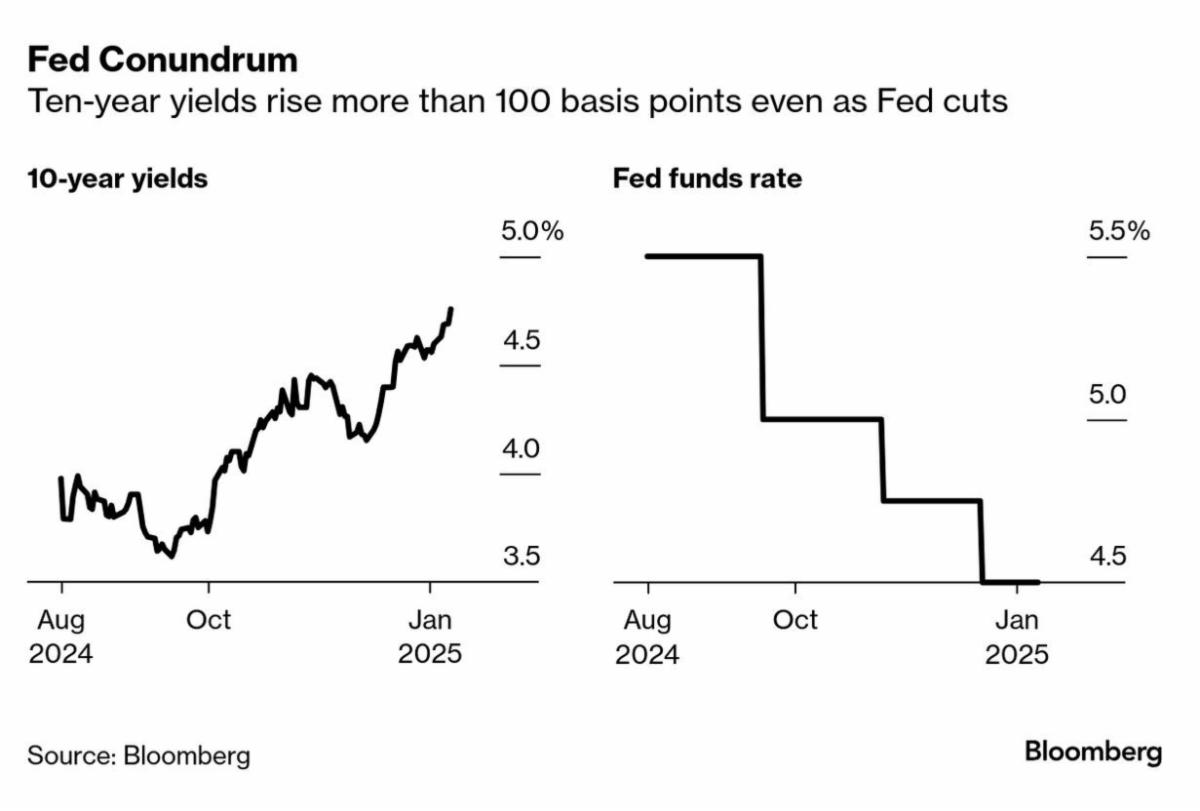
The bond market sees things differently. It is afraid of inflation caused by the Fed cutting rates 1.00% and the Federal government spending like a drunken sailor on shore leave. This is unfair to drunken sailors, because most sailors can't borrow $2 Trillion per year to support their spending. Congress, however, does have this ability and they are using it.
The result is that as the Fed cut rates, the bond market allowed long term rates to rise. For mortgage borrowers and businesses, the rate cuts didn't help at all. Financial conditions for borrowers are worse than in 2024.
This is why housing activity has fallen and inventory is rising.
Figure 6: 10-year Treasury yield rises while Fed funds rate falls (Bloomberg)
| |
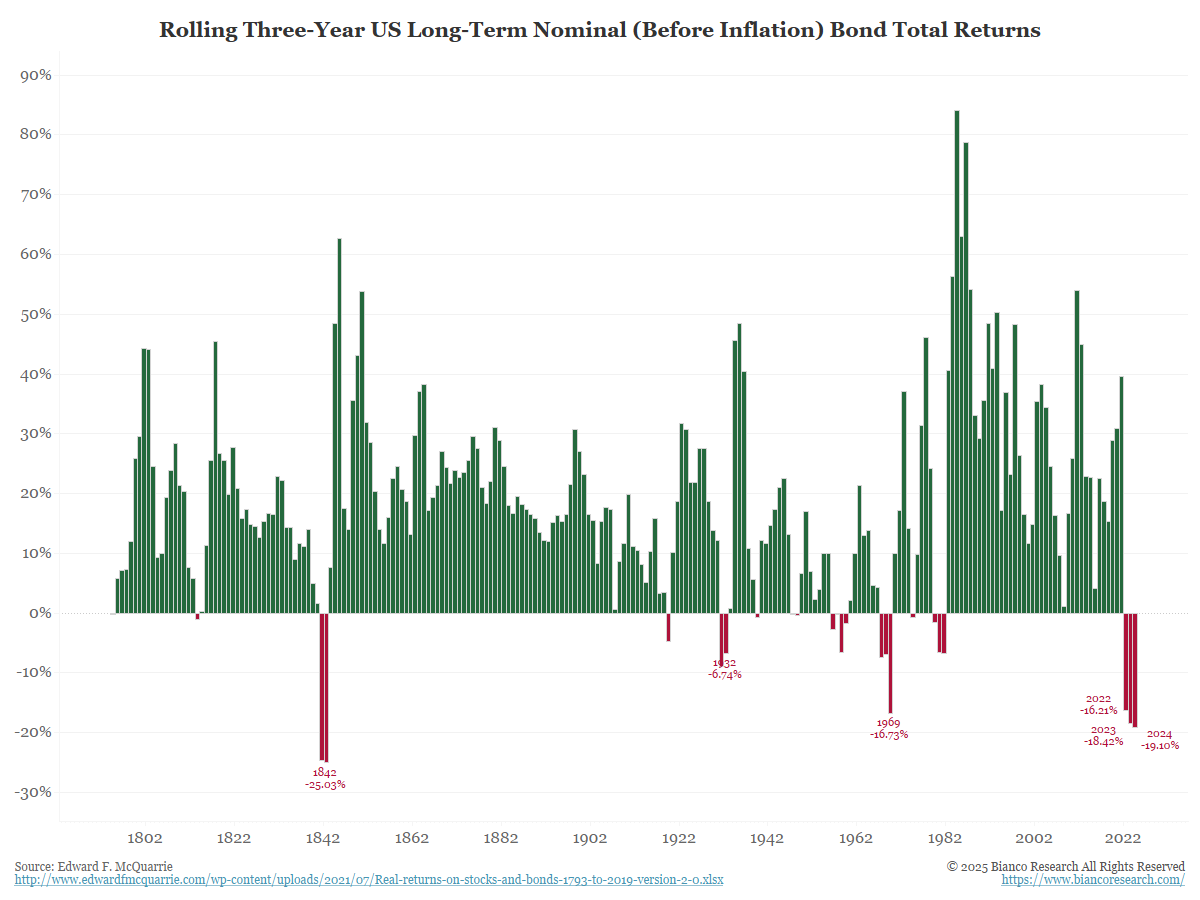
Figure 7: Rolling 3-year US Long Term Bond Returns (Bianco Research) | |
|
For contrarians out there, the current bond market, ravaged by inflation and growth concerns, has put up the WORST string of returns since the founding of the country. Worse than the 1970s, the 1930s, and the 1840s. If there is an asset class more hated in today's markets, somebody please point it out to me. (Okay, Russia stocks did go to zero here in 2022, but except for those).
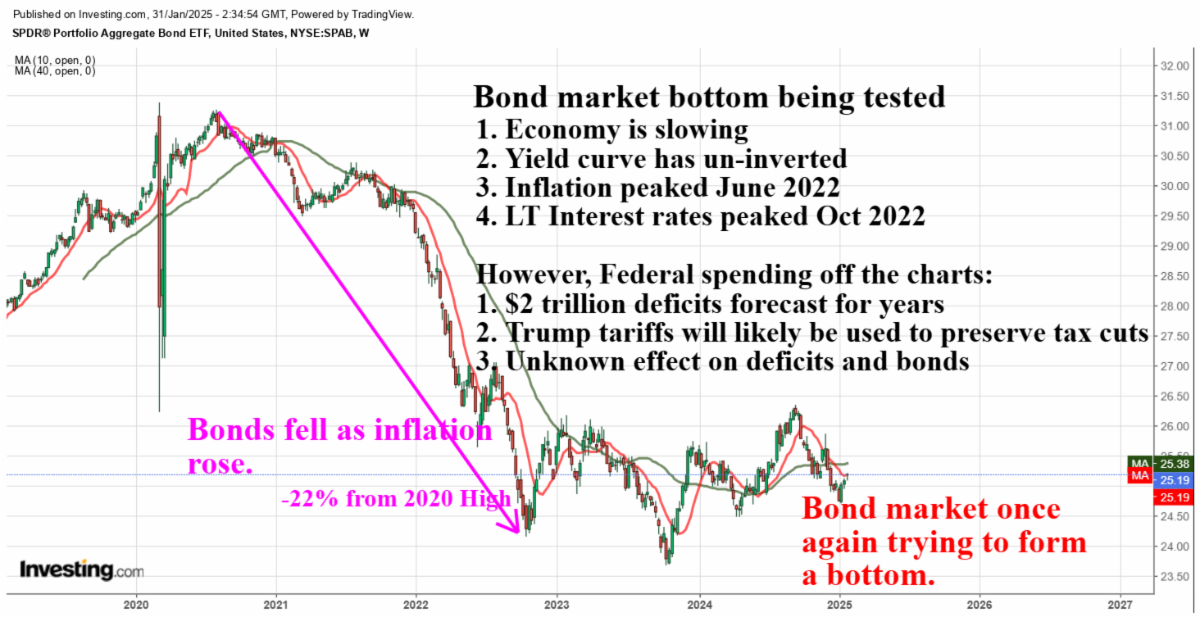
Figure 8: Bond market performance 2019-2025 (LIWM)
| |
|
Bond prices fell slightly in 2024 and are once again trying to put in a bottom. Potentially, the lower inflation numbers and slowing economic growth form a good fundamental backdrop for staying invested in bonds for now.
If we go through an economic slowdown and after the Fed cuts interest rates, we expect the inflation cycle to restart again. However, that is in the future and for now, bonds are an attractive investment with current yields 4.5-5.0% and low risk compared to stocks and commodities.
| |
If we are in a bubble, there will be signs | |
|
There are still a few analysts willing to call this market a bubble. Jeremy Grantham is one I've quoted several times in my monthly notes. Most use a handful of tools to point out when a stock market is over-extended or suffering from delusions.
Here are a few popular tools used by investing legends to identify bubbles:
- Deviations from long-term trends (Jeremy Grantham)
- Valuations (Warren Buffet)
- Speculative investment proliferation in the market
It is this last category that is interesting. In the late 1920's, stock trading became a national past-time. Many people owned stocks and were able to easily borrow money from the broker to trade. During this period, you could own your stock portfolio with only 10% margin (ie 10% "money down"). Today the SEC requires 50% margin for traders to control speculation. It was called the Roaring Twenties for a reason. When it was all unwound in 1930, many investors lost a lot of money.
Fast forward to 1999, another euphoric market. Small tech companies came public left and right. Some were real businesses with revenues and cash flow; many were not. it was called a Tech Bubble for a reason. Famous names like Amazon, Microsoft and Cisco survived, but others like Global Crossing and Exodus went bankrupt. Investors lost a lot of money.
Today, we see extraordinarily high valuations in stocks such as Nvidia, Apple, and Microsoft. But the most interesting speculative excesses are in the world of crypto currency.
Many of you have heard of Bitcoin and perhaps dabbled in this space. It is an interesting asset class with some perculiar features:
- Light regulation
- A lot of fraud
- Tremendous volatility
- Young aggressive investors
We have discussed including Bitcoin in our portfolios, but it is the custody and fraud issues that give us pause. Additionally, the crypto currencies are pitched as an alternative to the US Dollar or any other currency, yet experience tremendous volatility in price.
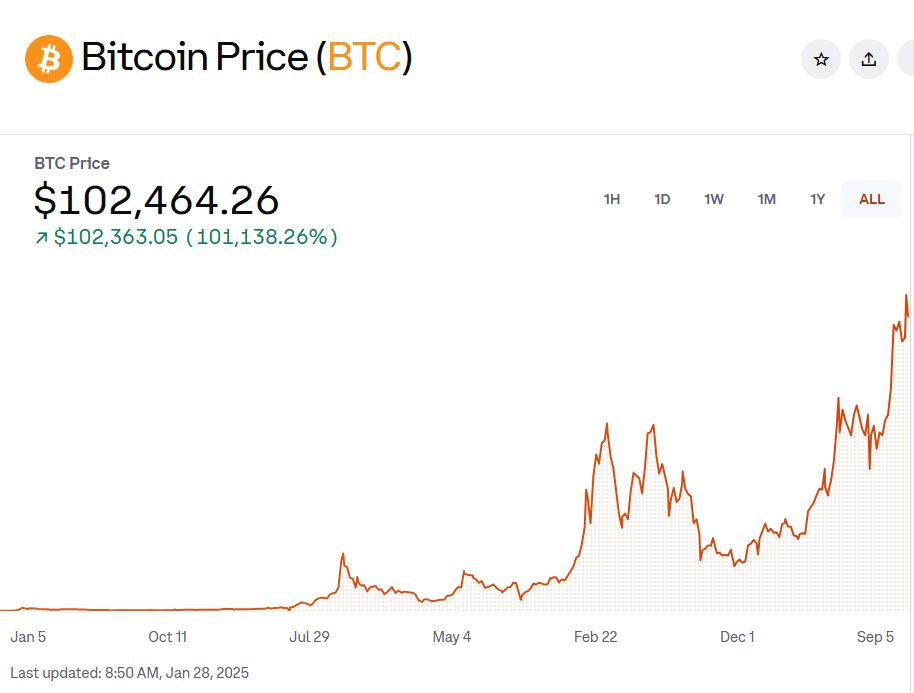
Figure 9: Bitcoin price chart (Coinbase)
| |
|
The main problem with these "currencies" is that they do not exhibit the classic signs of a currency:
- Stable value
- Widespread acceptance and use in the economy
- Low cost to exchange or trade
You can't easily use Bitcoin to shop, pay bills or pay taxes. Plus, there is a large commission to get in and out of these investments. As long as investors in Bitcoin chase price performance, it is unlikely to become the stable currency they want it to be.
Another problem with the non-Bitcoin crypto currencies is that there is infinite supply. With Bitcoin we are promised a cap on the total units that can be created, thus theoretically creating a stable base of value. However, for many other crypto currencies, there is no hard ceiling. The owner or creator can create many, many units that dilute the early investors.
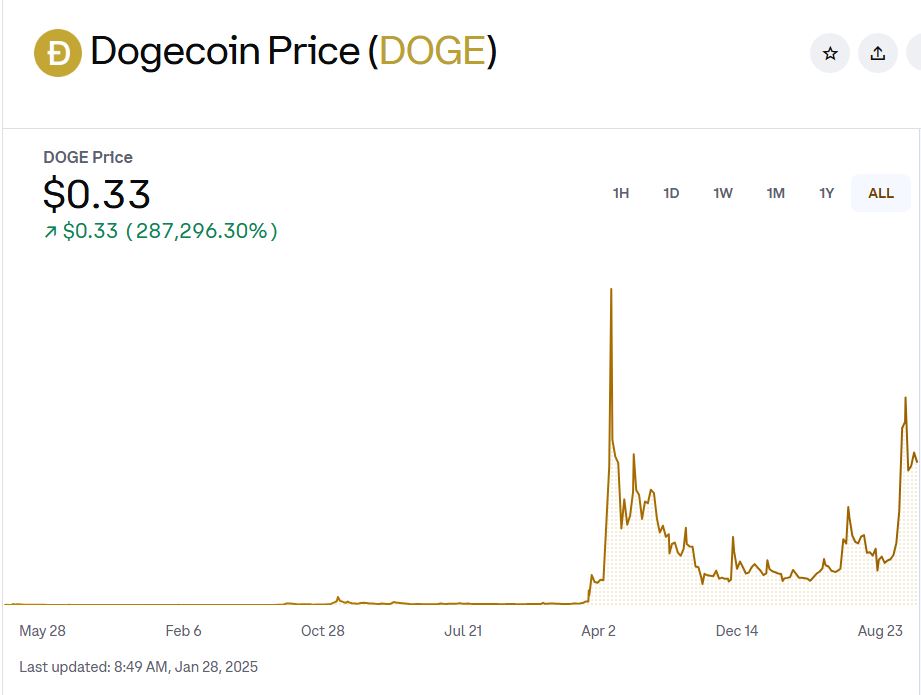
Here is an example of a crypto currency that was originally created as a joke by Elon Musk. Today, that joke has an aggregate value of $48 billion dollars, larger than many banks.
Figure 10: Dogecoin price chart (Coinbase)
| |
|
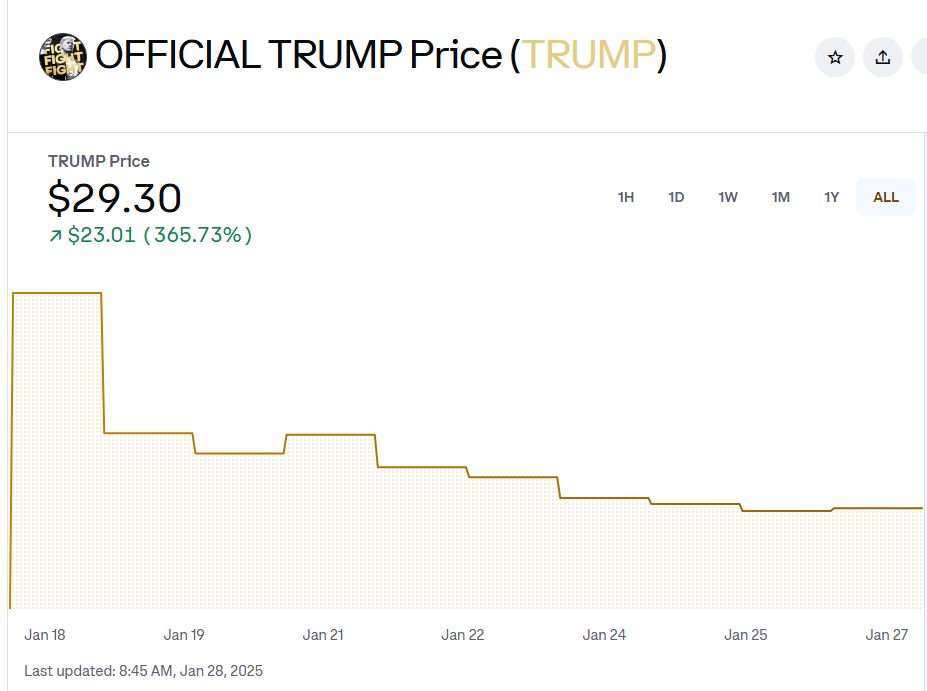
Additionally, new crypto coins are easily created and eagerly bought by speculators. Our new president recently rolled out a coin called the "Trump" and has made himself several billion dollars of value (assuming he is the 80% stakeholder in the coin). Today, the total Trump coin value is ~$5 billion (shares times price). Is it proper for the president of the United States to do this? Just asking.
Figure 11: Trump crypto coin price chart (Coinbase)
| |
|
Even worse, somebody thought it would be funny to create a "Fart" coin in October 2024. This ridiculous asset is worth $932 million. $932 million! For a joke!
It is difficult to see the long-term value of these investment products. However, they are a symptom of rampant speculation by investors and desperation by young people who can't wait for a stock or bond investment to grow over time to hit their investment goals. They are also evidence of how much excess cash our reckless Federal Reserve has pumped into the financial system.
As with stocks in the 1920s and 1990s, housing in the 2000s, today's sign of rampant speculation is the crypto currency space. If you are investing in this area, please be careful.
| |
Equity valuations continue to post new record highs | |
|
It seems like each month there is a new analysis that shows how incredibly high stock valuations are. As long-term investors, it is difficult to buy at these levels knowing that the prognosis for appreciation is weak if any of our historical analogs hold true (ie: 2021, 2019, 2007, 2000, etc. when prices and valuations were high).
Here are a few charts showing how overvalued the stock market is, but in new and interesting ways.
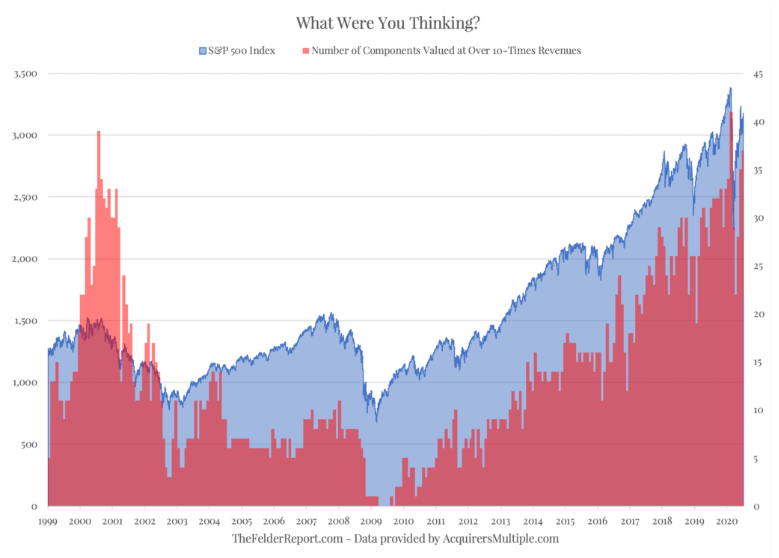
Figure 12: Number of S&P 500 companies trading OVER 10x times revenues (Jesse Felder)
| |
|
Felder uses a metric called Price-to-Sales (P/S), where the market capitalizatin of the company is divided by its revenue. The number of S&P 500 companies higher than 10 times P/S exceeds that of the Tech Bubble in 2000. This is extraordinary.
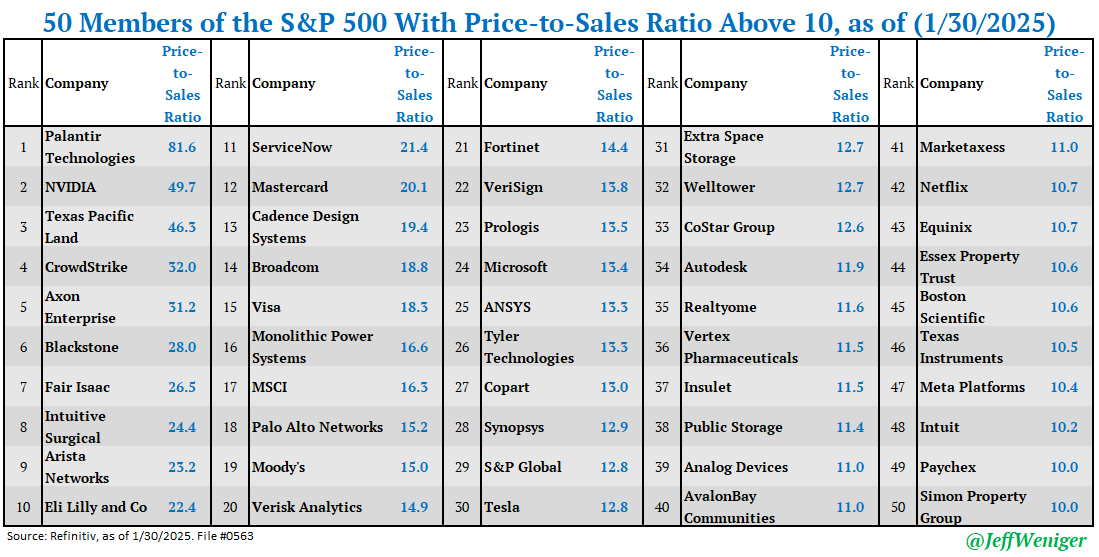
Here are some of their names.
Table 3: Stocks with Price-to-Sales over 10X (Jeff Weniger)
| |
|
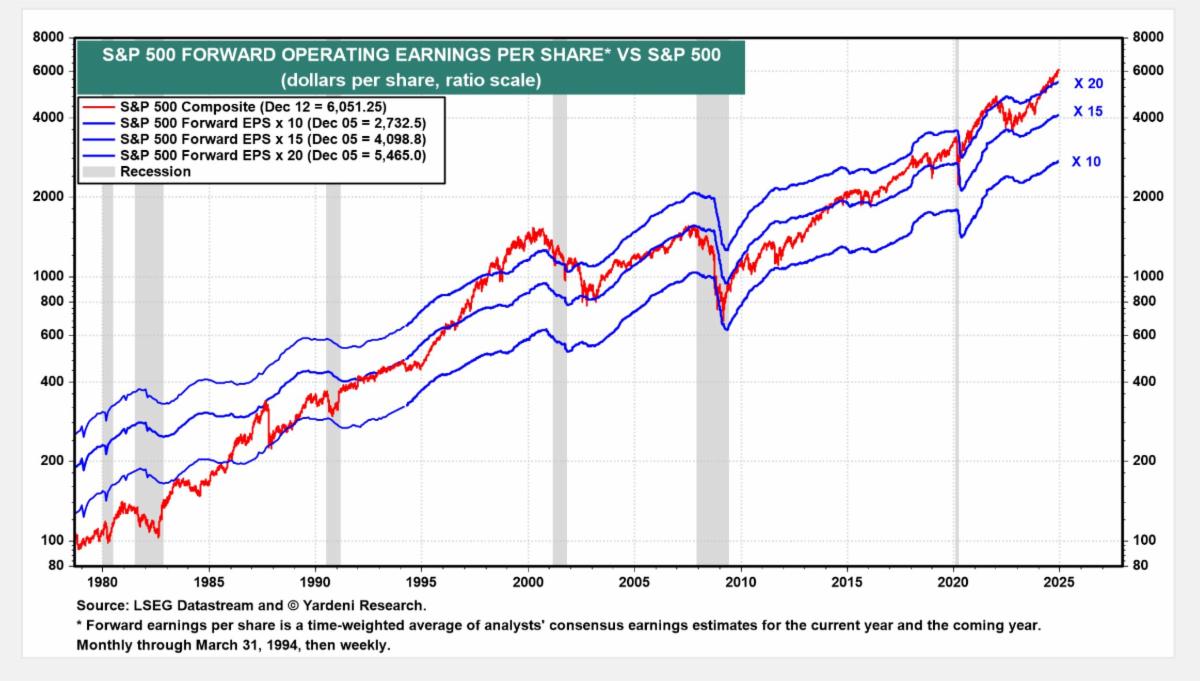
Ed Yardeni recently published his famous "Blue Angels" chart that tracks the S&P 500 versus 1-year forward earnings going back to 1980. This also shows valuations on the high side. The 20x, 15x and 10x lines show where the S&P 500 theoretically could be at 20 x earnings, 15 x earnings, and 10 x earnings.
Note that the valuations at the end of the 1970s inflation debacle were much lower than what we see today. If inflation is sustained or increases as in the 1970s, we expect the market multiple to earnings to decrease as it did during that period.
Figure 13: S&P 500 versus Forward earnings ratios (Ed Yardeni)
| |
|
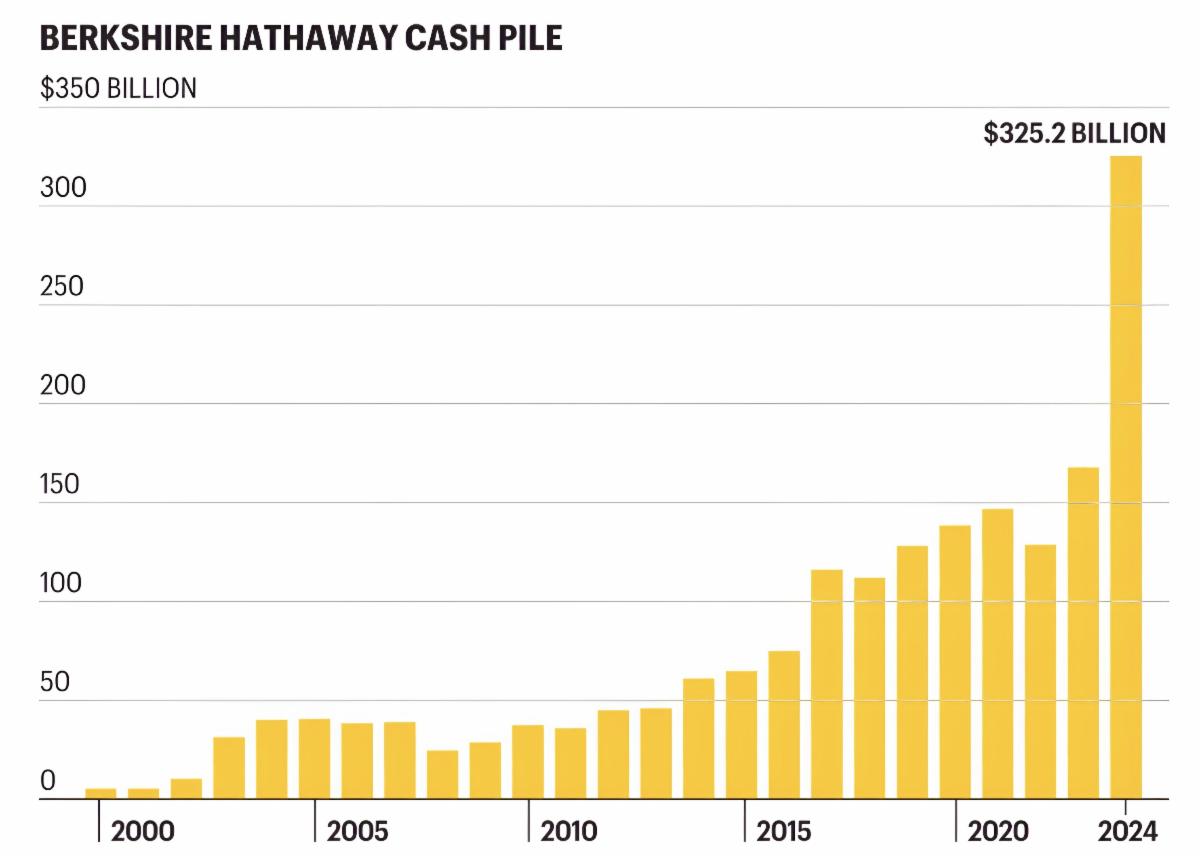
Finally, if you were wondering what some of the biggest and smartest investors are doing out there, here is a chart of the cash levels at Berkshire Hathaway. Uncle Warren (Warren Buffett) and his team are sitting on a dramatically large pile of cash. What do you think the recent spike in cash level tells us about their market views?
Figure 14: Berkshire Hathaway cash levels
| |
|
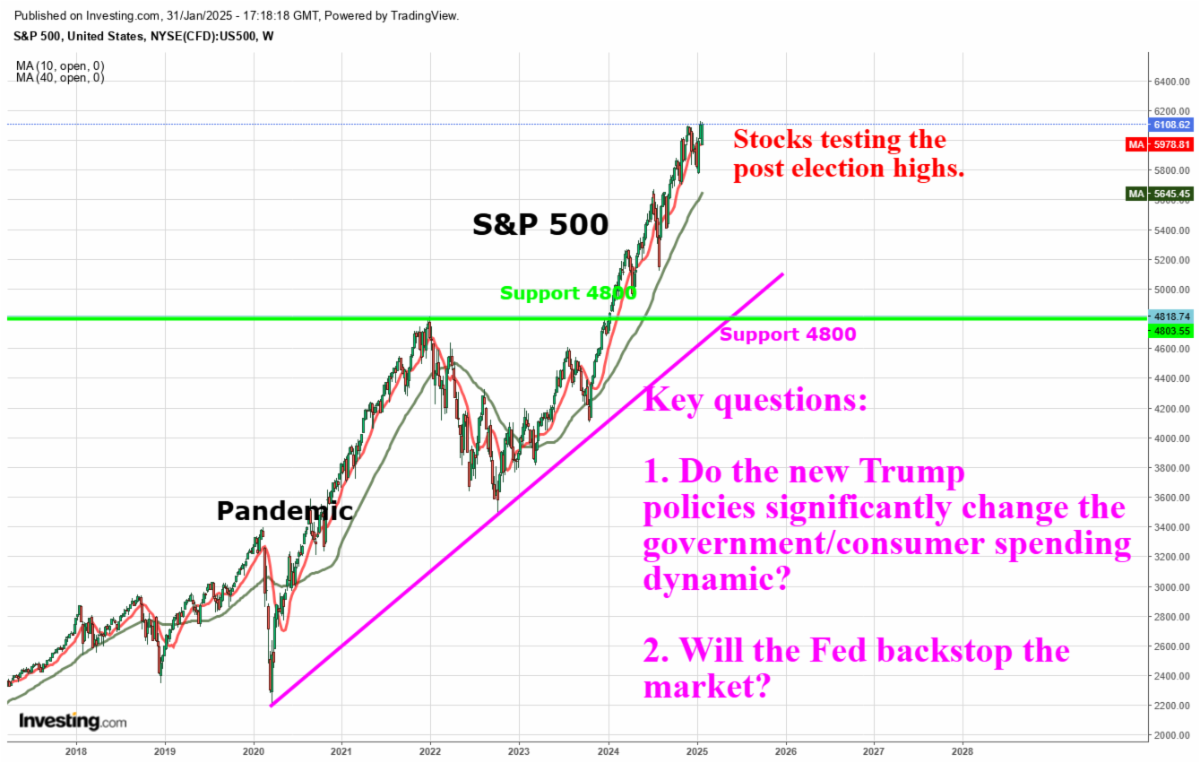
It is difficult to discern where the equity market rally will stop. There are multiple powerful forces at work pulling it in different directions. Here are some of the forces we are tracking closely:
- President Trump's policies
- Fed Chairman Powell's policies
- Option trading and hedging behavior of speculators
The economy refuses to contract, despite the best efforts of the Federal Reserve. The gusher of government spending keeps the United States' service economy humming. We are watching the new president's spending plans with great interest.
Figure 15: Stock market chart (LIWM)
| |
As always, we welcome your feedback and are happy to discuss. | |
|
Rob 281-402-8284
Chris 281-547-7542
| |
|
Christopher Lloyd, CFP ®
Vice President and Senior Wealth Planner
Lloyds Intrepid Wealth Management
1330 Lake Robbins Dr., Suite 560
The Woodlands, TX 77380
281-547-7542
Chris.Lloyd@lloydsintrepid.com
www.lloydsintrepid.com
| Lloyds Intrepid LLC is an Investment Advisor registered with the State of Texas, where it is doing business as Lloyds Intrepid Wealth Management. All views, expressions, and opinions included in this communication are subject to change. This communication is not intended as an offer or solicitation to buy, hold or sell any financial instrument or investment advisory services. Any information provided has been obtained from sources considered reliable, but we do not guarantee the accuracy, or the completeness of, any description of securities, markets or developments mentioned. We may, from time to time, have a position in the securities mentioned and may execute transactions that may not be consistent with this communication's conclusions. Please contact us at 281.886.3039 if there is any change in your financial situation, needs, goals or objectives, or if you wish to initiate any restrictions on the management of the account or modify existing restrictions. Additionally, we recommend you compare any account reports from Lloyds Intrepid LLC with the account statements from your Custodian. Please notify us if you do not receive statements from your Custodian on at least a quarterly basis. Our current disclosure brochure, Form ADV Part 2, is available for your review upon request, and on our website, www.LloydsIntrepid.com. This disclosure brochure, or a summary of material changes made, is also provided to our clients on an annual basis. | | | | |