CURRENT MARKET PERSPECTIVE | |
|
LOTS OF MIXED SIGNALS THIS WEEK
A LIKELY LATE CYCLE SPX TRADING RANGE 4800 - 5200
Click All Charts to Enlarge
| |
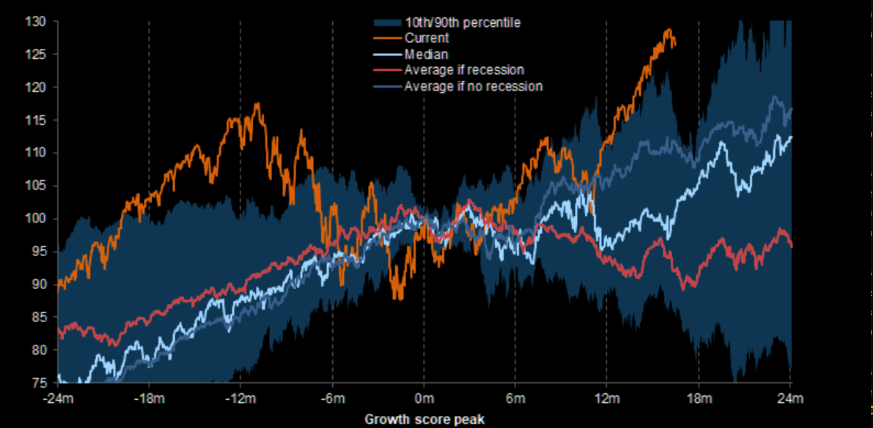
LATE CYCLE: Bidenomics (Bubble-nomics) has inserted ~$6.7T in government spending into the economy which has extended the current late business cycle positioning through the presidential period. Equities can continue to perform well in late cycle backdrops, especially if there is no recession which the market has recently reduced the probability of this occurring (to "no-landing"). | |
|
1 - SITUATIONAL ANALYSIS
There were plenty of signals this week from the FOMC to the Labor Report resulting in big moves down in Yields. However, the markets are left with no clear direction.
Barring new date or a triggering event, the expectations are for the markets to be range bound in the near term.
Panic Out (temporarily) - Trading Range In!
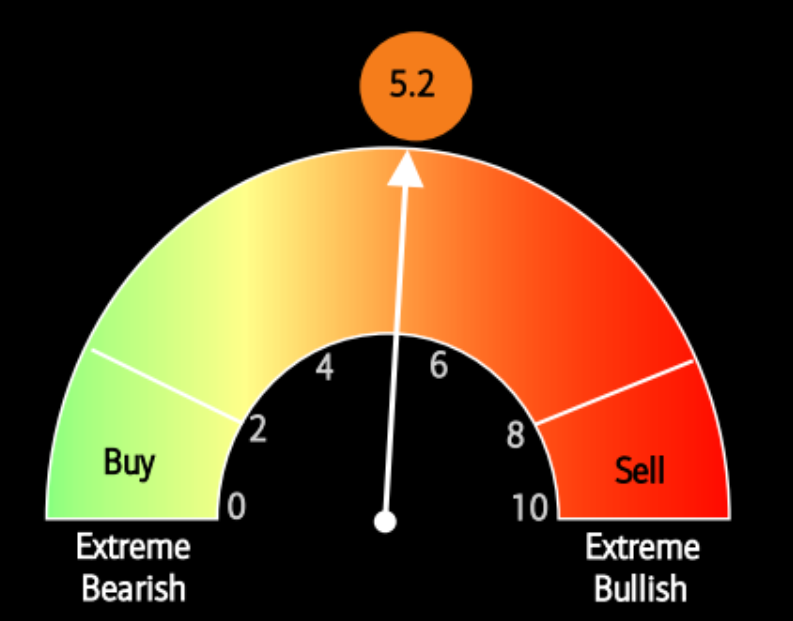
Sentiment as represented by the Fear:Greed Index is as close to neutral as it gets. This is also suggestive of a trading range until the market gives a stronger trend direction or a triggering event occurs.(CHART RIGHT)
CHART BELOW: SPX futures closed right on the 50 day moving average and the short term negative trend line. The Trading Range is likely between 5200 on the upside and possibly as low as 4800 on the downside.
| |
|
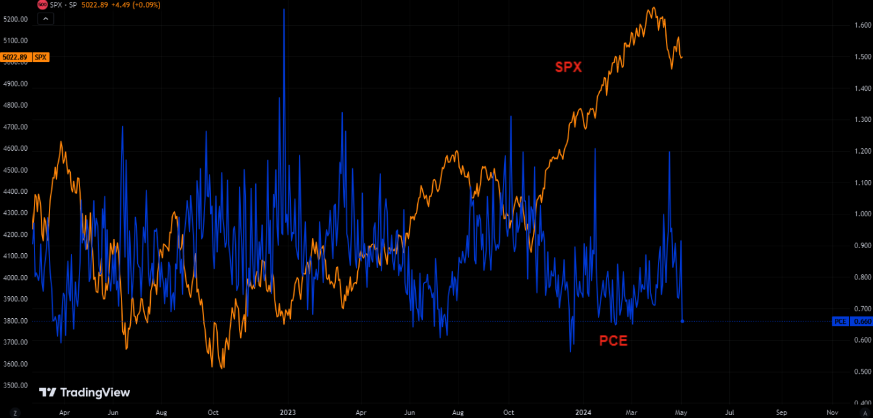
The crowd managed to load up on puts just in time for the bounce in equities. They have now decided to "puke puts". There is a reason the crowd is the crowd (CHART RIGHT)
CHART BELOW
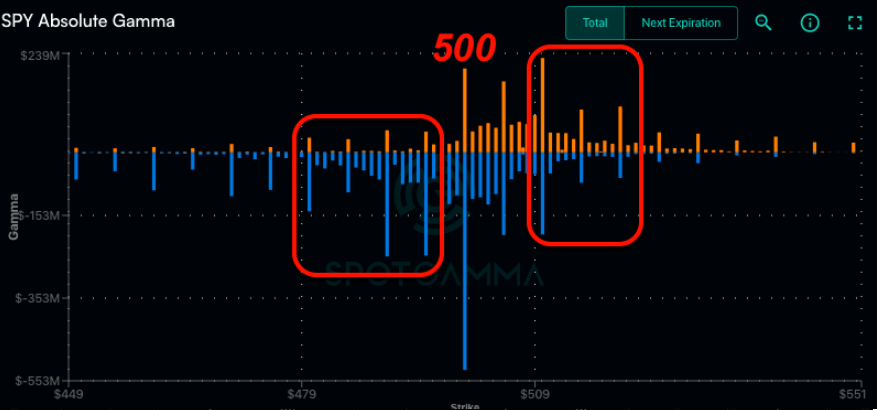
5k is the line in sand level from a gamma point of view. For now 5k is "sticky", but this could change abruptly. Spotgamma's assessment is: "...we think that a full short signal is only a break of 4,980, which may then lead to a test of 4,800".
| |
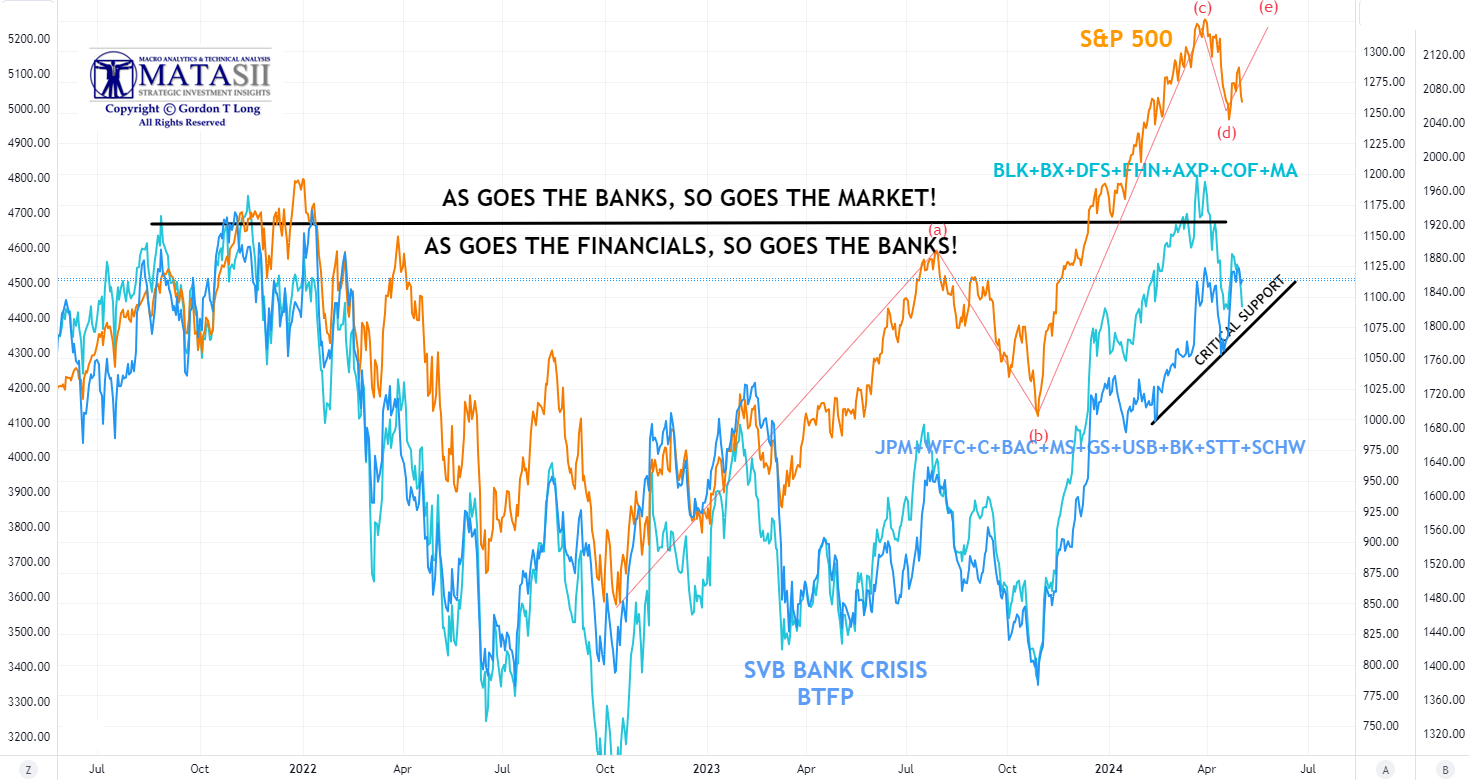
AS GO THE BANKS, SO GO THE MARKETS - AS GO THE FINANCIALS, SO GO THE BANKS! | |
|
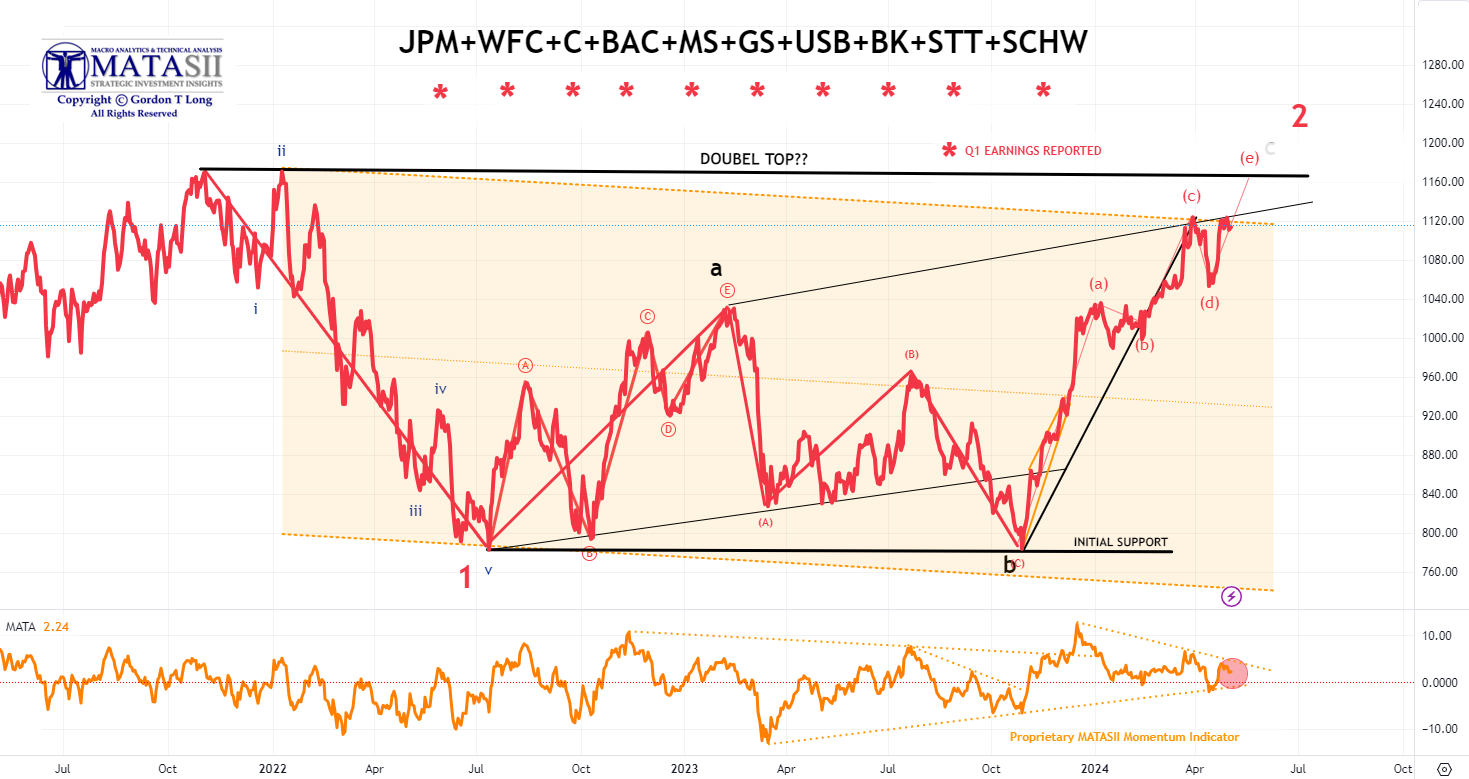
1- BANKING STOCKS
- Bank stocks, though initially weak on earnings release, have been trending up ever since.
- Presently testing underside of rising trend line.
- The pattern presently appears unfinished until a potential "Double Top" is completed.
| |
|
YOUR DESKTOP / TABLET / PHONE ANNOTATED CHART
Macro Analytics Chart Above: SUBSCRIBER LINK
| |
|
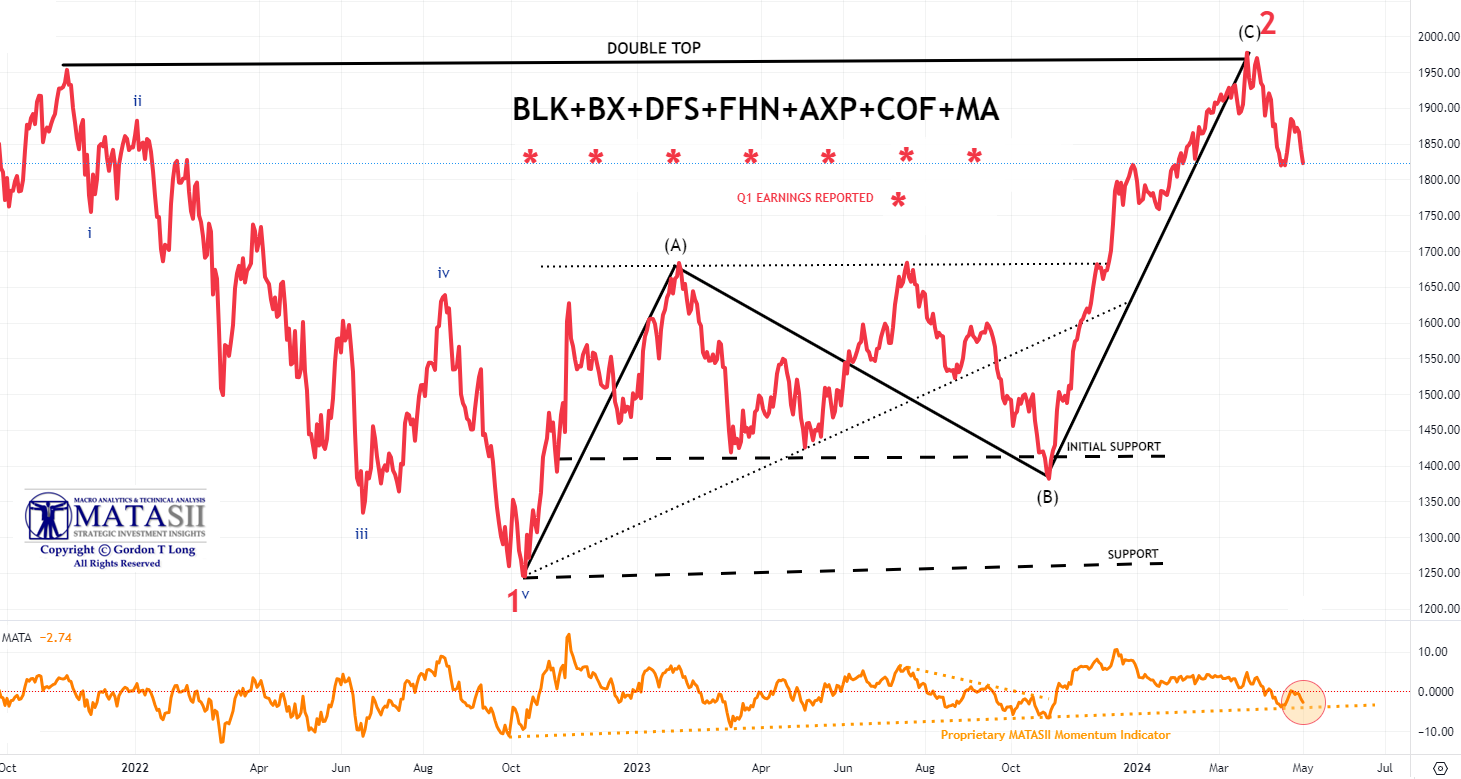
2- FINANCIAL STOCKS
- The Financial stocks appear to have already put in an intermediate double top.
- Momentum (lower pane) may act as near term support.
| |
|
YOUR DESKTOP / TABLET / PHONE ANNOTATED CHART
Macro Analytics Chart Above: SUBSCRIBER LINK
| |
CHART BELOW
- Note the Critical Support Trend line (in black) below.
- This support is likely to need to be test before further upside gets underway. If decisively broken the markets with test the lower end of the trading range.
| |
|
YOUR DESKTOP / TABLET / PHONE ANNOTATED CHART
Macro Analytics Chart Above: SUBSCRIBER LINK
| |
|
2 - FUNDAMENTAL ANALYSIS
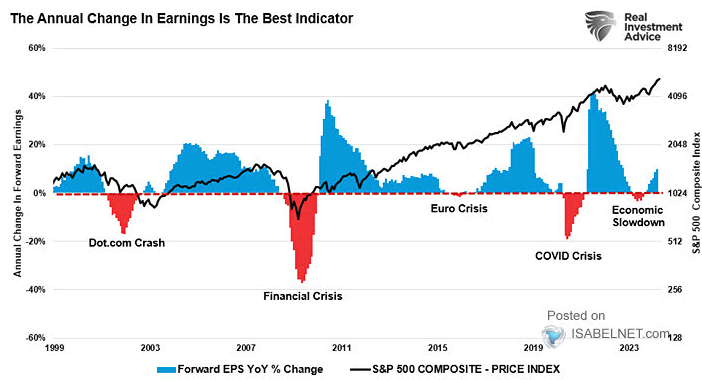
RISING FORWARD EPS Y-O-Y CHANGE CHART RIGHT
When forward earnings are rising, it is generally viewed as a positive signal for higher equity prices and can help minimize the risk of a potential deeper market correction (chart right)
However ....
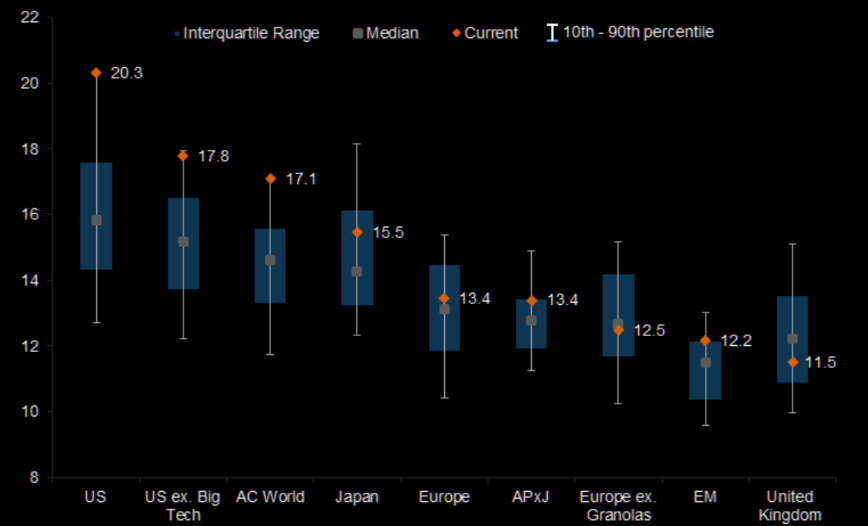
EQUITY MARKETS ARE EXPENSIVE
Equity markets are expensive, particularly in the US. The Chart Below highlights forward P/E multiple by MSCI Regions with data for the last 20 years.
| |
|
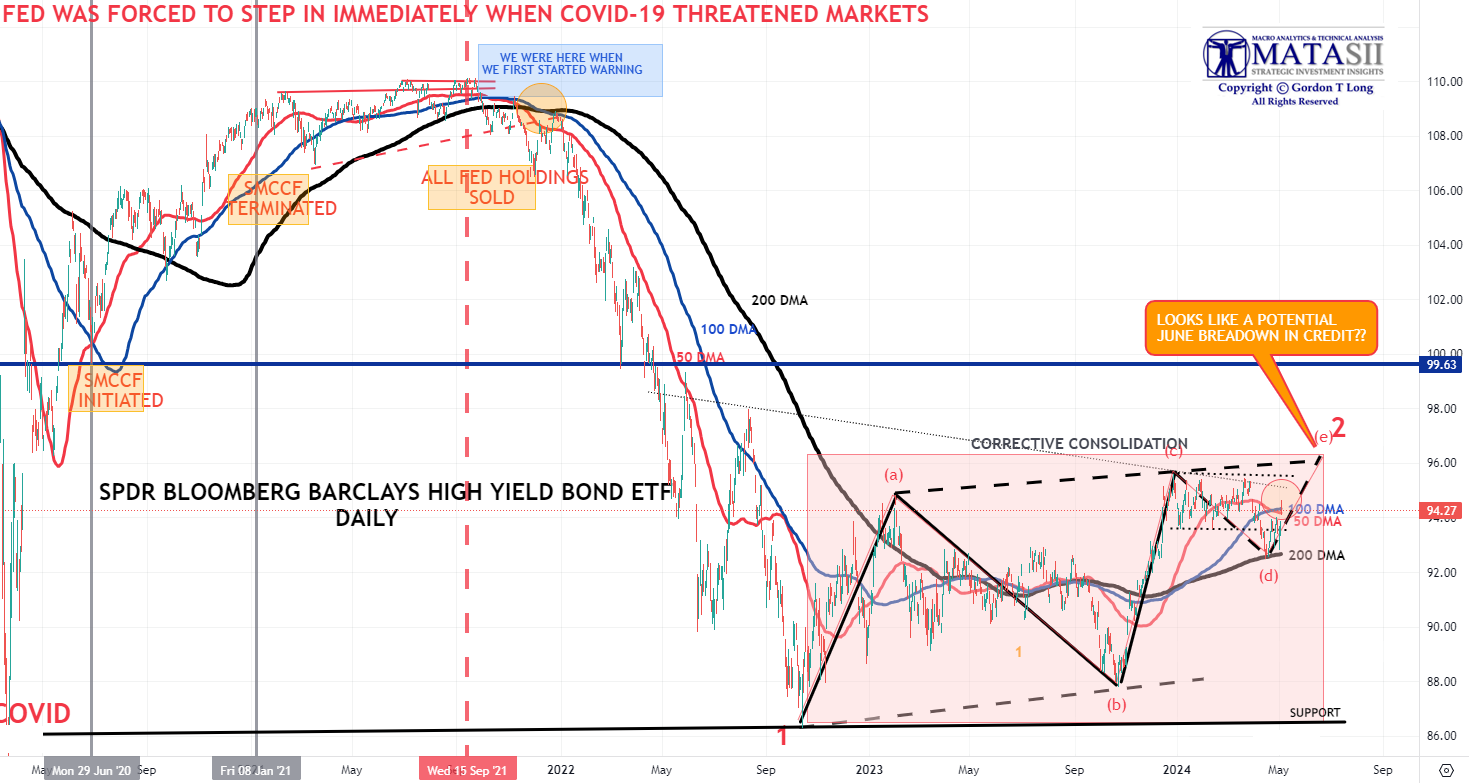
CREDIT MARKETS LEAD
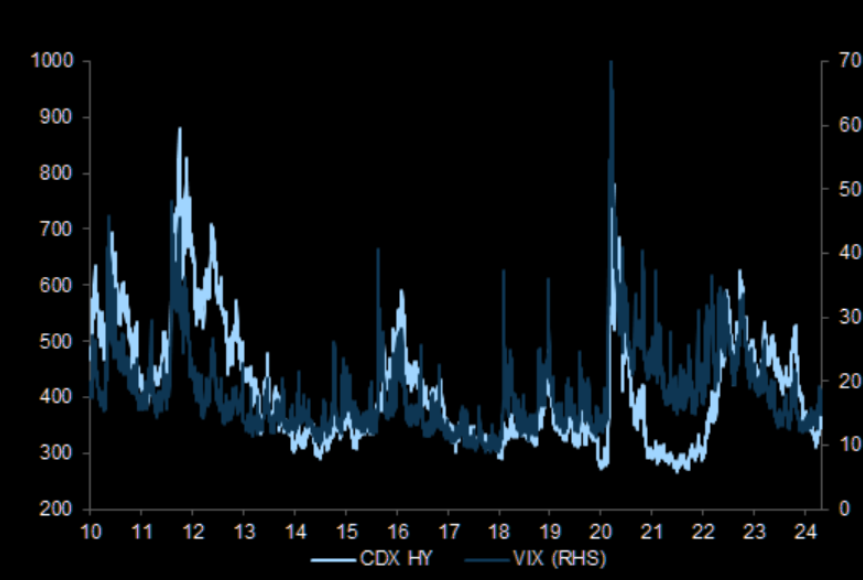
As you are well aware, we are strong believers that Credit Markets LEAD while Equity & Bond Markets FOLLOW. As such Credit Spreads have been highly skeptical the equity was going to selloff significantly.
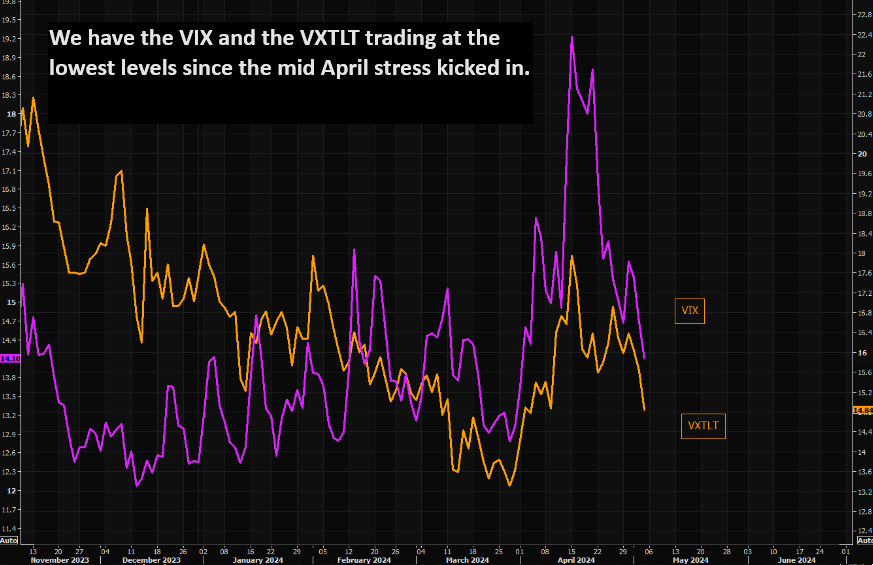
CHART RIGHT: Credit spreads have been anchored alongside equity volatility
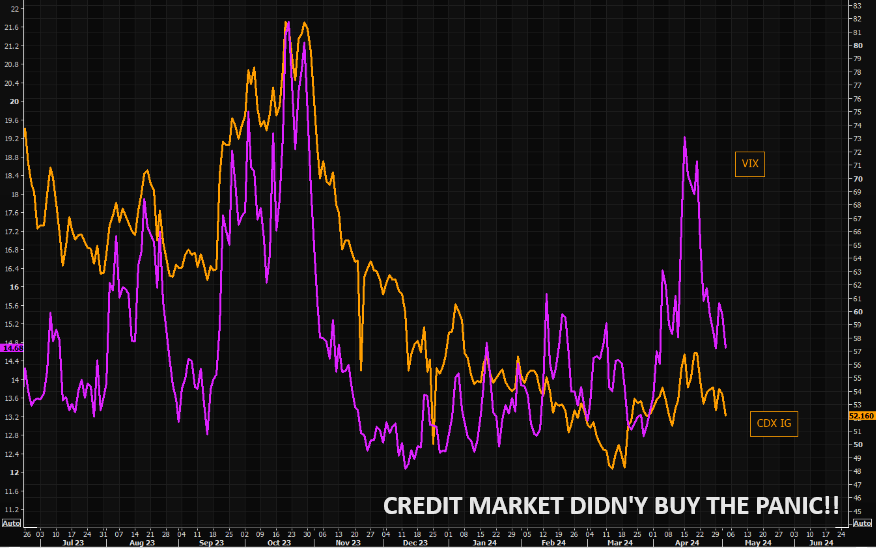
CHART BELOW: The CDX IG popped higher when VIX went crazy a few weeks ago, but the credit move was very controlled. Note things are back to "normal" in credit protection land. CDX IG closed at the lowest levels in a few weeks.
| |
THE SPDR BLOOMBERG BARCLAYS HIGH YIELD BOND ETF - Daily | |
|
YOUR DESKTOP / TABLET / PHONE ANNOTATED CHART
Macro Analytics Chart Above: SUBSCRIBER LINK
| |
|
3 - TECHNICAL ANALYSIS
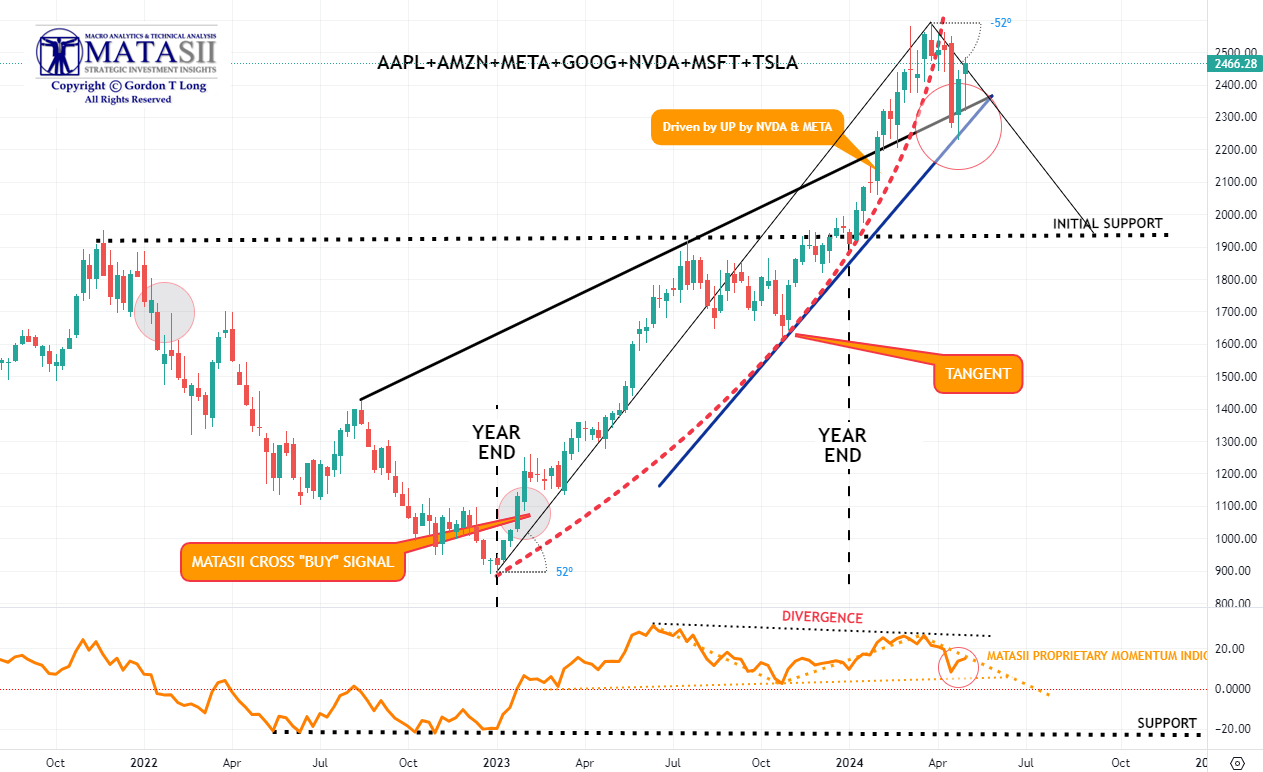
MAGNIFICENT 7
- We were reaching the vertical lift part of the parabolic (geometric) lift shown by the dashed red line before falling off and then lifting after the release of the Labor Report on Friday.
- In the short term, Momentum (bottom pane) is testing the overhead Momentum trend line resistance level (dotted orange line).
| |
YOUR DESKTOP / TABLET / PHONE ANNOTATED CHART
Macro Analytics Chart Above: SUBSCRIBER LINK
| |
|
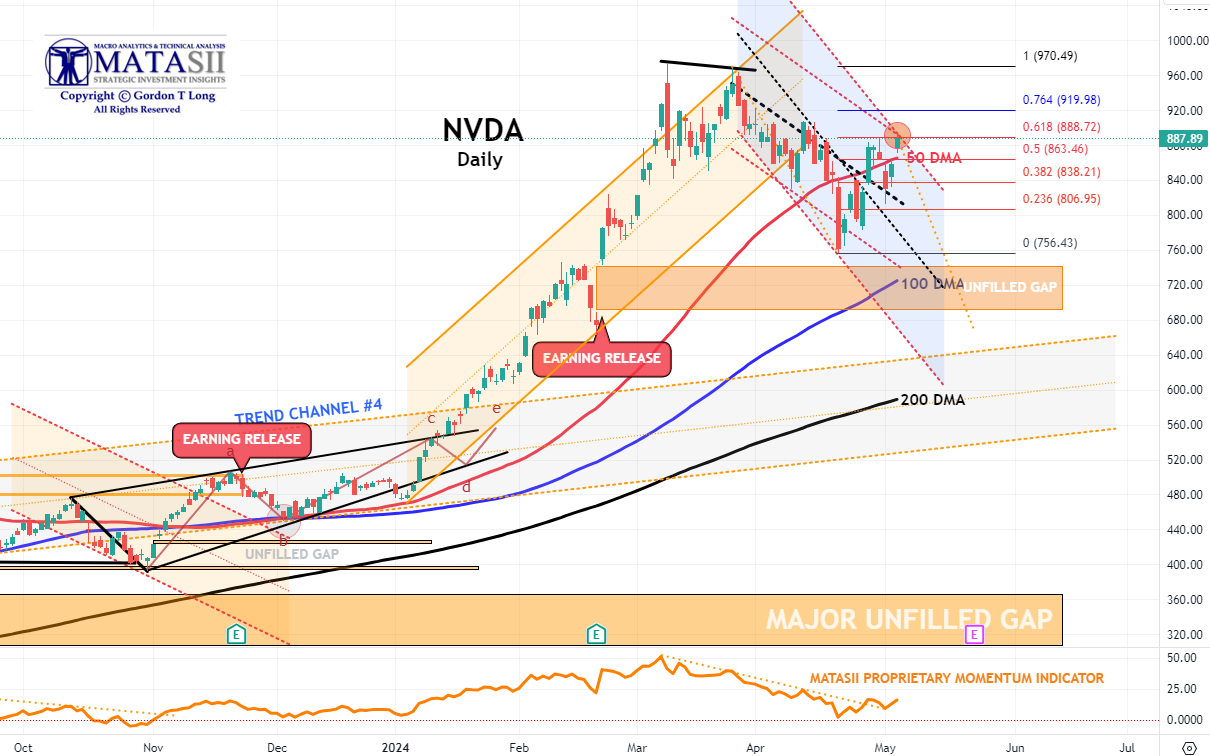
NVDA - Daily
- NVDA again broke through the overhead 50 DMA on a retest to reach a 61.8% Fibonacci Retracement level..
- NVDA Momentum (lower pane) has also broken through its overhead resistance trend line (dotted orange trend line).
- This counter rally has been noticeably strong for NVDA but appears to exhibit corrective characteristics (overlapping price movement), whereas the downward pattern from NVDA's highs appears "Impulsive" (less overlapping price movement & a "five" wave count).
- The pattern is currently suggesting we are in a corrective wave 2 of what will be a downward 5 count.
- With earnings release fast approaching(marked by the red "E" box) this potentially could be a set-up for NVDA to move towards its 200 DMA for support. Even strong earnings could be found to "disappoint" on any newly appearing concerns?
| |
|
YOUR DESKTOP / TABLET / PHONE ANNOTATED CHART
Macro Analytics Chart Above: SUBSCRIBER LINK
| |
|
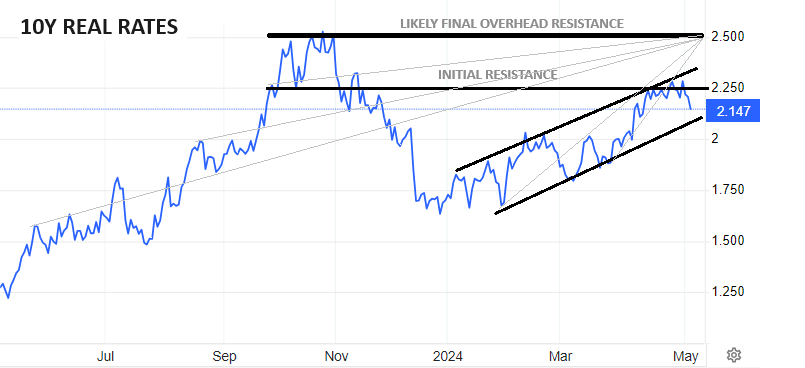
"CURRENCY" MARKET (Currency, Gold, Black Gold (Oil) & Bitcoin)
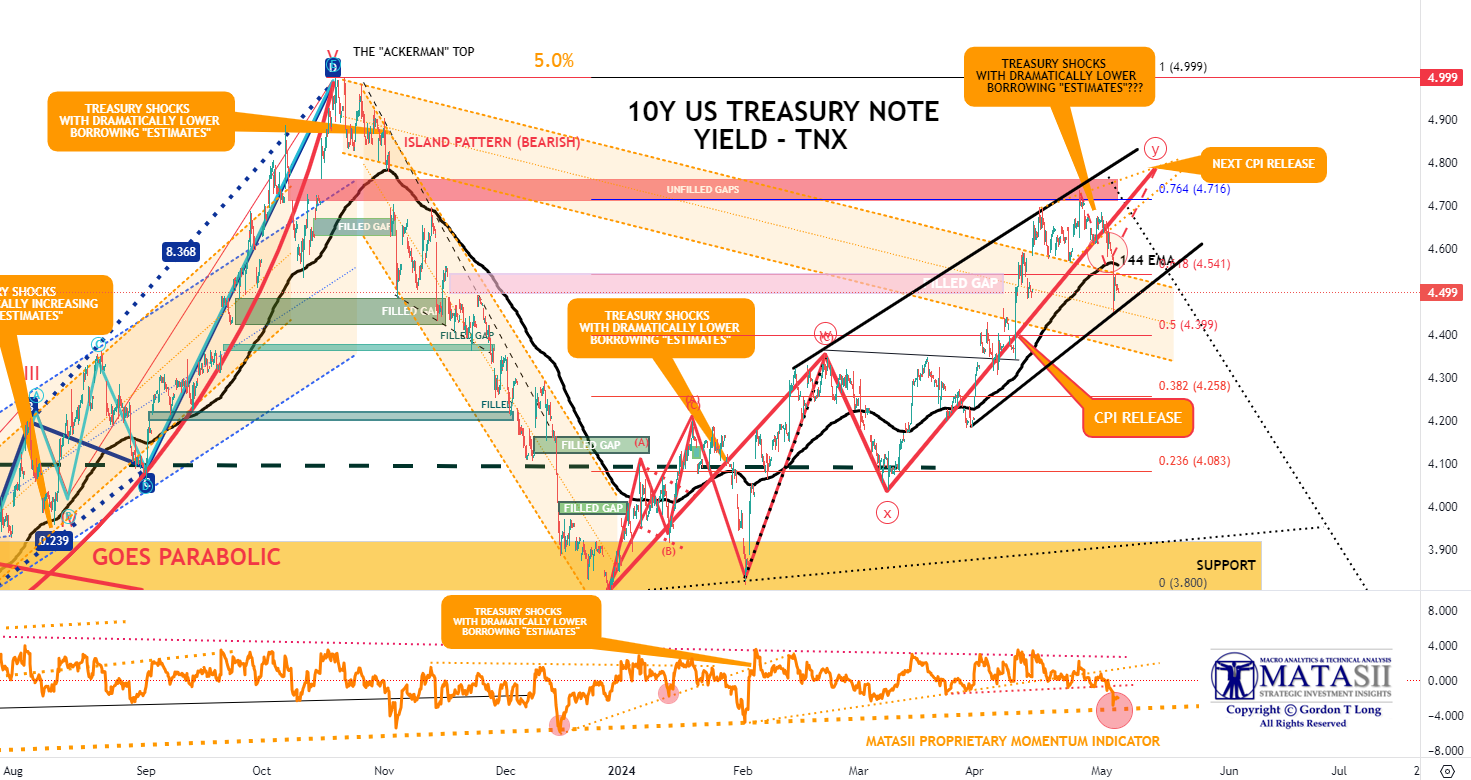
CHART RIGHT: Real Rates reached our initial overhead resistance level of 2.25% before falling off hard with Friday's Labor Report.
TRADING RANGE: Equity markets reacted to labor market pressures associated with a weakening Jobs Report (Friday). Yields & Rates will likely test the lower trend line (chart above right) as it waits on the next CPI report scheduled for release on May 15th.
CONTROL PACKAGE
There are TEN charts we have outlined in prior chart packages, which we will continue to watch closely as a CURRENT "control set".
-
US DOLLAR -DXY - MONTHLY (CHART LINK)
-
US DOLLAR - DXY - DAILY (CHART LINK)
-
GOLD - DAILY (CHART LINK)
-
GOLD cfd's - DAILY (CHART LINK)
-
GOLD - Integrated - Barrick Gold (CHART LINK)
-
SILVER - DAILY (CHART LINK)
-
OIL - XLE - MONTHLY (CHART LINK)
-
OIL - WTIC - MONTHLY - (CHART LINK)
-
BITCOIN - BTCUSD - WEEKLY (CHART LINK)
-
10y TIPS - Real Rates - Daily (CHART LINK)
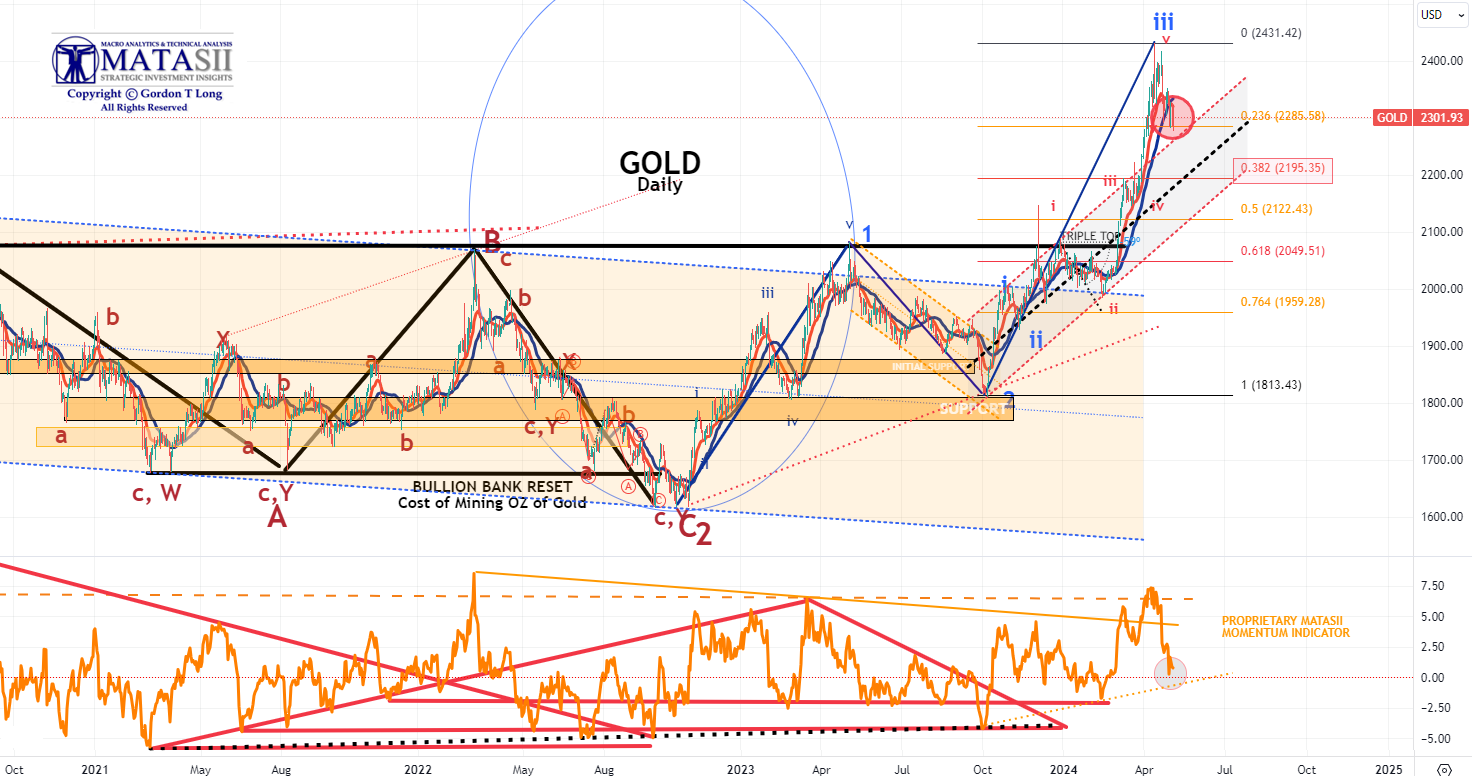
GOLD - DAILY
- Gold pulled back on Monday finding initial support at the 23.6% Fibonacci Retracement level.
- Gold Momentum (lower pane) is likely looking for support slightly lower at the dotted orange trend line,
- It appears that this initial corrective leg is an "A" wave of an ABC corrective pattern before heading higher when completed. The "C" down leg of the ABC is likely to find firm support at the 38.2% Fibonacci Retracement level (orange red box).
|  | |
YOUR DESKTOP / TABLET / PHONE ANNOTATED CHART
Macro Analytics Chart Above: SUBSCRIBER LINK
| |
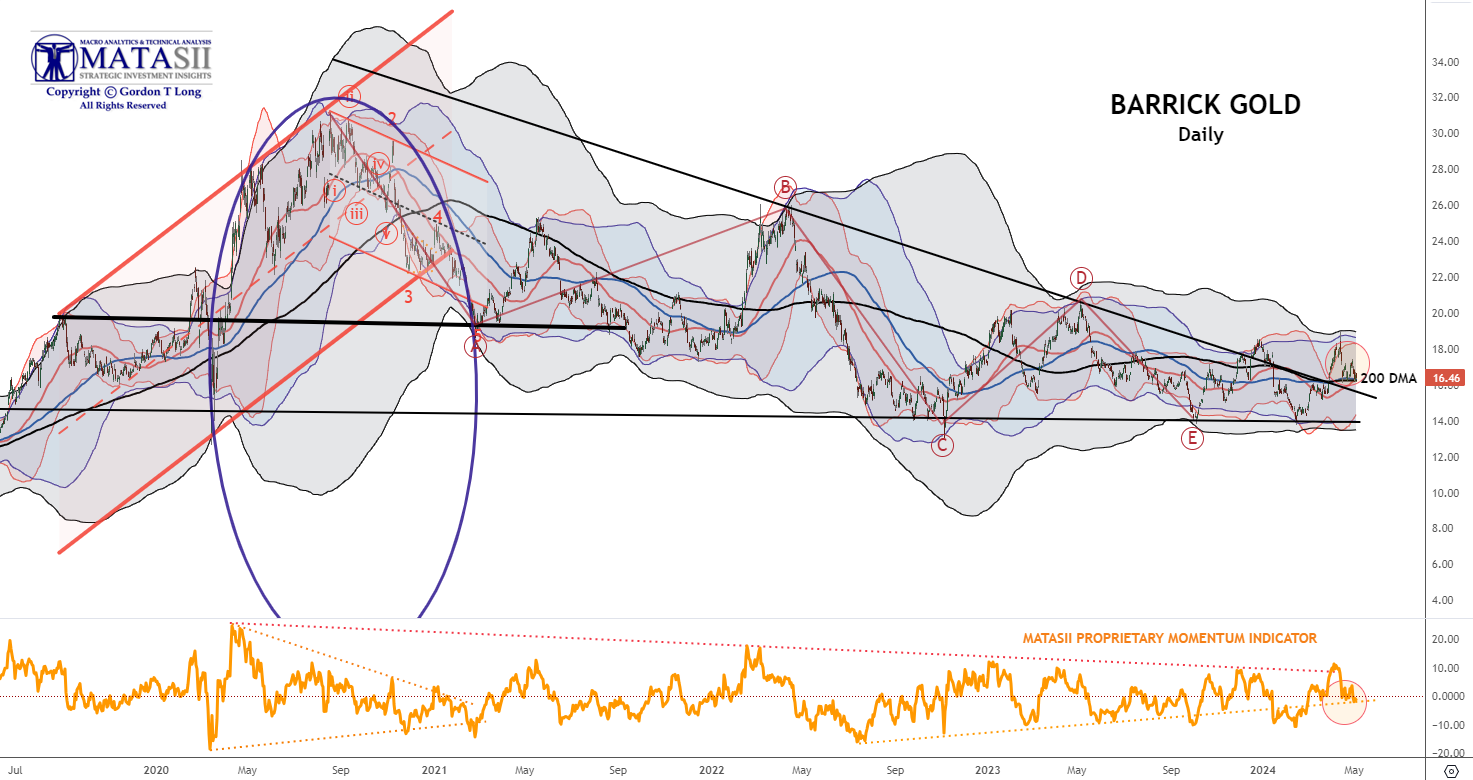
INTEGRATED GOLD MINERS
BARRICK GOLD - Daily
We continue to have a close eye on Gold and the INTEGRATED GOLD MINERS as represented by Barrick Gold.
- Barrick has broken out of its long term declining overhead resistance trend.
- Barrick has pulled back with Gold Bullion finding support at its long term 200 DMA.
- This may potentially be a good opportunity to add to your Integrated Miners positions.
| |
|
YOUR DESKTOP / TABLET / PHONE ANNOTATED CHART
Macro Analytics Chart Above: SUBSCRIBER LINK
| |
|
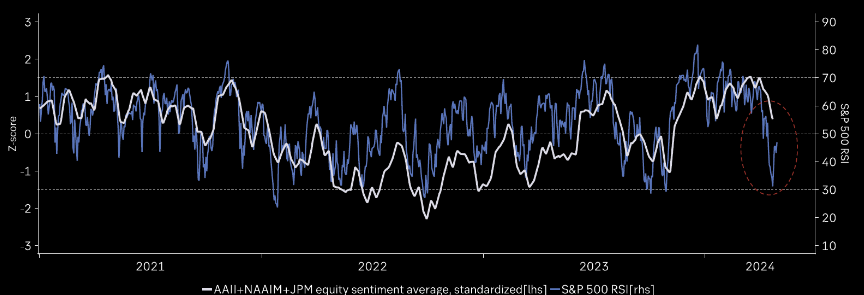
US EQUITY MARKETS
If this is a mild 5-10% correction, investor sentiment should bottom soon around neutral. (Chart Right)
| |
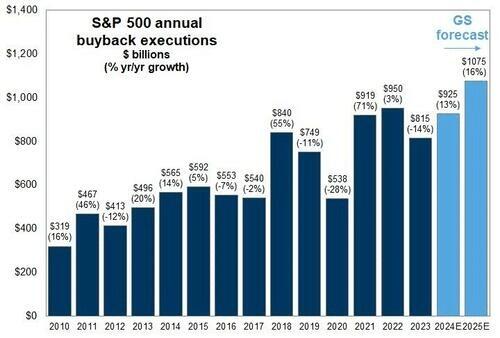
CORPORATE BUYBACKS
Corporate share buybacks will resume in the next couple of weeks, and with more than $1 trillion slated for 2024, many buybacks remain to complete. Such is particularly the case with Google adding another $70 billion to that total.
CONTROL PACKAGE
There have FIVE charts we have outlined in prior chart packages that we will continue to watch closely as a CURRENT "control set".
-
The S&P 500 (CHART LINK)
-
The DJIA (CHART LINK)
-
The Russell 2000 through the IWM ETF (CHART LINK),
-
The MAGNIFICENT SEVEN (CHART ABOVE WITH MATASII CROSS - LINK)
-
Nvidia (NVDA) (CHART LINK)
| |
S&P 500 CFD
- The S&P 500 cfd bounced off its 100 DMA once again to only subsequently retrace to test its 50 DMA a second time.
- Momentum (lower pane) also bounced off its lower support to a more neutral level.
- Expect the Moving Averages (50/100/200 DMA) to narrow and tighten.
- We have a trading range set-up as the market looks for more guidance and corporate buybacks to resume.
| |
YOUR DESKTOP / TABLET / PHONE ANNOTATED CHART
Macro Analytics Chart Above: SUBSCRIBER LINK
| |
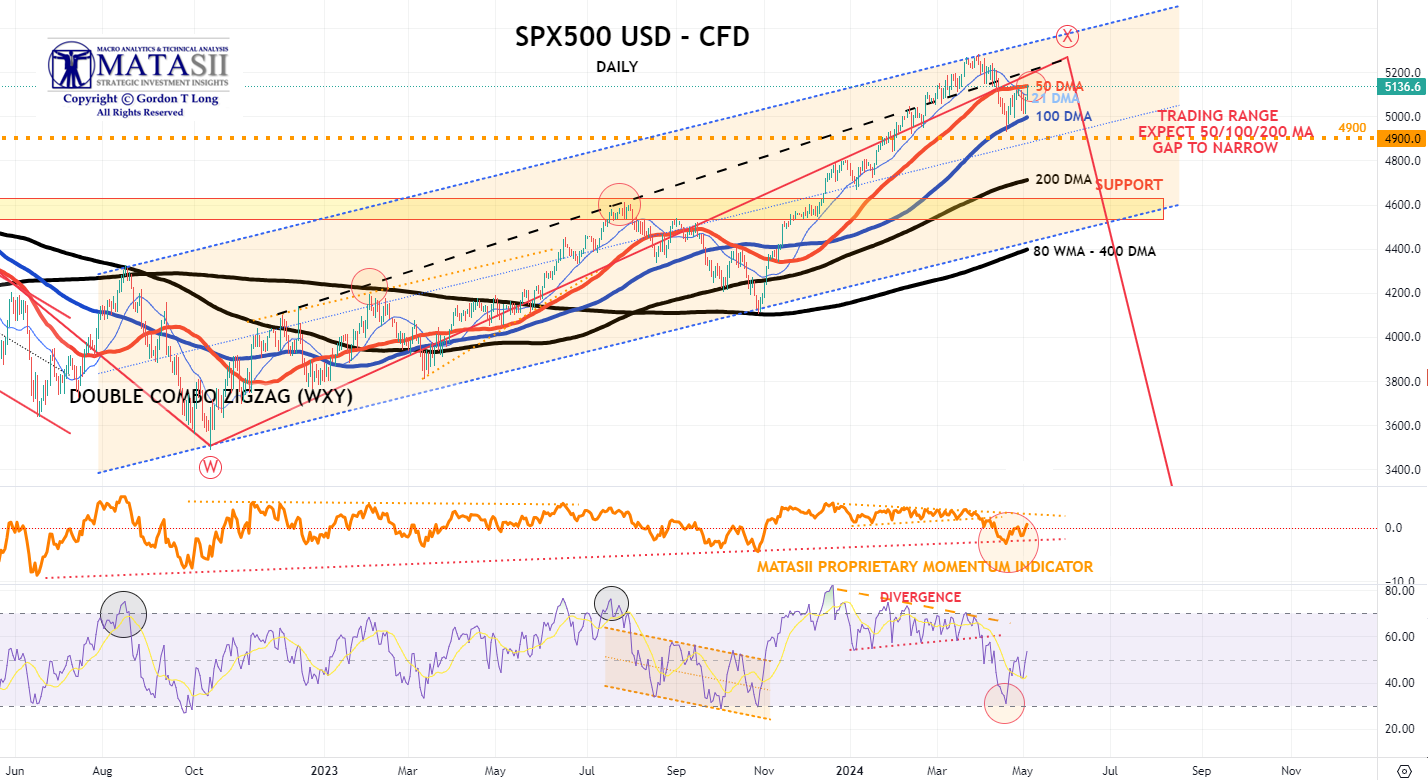
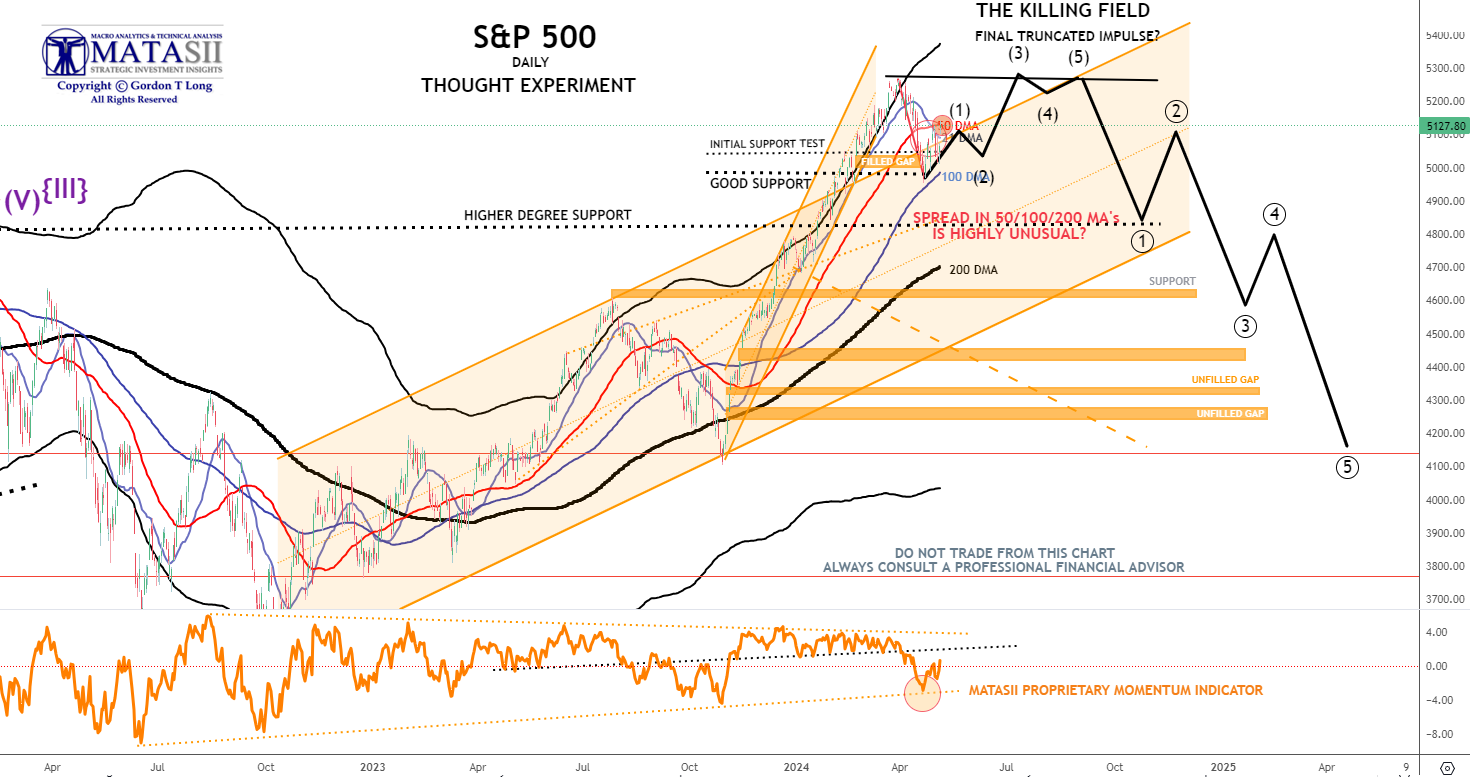
S&P 500 - Daily - Our Though Experiment
Our Though Experiment, which we have discussed many times previously in the way of a projection, suggests we have put in a near term top and will now consolidate before possibly completing one final small impulse higher OR put in a final Wave 5 of a higher degree.
NOTE: To reiterate what I previously wrote - "the black labeled activity shown below, between now and July, looks like a "Killing Field" where the algos take Day Traders, "Dip Buyers", the "Gamma Guys" and FOMO's all out on stretchers!"
- The S&P 500 bounced off its 100 DMA once again to only subsequently retrace to test its 50 DMA a second time.
- Momentum (lower pane) also found support at its lower trend support line before beginning to retrace towards its upper trend momentum. From a momentum perspective it appears to still have further upside to go.
- We appear to be in a short term trading range as the market looks for more guidance and corporate buybacks to resume..
OUR CURRENT ASSESSEMNT IS THAT THE INTERMEDIATE TERM IS LIKELY TO LOOK LIKE THE FOLLOWING.
|  | |
YOUR DESKTOP / TABLET / PHONE ANNOTATED CHART
Macro Analytics Chart Above: SUBSCRIBER LINK
| |
STOCK MONITOR: What We Spotted
MONDAY
- Stocks were flat in choppy trade on Monday as indices took pause from their recovery with a lack of major macro catalysts except for Yen intervention.
- While there was no tier 1 data, we did get the US quarterly financing estimates ahead of the quarterly refunding announcement on Wednesday, which came in above estimates and led to some downside in stocks and bonds in late trade, although that faded into the close.
- TSLA (+15%) and AAPL (+2.4%) were standout outperformers, with the former seeing a further short squeeze on reports it has received approval for FSD in China, while AAPL benefitted from an upgrade at Berstein ahead of its earnings on Thursday.
- Treasuries rallied after soft European inflation data kicked the bid into month-end, while the Boeing jumbo IG deal capped strength.
- The Dollar Index was lower amid the Yen surging higher after the BoJ was touted to intervene. Oil prices were lower with positive noise around the Israel/Hamas peace talks taking some geopolitical risk premium out of the market.
STOCK SPECIFIC
- TSLA +15%, BIDU +5.6%, after Tesla had its FSD tentatively approved in China in a Baidu tie-up. AAPL +2.5% upgraded to Outperform from Market Perform at Bernstein ahead of Q2 results due Thursday AMC. PARA +2.9% expected to fire CEO Bob Bakish amid disagreements on the Skydance Media potential merger. DPZ +5.6% beating on EPS and in line Revenue. ON +4% after Q1 EPS and Revenue beat, but its Q2 EPS and revenue guidance was on the light side. ALB +7.6% was mentioned positively in Barron's as a play on a rebound in lithium prices. DJT +12.4% after highlighting actions DJT shareholders can take to prevent the lending of their shares by brokerage firms for the purpose of short selling. UMBF -6.5%, HTLF +15%, UMBF to buy HTLF in an all-stock transaction; UMBF share offering. DCPH +73% to be acquired by ONO Pharmaceutical (4528 JT).
TUESDAY
- Stocks were sold on Tuesday with the surprise rise in the Q1 Employment Cost Index ramping the hawkish pressure on the Fed ahead of Powell on Wednesday.
- There were kneejerk losses to the release, and then an extension lower through the US session, with the rate-sensitive small caps (Russell 2k) leading the losses. AMZN trades down 100bps ahead of its report after hours.
- The Dollar Index saw strong gains, with USD/JPY back to testing 158 to the upside to little fresh signs of intervention.
- Treasuries bear-flattened after the hot ECI print, not to mention a WSJ Timiraos article titled "Fed to Signal It Has Stomach to Keep Rates High for Longer".
- Fed pricing now sees under 30bps of cuts this year vs 35bps before the data today.
- Wednesday is action-packed, with FOMC, JOLTS, ADP, ISM mfg., and the Quarterly Refunding Announcement all due in the lead-up to Friday's NFP. Bunds saw particularly heavy losses with Eurex closed for Labour Day holiday on Wednesday and after the mixed European inflation figures earlier in the session.
- Elsewhere, the strong Dollar weighed on commodities, with notable losses in EMFX. Gold has hit its lowest levels since early April at c. USD 2290/oz.
INFLATION BREAKEVENS: 5yr BEI -1.2bps at 2.436%, 10yr BEI -0.5bps at 2.416%, 30yr BEI -1.0bps at 2.378%.
REAL RATES: 10Y -- 2.2695%
STOCK SPECIFIC
- Of note for cannabis names such as Canopy Growth (CGC) +79%, Tilray (TLRY) +40% and ETF MSOS +26%: DEA moving to reclassify marijuana as a less dangerous drug, according to AP.
- Warner Bros. Discovery (WBD) -9.5%: NBC (CMCSA) prepares a USD 2.5bln annual offer to steal NBA rights away from TNT (WBD).
- Tesla (TSLA) -5.5%: CEO Musk plans more layoffs as two senior executives depart, The Information reports. Roughly 500 people will be laid off in supercharger group.
- Nvidia (NVDA) -1.5%: Upgraded at S&P to 'AA-' on continued strong AI investment cycle; outlook stable.
- EU HICP-X F&E Flash YY (Apr) 2.8% vs. Exp. 2.9% (Prev. 3.1%); HICP Flash YY (Apr) 2.4% vs. Exp. 2.4% (Prev. 2.4%); HICP-X F, E, A, T Flash MM (Apr) 0.7% vs. Exp. 0.80% (Prev. 1.10%); HICP-X F,E,A&T Flash YY (Apr) 2.7% vs. Exp. 2.7% (Prev. 2.9%)
- EU GDP Flash Prelim QQ (Q1) 0.3% vs. Exp. 0.2%; GDP Flash Prelim YY (Q1) 0.4% vs. Exp. 0.2% (Prev. 0.1%)
- German Retail Sales MM Real (Mar) 1.8% vs. Exp. 1.1% (Prev. -1.9%); YY Real (Mar) 0.3% (Prev. -2.7%); Import Prices YY (Mar) -3.6% vs. Exp. -3.8% (Prev. -4.9%); MM (Mar) 0.4% vs. Exp. 0.2% (Prev. -0.2%); GDP Flash YY NSA (Q1) -0.9% vs. Exp. -0.8% (Prev. -0.4%); GDP Flash QQ SA (Q1) 0.2% vs. Exp. 0.1% (Prev. -0.3%)
- German Unemployment Chg SA (Apr) 10.0k vs. Exp. 9.0k (Prev. 4.0k); Unemployment Rate SA (Apr) 5.9% vs. Exp. 5.9% (Prev. 5.9%); Unemployment Total SA (Apr) 2.732M (Prev. 2.719M); Unemployment Total NSA (Apr) 2.75M (Prev. 2.769M)
- French GDP Preliminary QQ (Q1) 0.2% vs. Exp. 0.1% (Prev. 0.1%); CPI Prelim MM NSA (Apr) 0.5% vs. Exp. 0.5% (Prev. 0.2%); CPI (EU Norm) Prelim YY (Apr) 2.4% vs. Exp. 2.2% (Prev. 2.4%); Producer Prices MM (Mar) -0.2% (Prev. -1.7%); CPI Prelim YY NSA (Apr) 2.2% vs. Exp. 2.2% (Prev. 2.3%)
- UK BRC Shop Price Index YY (Apr) 0.8% (Prev. 1.3%)
- UK Lloyds Business Barometer (Apr) 42 (Prev. 42)
- UK Mortgage Approvals (Mar) 61.325k vs. Exp. 61.5k (Prev. 60.383k, Rev. 60.497k); Mortgage Lending (Mar) 0.26B GB vs. Exp. 1.5B GB (Prev. 1.51B GB, Rev. 1.646B GB); BOE Consumer Credit (Mar) 1.577B GB vs. Exp. 1.5B GB (Prev. 1.378B GB, Rev. 1.429B GB); M4 Money Supply (Mar) 0.7% (Prev. 0.5%, Rev. 0.6%)
- Swiss KOF Indicator (Apr) 101.8 vs. Exp. 102.0 (Prev. 101.5, Rev. 100.4)
WEDNESDAY
- Overall a dovish reaction to the FOMC and Press Conference which saw the Fed leave rates on hold as expected but it also announced it is to taper its QT run-off to just USD 25bln a month from USD 60bln, slightly more dovish than the expected USD 30bln.
- The typical dovish reaction (upside in stocks, bonds, gold and downside in the Dollar) extended on Fed Chair Powell's press conference, albeit stocks saw a large reversal into the close in absence of a fresh catalyst, while bonds pared half the move.
- The Fed Chair said it is unlikely the next move will be a hike and the Fed is rather focused on how long to keep policy at its current level. Powell did admit several times that the recent inflation data does not boost the Fed's confidence in inflation returning to 2%, but he does believe policy is restrictive enough for that to occur. Money markets now price in c. 35bps of easing throughout 2024 vs 30bps pre Powell.
- Elsewhere, ahead of Friday's NFP, the ADP national employment print beat expectations at 192k while wages eased for both job stayers and changers.
- The ISM Manufacturing PMI was mixed, the headline dipped into contractionary territory but prices paid saw a notable increase while the employment component saw a slight gain.
- JOLTS data came in beneath expectations and the quits rate eased; a welcome sign for the Fed, something Powell mentioned as well. In oil, WTI and Brent tumbled on the huge EIA inventory build while we now await Hamas' response on the latest ceasefire/hostage release proposal.
- On earnings, chip names were hit on AMD's weakness after investors were disappointed in how much it raised its AI chip sales forecast while SMCI figures also disappointed. Meanwhile, AMZN. PINS, PFE & NYCB earnings impressed. SBUX, EL, CVS, and SWKS disappointed.
INFLATION BREAKEVENS: 5yr BEI -3.4bps at 2.402%, 10yr BEI -3.0bps at 2.384%, 30yr BEI -2.6bps at 2.353%.
REAL RATES: 10Y -- 2.243%
STOCK SPECIFIC
- Google (GOOGL) +0.5%: Slashed cost of AI-generated search by 80% and the success relieves worries that AI would hurt its search profit margins, according to The Information.
- Exxon (XOM), Pioneer (PXD): XOM reportedly set to win FTC approval for PXD deal with settlement, according to Bloomberg
- Micron (MU) -2.5%: First to ship critical memory for AI data centers.
- iRobot (IRBT) flat: US House Committee probes FTC interactions with European Commission to block Amazon (AMZN) deal to buy iRobot (IRBT).
- Banks: US discusses finalizing bank capital rules as soon as August; Fed, FDIC, and OCC won't completely redo July 2023 proposal, according to Bloomberg.
THURSDAY
- Stocks trended higher on Thursday throughout overnight and the European session although a brief knock was seen in response to the hotter-than-expected Unit Labor Costs and beneath-forecast Initial Jobless Claims data as all eyes now turn to Friday's NFP and Apple (AAPL) earnings after hours.
- The data also sparked downside in Treasuries and upside in the Dollar but moves had started to pare throughout the rest of the US session.
- The upside in T-Notes appeared to be led by the front end with the 2yr taking out Wednesday post-FOMC highs while the upside in stocks was led by the Russell and the Nasdaq.
- However, both S&P and Dow notched decent gains also with broad-based gains seeing the majority of sectors close in the green, aside from Health care and Materials.
- In FX, the Yen and Franc outperformed with Yen still benefiting from the intervention Wednesday night as well as the dovish FOMC, while the Swissy was supported after hotter-than-expected inflation data. Antipodes and CAD also performed well on the risk environment.
- Crude prices ultimately settled flat, falling from peaks in the European morning to lows later on around optimistic updates on the ceasefire/hostage deal proposal with Hamas.
INFLATION BREAKEVENS: 5yr BEI -1.2bps at 2.387%, 10yr BEI -1.2bps at 2.370%, 30yr BEI -0.5bps at 2.347%
REAL RATES: 10Y -- 2.2078%
STOCK SPECIFIC
- Regeneron Pharmaceuticals (REGN) +4%: Ended with gains amid upbeat risk sentiment despite initial weakness after top and bottom line were light and weighed on by weak Dupixent and Eylea sales.
- Qualcomm (QCOM) +9.5%: Strong release, unlike some of its peers such as Qorvo (QRVO); EPS and revenue beat, with next quarter midpoint guidance surpassing expectations.
- eBay (EBAY) -3.5%: Light Q2 top-line outlook.
- Becton Dickinson and Co (BDX) +3%: EPS beat alongside raising FY profit view.
- Fastly (FSLY) -32%: Q2 and FY outlook light, and the CEO said it was "not satisfied with our revenue growth outlook."
- DoorDash (DASH) -10.5%: Slightly deeper loss per share with the next quarter EBITDA midpoint short.
- ETSY (ETSY) -15%: All major metrics missed, albeit not massively, with next quarter gross merchandise sales forecasted to decline more than expected.
- Carvana (CVNA) +33.5%: Adj. EBITDA and revenue smashed through Wall St. consensus.
- Shell (SHEL) +1.5%: Adj. EBITDA and profit beat alongside announcing a new 3.5bln share buyback program.
- Paycom (PAYC) -10.5%: Next quarter and FY outlook underwhelmed.
- Cardinal Health (CAH) +1%: Mixed report; revenue light as was FY25 EPS view, but the bottom line beat and raised FY24 outlook.
- Zoetis (ZTS) +5.5%: Strong report; EPS and revenue beat, alongside raising FY24 operational revenue growth and adj. net income outlook.
- MGM Resorts (MGM) +3%: Top and bottom surpassed expectations.
- Freshworks (FRSH) -19.5%: Cut FY revenue outlook and announced a CEO transition.
- Paramount (PARA) +13%: Sony (SONY) and Apollo (APO) reportedly express interest in buying Paramount for USD 26bln, according to NYT.
- Nordstrom (JWN) +6%: Sycamore
FRIDAY
- Stocks rallied further on Friday after softening US labor market data saw expectations of Fed policy easing increase.
- 175k jobs added (exp. 243k), the slowest pace since October last year, with a soft 0.2% M/M increase in AHE (exp. +0.3%),
- Saw the amount of cuts priced ramp to 50bps at the extremes from 40bps before the data, although has since pared to c. 45bps, with some hawkish Fed Speak (Gooslbee and Bowman) and a mixed ISM Services that followed.
- A lot of the heavy lifting in stocks was done by big tech (NDX +2%, SPX +1.25%, RUT +0.8%) with AAPL surging 6%+ after its better-than-feared report and a USD 110bln buyback announcement taking the stock back above its 100d MA for the first time since mid-February.
- Meanwhile, small caps (RUT) and rate-sensitive names trimmed gains alongside Treasuries.
- The cash 10yr yield nose-dived to a low of 4.45% right after the NFP, but pared around half the move to the 4.50% level later in the session with eyes to next week's refunding auctions, in addition to the falling ISM Services offset by the spike in the Prices Paid component.
- The Dollar index was lower, but also closed well off extremes; antipodes outperformed amid their high beta to US stocks; USD/JPY hit troughs beneath 152, the lowest since early April. Spot gold closed flat at USD 2300/oz after gyrating between lows of USD 2280/oz and a post-data peak of USD 2320/oz.
- Oil prices were sold into the close, with the softening labor market data weighing on the demand outlook while there continues to be constructive reporting around an Israel/Hamas ceasefire, albeit nothing has been agreed upon just yet.
INFLATION BREAKEVENS: 5yr BEI -2.3bps at 2.362%, 10yr BEI -1bp at 2.359%, 30yr BEI +0.3bps at 2.353%.
REAL RATES: 10Y -- 2.147%
STOCK SPECIFIC
- Apple (AAPL) +6%: EPS and revenue topped consensus accompanied by a record USD 110bln share buyback program and lifting quarterly dividend 4%. On AI, said it is making significant investments and looking forward to an exciting product announcement next week, and the WWDC next month.
- Motorola Solutions (MSI) +5%: Profit and revenue beat alongside lifting FY outlook.
- Booking Holdings (BKNG) +3%: Top and bottom line surpassed Wall St. expectations.
- Expedia (EXPE) -15%: Said recent VBRO re-platforming has been slower than anticipated, putting pressure on gross bookings and as such it is lowering top line growth guidance.
- Amgen (AMGN) +12%: EPS and revenue beat alongside announcing it would proceed with its injectable obesity drug into a phase 3 trial.
- DraftKings (DKNG) -2.8%: Q1 metrics disappointed, but the FY outlook impressed.
- Monster Beverage (MNST) +3%: While Q1 metrics were more-or-less in line, it announced a USD 3bln share buyback program.
- Block (SQ) -1%: Strong report; EPS and revenue surpassed expectations alongside lifting outlook.
- Fluor (FLR) -6%: Q1 metrics were light and said it is not providing forward guidance.
- Hershey (HSY) +1%: EPS, revenue, and sales at organic constant FX all exceeded St. consensus.
- Paramount Global (PARA) -7%: Skydance’s proposed deal With Paramount Global (PARA) appears to be falling apart, according to Variety; adding that neither the Sony (SONY) / Apollo (APO) deal or Skydance / RedBird deal are in play.
- Occidental (OXY) -0.4%: Explores sale of Permian assets worth over USD 1bln, according to Reuters sources.
| |
BOND MARKET
CONTROL PACKAGE
There have FIVE charts we have outlined in prior chart packages that we will continue to watch closely as a CURRENT "control set".
- The 10Y TREASURY NOTE YIELD - TNX - HOURLY (CHART LINK)
- The 10Y TREASURY NOTE YIELD - TNX - DAILY (CHART LINK)
- The 10Y TREASURY NOTE YIELD - TNX - WEEKLY (CHART LINK)
- The 30Y TREASURY BOND YIELD - TNX - WEEKLY (CHART LINK)
- REAL RATES (CHART LINK)
FISHER'S EQUATION = 10Y Yield = 10Y INFLATION BE% +REAL % = 2.359% + 2.147% = 4.506%
- The TNX broke through support at its 144 EMA (solid black moving average) on Friday's Labor Report. It appears to have found near term support which it bounced off of.
- The TNX appears to have Momentum support (lower pane) at a long term support trend line.
| |
YOUR DESKTOP / TABLET / PHONE ANNOTATED CHART
Macro Analytics Chart Above: SUBSCRIBER LINK
| |
NOTICE Information on these pages contains forward-looking statements that involve risks and uncertainties. Markets and instruments profiled on this page are for informational purposes only and should not in any way come across as a recommendation to buy or sell in these assets. You should do your own thorough research before making any investment decisions. MATASII.com does not in any way guarantee that this information is free from mistakes, errors, or material misstatements. It also does not guarantee that this information is of a timely nature. Investing in Open Markets involves a great deal of risk, including the loss of all or a portion of your investment, as well as emotional distress. All risks, losses and costs associated with investing, including total loss of principal, are your responsibility.
FAIR USE NOTICE This site contains copyrighted material the use of which has not always been specifically authorized by the copyright owner. We are making such material available in our efforts to advance understanding of environmental, political, human rights, economic, democracy, scientific, and social justice issues, etc. We believe this constitutes a ‘fair use’ of any such copyrighted material as provided for in section 107 of the US Copyright Law. In accordance with Title 17 U.S.C. Section 107, the material on this site is distributed without profit to those who have expressed a prior interest in receiving the included information for research and educational purposes. If you wish to use copyrighted material from this site for purposes of your own that go beyond ‘fair use’, you must obtain permission from the copyright owner.
========
| |
IDENTIFICATION OF HIGH PROBABILITY TARGET ZONES | |
Learn the HPTZ Methodology!
Identify areas of High Probability for market movements
Set up your charts with accurate Market Road Maps
Available at Amazon.com
| |
The Most Insightful Macro Analytics On The Web | | | | |