|
Gordon T Long Research exclusively distributed at MATASII.com
Subscribe to Gordon T Long Research - $35 / Month - LINK
Complete MATASII.com Offerings - $55/Month - LINK
SEND YOUR INSIGHTFUL COMMENTS - WE READ THEM ALL - lcmgroupe2@comcast.net
| |
CURRENT MARKET PERSPECTIVE | |
|
MAJOR EQUITY INDEXES ACHIEVE NEW HIGHS
THE EQUITY FOCUS SHIFTS TO NEXT WEEK'S NVIDIA EARNINGS
Click All Charts to Enlarge
| |
|
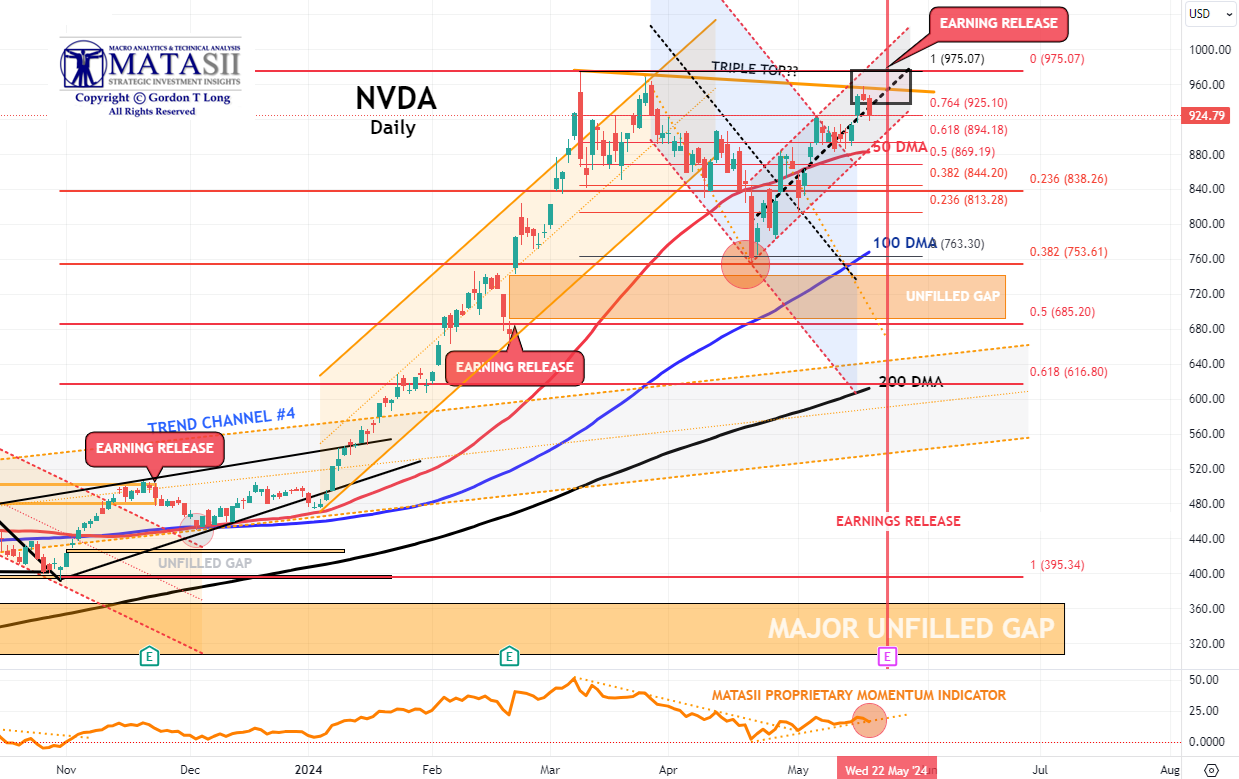
We have been highlighting the above NVDA chart with the Red Box Target highlighted for a couple of weeks. The CPI. PPI and Retail Sales this week have all moved NVDA towards our target. We believe that the Equity market is currently more focused on AI for direction than anything else. Wednesday the 22nd will potentially be a big day for the Equity markets.
NOTE: NVDA SKEW is behaving very different compared to what we saw in mid March. There is much less upside excitement, at least judging by how skew is trading - (SEE SKEW CHART)
As goes NVDA, so goes the MAG-7 - As Goes Mag-7 so goes The Market
| |
1 - SITUATIONAL ANALYSIS | |
|
More recent disappointments have been cheered by the markets reacting to:
“Bad News is Good News!”
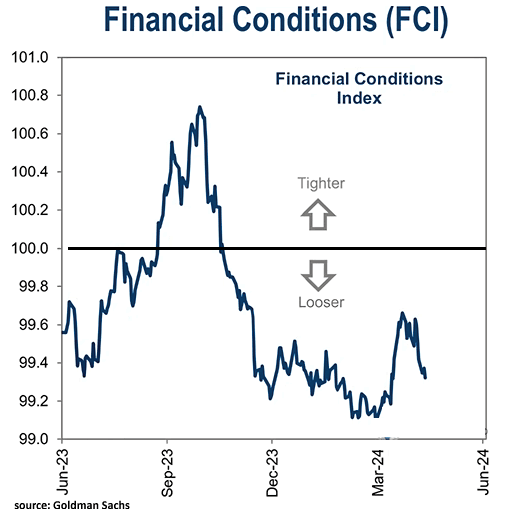
- Currently the extremely loose Financial Conditions index and the turn up in M2 Money Supply is buoying the equity markets.
- Falling Yields due to further weakening CPI and PPI inflation rates are adding a catalyst for the Trade Range markets to want to test their upper boundaries.
- We don’t think that will last in the Intermediate Term.
- The correlation between economic surprise changes and stock returns is negative when equities are focused on the Fed.
- With cracks appearing in the labor market, more below-consensus data will eventually weigh on equities (even though the first cut may be viewed positively), as would a tightening in financial conditions.
CHART RIGHT ABOVE: Financial Conditions, as reported by Goldman Sachs over the last year, show already Loose Financial Conditions are again being loosened.
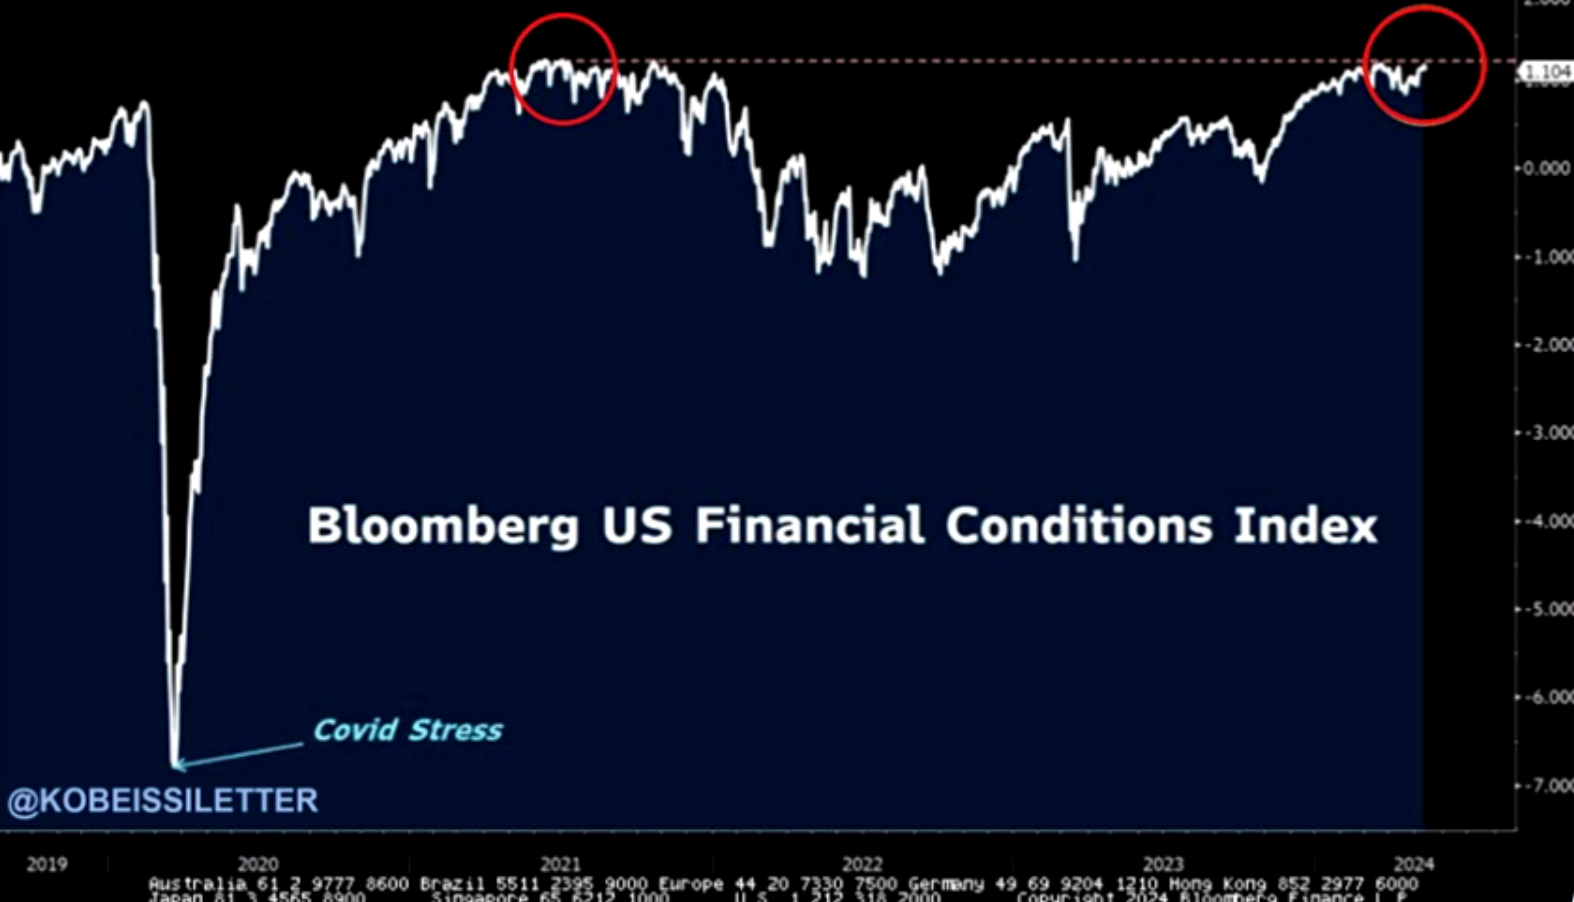
CHART BELOW: Financial Conditions as reported by Bloomberg are now looser than before the Fed started hiking rates.
| |
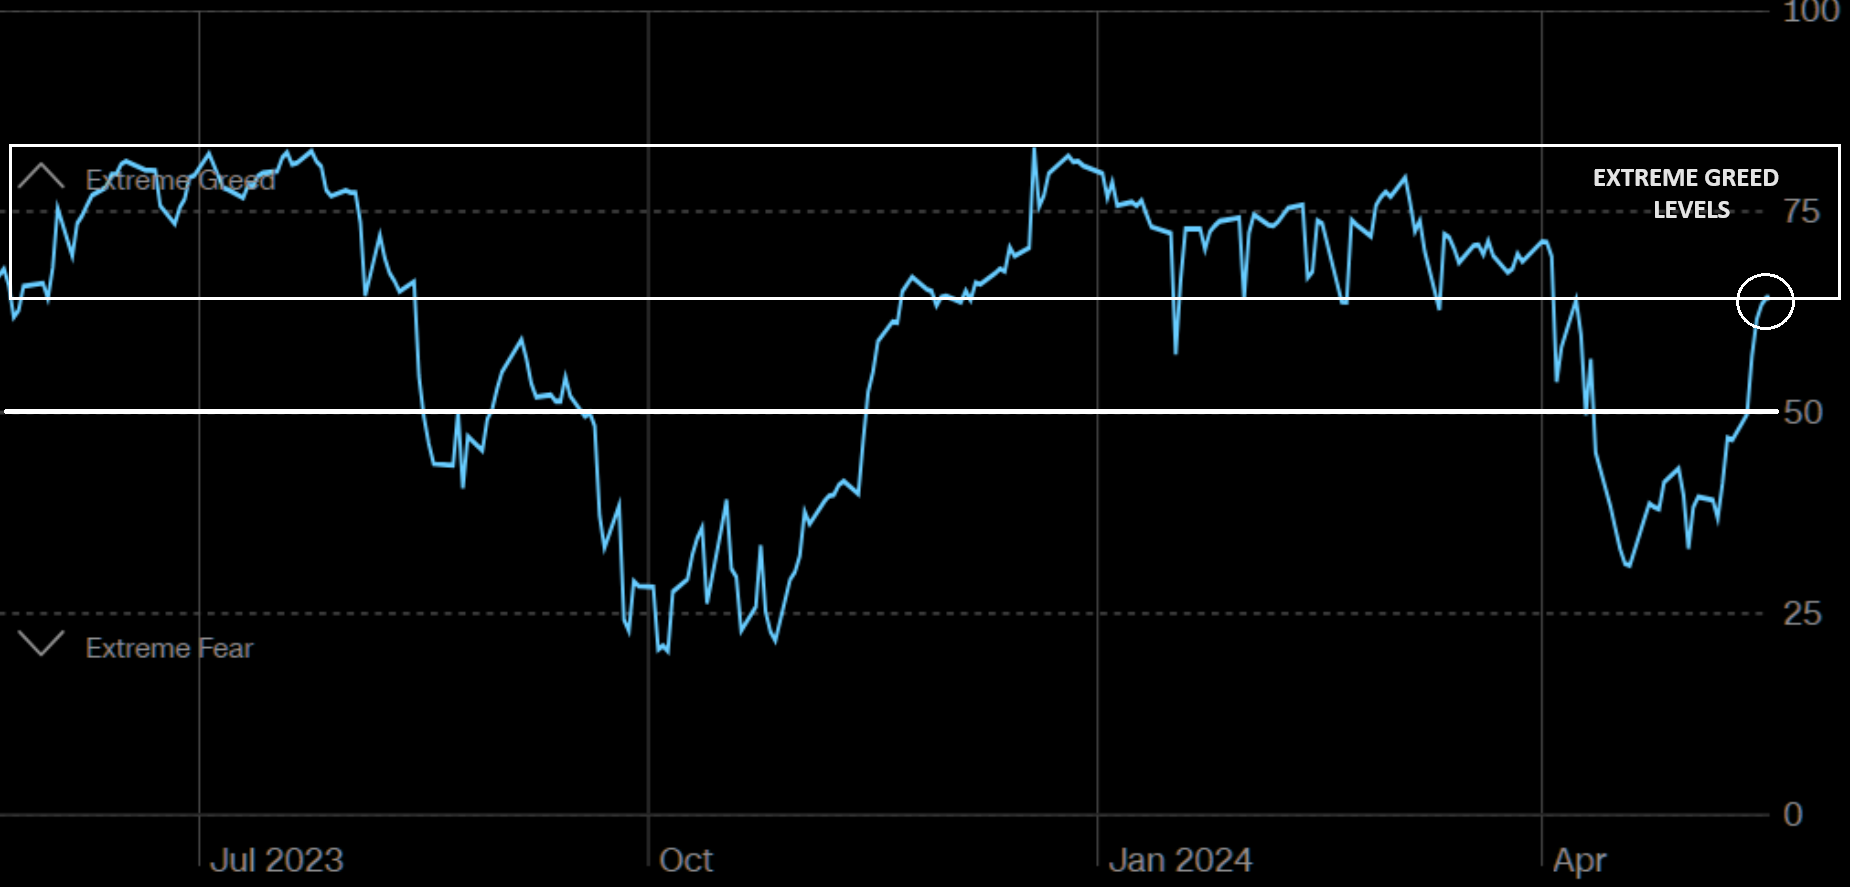
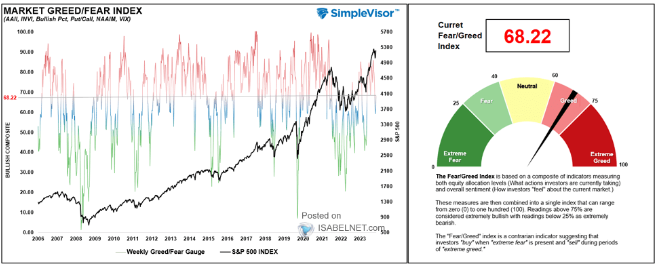
HISTORICAL GREED-FEAR LEVELS (Chart Below) | |
|
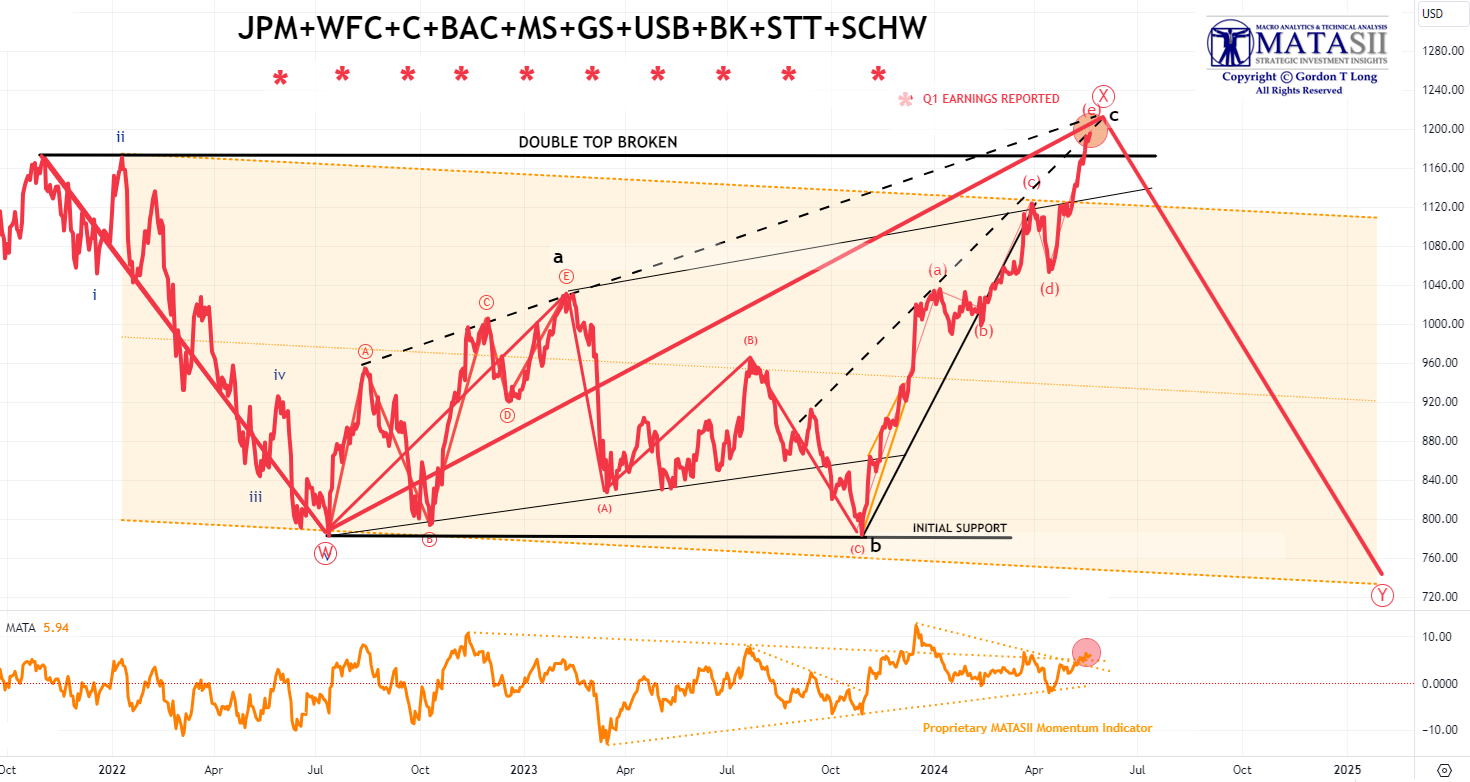
"AS GO THE BANKS, SO GO THE MARKETS"
MATASII BANKING STOCK INDEX
- Bank stocks, though initially weak on earnings release, have been trending up ever since.
- The MATASII Bank Stock Index broke through two overhead resistance trend lines last week before achieving the Double Top, which has subsequently been broken.
- Falling Yields as a result of this week's PPI and CPI pushed the Banking Stocks through their Double Top.
-
A decisive break of this Double Top and markets will head higher. We don't see that and currently expect the completion of the "X" leg (of a "WXY" Zig Zag pattern), as indicated in the chart below. There is still a little more upside to go before this pattern is complete (expand chart to see).
- The MATASII's Proprietary Momentum Indicator (lower pane) has pushed through its overhead resistance trend line.
| |
|
YOUR DESKTOP / TABLET / PHONE ANNOTATED CHART
Macro Analytics Chart Above: SUBSCRIBER LINK
| |
|
OUR GLOBAL MACRO VIEW
- The global recovery story remains very much alive in the hard data. But we continue to be worried about the labor market in the world’s financial debt creation locomotive - the US. We are watching for a break of the critical 4% Unemployment level within the next 90 days.
- A bottom in Chinese asset prices is likely, but a major Credit Impulse to save the global economy is less than a 50% probability. As for China’s real growth, we would not get too excited about this, providing any great support to the EA or EMs this year, beyond any one-shot boost from stimulus and the ongoing apparent stockpiling of commodities.
- Europe's underlying story remains resilient, but the probability of a near-term wobble is rising.
- For global investors, a pincer seems to be closing in. Either US jobs deteriorate further or inflation progress stalls. We are betting on the former, with inflation continuing to slow, though not to 2010s rates. Likely in the ~3% range.
|
 |  |
- Following a steep recovery from 2020 to 2023, we expect oil and gas capex growth to return to a more normalized 4% rate over the next few years, as the pace of investment decisions moderates and the industry becomes less cyclical.
- Alongside this capex moderation, the oil industry has likely entered peak non-OPEC production growth, though LNG should enter a phase of strong volume growth in 2025. All that said, expect consolidation and capital discipline in the energy industry to continue supporting strong profitability, with IRRs of >15%/20% in LNG/oil for this year’s new projects.
- The White House announced tariff increases on US$18bn worth of Chinese goods, including EVs, batteries, solar cells, semiconductors and critical materials. The tariff hikes will take effect this year, apart from semiconductors (in 2025) and non-EV lithium-ion batteries (in 2026). The tariff hike is symbolic and will have a limited economic impact on China, given that the targeted products only account for 4% of its exports to the US and 0.5% of its total exports. Beijing may react with commensurate and symbolic tariff hikes on select US products, but it will maintain a pragmatic approach to mitigating tensions over the medium term, spending more efforts on domestic economic rebalancing and outbound investment.
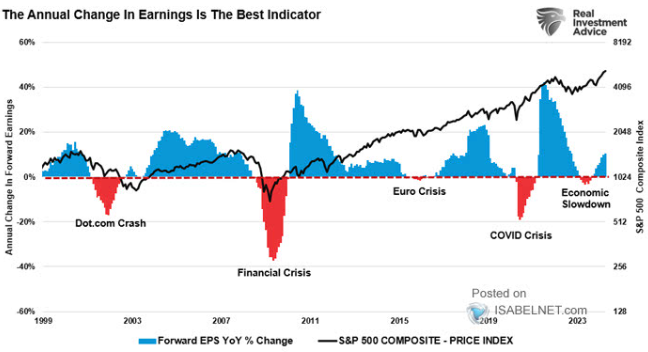
GLOBAL ECONOMIC & EARNINGS GROWTH
21% of countries in the global universe show significant growth upgrades vs only 11% showing downgrades. The Global Growth Momentum is currently quite positive. An increase in forward earnings is normally seen as a positive indicator for higher equity prices and can often mitigate the risk of more serious market corrections.
|  | |
|
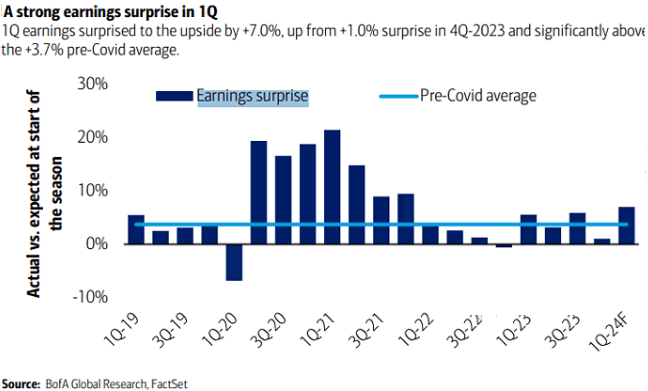
STRONG Q1 EARNINGS SURPRISES
Q1 Earnings surprised to the upside by 7.0%, up from +1.0% surprises in Q4 2023 and significantly above the +3.7%pre-Covid average.
| |  |
|
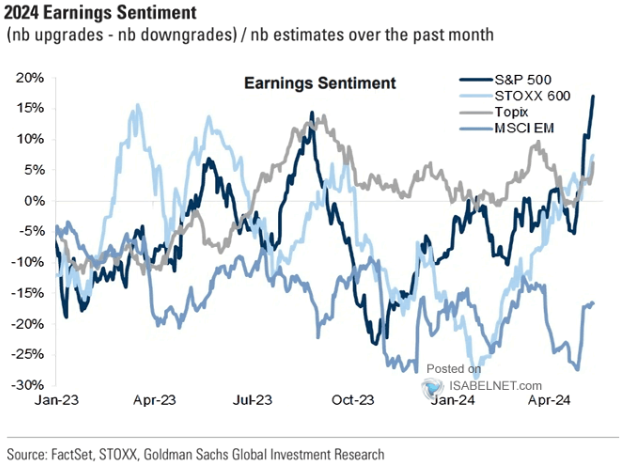
2024 EARNINGS SENTIMENT
Strongly rising.
| | |
|
MARKET DRIVERS
I DON'T EVER RECALL SEEING MORE DOUBLE TOPS!
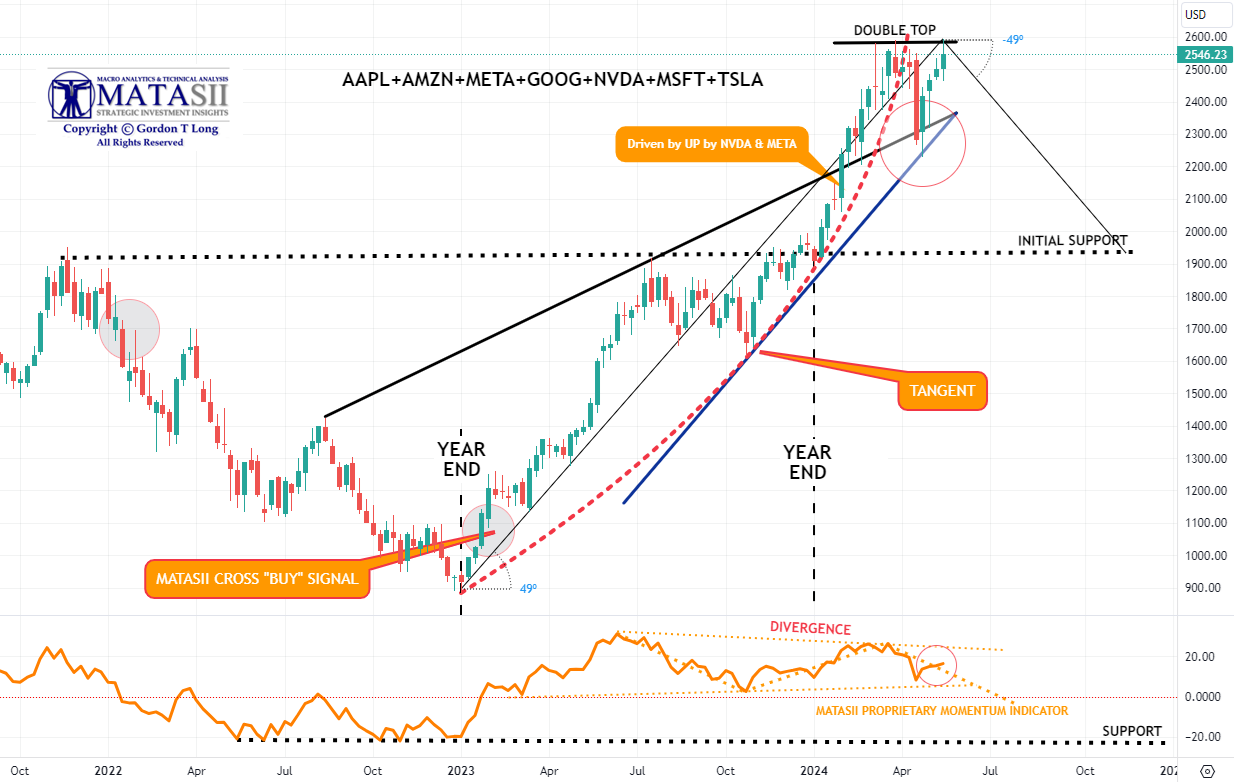
MAGNIFICENT 7
Total CAPEX + R&D for the Magnificent Seven this year is expected to total $348bn, (think about that for a second).
Here’s another way to frame it: the Magnificent 7 is reinvesting 61% of their operating free cash flow back into
CAPEX + R&D!
- We were reaching the vertical lift part of the parabolic (geometric) lift shown by the dashed red line, before falling off and then retracing after the release of the Labor Report last Friday.
-
As of close close Friday we have completed a Double Top. A decisive break and the market is headed higher with the assistance of falling yields. We suspect however we are in a trading range until the NVDA earnings release next Wednesday (May 22nd).
-
In the short term, Momentum (bottom pane) has broken the overhead Momentum trend line resistance level (dotted orange line), which is a positive trigger.
|  | |
YOUR DESKTOP / TABLET / PHONE ANNOTATED CHART
Macro Analytics Chart Above: SUBSCRIBER LINK
| |
|
NVDA - Daily
- NVDA initially broke through the overhead 50 DMA on a retest to reach slightly above the 76.4% Fibonacci Retracement, but more importantly touched its descending trend line to achieve a Triple Top. Normally when this level of Fibonacci is reached a Double Top of prior highs follows. Double Tops normally result in Market Resistance before being possibly broken. Typically they are signs of short to Intermediate Term Tops.
- NVDA Momentum (lower pane) is currently resting on its support trend line (dotted orange trend line).
- This counter rally has been noticeably strong for NVDA as it prepares for its May 22nd Earnings release.
- The pattern is currently suggesting we are in a corrective wave 2 of what may be a downward 5 count.
- With earnings release fast approaching (marked by the red "E" box at the bottom of the pane), this potentially could be a set-up for NVDA to move towards its 100 DMA for support. Even strong earnings could turn out to "disappoint" on potential newly surfacing concerns?
- A strong decisive break of the Double High Top and we are likely to see the Bulls take control of the market!
| |
|
YOUR DESKTOP / TABLET / PHONE ANNOTATED CHART
Macro Analytics Chart Above: SUBSCRIBER LINK
| |
"CURRENCY" MARKET (Currency, Gold, Black Gold (Oil) & Bitcoin) | |
|
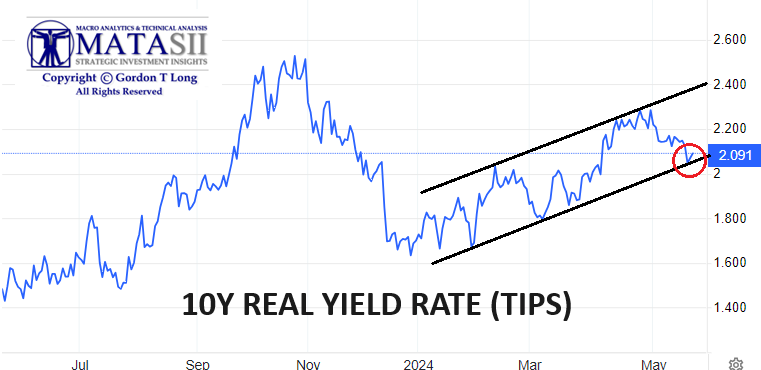
10Y REAL YIELD RATE (TIPS)
Real Rates reached our initial overhead resistance level of 2.25% before falling off hard with last Friday's Labor Report (Chart Right).
This week's Jobless Claims further added to the downward movement to our lower trend line support.
TRADING RANGE: Equity markets reacted
to labor market pressures associated with a weakening Jobs Report (last Friday).
We expected yields & rates to test the lower trend line (chart above right) as we wait on NVDA Earnings potentially changing equity risk premiums.
CONTROL PACKAGE
There are TEN charts we have outlined in prior chart packages, which we will continue to watch closely as a CURRENT Control Set:
-
US DOLLAR -DXY - MONTHLY (CHART LINK)
-
US DOLLAR - DXY - DAILY (CHART LINK)
-
GOLD - DAILY (CHART LINK)
-
GOLD cfd's - DAILY (CHART LINK)
-
GOLD - Integrated - Barrick Gold (CHART LINK)
- SILVER - DAILY (CHART LINK)
-
OIL - XLE - MONTHLY (CHART LINK)
-
OIL - WTIC - MONTHLY - (CHART LINK)
-
BITCOIN - BTCUSD -WEEKLY (CHART LINK)
-
10y TIPS - Real Rates - Daily (CHART LINK)
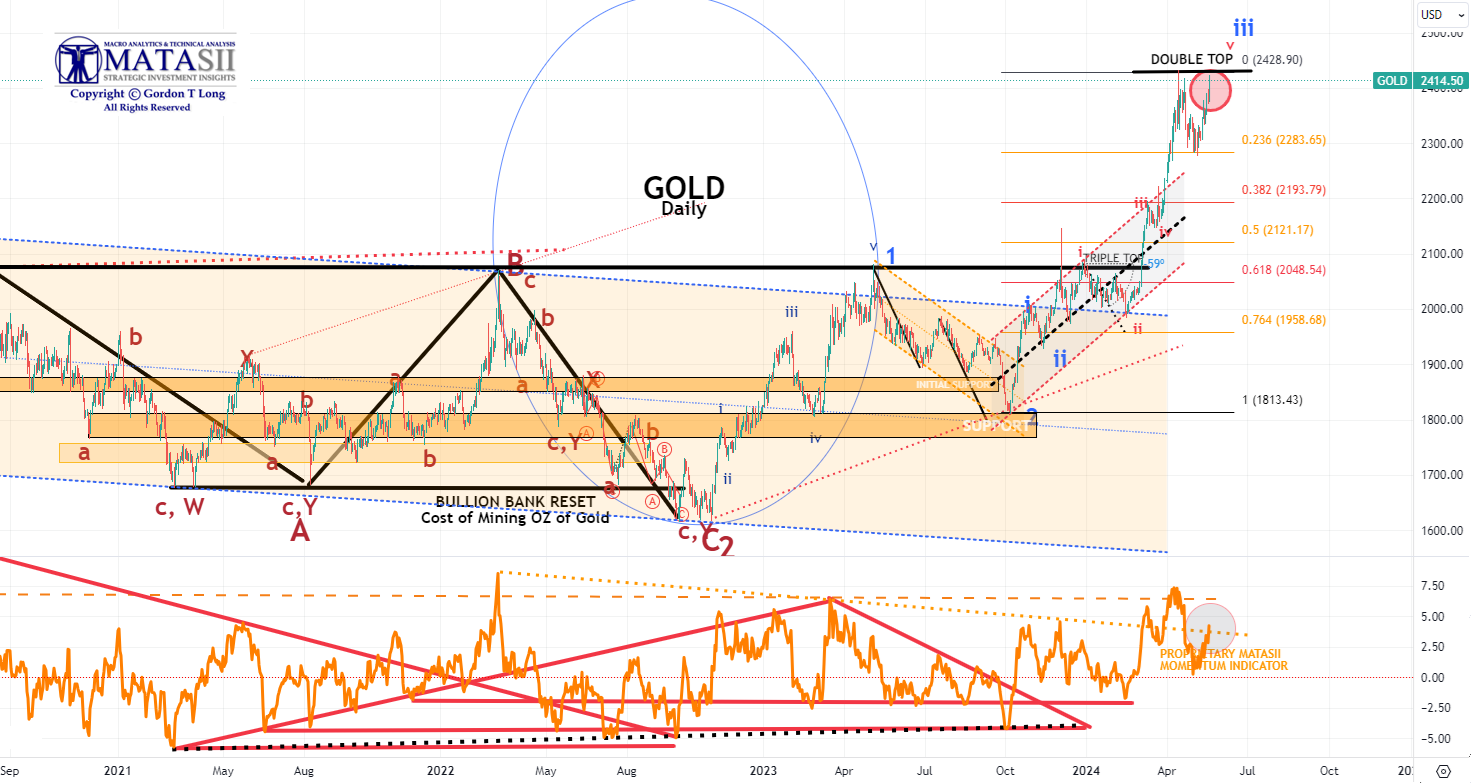
GOLD - DAILY
- Gold surge back to its previous high, putting in a Double Top.
- Gold Momentum (lower pane) found initial overhead resistance at the dotted orange trend line.
- Gold is likely headed towards then upper Momentum resistance shown by the dashed orange line.
|  | |
YOUR DESKTOP / TABLET / PHONE ANNOTATED CHART
Macro Analytics Chart Above: SUBSCRIBER LINK
| |
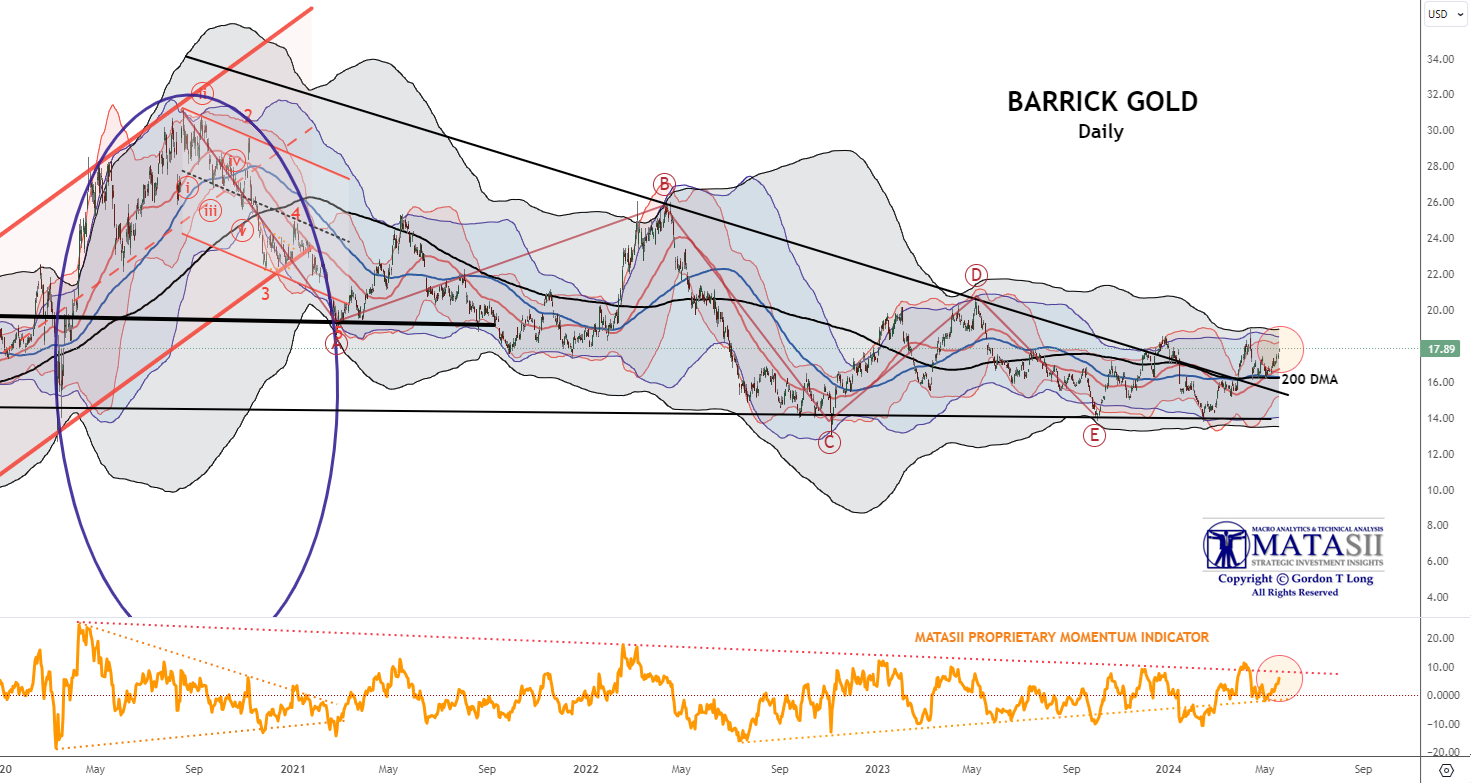
GOLD - INTEGRATED MINERS
Barrick Gold - Daily
Gold stocks have abnormally lagged the gold price - normally gold stocks have a beta of 2X to the gold price. This implies gold miners could be up 45% from current prices. The chase may soon be on?
- After retesting the 200 DMA, Barrick Gold has again surged higher.
- The MATASII Proprietary Momentum Indicator is again approaching its overhead Resistance Trend line.
| |
YOUR DESKTOP / TABLET / PHONE ANNOTATED CHART
Macro Analytics Chart Above: SUBSCRIBER LINK
| |
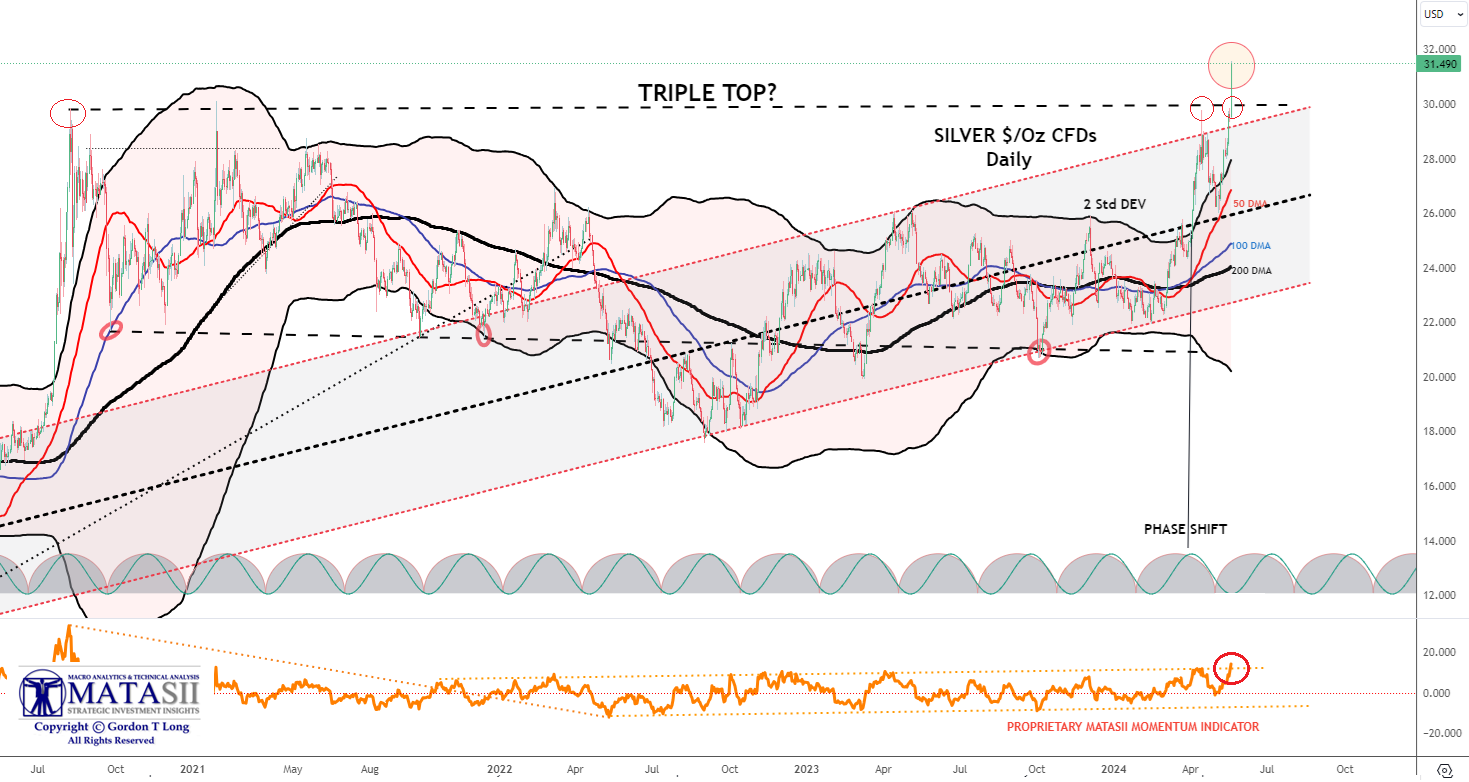
SILVER - Daily
- Silver surged this week through a Triple Top to new highs. This is a very Bullish indication, even if Silver was to temporarily consolidate before heading higher.
- The 50 / 100 / 200 DMAs are widely spread and normally need to be tightened as part of a corrective consolidation before Silver heads higher.
- The MATASII Proprietary Momentum Indicator (lower pane) has also broken through overhead Resistance.
- The pattern suggests Silver (like the Gold Miners) is building for a Short to Intermediate Break-Out.
NOTE: A Fed Pivot to lower rates can be expected to weaken the dollar which is normally Bullish for Precious Metals priced in US Dollars. - The Dollar Weakened this week on weakening Yields.
| |
|
YOUR DESKTOP / TABLET / PHONE ANNOTATED CHART
Macro Analytics Chart Above: SUBSCRIBER LINK
| |
|
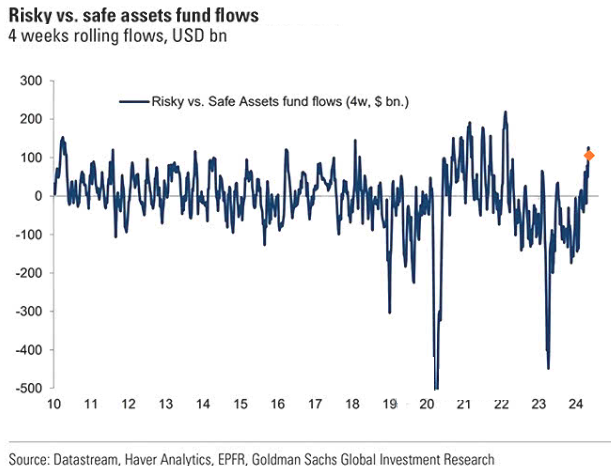
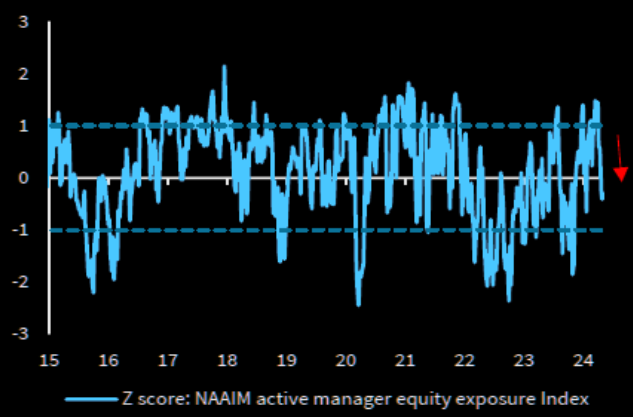
CHART RIGHT: Active managers have generally been reducing risk.
CONTROL PACKAGE
There are FIVE charts we have outlined in prior chart packages that we will continue to watch closely as a CURRENT "control set":
- The S&P 500 (CHART LINK)
- The DJIA (CHART LINK)
- The Russell 2000 through the IWM ETF (CHART LINK)
- The MAGNIFICENT SEVEN (CHART ABOVE WITH MATASII CROSS - LINK)
- Nvidia (NVDA) (CHART LINK)
| |
S&P 500 CFD
- The S&P 500 cfd broke to new highs this week.
- Momentum (lower pane), having bounced off its lower support, moved quickly to an overhead resistance trend line (dotted orange line). Both the MATASII Momentum Indicator and RSI suggest there may be a little more to go on this upward leg in the short term.
- The Moving Averages (50/100/200 DMA) normally needs to narrow and tighten before a further strong lift can occur.
| |
YOUR DESKTOP / TABLET / PHONE ANNOTATED CHART
Macro Analytics Chart Above: SUBSCRIBER LINK
| |
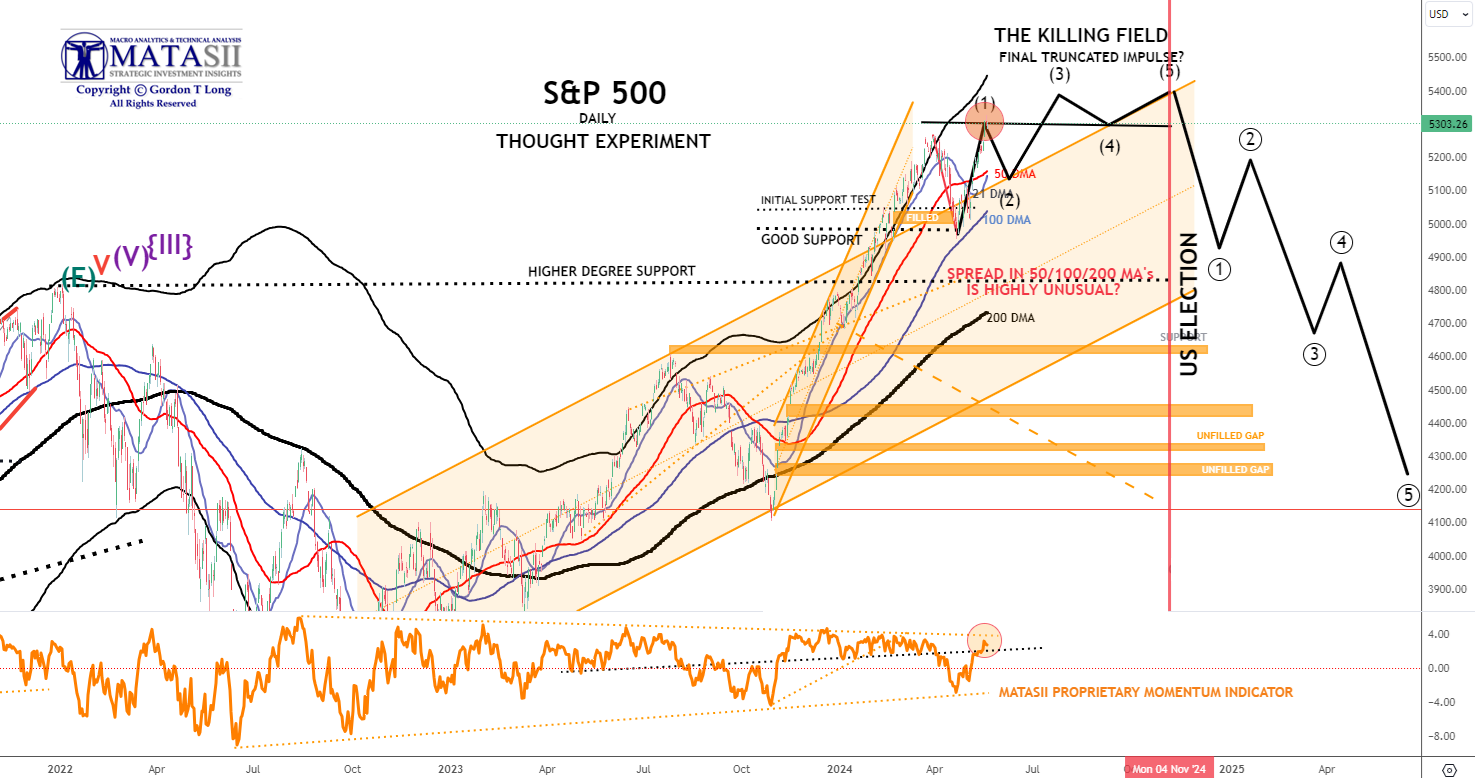
S&P 500 - Daily - Our Thought Experiment
Our Thought Experiment, which we have discussed many times previously in the way of a projection, suggests we have put in a near term top and will now consolidate before possibly completing one final small impulse higher OR put in a final Wave 5 of a higher degree.
NOTE: To reiterate what I previously wrote - "the black labeled activity shown below, between now and July, looks like a "Killing Field" where the algos take Day Traders, "Dip Buyers", the "Gamma Guys" and FOMO's all out on stretchers!"
- The S&P 500 achieved new highs this week on falling Yields.
- Though the lift higher was not strong the EW count suggests a good possibility we have begun a final 5 count higher.
- The 50/100/200 DMA bands are unusually wide and normally markets will need to narrow the gaps in a consolidation / corrective action.
- It will take a major new catalyst to keep the Moving Average bands this separated. That could occur with NVDA earnings on Wednesday.
OUR CURRENT ASSESSMENT IS THAT THE INTERMEDIATE TERM IS LIKELY TO LOOK LIKE THE FOLLOWING: (NOTE - The black projection has not been changed since prior posts so as to serve as a reference.)
|  | |
YOUR DESKTOP / TABLET / PHONE ANNOTATED CHART
Macro Analytics Chart Above: SUBSCRIBER LINK
| STOCK MONITOR: What We Spotted | |
CONTROL PACKAGE
There have FIVE charts we have outlined in prior chart packages that we will continue to watch closely as a CURRENT "control set":
- The 10Y TREASURY NOTE YIELD - TNX - HOURLY (CHART LINK)
- The 10Y TREASURY NOTE YIELD - TNX - DAILY (CHART LINK)
- The 10Y TREASURY NOTE YIELD - TNX - WEEKLY (CHART LINK)
- The 30Y TREASURY BOND YIELD - TNX - WEEKLY (CHART LINK)
- REAL RATES (CHART LINK)
FISHER'S EQUATION = 10Y Yield = 10Y INFLATION BE% +REAL % = 2.32% + 2.091% = 4.411%
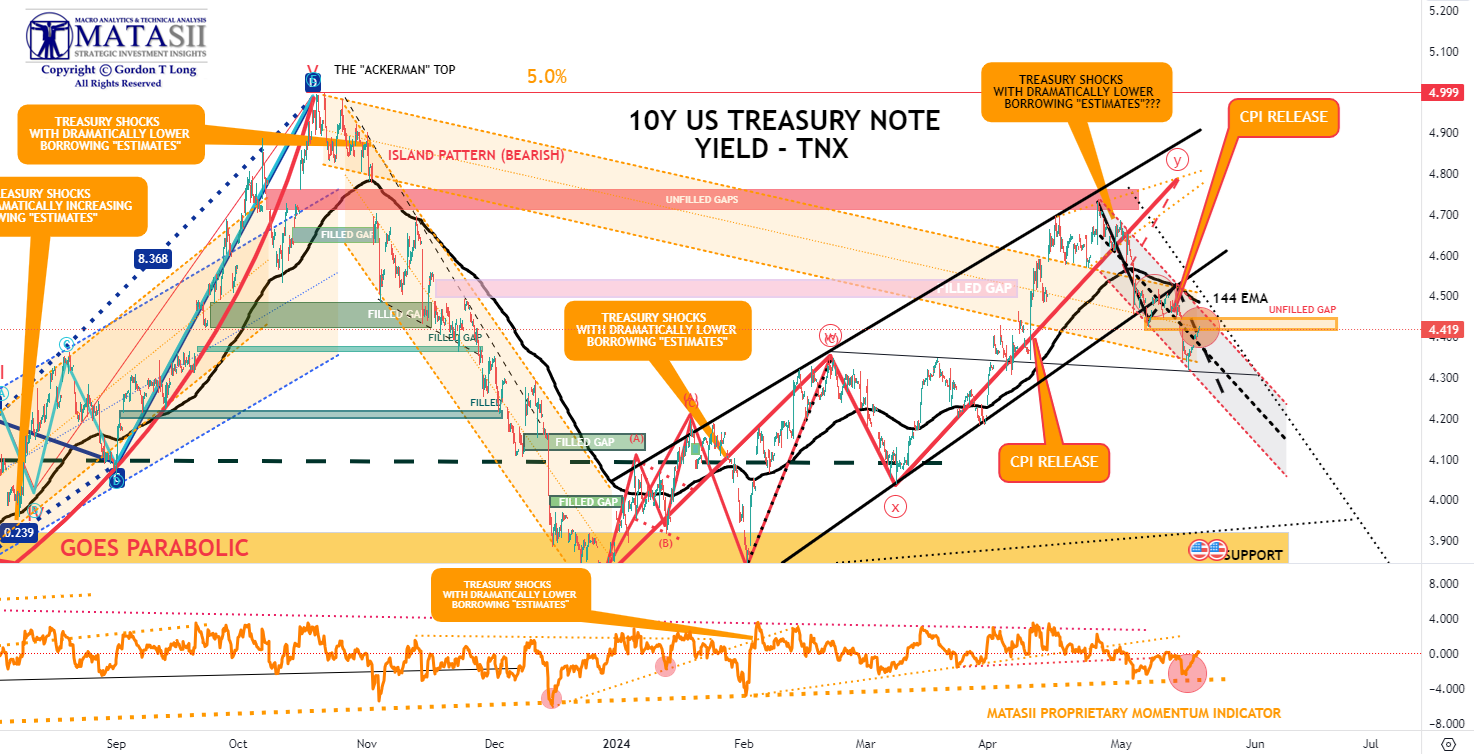
10Y UST - TNX - DAILY
- The TNX has broke downward to find support at a solid black trend line, before bouncing late in the week.
-
It appears to have found potential near term support and likely wants to test overhead support at the 144 EMA and close the unfilled gap.
| |
YOUR DESKTOP / TABLET / PHONE ANNOTATED CHART
Macro Analytics Chart Above: SUBSCRIBER LINK
| |
10Y UST - TNX - WEEKLY
- Yields plunged on the CPI Report but found initial support at the 40 WMA before bouncing to retest overhead resistance at the 50 DMA.
- Yields at Momentum Support (dotted black line in lower pane) with overhead resistance slightly above.
| |
YOUR DESKTOP / TABLET / PHONE ANNOTATED CHART
Macro Analytics Chart Above: SUBSCRIBER LINK
| |
NOTICE Information on these pages contains forward-looking statements that involve risks and uncertainties. Markets and instruments profiled on this page are for informational purposes only and should not in any way come across as a recommendation to buy or sell in these assets. You should do your own thorough research before making any investment decisions. MATASII.com does not in any way guarantee that this information is free from mistakes, errors, or material misstatements. It also does not guarantee that this information is of a timely nature. Investing in Open Markets involves a great deal of risk, including the loss of all or a portion of your investment, as well as emotional distress. All risks, losses and costs associated with investing, including total loss of principal, are your responsibility.
FAIR USE NOTICE This site contains copyrighted material the use of which has not always been specifically authorized by the copyright owner. We are making such material available in our efforts to advance understanding of environmental, political, human rights, economic, democracy, scientific, and social justice issues, etc. We believe this constitutes a ‘fair use’ of any such copyrighted material as provided for in section 107 of the US Copyright Law. In accordance with Title 17 U.S.C. Section 107, the material on this site is distributed without profit to those who have expressed a prior interest in receiving the included information for research and educational purposes. If you wish to use copyrighted material from this site for purposes of your own that go beyond ‘fair use’, you must obtain permission from the copyright owner.
========
| |
IDENTIFICATION OF HIGH PROBABILITY TARGET ZONES | |
Learn the HPTZ Methodology!
Identify areas of High Probability for market movements
Set up your charts with accurate Market Road Maps
Available at Amazon.com
| |
The Most Insightful Macro Analytics On The Web | | | | |