SHARE:  
MATASII-Logo-33 image


Follow FREE Research at MATASII.com


PUBLIC EDITION


Any Problems? Notify:  lcmgroupe2@comcast.net


RESEARCH MAILING -- CHANGES / SIGNUP


View Newsletter in Browser (To Archive or Print)

Gordon T Long Research exclusively distributed at MATASII.com

Subscribe to Gordon T Long Research - $35 / Month - LINK

Complete MATASII.com Offerings - $55/Month - LINK


SEND YOUR INSIGHTFUL COMMENTS - WE READ THEM ALL - lcmgroupe2@comcast.net

CURRENT MARKET PERSPECTIVE


AAPL OFFICIALY PART OF AI TRIUMVIRATE

FRENCH DEBT CREATES STORM CLOUDS OVER EU DEBT


Click All Charts to Enlarge

Gords-DeskTop-06-14-24-AAPL-Weekly-2 image

AAPL EXPLODES OUT OF TRADING RANGE - AAPL exploded out of its trading range as its aggressive buyback program continues. The Price lift is seen as a vote of confidence that AAPL has officially become a sustainable part of the AI Triumvirate leadership along with Nvidia & Microsoft.

1 - SITUATIONAL ANALYSIS


BANKING TROUBLES IN EUROPE!

French President Emmanuel Macron's decision to abruptly call a national election in two weeks based on the serious blow inflicted from last week's EU election appears to have backfired on him. The EU Bond market suddenly borders on crisis as French-German Bonds spreads have exploded higher on fear of a potential Socialist French Parliament not interested in abiding by the 3% Debt-to-GDP EU Governance Rule. It will be a very busy weekend in EU Banking circles.

  • French ETF's (EWQ) have been gaping lower and lower. This is at the most oversold levels since Sept 2022.
  • European banks (SX7E) have become very oversold almost immediately.


CHART TOP RIGHT: The Fear & Greed Index has dropped quickly to 38! Is it reflecting, though knowing something is terribly wrong, a fear of missing out (FOMO) on the rally continuing?


CHART BOTTOM RIGHT: The BoA Bear-Bull Indicator is at the highest levels in awhile. Still not yet a "clear" contrarian sell, but it is getting there!


CHART BELOW: BoA's Global Risk-Love Indicator stands at 92 percentile and suggests investors exercise caution and focus on managing Risk.

LONGWave-06-12-24-JUNE-The-Great-Debt-for-Equity-Swap-Newsletter-2-Fear-Greed-Index-2 image
LONGWave-06-12-24-JUNE-The-Great-Debt-for-Equity-Swap-Newsletter-2-Bull-Bear-Ratio image
LONGWave-06-12-24-JUNE-The-Great-Debt-for-Equity-Swap-Newsletter-2-Global-Risk-Love-Indicator image

The crowd is very long and in need of downside protection. We are seeing skew catch rather aggressive "bids".

LONGWave-06-12-24-JUNE-The-Great-Debt-for-Equity-Swap-Newsletter-2-SP-500-v-SKEW image

The average percentile of 16 different equity focused sentiment indicators though not at all time highs is elevated especially against a longer term weakening trend.

LONGWave-06-12-24-JUNE-The-Great-Debt-for-Equity-Swap-Newsletter-2-Average-of-16-Sentiment-Indicators image

"AS GO THE FINANCIALS, SO GO THE BANKS: AS GO THE BANKS, SO GO THE MARKETS"


MATASII FINANCIAL STOCK INDEX


We continue to keep an eye on both the Bank and Financial stocks to give us an early signal of market direction. We have been showing the banks over the last few weeks, but the Financials now appear to be giving a clearer signal.


  • The MATASII Financial Index stocks has begun to exhibit a potential continuation triangle pattern.
  • The Elliott Wave analysis supports an "E" wave higher as part of a potential ABCDE pattern.
  • Momentum (bottom pane) has found long term support and needs to be watched to see if it breaks shorter term overhead resistance, shown by a dotted descending orange momentum trend line.
Gords-DeskTop-06-14-24-MATASII-Financial-Index-Daily image

YOUR DESKTOP / TABLET / PHONE ANNOTATED CHART

Macro Analytics Chart Above:  SUBSCRIBER LINK

2 - FUNDAMENTAL ANALYSIS


FORWARD PE'S & EPS


Should we believe the 12 Month Forward Earnings per Share estimates, remembering that it is all based on a cap weighted S&P 500 driven by the Magnificent Seven? Especially as the Magnificent Seven is increasingly driven by three component stocks (Apple, Nvidia and Microsoft) all hinging their net growth outlooks on AI? That may not be outright gambling, but then it is not prudent investing - it is better termed speculation!

LONGWave-06-12-24-JUNE-The-Great-Debt-for-Equity-Swap-Newsletter-2-SP-500-PE-and-EPS-12M-Forward image

LIQUIDITY


We are seeing a less supportive liquidity trend picture for equities when we define it as (Bank Deposits +MMMF) /(Bank Loans Ex-Real Estate + Commercial Paper). As you would expect, VIX tends to rise when liquidity tightens - which it has.

LONGWave-06-12-24-JUNE-The-Great-Debt-for-Equity-Swap-Newsletter-2-SB-Liquidity-Index image

S&P 500 vs FED BANK RESERVES


There are two glaring problems with the chart below:


  1. The "Jaws-of-Death" will be closed at some point.
  2. We have a major Divergence which is always a warning to be taken seriously!
LONGWave-06-12-24-JUNE-The-Great-Debt-for-Equity-Swap-Newsletter-2-SP-500v-Fed-Reserves image

DOW THEORY


In last week's Newsletter we outlined our growing concerns with the Trannies within the DOW Theory (LINK). The gap between Transports and SPY is only getting wider and wider. Is tech so powerful that we can dismiss from "all" PROVEN old relationships? NOTE: More Divergence!

LONGWave-06-12-24-JUNE-The-Great-Debt-for-Equity-Swap-Newsletter-2-DOW-Theory-Trannies image

3 - TECHNICAL ANALYSIS.

MARKET DRIVERS


As goes NVDA, so goes the MAG-7, As Goes Mag-7 so goes The Market.

LONGWave-06-12-24-JUNE-The-Great-Debt-for-Equity-Swap-Newsletter-2-NVDA-Revenue-Revisions-2 image

NVDA - Daily


CHART RIGHT: NVDA stock Y-o-Y% change tracks the growth rate of revenue & EBITDA revisions. Both look to have peaked (Revenue shown to the Right)?


  • NVDA continues to reach for new highs!.
  • NVDA's lift this week pushed through the pre-split upper channel boundary trend line which now aligns with the black dotted rising mid-channel trend line shown below.
  • The Dotted Black Trend line in the MATASII Proprietary Momentum Indicator (lower pane below) is suggesting a potential Divergence has been set up. This is normally seen as a warning to the downside that is ahead if the Divergence isn't removed by a movement higher in Momentum.
  • At some point the major unfilled gaps (at much lower levels) must be filled. NVDA therefore may no longer become a Short to Intermediate Long Term hold, but rather a position trading stock as others entering the space and force margins to contract. 
Gords-DeskTop-06-14-24-NVDA-Daily image

YOUR DESKTOP / TABLET / PHONE ANNOTATED CHART

Macro Analytics Chart Above:  SUBSCRIBER LINK

UnderTheLens-JUNE-05-22-24-Election-Economics-Newsletter-2-Mag-7-Market-Cap-as-Percentage-of-SP-500 image

MAGNIFICENT 7


Magnificent 7 is up a magnificent 24% YTD (chart right), contributing >50% of SPX return (NVDA alone = 25%) as monopolistic mega tech monopolizes performance..


Total CAPEX + R&D for the Magnificent Seven this year is expected to total $348bn. (Think about that for a second.)

Here’s another way to frame it - the Magnificent 7 is reinvesting 61% of their operating free cash flow back into

CAPEX + R&D!


  • The basket of 'Magnificent 7' stocks soared for the 7th week in the last 8 (and the best week in the last 8) before pulling back ever so slightly at Friday's close.
  • We continue to be concerned about the momentum Divergence signal that has been occurring for some time (bottom pane). Continued caution advised.
UnderTheLens-03-27-24-APRIL-The-Future-Is-Coming-Into-Focus-Newsletter-2-Subscribers-Only image

YOUR DESKTOP / TABLET / PHONE ANNOTATED CHART

Macro Analytics Chart Above:  SUBSCRIBER LINK

"CURRENCY" MARKET (Currency, Gold, Black Gold (Oil) & Bitcoin)

Gords-DeskTop-06-12-24-10Y-REAL-RATES-Daily image

10Y REAL YIELD RATE (TIPS)


Real Rates reached our initial overhead resistance level of 2.25% before falling off hard as part of our expected "X" leg lower (chart right). Wednesday's CPI pushed real rates towards previous lows.

UnderTheLens-JUNE-05-22-24-Election-Economics-Newsletter-3-TIPS-Gold-Divergence image

CONTROL PACKAGE


There are TEN charts we have outlined in prior chart packages, which we will continue to watch closely as a CURRENT Control Set:


  1. US DOLLAR -DXY - MONTHLY (CHART LINK)
  2. US DOLLAR - DXY - DAILY (CHART LINK)
  3. GOLD - DAILY (CHART LINK)
  4. GOLD cfd's - DAILY (CHART LINK)
  5. GOLD - Integrated - Barrick Gold (CHART LINK)
  6. SILVER - DAILY (CHART LINK)
  7. OIL - XLE - MONTHLY (CHART LINK)
  8. OIL - WTIC - MONTHLY - (CHART LINK)
  9. BITCOIN - BTCUSD -WEEKLY (CHART LINK)
  10. 10y TIPS - Real Rates - Daily (CHART LINK)


GOLD - DAILY


  • Gold continues to weaken as inflation pressures weaken and yields fall.
  • The Elliott Wave count still suggests a strong likelihood of a minimum retracement of 38.2% and the 100 DMA.
  • Momentum support (lower pane) shows gold has found an important support line. it should be noted there is another longer duration trend support slightly lower (dotted black line).
  • Though the MATASII CROSS has given an initial SELL signal on the Daily chart, we caution it may be short lived!
Gords-DeskTop-06-14-24-GOLD-Daily image

YOUR DESKTOP / TABLET / PHONE ANNOTATED CHART

Macro Analytics Chart Above:  SUBSCRIBER LINK

US EQUITY MARKETS

LONGWave-06-12-24-JUNE-The-Great-Debt-for-Equity-Swap-Newsletter-2-SP-500-Trading-Range-Break-Out image

CHART RIGHT: Is the market finally ready for a break out? Low volume pre-summer vacation break-out moves can be "frustrating".


CONTROL PACKAGE


There are FIVE charts we have outlined in prior chart packages that we will continue to watch closely as a CURRENT "control set":


  1. The S&P 500 (CHART LINK)
  2. The DJIA (CHART LINK)
  3. The Russell 2000 through the IWM ETF (CHART LINK)
  4. The MAGNIFICENT SEVEN (CHART ABOVE WITH MATASII CROSS - LINK)
  5. Nvidia (NVDA) (CHART LINK)

S&P 500 CFD


  • The S&P 500 cfd rose aggressively this week through its long term upper trend channel boundary line. (NOTE: see Thought Experiment note below.)
  • However, the MATASII Proprietary Momentum Indicator (middle pane) appears to be showing signs of weakening within a Divergence pattern with price and stopped by its overhead momentum resistance trend line.
  • We also have an excess RSI level, though it could go slightly higher and sustain itself in the near term.
Gords-DeskTop-06-14-24-SP-500-cfd-Daily image

YOUR DESKTOP / TABLET / PHONE ANNOTATED CHART

Macro Analytics Chart Above:  SUBSCRIBER LINK

S&P 500 - Daily - Our Thought Experiment


OUR CURRENT ASSESSMENT IS THAT THE INTERMEDIATE TERM IS LIKELY TO LOOK LIKE THE FOLLOWING


NOTE: To reiterate - "the black labeled activity shown below, between now and July, looks like a "Killing Field", where the algos take Day Traders, "Dip Buyers", the "Gamma Guys" and FOMO's all out on stretchers!"


  • The S&P just hit a new all time high this week.
  • However, the MATASII Proprietary Momentum Indicator appears to be showing signs of weakening (lower pane) with firm support quite a bit lower.
  • The Divergence in Momentum (lower pane) needs to be noted along with a clear long term ending wedge.
UnderTheLens-03-27-24-APRIL-The-Future-Is-Coming-Into-Focus-Newsletter-2-Subscribers-Only image

YOUR DESKTOP / TABLET / PHONE ANNOTATED CHART

Macro Analytics Chart Above:  SUBSCRIBER LINK

S&P 500 - Monthly - Our Thought Experiment


  • We continue to move towards our target of 5540 shown here and on our daily chart (above).
Gords-DeskTop-06-14-24-SPX-Weekly-Thought-Experiment image

YOUR DESKTOP / TABLET / PHONE ANNOTATED CHART

Macro Analytics Chart Above:  SUBSCRIBER LINK

STOCK MONITOR: What We Spotted


UnderTheLens-03-27-24-APRIL-The-Future-Is-Coming-Into-Focus-Newsletter-2-Subscribers-Only image

BOND MARKET

UnderTheLens-JUNE-05-22-24-Election-Economics-Newsletter-4-Loose-Financial-Conditions-Index image

CONTROL PACKAGE


Remember when "developed world" central banks pretended their inflation target was 2%? Well, that lie died a miserable death today - and will do so again for good measure tomorrow - after the BOC cut rates for the first time in 4 years, and less than a year after its last rate hike, from 5.0% to 4.75% even as Canada's inflation remains a very sticky 2.7%.


And just to underscore the death of the 2% inflation target, tomorrow the ECB will also cut rates for the first time since March 2016, (and 8 months after the last rate hike), even though core Eurozone CPI remains 3%.


Of course, despite all the posturing, the Fed won't be far behind especially once it becomes clear that the myth of strong US job growth was just a mirage, and either in July or September, the Fed will join the party despite core US inflation stuck at a blistering 2.8%.


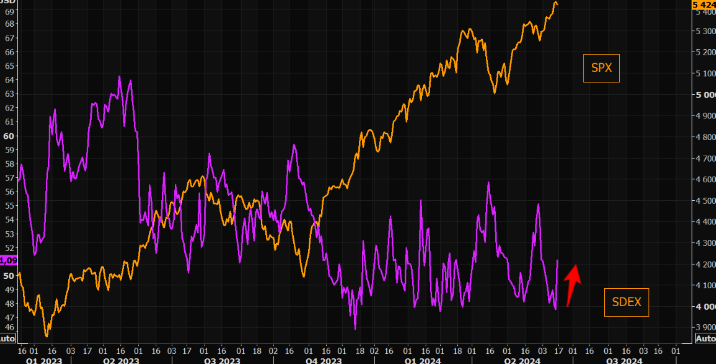
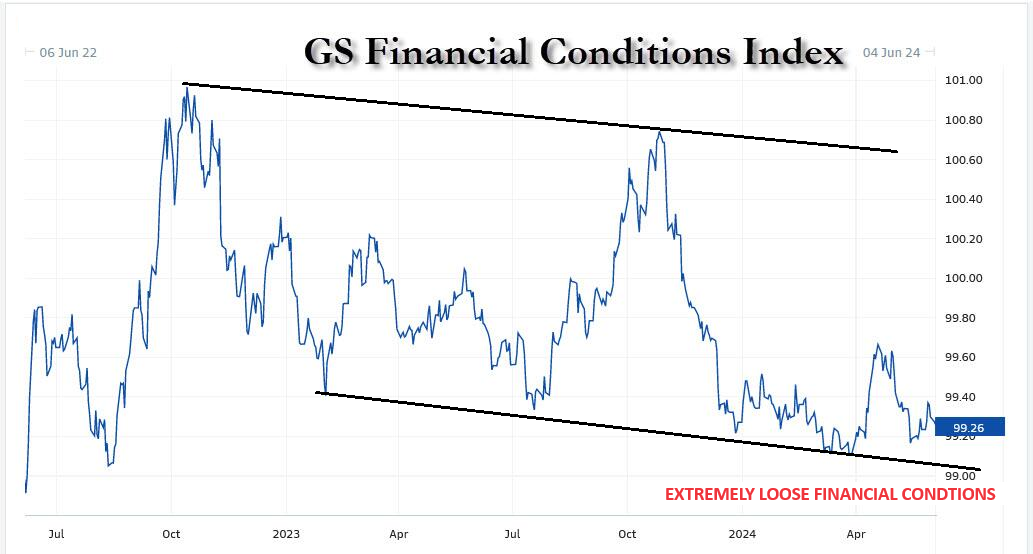
It was this long overdue realization that the G7 central banks have officially raised their inflation target by about 1% that helped pushed bond yields to fresh two month lows, and down more some 35bps in just the past week, down for a 5th straight day as financial conditions have eased dramatically (see chart of Goldman Financial Conditions Index above), undoing any jawboned tightening the Fed tried to inject into the market in recent months: indeed, the latest rate pricing shows a sharp dovish shift in the Fed cut narrative for Sept, rising to 80% vs 45% just one week ago. As Goldman's trader notes, CTAs will become a focus if yields keep moving lower. -- Tyler Durden


There are FIVE charts we have outlined in prior chart packages that we will continue to watch closely as a CURRENT "control set":


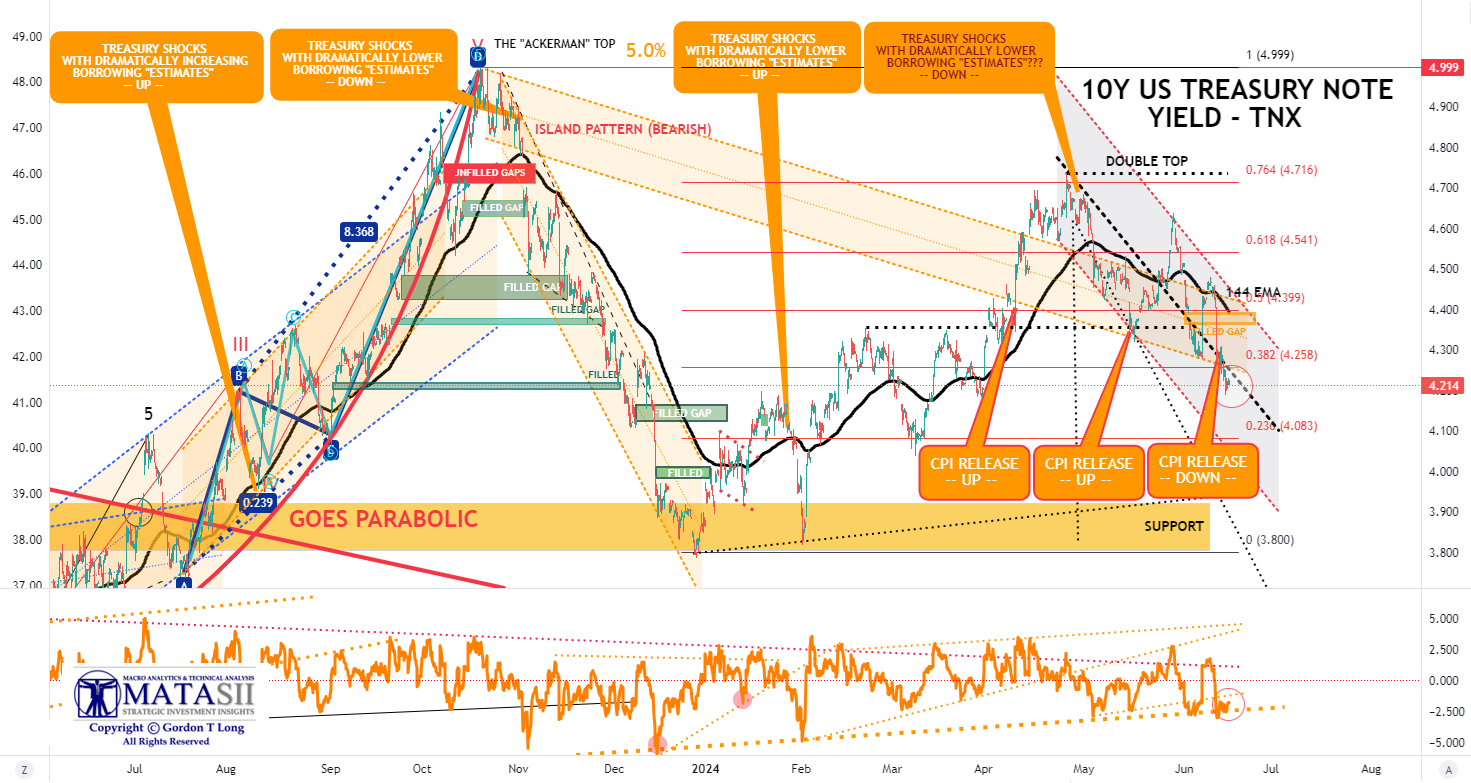
  1. The 10Y TREASURY NOTE YIELD - TNX - HOURLY (CHART LINK)
  2. The 10Y TREASURY NOTE YIELD - TNX - DAILY (CHART LINK)
  3. The 10Y TREASURY NOTE YIELD - TNX - WEEKLY (CHART LINK)
  4. The 30Y TREASURY BOND YIELD - TNX - WEEKLY (CHART LINK)
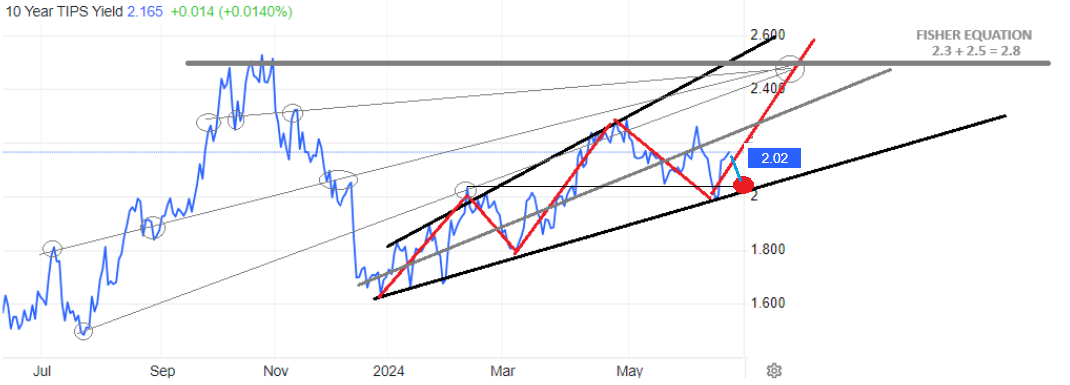
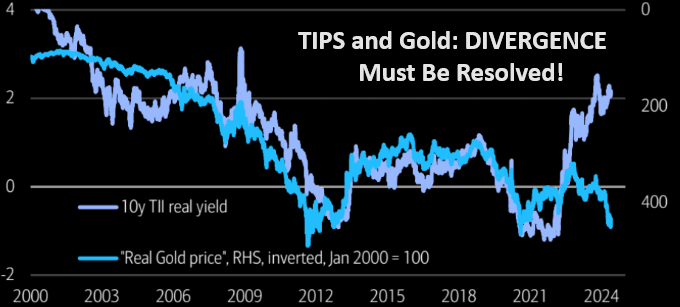
  5. REAL RATES (CHART LINK)


FISHER'S EQUATION = 10Y Yield = 10Y INFLATION BE% +REAL % = 2.188% + 2.031% = 4.219%


3YR AUCTION: The US sold USD 53bln of 3yr notes at a high yield of 4.559%, tailing the When Issued by 1.1bps, much larger than the six auction average of a tail of 0.1bps and prior stop-through of 0.3bps. The B/C was also weak at 2.43x, beneath the 2.63x prior and 2.57 six auction average. The soft reception was led by a drop in direct demand which came in beneath the prior average, but indirect demand was relatively stable at 64%, albeit not enough to offset the drop in direct demand, seeing dealers take a chunky 20% of the auction. The soft 3yr auction added to the soft 2yr, 5yr, and 7yr supply recently, with participants perhaps sitting on the sidelines ahead of key risk events like the US CPI and FOMC on Wednesday.


10-YEAR REVIEW: A very strong 10-year note auction. The US sold USD 39bln of 10yr notes at a high yield of 4.438%, stopping through the 4.458% WI by 2bps vs the prior and six auction averages of a tail of 1.1bps, also showing the largest stop-through since February 2023. The B/C of 2.67x was also stronger than the prior and six auction average of c. 2.50x. The breakdown of bidders saw a huge increase in indirect demand, rising to 74.6% from 65.5%, well above the 65.4% average. Direct demand dipped to 13.8% from 18.7%, falling beneath the 17.53% average, but the huge Indirect takedown saw dealers (forced surplus buyers) left with just 11.6% of the auction, beneath the 15.7% prior and 17.03% average. The strong 10-year note auction is on the heels of a slew of disappointing short-end and belly auctions, perhaps with uncertainty around the Fed/inflation keeping participants on the sidelines in the more Fed-exposed part of the curve and opting for longer-dated supply instead. The strong demand comes despite the huge event risk on Wednesday - which tends to see buyers take a step back - with both US CPI and the FOMC rate decision with accompanying Dot Plots due. There is the 30-year Bond auction on Thursday too, post Fed and CPI. Note, that analysts also highlight with bond volatility at the low end of multi-year ranges. It is likely that supported some buyers to step in.

10Y UST - TNX - Hourly


  • The TNX plunged on the release of the My CPI finding support again at the descending long term trend channel's lower boundary line.
  • Importantly in the near term is that Momentum (lower pane) appears to have reached a longer term support level.
Gords-DeskTop-06-14-24-TNX-Hourly image

YOUR DESKTOP / TABLET / PHONE ANNOTATED CHART

Macro Analytics Chart Above:  SUBSCRIBER LINK

NOTICE Information on these pages contains forward-looking statements that involve risks and uncertainties. Markets and instruments profiled on this page are for informational purposes only and should not in any way come across as a recommendation to buy or sell in these assets. You should do your own thorough research before making any investment decisions. MATASII.com does not in any way guarantee that this information is free from mistakes, errors, or material misstatements. It also does not guarantee that this information is of a timely nature. Investing in Open Markets involves a great deal of risk, including the loss of all or a portion of your investment, as well as emotional distress. All risks, losses and costs associated with investing, including total loss of principal, are your responsibility.


FAIR USE NOTICE  This site contains copyrighted material the use of which has not always been specifically authorized by the copyright owner. We are making such material available in our efforts to advance understanding of environmental, political, human rights, economic, democracy, scientific, and social justice issues, etc. We believe this constitutes a ‘fair use’ of any such copyrighted material as provided for in section 107 of the US Copyright Law. In accordance with Title 17 U.S.C. Section 107, the material on this site is distributed without profit to those who have expressed a prior interest in receiving the included information for research and educational purposes.  If you wish to use copyrighted material from this site for purposes of your own that go beyond ‘fair use’, you must obtain permission from the copyright owner.

========

OUR LATEST BOOK
IDENTIFICATION OF HIGH PROBABILITY TARGET ZONES


Learn the HPTZ Methodology!
Identify areas of High Probability for market movements
Set up your charts with accurate Market Road Maps

Available at Amazon.com
More Details at MATASII.COM


The Most Insightful Macro Analytics On The Web
Email Us
Twitter  Youtube  
LinkedIn Share This Email