|
CoCoRaHS
FLORIDA
A Community Collaborative
Rain, Hail & Snow Network
| |
|
Greetings from the Coordinators, | |
|
We are pleased to present the fall 2023 quarterly newsletter. Depending on where in Florida you live, you have likely seen too much rain or not enough this year. Overall, the past few months saw a continued pattern of being wet in the east and dry in the west. Drought persisted in west central Florida and extreme drought developed across the western Panhandle during fall. Meanwhile, eastern Florida saw above normal rainfall over the past few months. A mid-November storm brought high winds and 7-13 inches of rain within 24 hours across the Keys and Southeast Florida. A wetter pattern has emerged more recently with a strengthening El Niño in the Pacific Ocean, which is expected to continue through the winter and early spring.
In this newsletter, we discuss the precipitation trends over the past few months, provide an update on El Niño and the current drought status, share a recap of the 2023 Atlantic hurricane season, and look ahead toward this winter. We also share highlights from the network.
Your contributions to this network provide important high-density data that help to capture the high spatial variability of our rainfall. Thank you for your continued support and dedication to the CoCoRaHS program.
As we head into the holiday season and new year, we wish you a very happy holiday season!
Sincerely,
Emily Powell
epowell@coaps.fsu.edu
Ivetta Abramyan
ivetta.abramyan@fscj.edu
| |
Florida's Drought Status: Too Much Rain or Not Enough
The statewide average precipitation this fall (SON) was just shy of normal, with a seasonal average of 12.53 inches, which was -0.17 inches below the 3-month average. The map below provides the rainfall departures from normal, from September 1 - November 30, which combines CoCoRaHS data with other station network data, courtesy of the High Plains Regional Climate Center. Drought affected the western Panhandle and west coast of Florida, while eastern Florida has seen above normal rainfall. Drought conditions in west coastal Florida persisted through the rainy season and as the rainy season officially ended, Florida's west coast headed into the dry season below normal with new water restrictions taking effect for most western coastal counties.
A main driver of this dry-wet pattern across the state has been a weak high pressure system in the western Atlantic Ocean, which affected Atlantic tropical cyclone activity as well as summer rainfall patterns. The east coast has seen extreme rainfall throughout the year, including the record-breaking April storm in Fort Lauderdale, a stormy and active weather pattern in summer, and a mid-November storm that brought 7-13 inches of rain across the southeast and the Keys. Meanwhile, weaker trade winds meant that the western half of the Peninsula missed out on typical summer thunderstorm activity, with only 50%-70% of normal precipitation collected since July 1st.
| |
|
September and October were very dry across the western half of the Peninsula and Panhandle, and rapid drought degradation occurred in the western Panhandle during late October and into November. A recent shift to a wetter pattern has led to drought improvement in the Panhandle. While drought has held on in western coastal locations, a strong El Niño is expected to bring above normal precipitation to Florida this winter, with drought removal expected everywhere during December-February.
According to the latest U.S. Drought Monitor, 1.3% of the state is in Extreme Drought (D3), 1.3% is in Severe Drought (D2), 11% is in Moderate Drought (D1), and 8% is Abnormally Dry (D0).
| |
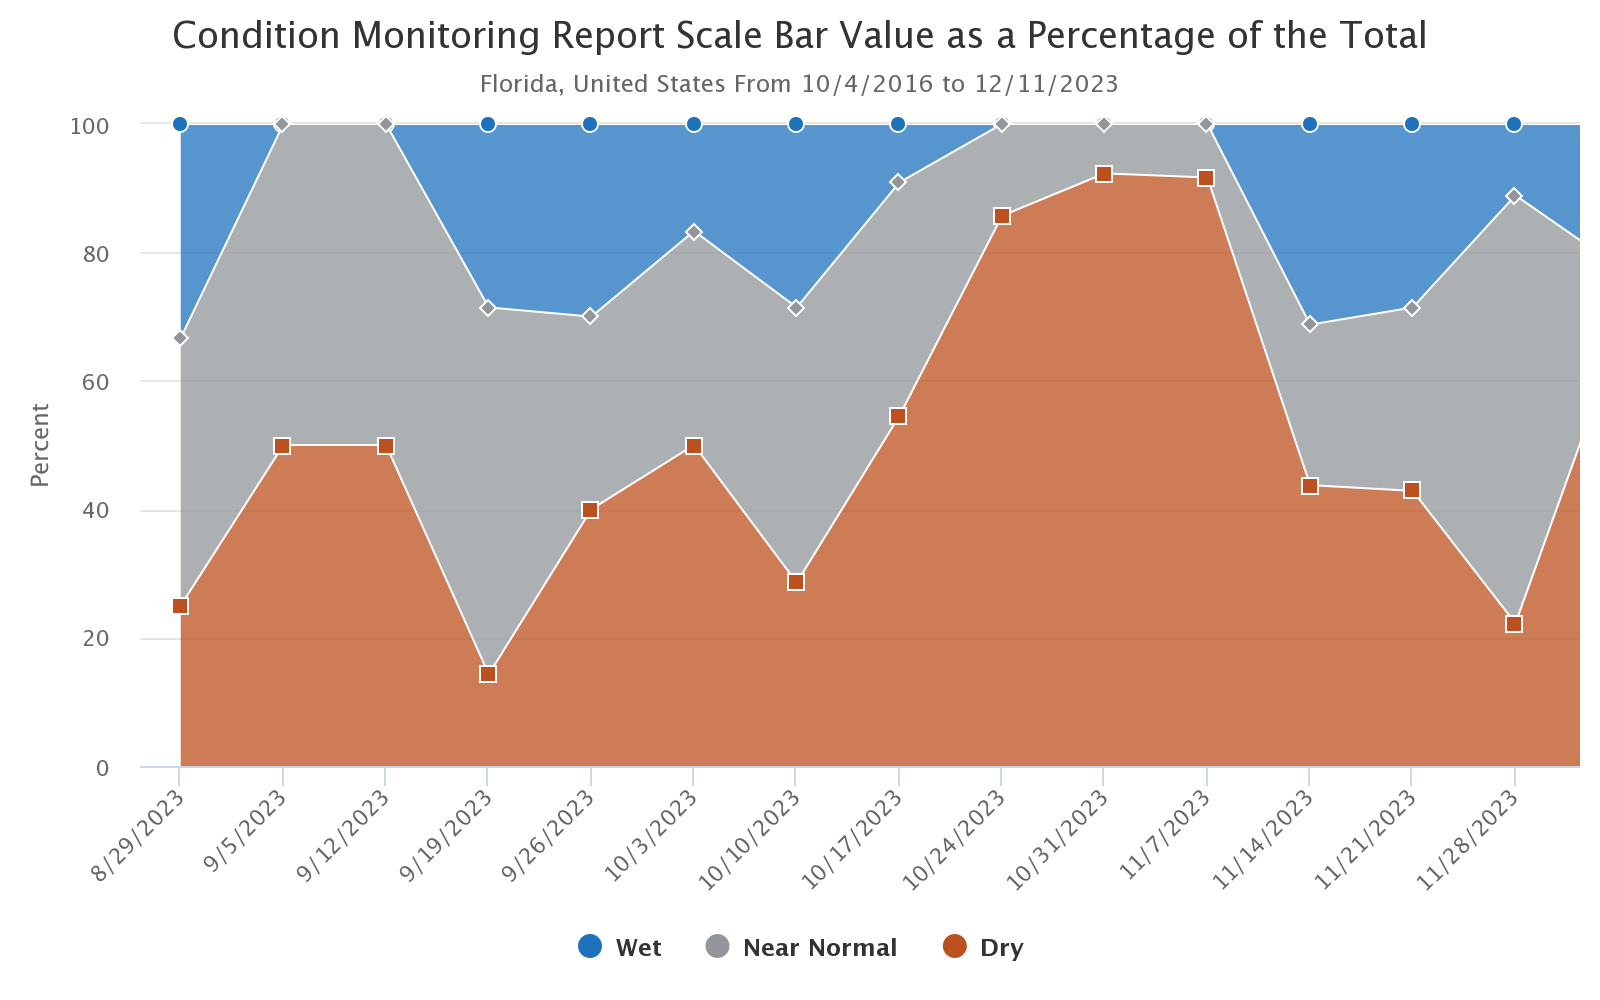
This graph below shows the percentage of condition monitoring reports indicating dry, wet, or near normal conditions that were submitted by CoCoRaHS observers in Florida between late August through the month of November. | |
Fall Extremes Across Florida CoCoRaHS
Between 1 September 2023 and 30 November 2023:
- Highest seasonal rainfall total: 32.21" at Pompano Beach, Broward Co. (BW-137)
- Lowest seasonal rainfall total: 2.64" at Sarasota, Sarasota Co. (SS-91)
- Highest daily rainfall total: 13.80" on November 16 at Key Largo, Monroe Co. (MN-25)
*based on data with at least 90% completeness
| |
Significant Weather Reports
Between 1 September 2023 and 30 November 2023, there were:
- 38 total Significant Weather Reports submitted.
- 12 reports of Minor flooding.
- 14 reports of Unusual flooding.
| |
Observer Comment Corner
Observer comments are encouraged! Thanks to the many who regularly post comments with their reports. Comments provide valuable context to observations, which can be very helpful to those who later use the observations. If nothing else, comments are interesting for us and other observers to read. Here are only a select few of the comments shared during the past few months. We’ll continue to share your comments in these newsletters.
1. 26 September, Palm Coast 4.6 NW, Flagler County (FL-53) - 2.77 inches:
"Light storm hit early afternoon 0.23". Severe thunderstorm. Low lightning and thunder. Occurence later evening. Did not have yard flooding; it has been a very dry September until this storm. 2.54" from the second storm."
2. 30 September, Port Orange 2.5 NNE, Volusia County (VL-60) - 4.05 inches in 60 minutes:
"Severe thunderstorm, yard is minor flooded, storm water retention ditch is full, will be flowing into the street shortly, stormwater drains at the other end. Almost high tide, flood warning has been issued."
3. 29 October, Boca Raton, Palm Beach County (PB-127) - 0 inches:
"Very little rain over the last 4 weeks."
4. 16 November, Hammocks 0.5 SSE, Miami-Dade County (MD-22) - 9.35 inches:
“In 14 years of reporting rain with cocorahs, it is the first time I have seen so much water in my rain gauge!"
5. 16 November, Weston 2.8 SE, Broward County (BW-99) - 7.51 inches:
“7AM-7PM: 4.02" 7PM-7AM: 3.49" 2-DAY STORM TOTAL: 10.36" Lake level is very high and normally dry areas of shoreline are under water. Highest level seen in quite some time, but level has been higher during a few past major events."
6. 29 November, Tampa 5.1S, Hillsborough County (HB-10) - 0 inches:
"The only "drop" was in the overnight temperature....that reached a very chilly 46° at my South Tampa location."
7. 29 November, Monticello 4.3 ENE, Jefferson County (JF-9) - 0 inches:
"A cold 31 this morning. 1st freeze of the season."
| |
2023 Atlantic Hurricane Season Ends Above Average Overall
This year's Atlantic hurricane season was above average overall, with 20 named storms (Arlene through Tammy) plus the early season unnamed storm. This included 7 hurricanes and 3 major hurricanes. 2023 ranks 4th for the most named storms on record (tied with 1933), coming in behind 2020 (30 named storms), 2005 (28 named storms), and 2021 (21 named storms).
Based on the 1991-2020 normals, we can expect to have 14 named storms, 7 hurricanes, and 3 major hurricanes in a typical season. So while the season was average for number of hurricanes, it was above average for the total number of named storms as well as accumulated cyclone energy (or ACE), which was 146 compared to an average of 123.
A few things that stood out about this hurricane season:
- Two competing factors played a role in tropical activity: the developing El Niño and basin-wide record warm ocean temperatures. Warm ocean temperatures ended up having a greater influence on storms.
- Two early season tropical storms - Bret and Cindy - formed in the main development region of the tropical Atlantic in June, which is unusual for storms to develop that early in the season in this part of the Atlantic.
- There was only one U.S. landfalling hurricane this year (Hurricane Idalia), due to a weak Azores High that helped to steer storms in the Atlantic northward before reaching the U.S. or Caribbean.
- Hurricane Idalia (a category 3 storm at landfall, shown in the image below approaching Florida with Hurricane Franklin in the Atlantic) was the most impactful storm of the season and the only storm to directly impact Florida and the U.S. This part of Florida had not been directly hit by a major hurricane in more than 120 years, since 1896.
- Hurricane Lee rapidly intensified by 85 mph in 24 hours, becoming the only category 5 hurricane this year in the Atlantic basin.
| |
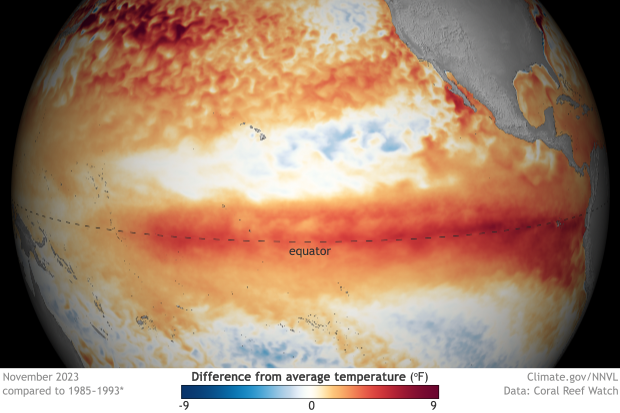
Sea Surface Temperature Anomalies Indicative of a "Strong" El Niño Event
El Niño, the warm phase of the El Niño-Southern Oscillation, has continued to strengthen in the equatorial Pacific Ocean and is expected to persist through the Northern Hemisphere winter, with a 60% chance of a transition to ENSO-neutral conditions in spring (April-June 2024). Above-average sea surface temperature anomalies across the equatorial Pacific Ocean are indicative of a strong El Niño event (≥ 1.5°C for a seasonal average), and there is just over a 50% chance of reaching a "historically strong" (≥ 2.0°C) event this winter. A strong El Niño increases the chances that we will see typical El Niño impacts in Florida, particularly a wetter winter season.
| |
Seasonal Outlook for Winter 2023-24 Heavily Leaning Wetter than Normal in Florida with Temperatures Less Certain
The NOAA Climate Prediction Center's outlook for this winter leans heavily toward a wetter than normal winter on average, December through February, for Florida but there is less certainty in temperatures. Average winter temperatures have equal chances of being above, below, or near normal, while winter precipitation has a 60%-70% chance of being above normal. The strengthening El Niño event is the driving factor behind a wetter winter for Florida. As a result, drought removal is expected everywhere in Florida and much of the Southeast U.S.
| |
|
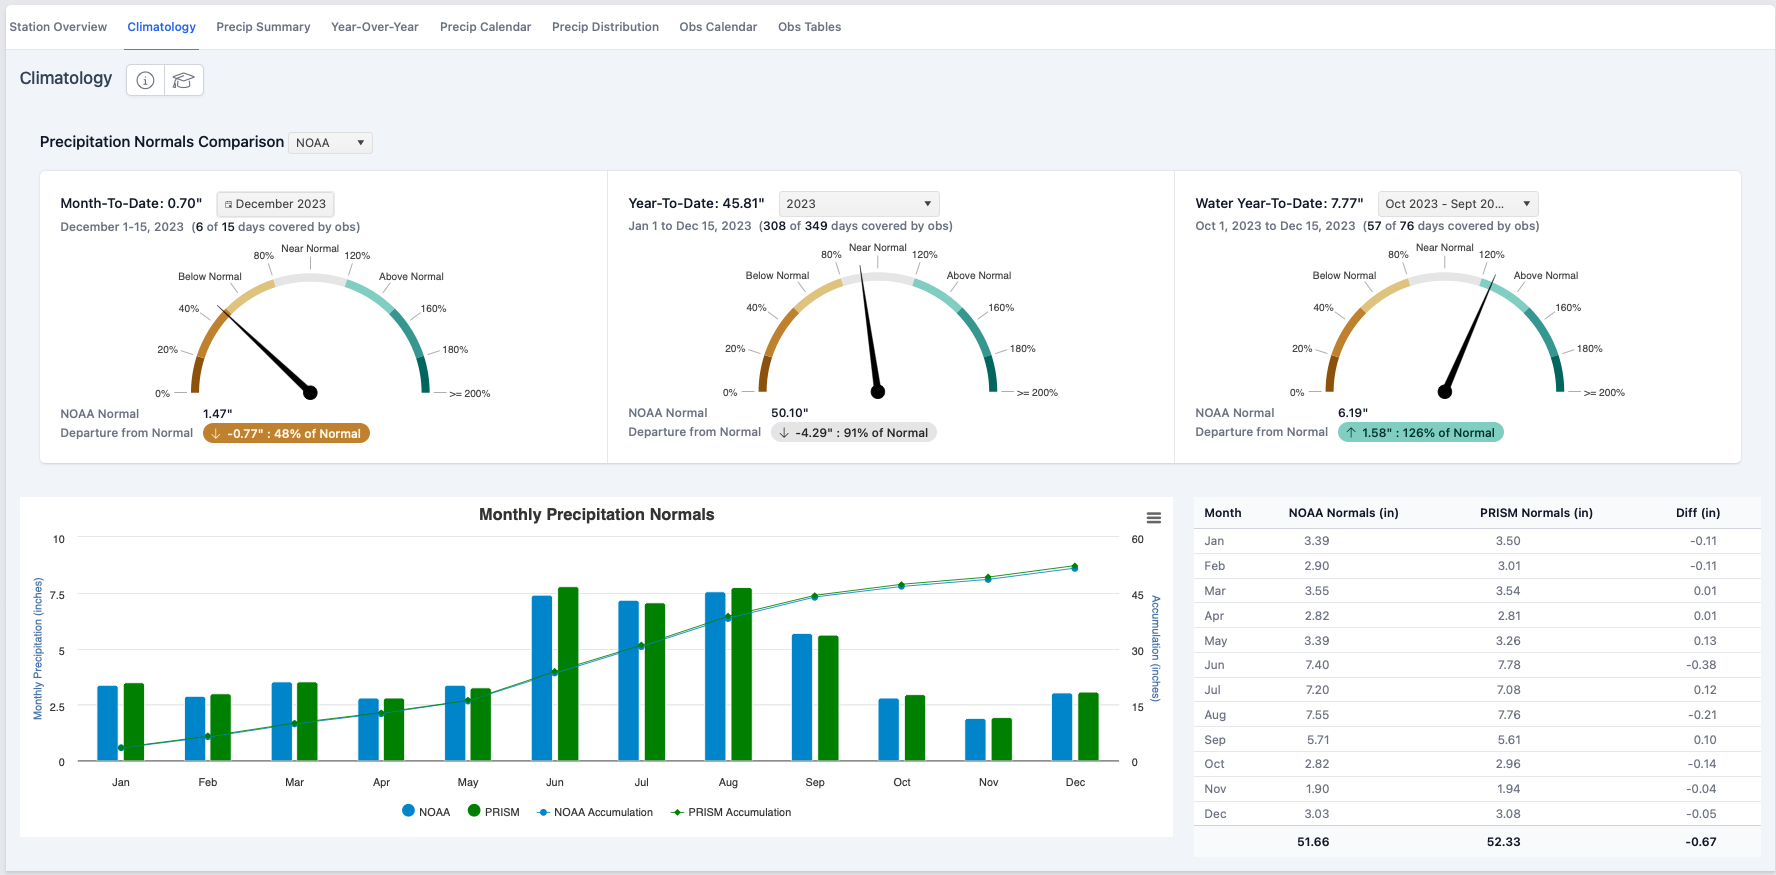
New CoCoRaHS Data Explorer Now Live!
In case you missed it, CoCoRaHS has launched a new Data Explorer. This free and user-friendly tool was designed for observers to provide meaningful and ready access to their data, making it easier to visualize and explore precipitation data from your own location as well as data from across the network. Users have options to plot graphs, calendars, distributions, make comparisons to climatology, and much more.
The Data Explorer was developed by the CoCoRaHS Headquarters team at CSU, with support from NOAA's Office of Education and CoCoRaHS volunteers. Read NOAA's press release here. Learn more about how to use the data explorer through the training tutorials.
Access the Data Explorer.
| |
|
2023's Ten-For-CoCoRaHS Year-End Fundraiser
Once again it is time for the annual CoCoRaHS year-end fundraiser. Please help us raise $200,000 by January 7th as you consider giving to a cause that you enjoy and believe in. This amount is just a third of our annual operating budget, but it sure does go a long way. Donations of $65 or more will receive a CoCoRaHS t-shirt!
Learn More
| |
|
Don't Miss Upcoming CoCoRaHS WeatherTalk Webinars!
These webinars take place bi-monthly as one-hour interactive Webinar sessions featuring engaging experts in the fields of atmospheric science, climatology and other pertinent disciplines. These easy-to-follow presentations are live and the audience is given the chance to submit questions which the experts answer live during the webinar.
The next talk will be January 17 for a review of significant weather in 2023 with Greg Carbin of the NOAA Weather Prediction Center. Register and view recordings of past webinars at: https://www.cocorahs.org/Content.aspx?page=wxtalk.
| |
COCORAHS CELEBRATES 25 YEARS DURING 2023!
| |
|
CoCoRaHS officially began on June 17, 1998. With a few observers along Colorado's Front Range, we had no idea that the network would become what it is today, with over 25,000 active observers in the United States, Canada, Puerto Rico, the U.S. Virgin Islands, Guam and the Bahamas. A truly remarkable effort by all of you.
Please join us as we celebrate 25 years. Here's to many more on the horizon! To read about the first 20 years of CoCoRaHS (which will be updated to the full 25 soon), read about our history here.
| |
| | | |