CURRENT MARKET PERSPECTIVE | |
|
MARKET WAITING ON FRIDAY'S PCE INFLATION!
CORPORATE BUYBACK WINDOWS BEGIN OPENING ON FRIDAY
Click All Charts to Enlarge
| |
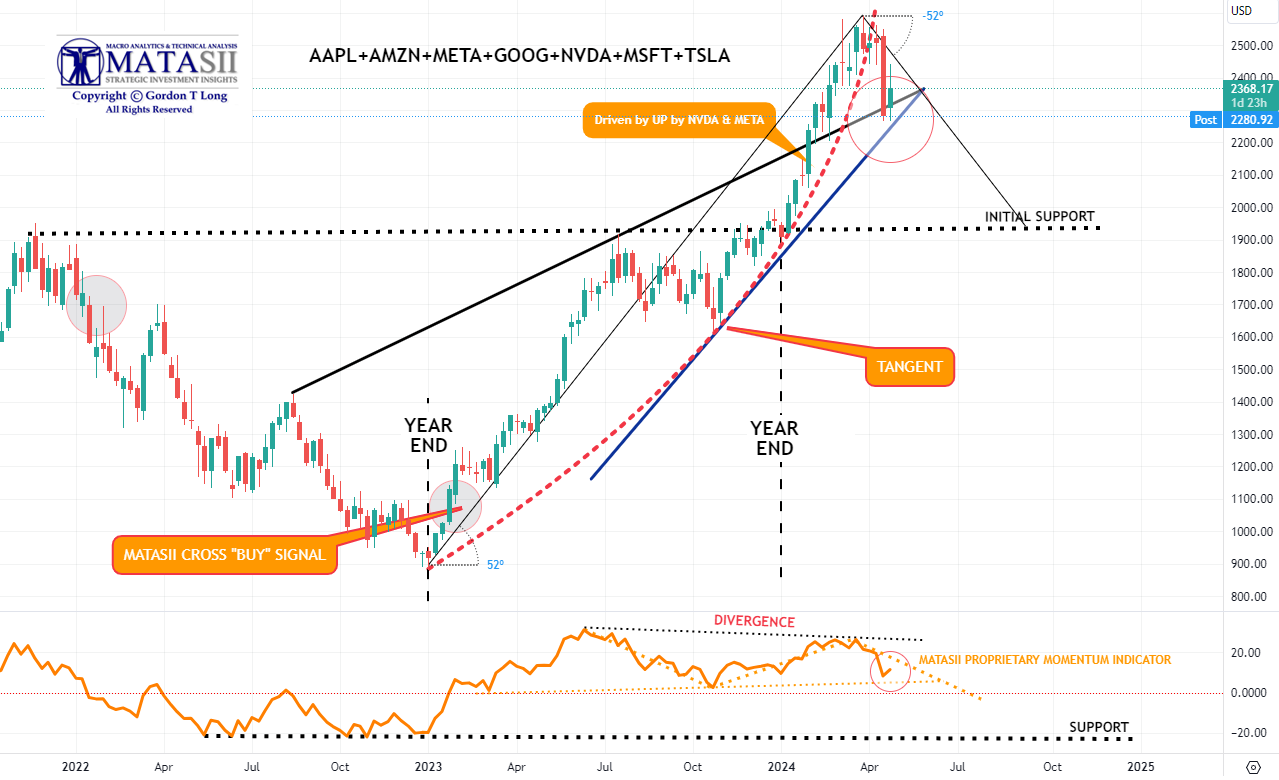
MAGNIFICENT SEVEN: Trying to find support but will need help from both earnings & bond yields! | |
|
1 - SITUATIONAL ANALYSIS
HAS "BUYING-THE-DIP" WENT OUT OF FASHION (or is the market nervous?)
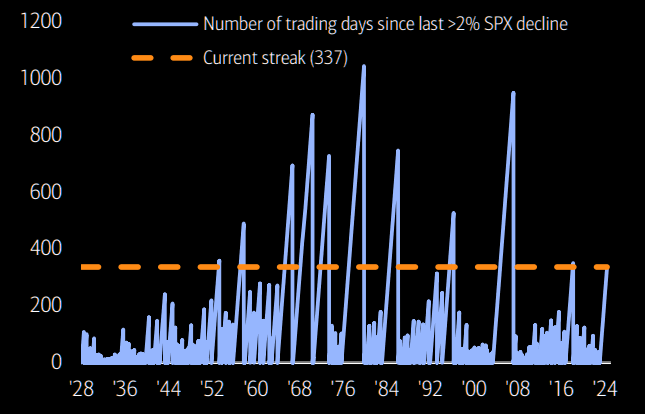
The S&P continues its streak of no >2% down days. There have only been 10 longer streaks since 1928, though the tail is long. (chart right top)
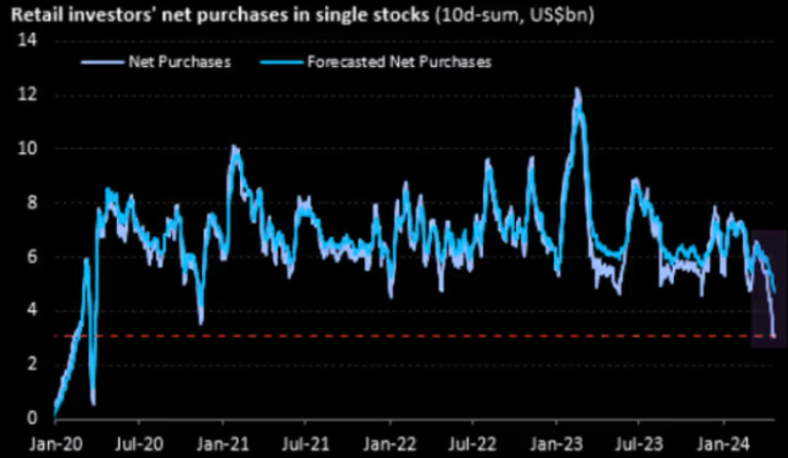
Buying the dip is fading! Muted up days vs down days this month seem to indicate weakening support from "Buy-the-Dip" behavior, particularly in the context of price action since the start of the AI wave. (chart right bottom)
Volatility control funds have been forced to reduce the equity long. Plenty more to sell should volatility stay high. (chart below)
| |
CHART BELOW:
Stock purchases by retail investors have fallen to their lowest level since late 2020
| |
|
Shorts have revived! Shorts have been added back in North America as they have dropped faster than the market. Will this new "hot" trade start hurting? | |
|
2 - FUNDAMENTAL ANALYSIS
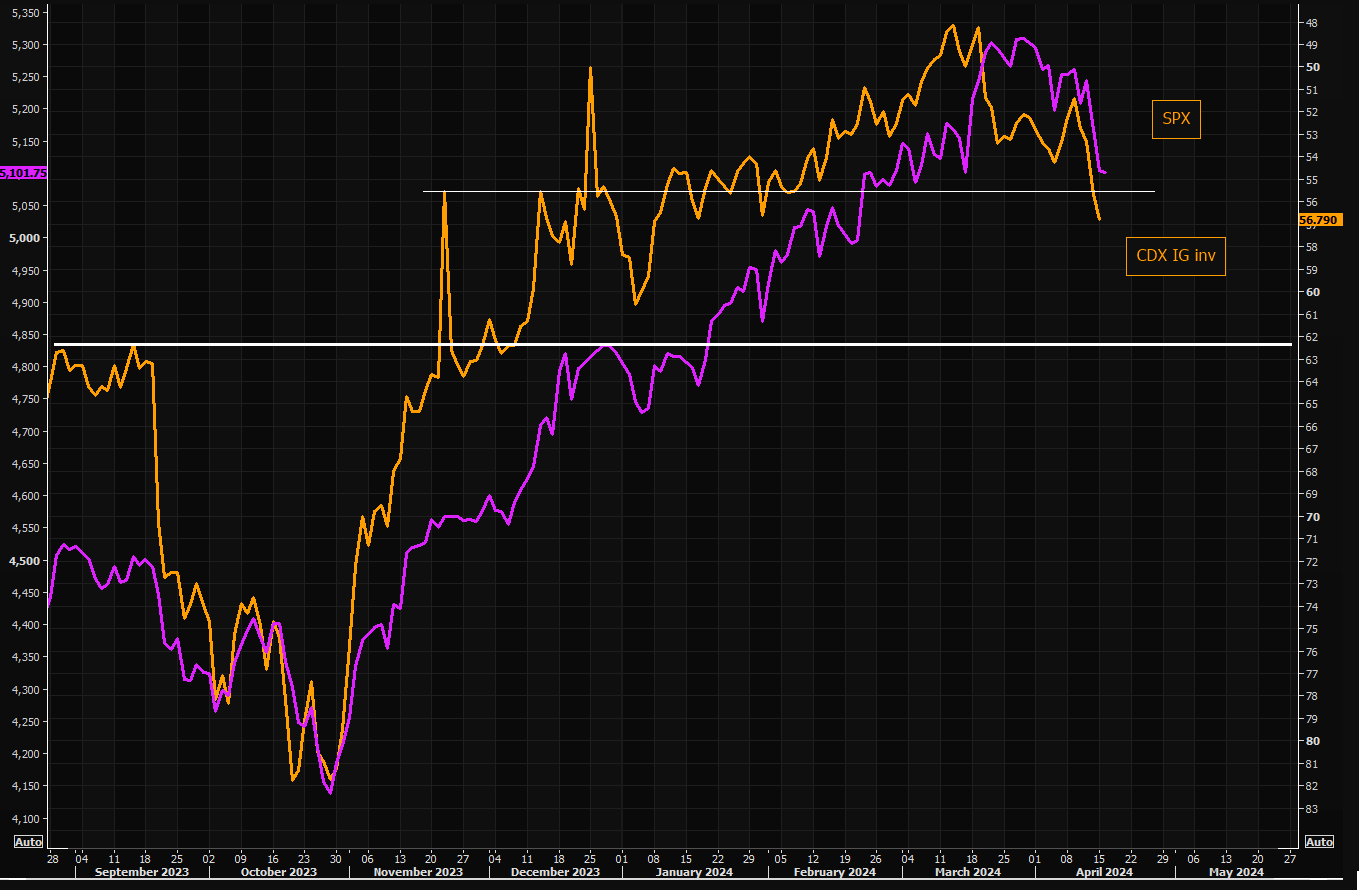
We are a strong believer that Credit Markets LEAD and Equity & Bond Markets FOLLOW.
CREDIT MARKETS
Comparing SPX to the CDX IG and you realize this appears at this stage to be nothing more than just a normal sell off, with little panic. (Chart Right shows SPX vs CDX IG inverted.
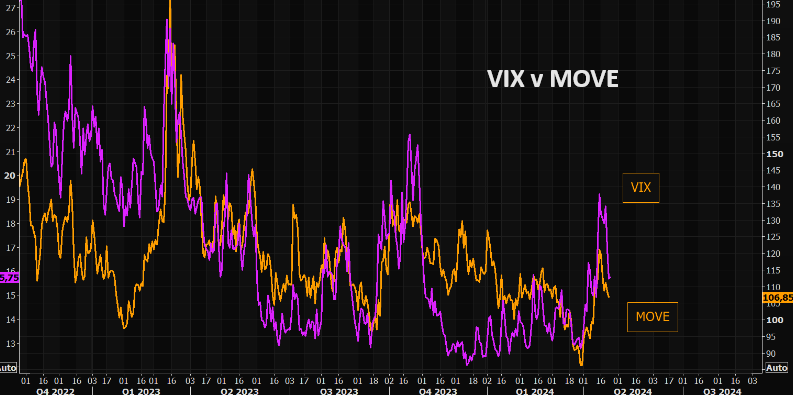
CHART BELOW: VIX and MOVE are down over past sessions, but we are far from those complacent levels we saw in early April.
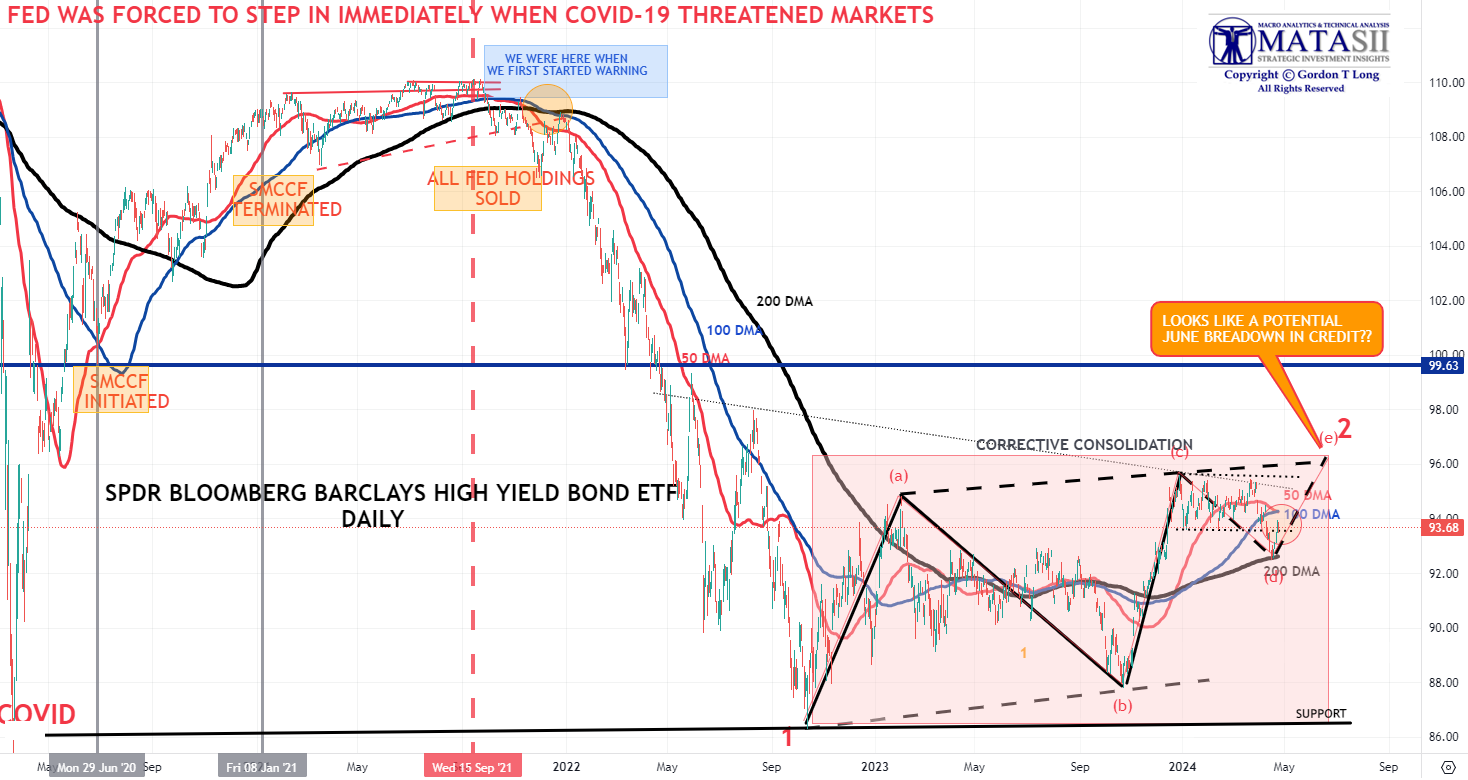
| The High Yield Credit sector as represented by the "JNK" is currently reflecting nothing more than a consolidation to the 200 DMA before completing a potential final leg up. This is normally good for the equity markets. | |
YOUR DESKTOP / TABLET / PHONE ANNOTATED CHART
Macro Analytics Chart Above: SUBSCRIBER LINK
| |
3 - TECHNICAL ANALYSIS
OVERALL EQUITY MARKET
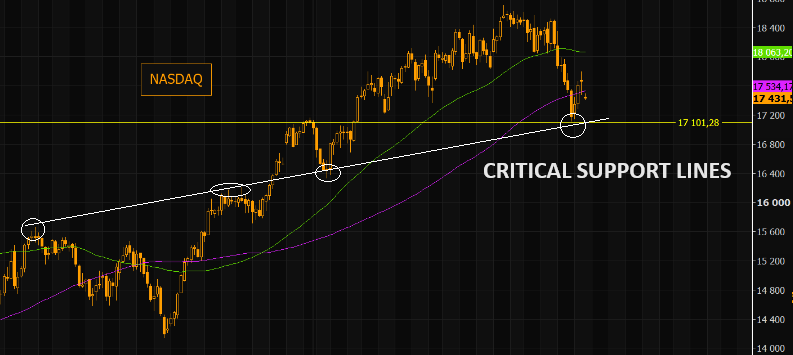
We are just above critical support lines in the Nasdaq. NASDAQ's short term must hold is down around the 17100 area. We are presently falling below the 100 day . The 50 day is reversing and has just started sloping negatively. Indicates are we are slowly rolling over.
THE HEADLINE MARKET: MAGNIFICENT 7
- We are reaching the vertical lift part of the parabolic (geometric) lift shown by the dashed red line.
- We have intermediate term Divergence with momentum (bottom pane).
- In the short term Momentum has rolled over but hasn't yet decisively broken the Momentum trend line support. (top of this page).
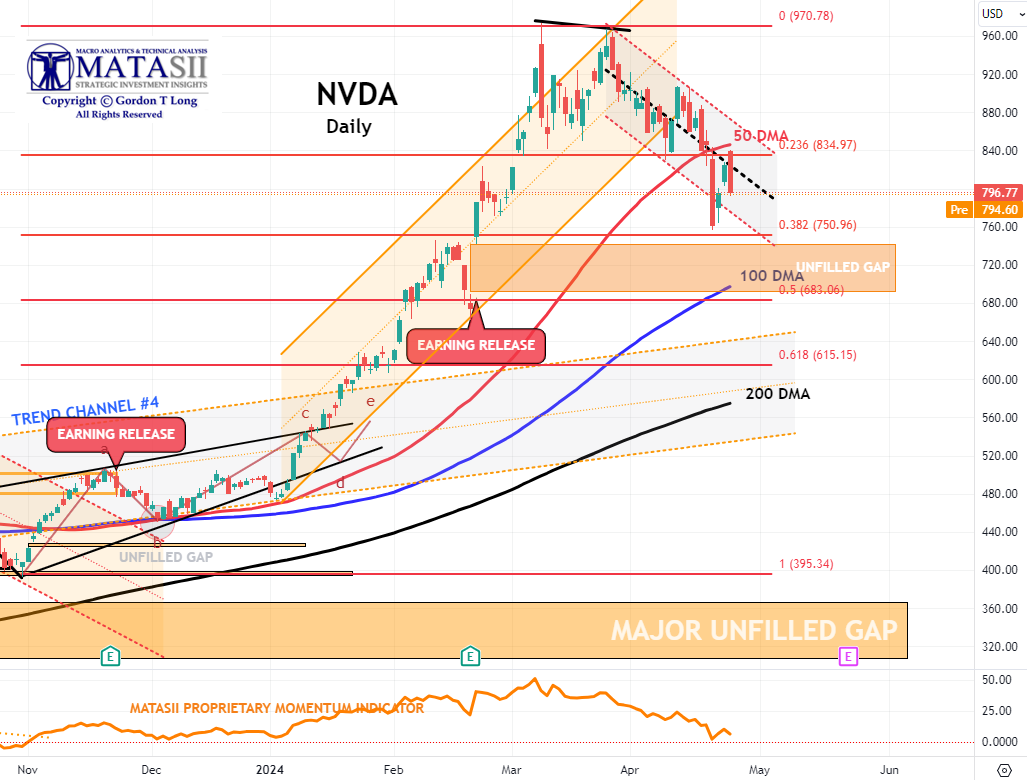
NVDA - Daily
- NVDA failed to break through the overhead 50 DMA on a retest. This suggests it presently wants to close the gap below and test the 100 DMA for support.
- NVDA Momentum (lower pane) has test its support and looks to want to test it again - possibly breaking further to the downside.
|  | |
YOUR DESKTOP / TABLET / PHONE ANNOTATED CHART
Macro Analytics Chart Above: SUBSCRIBER LINK
| |
|
"CURRENCY" MARKET (Currency, Gold, Black Gold (Oil) & Bitcoin)
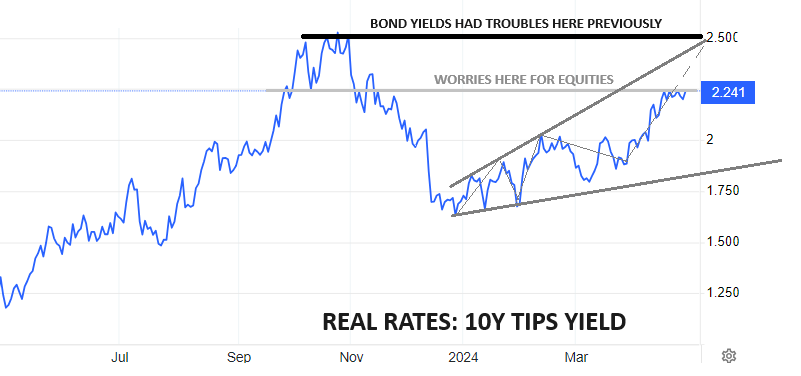
CHART RIGHT: As gold pushes to higher & higher record highs (in USD terms), Real yields refuse to play along (above right)??
I side with BoAML's Michael Hartnett and believe that what we are seeing is Gold aggressively discounting a coming collapse in Real Rates.
CONTROL PACKAGE
There are EIGHT charts we have outlined in prior chart packages which we will continue to watch closely as a CURRENT "control set".
-
US DOLLAR -DXY - MONTHLY (CHART LINK)
-
US DOLLAR - DXY - DAILY (CHART LINK)
-
GOLD - DAILY (CHART LINK)
-
GOLD cfd's - DAILY (CHART LINK)
-
GOLD - Integrated - Barrick Gold (CHART LINK)
-
OIL - XLE - MONTHLY (CHART LINK)
-
OIL - WTIC - MONTHLY - (CHART LINK)
-
BITCOIN - BTCUSD - WEEKLY (CHART LINK)
-
10y TIPS - Real Rates - Daily (CHART LINK)
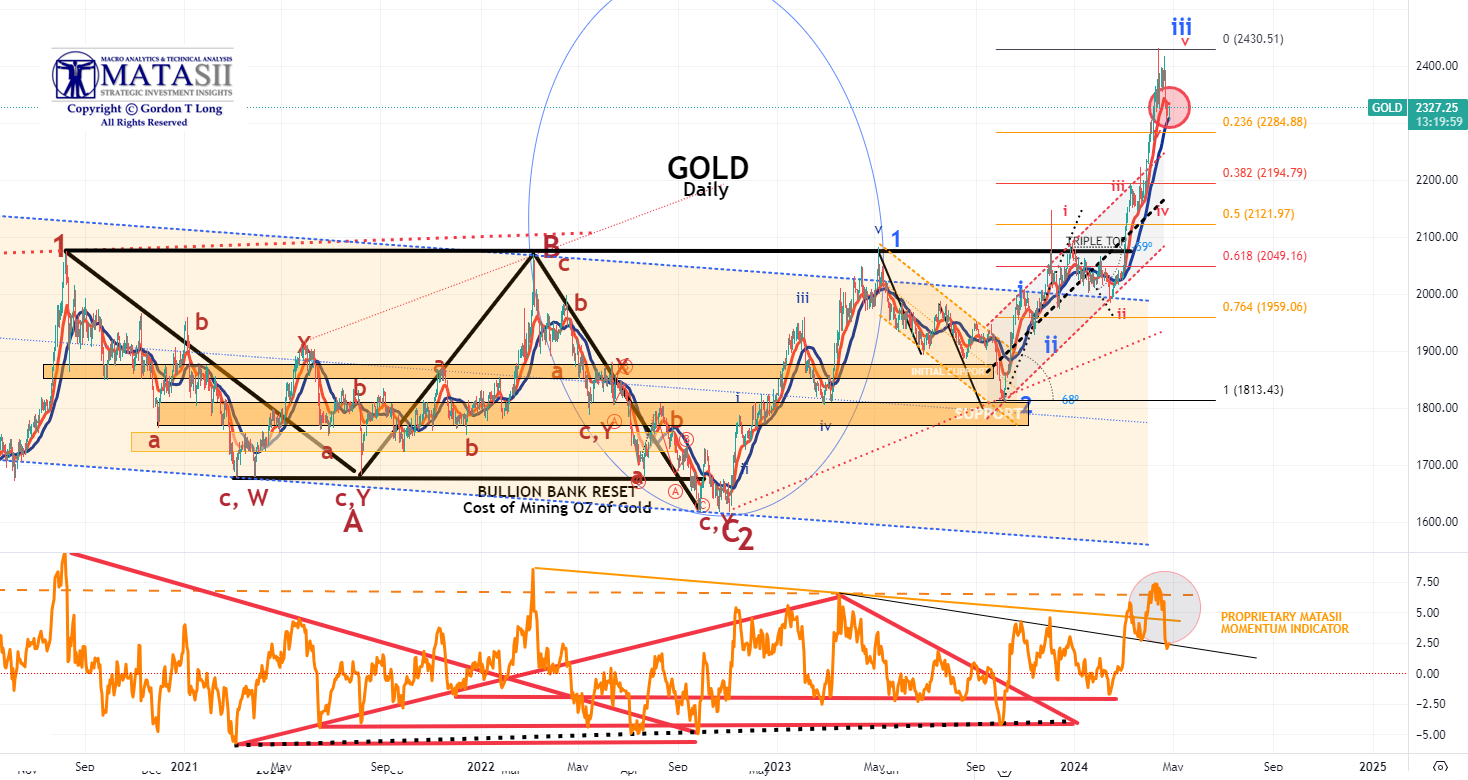
GOLD - DAILY
- Gold pulled back on Monday finding initial support at the 23.6% Fibonacci Retracement level.
- God Momentum (lower pane) also found support (dotted black trend line).
- It appears that this initial corrective leg is an "A" wave of an ABC corrective pattern before heading higher when completed. The "C" down leg of the ABC is likely to find firm support at the 38.2% Fibonacci Retracement level.
T
|  | |
YOUR DESKTOP / TABLET / PHONE ANNOTATED CHART
Macro Analytics Chart Above: SUBSCRIBER LINK
| |
INTEGRATED GOLD MINERS
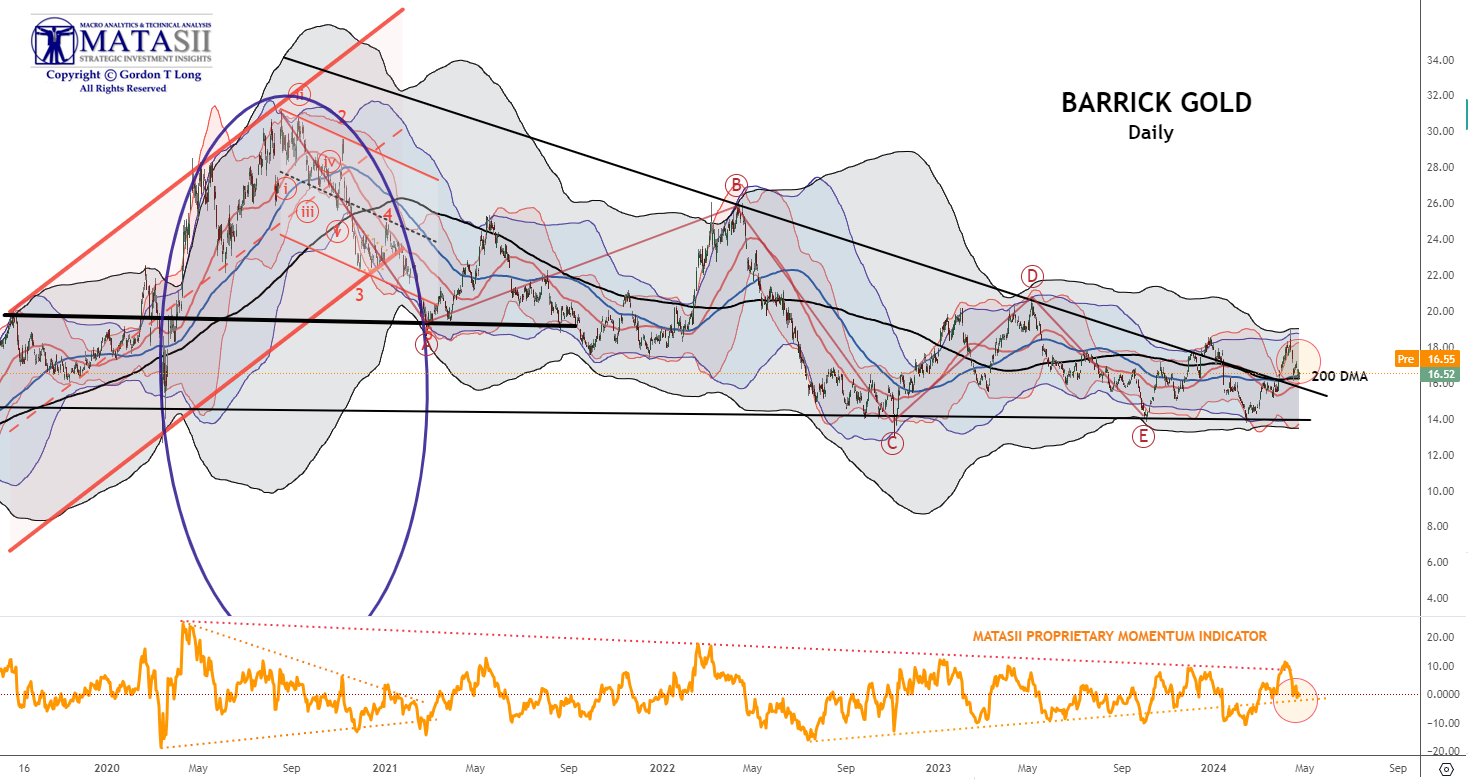
We continue to have a close eye on Gold and the INTEGRATED GOLD MINERS as represented by Barrick Gold. Barrick has broken out of its long term declining overhead resistance trend. It has been pulling back this week with Gold Bullion.
- Barrick found support in the pullback at its 200 DMA.
- Barrick Momentum (lower pane) additionally found support at its MATASII Proprietary Momentum Indicator trend level (dotted orange line).
It is likely time to be adding to your Gold and Silver positions on further pullback opportunities.
| |
|
YOUR DESKTOP / TABLET / PHONE ANNOTATED CHART
Macro Analytics Chart Above: SUBSCRIBER LINK
| |
|
US EQUITY MARKETS
CONTROL PACKAGE
There have FIVE charts we have outlined in prior chart packages that we will continue to watch closely as a CURRENT "control set".
-
The S&P 500 (CHART LINK)
-
The DJIA (CHART LINK)
-
The Russell 2000 through the IWM ETF (CHART LINK),
-
The MAGNIFICENT SEVEN (CHART ABOVE WITH MATASII CROSS - LINK)
-
Nvidia (NVDA) (CHART LINK)
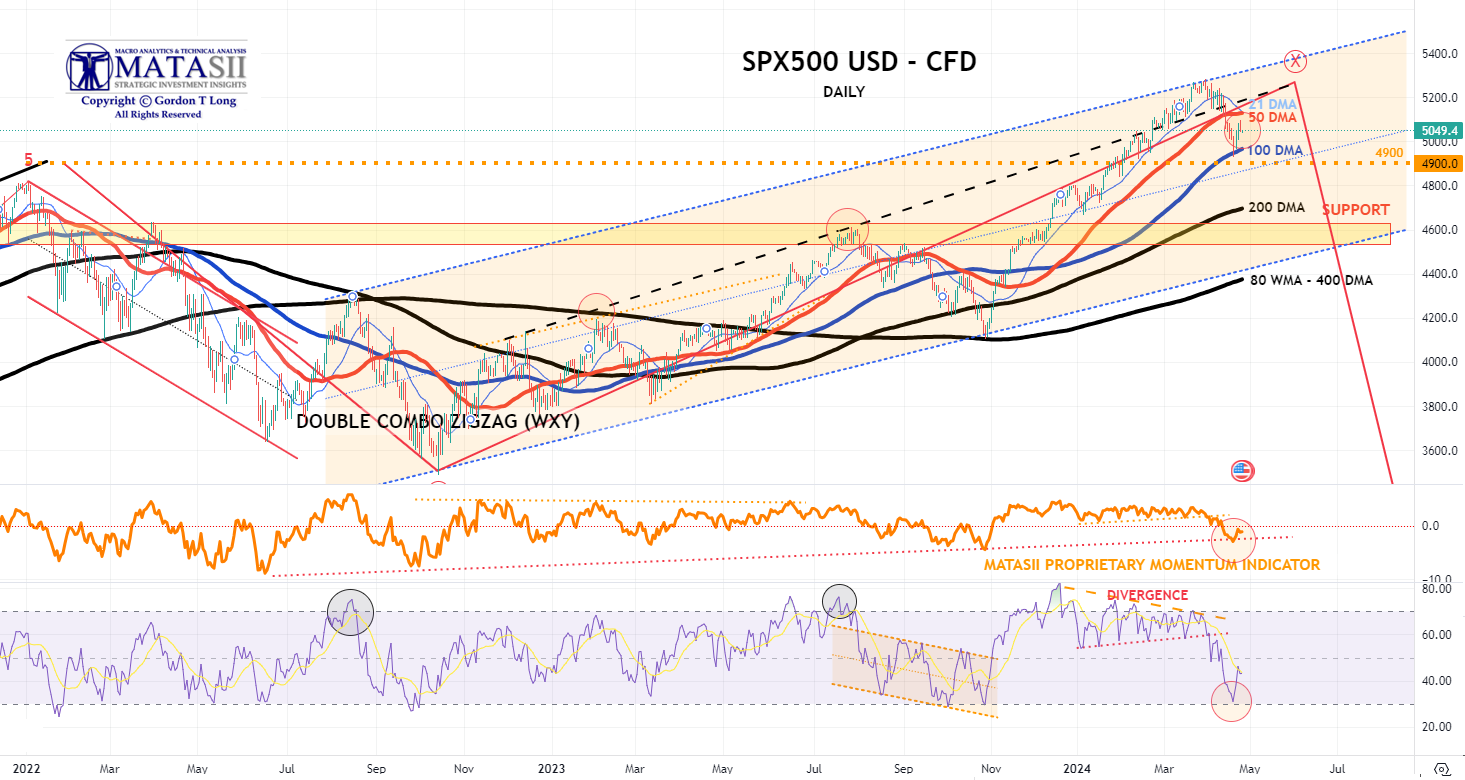
S&P 500 CFD
- The S&P 500 found initial support at the 100 DMA and has bounced from there.
- Additionally, the S&P 500 cfd found support (lower pane) at its lower MATASII Momentum support band.
| |
YOUR DESKTOP / TABLET / PHONE ANNOTATED CHART
Macro Analytics Chart Above: SUBSCRIBER LINK
| |
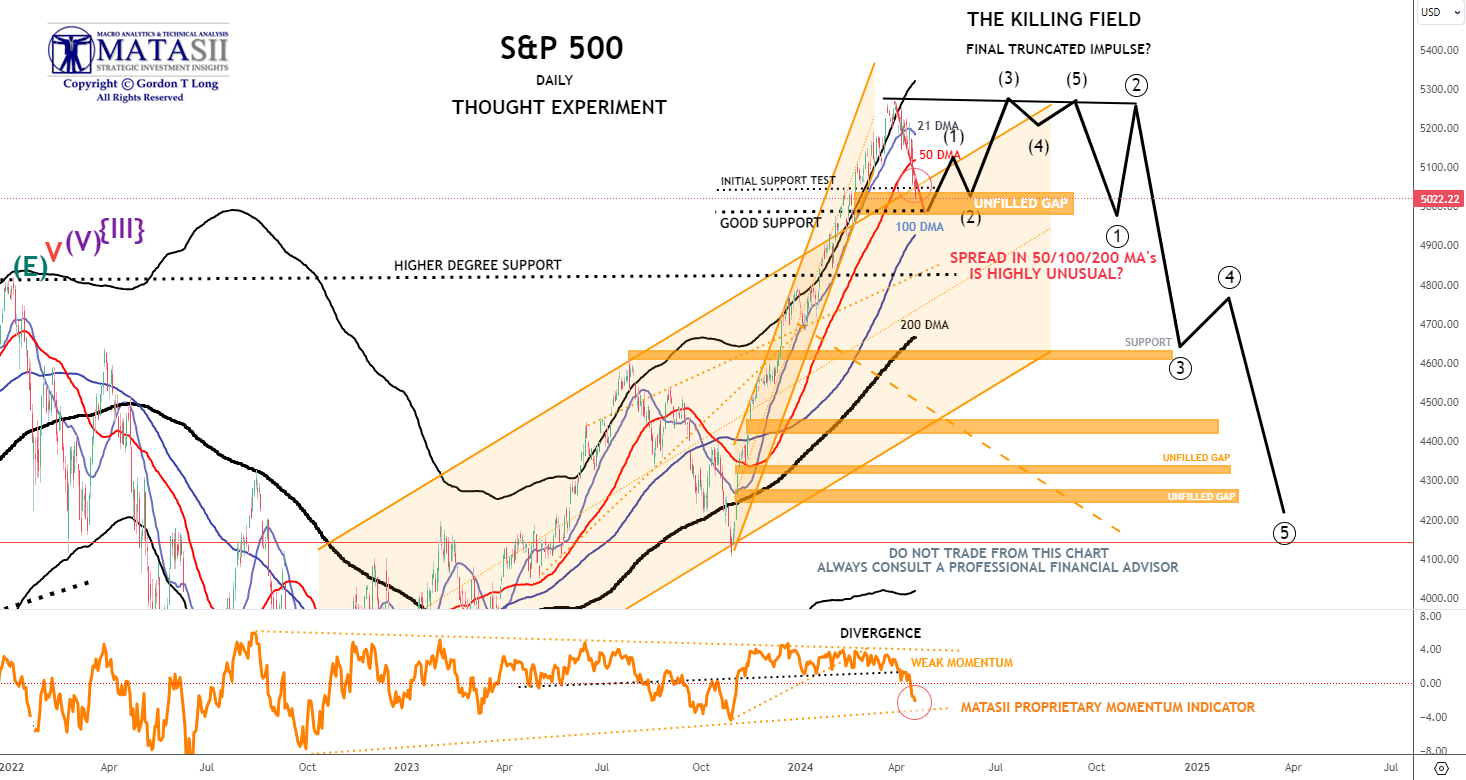
S&P 500 - Daily - Our Though Experiment
Our Though Experiment, which we have discussed previously, suggests we have put in a near term top (or very close to it) and will now consolidate before possibly completing one final small impulse higher or put in a 1-2 Wave of a much higher degree.
- The S&P 500 found initial support just above the100 DMA after filling a prior unfilled gap.
- Additionally, the S&P 500found support (lower pane) at its lower MATASII Momentum support trend line.
NOTE: To reiterate what I previously wrote - "the black labeled activity shown below, between now and July, looks like a "Killing Field" where the algos take Day Traders, "Dip Buyers", "Gamma Guys" and FOMO's all out on stretchers!"
| |
YOUR DESKTOP / TABLET / PHONE ANNOTATED CHART
Macro Analytics Chart Above: SUBSCRIBER LINK
| |
STOCK MONITOR: What We Spotted
MONDAY
- The stock sell-off continued Monday to see the S&P 500 lose 2.6% across Friday and Monday, its largest two-day sell-off in more than a year, and now closing beneath its 50d MA for the first time in five months, according to Bloomberg, reflective of the weakening technical backdrop for risk assets.
- The VIX climbed above 19. While stock futures had made a recovery attempt during the overnight session after geopolitical hedges from the weekend were unwound, later reporting Israel was working on a retaliation contributed to renewed risk off conditions during stateside trade, with gold, oil, and haven currencies all finding some momentum into the APAC session here.
- Treasuries saw heavy losses, with the focus returning to the hot US economic conditions, highlighted by the massive beat in retail sales earlier, although yields did pare off highs as the geopolitical angst rose again into the NY afternoon.
- The Dollar Index hit new YTD peaks, while USD/JPY also found new multi-decade highs above 154, although some of the Iran/Israel angst has put a stop to the Yen's rot for now.
INFLATION BREAKEVENS: 5yr BEI +3.7bps at 2.494%, 10yr BEI +3.4bps at 2.440%, 30yr BEI +3.0bps at 2.368%.
REAL RATES: 10Y -- 2.1681%
STOCK SPECIFIC
- Goldman Sachs (GS) +3%: Earnings impressed; EPS, revenue, and other key metrics all beat, alongside a strong revenue breakdown.
- Charles Schwab (SCHW) +2%: Post-earnings, CFO expects net interest margin expansion through 2024. In earnings, they were mixed - top and bottom line marginally beat, but internals were more mixed.
- Tesla (TSLA) -5%: Lays off "more than 10%" of its global workforce. Separately, CEO Musk announced a cut in the price of the FSD package to USD 99/month.
- Apple (AAPL) -2%: iPhone shipments fell 10% in Q1 and short of Wall St. expectations as it was hurt by intensifying competition by Android, according to IDC.
- Informatica (INFA) -7%, Salesforce (CRM) -7%: Salesforce is in advanced negotiations to acquire Informatica, WSJ reports. The sources add the price being discussed is below INFA''s current share price of USD 38.48.
- Blackbaud (BLKB) +3%: Clearlake offers USD 80/shr to acquire Blackbaud (BLKB). Note, BLKB closed Friday at USD 76.72.
- Snap One Holdings (SNPO) +30%: To be acquired by Resideo (REZI) -4% for USD 10.75/shr. Note, SNPO closed Friday at USD 8.14/shr.
- Encore Wire (WIRE) +11%: To be acquired by Prysmian for USD 290/shr. Note, WIRE closed Friday at USD 260.98.
- Medical Properties Trust (MPW) +18%: Sold stakes in five Utah hospitals to a new JV with an affiliated investment fund for USD 886mln.
- Cisco (CSCO) -0.5%: Upgraded at BoFA citing three catalysts for growth acceleration.
- Alcoa (AA) +4: Benefitting from the surge in Aluminum prices.
- Lockheed Martin (LMT) +0.6%: Wins US missile defense contract worth USD 17bln, according to Reuters sources.
TUESDAY
- Stocks were choppy on Tuesday amid hawkish Fed speeches and mixed earnings reports as the indices attempted to find some ground after recent selling, with the VIX back under 19 and a lack of response (so far) from Israel.
- There were two key Fed speeches with both Vice Chair Jefferson and Chair Powell himself walking back comments around rate cuts, that weighed on Treasuries as yields continued to climb higher.
- There are now 40bps of cuts priced for the year in money markets vs 44bps beforehand.
- Banks were an area of weakness with Bank of America (BAC) and Bank of NY Mellon (BK) dipping post-earnings, although Morgan Stanley (MS) outperformed.
- Meanwhile, tech found some general recovery, while a solid UNH report supported Healthcare.
- The Dollar was ultimately flat. Note a mini-flash crash in USD/JPY in the NY morning ignited suspicions of BoJ intervention, although note the pair has recovered already.
- Oil prices were flat, although nat gas saw a late session spike which was followed by TC Energy (TRP) announcing it was responding to an incident in Yellowhead County involving NGTL with the affected section of pipeline having been shut down.
INFLATION BREAKEVENS: 5yr BEI -0.4bps at 2.495%, 10yr BEI -0.8bps at 2.429%, 30yr BEI -0.1bps at 2.366%.
REAL RATES: 10Y -- 2.239%
STOCK SPECIFIC
- Apple (AAPL) -2%: Insider sales from COO and CFO
- Microsoft (MSFT) flat: Plans to invest USD 1.5bln in G42, a UAE-based AI company with ties to China.
- Live Nation (LYV) -7.5%: Set to be sued by the DoJ, according to WSJ.
- Tesla (TSLA) -2.5%: Confirmed it is planning to layoff 10% if its global workforce. Following this, JPMorgan said TSLA layoffs show delivery miss about demand, not supply.
- Lockheed Martin (LMT) +0.5%: Secured a USD 17bln contract from US Missile Defense Agency.
- AMD (AMD) +2%: Upgraded at HSBC on reset expectations.
- Amazon (AMZN) flat: Prime subs jump 8% in US to new high of 180mln, according to Consumer Intelligence Partners.
- Envestnet (ENV) +9.5%: Is exploring options including a sale with the help of a financial advisor, according to Reuters sources.
WEDNESDAY
- Stocks were sold on Wednesday with losses led by the Nasdaq as the Tech sector underperformed with semis weighed on by a poor ASML earnings report.
- Stocks had pared some of the weakness after a stellar 20yr bond auction before selling resumed into the closing bell.
- Elsewhere, the Dollar was sold as it tracked US yields lower which in turn supported the Yen, Franc and Euro but the Antipodes outperformed despite the risk-off tone of trade.
- GBP only saw slight gains vs the Buck but it was weaker vs the Euro despite hotter-than-expected inflation, but BoE officials did not seem too concerned. There were few developments on geopolitics today other than reports suggesting Israel was going to respond to Iran on Monday, but ultimately decided to wait - a response seems a given but it is still a matter of when and how.
- Elsewhere, trade concerns between the US and China are rising after US President Biden was calling for higher tariffs on Chinese steel.
- The lack of updates saw oil prices pare some of the recent strength with inventory data showing a larger build than expected supporting the move while gold prices saw slight losses, despite the weaker dollar.
- Attention turns to more Fed speak overnight and on Thursday, with Thursday US data focusing on Jobless Claims, Existing Homes Sales and the Philly Fed business index.
INFLATION BREAKEVENS: 5yr BEI +0.1bps at 2.468%, 10yr BEI +0.2bps at 2.411%, 30yr BEI +1.1bps at 2.362%.
REAL RATES: 10Y -- 2.241%
STOCK SPECIFIC
- Tapestry (TPR) -1% Capri (CPRI) -3%: FTC is preparing to sue to block Tapestry's USD 8.5bln takeover of Capri Holdings, according to NYT.
- Mobileye (MBLY) +3%: Secured orders for 46mln of the EyeQ6 Lite driver-assistance chips.
- Eli Lilly (LLY) +0.5%: Weight loss drug (Trezepatide) met all primary endpoints and key secondary endpoints in two Phase 3 clinical trials.
- Sage Therapeutics (SAGE) -20%: Phase 2 study of dalzanemdor did not meet primary endpoint.
- Autodesk (ADSK) -6%: Said it will further delay its annual 10-K filing due to an ongoing internal investigation of its board of directors.
- Knight-Swift Transportation (KNX) -4%: Lowers Q1 and Q2 guidance.
- Microsoft (MSFT) -0.7%: To reportedly avoid a formal EU probe over USD 13bln OpenAI deal, according to Bloomberg.
- Zuora (ZUO) +12%: Exploring potential options after receiving acquisition interest from potential buyers, according to Reuters sources.
- Snap (SNAP) +5%: US House Speaker Johnson says TikTok divest-or-ban bill is moving fast through Congress.
- Nvidia (NVDA) -3.5%: Set to acquire AI infrastructure orchestration and management platform Run:ai for around USD 700mln in the coming days, according to Calcalist. NVDA later confirmed the news.
- Social Media (SNAP -2.5%, META-0.5%): Senate approved a bill that could see TikTok banned in the US.
- UnitedHealth's (UNH) +0.5%Optum ending virtual care is a positive for Teladoc (TDOC) +0.5%, according to BofA
- IBM (IBM) +0.8% is said to offer about USD 35/shr for HashiCorp (HCP) +7.5%, according to Bloomberg
- David Einhorn Greenlight Capital Letter: New buys in HPQ, PENN and ROIV, reduced stake in TECK.
- UK CMA reportedly seeks views on Microsoft (MSFT) and Amazon's (AMZN) AI partnerships, according to Bloomberg.
| |
BOND MARKET
CONTROL PACKAGE
There have FIVE charts we have outlined in prior chart packages that we will continue to watch closely as a CURRENT "control set".
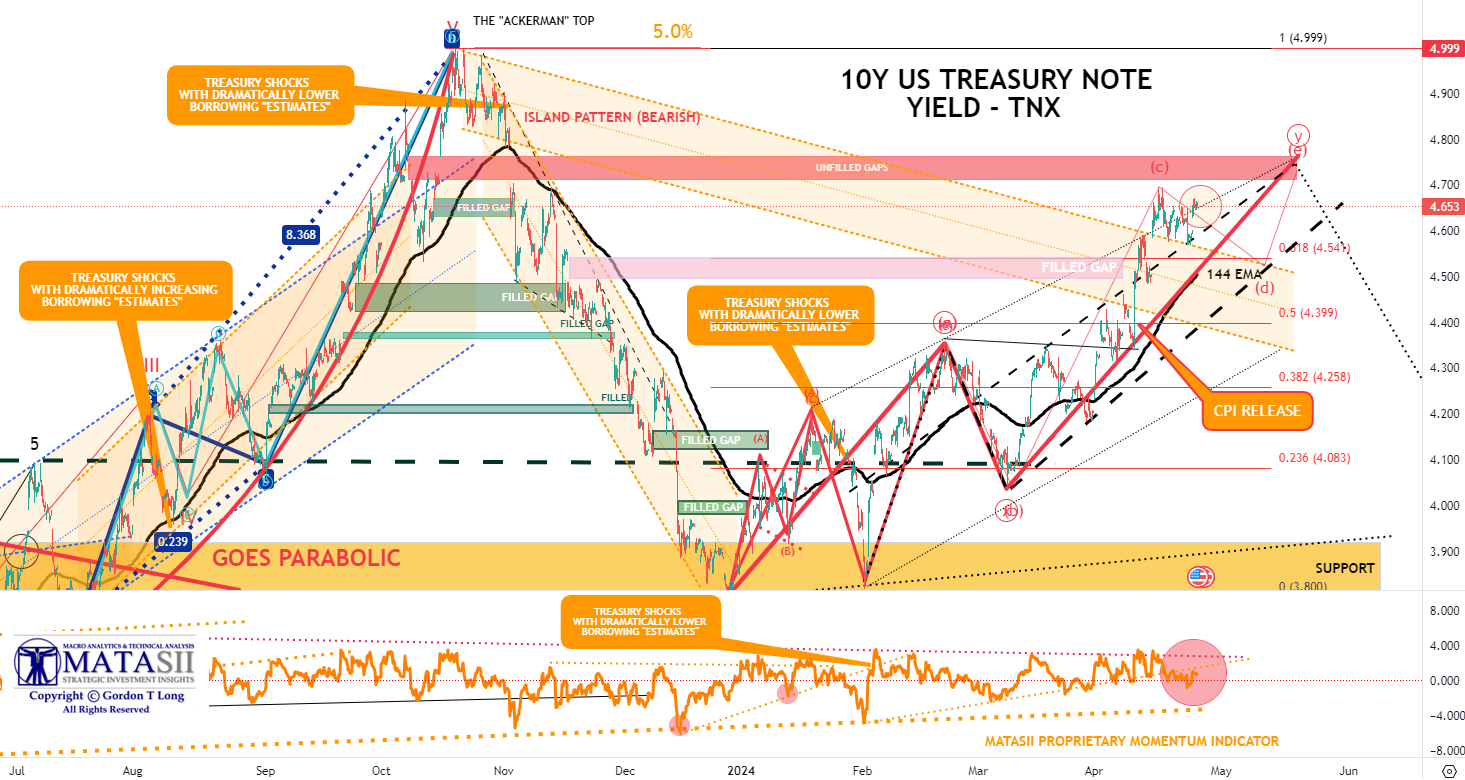
- The 10Y TREASURY NOTE YIELD - TNX - HOURLY (CHART LINK)
- The 10Y TREASURY NOTE YIELD - TNX - DAILY (CHART LINK)
- The 10Y TREASURY NOTE YIELD - TNX - WEEKLY (CHART LINK)
- The 30Y TREASURY BOND YIELD - TNX - WEEKLY (CHART LINK)
- REAL RATES (CHART LINK)
- FISHER'S EQUATION = 10Y Yield = 10Y INFLATION BE% +REAL % = 2.411% + 2.241% = 4.65%
WEDNESDAY 5Y TREASURY AUCTION - A Disappointing Auction
Overall, this was a mediocre and forgettable auction, and one which accelerated the move higher in bond yields which are now at 4.654%, just shy of session highs.
- 5YR AUCTION: A lackluster, ramped size 5yr auction from the Treasury, with USD 70bln sold at 4.659%, where despite the sell off from March's 4.235% stop, the auction tailed the When Issued yield by 0.4bps, worse than March's 1bp stop-through, but close to the six-auction average tail of 0.5bps, and offsetting the 0.6bp stop-through at Tuesday's 2yr offering.
- The auction was covered 2.39x, less than the prior and avg. 2.41x.
- Dealers were left with 15%, more than the prior 12.7% but beneath avg. 16.7%, with a fall in Indirects participation to 65.7% from 70.5% last month offsetting the rise in Directs to 19.2% from 16.8%.
- Attention now on Thursday's 7yr, which will be the last coupon auction and duration demand litmus test before the QRA next Wednesday, where expectations are for unchanged coupon sizes for the quarter ahead.
|  | |
YOUR DESKTOP / TABLET / PHONE ANNOTATED CHART
Macro Analytics Chart Above: SUBSCRIBER LINK
| |
NOTICE Information on these pages contains forward-looking statements that involve risks and uncertainties. Markets and instruments profiled on this page are for informational purposes only and should not in any way come across as a recommendation to buy or sell in these assets. You should do your own thorough research before making any investment decisions. MATASII.com does not in any way guarantee that this information is free from mistakes, errors, or material misstatements. It also does not guarantee that this information is of a timely nature. Investing in Open Markets involves a great deal of risk, including the loss of all or a portion of your investment, as well as emotional distress. All risks, losses and costs associated with investing, including total loss of principal, are your responsibility.
FAIR USE NOTICE This site contains copyrighted material the use of which has not always been specifically authorized by the copyright owner. We are making such material available in our efforts to advance understanding of environmental, political, human rights, economic, democracy, scientific, and social justice issues, etc. We believe this constitutes a ‘fair use’ of any such copyrighted material as provided for in section 107 of the US Copyright Law. In accordance with Title 17 U.S.C. Section 107, the material on this site is distributed without profit to those who have expressed a prior interest in receiving the included information for research and educational purposes. If you wish to use copyrighted material from this site for purposes of your own that go beyond ‘fair use’, you must obtain permission from the copyright owner.
========
| |
IDENTIFICATION OF HIGH PROBABILITY TARGET ZONES | |
Learn the HPTZ Methodology!
Identify areas of High Probability for market movements
Set up your charts with accurate Market Road Maps
Available at Amazon.com
| |
The Most Insightful Macro Analytics On The Web | | | | |