The-Lead-Left-logo-with-PC_Newsletter image

PDF | Research | Week of January 8, 2023

Quote of the Week

“The December employment report was stronger than consensus across the board.”

– Stephen Stanley, chief US economist, Santander.

Lead Left Vodcast

Four for '24 (First of a Series)

🔔 Subscribe to our YouTube channel: click here

Watch Now

Four for ’24 (Second of a Series)

marten-bjork-6dW3xyQvcYE-unsplash-scaled image
  1. New Normal Rates: The new macro and what this means. 


The US economy continues to roll along. December’s labor report showed 261,000 new jobs, a vigorous uptick from the 173,000 number in November. Market observers took this as a sign that the Fed’s projected three rate cuts for 2024 may be more back-ended. The current QT policy, draining liquidity from the financial system and bank reserves, may also be under review. Even slowing that tightening would improve market volatility and lower Treasury yields. 


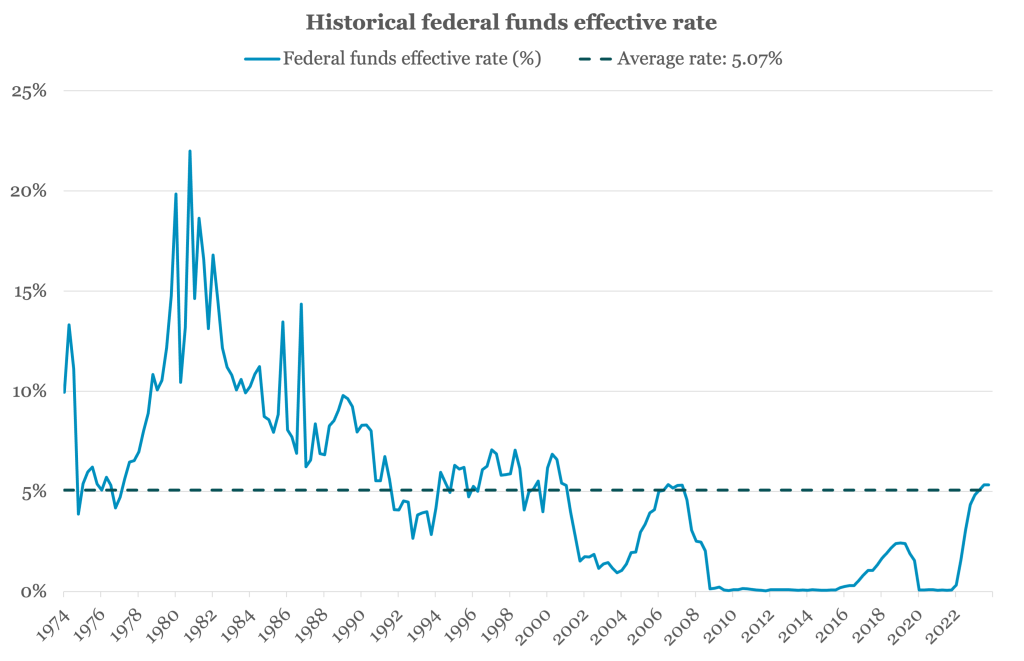
In June 2006 the Federal funds rate rose to 5.25%, the highest level for the benchmark since early 2001 before the dot.com bubble burst. That ushered in over a decade of generations-low rates, a period that finally ended in March 2022. Because many younger financial professionals began their careers during or after the 2008 downturn, their experience has been limited to near-zero interest rates. That leads to a false sense of confidence in the ability of more leveraged borrowers to withstand significantly higher rates and a potential recession...

Read More

February 6 & 7, 2024

Encore at the Wynn in Las Vegas, NV

SFNet’s Asset-Based Capital Conference 2024

Doing What We Do Best

Learn More

#SFNetABCC24

Chart of the Week

The New Old Normal

US interest rates have returned to their average levels of the past half century.

CTW-0108-1024x661 image

Source: Board of Governors of the Federal Reserve System

(Past performance is no guarantee of future results.)

Lead with Your Left

30-DAY FREE MEMBERSHIP


Join the leading voice of the middle market. Try us free for 30 days.
Learn More

Stat of the Week

Jan-8-2024-Stat-edited image

Loan Stats at a Glance 

PitchbookLCD-Logo-for-newsletter image
LCD-2024-01-08-1024x479 image

Contact: Ryan Brown/ PitchBook LCD

PDI Picks

Allocations challenged, but sentiment is positive

pdi-0108-1 image

Last year saw limited partners rein back on their private credit commitments, but there’s no lack of confidence in prospects for the asset class.

In 2023, limited partners were cautious about allocations to alternative assets in general – private credit may have suffered a little less than some other areas of investment, but it still suffered...

Read More

Leveraged Loan Insight & Analysis

Daily Analytic: 4Q23 syndicated middle

market volume declines 16% in 4Q23

LSEG-0108-1024x646 image

US syndicated middle market loan volume totaled US$24.6bn in 4Q23, 16% lower than 3Q23's total and the lowest quarterly level since 3Q20. Non-sponsored volume was markedly lower, totaling US$17.0bn last quarter...

Read More

Contact: David Puchowski / LSEG LPC

The Pulse of Private Equity

P.E. Deal Activity

US PE dealmaking finished the year similar to how it started: still struggling to find a bottom. Q4 2023 deal value declined 22.6% YoY, although deal count appears to be firming. For the full year...

Read More & Download  Data & Report

Contact: Garrett Black / PitchBook

KBRA Direct Lending Deals: News & Analysis

DLD-Logo image

2023 Default Volume, Count

DLD1-0108-2-1024x633 image

2023 Default Rates

DLD2-0108-2048x1191 image

Contact: Eric Rosenthal / KBRA DLD

Middle Market & Private Credit

Fitchratings-for-newsletters image

Fitch’s U.S. Middle Market Outlook

Fitchratings-0108-2048x1298 image
Fitchratings2-0108-1024x612 image
Fitchratings3-0108-2048x1424 image

The distribution of middle market (MM) issuers’ Outlooks within Fitch’s portfolio stayed relatively flat in 2023 compared with 2022. Approximately 11% of MM issuers have a Negative Outlook or Watch, relatively unchanged from 2022, and a large decline from 30% in 2020. Net upgrades have hovered around zero so far this year...

Read More & Download Report

Contact: Brad Hamner / FitchRatings

Covenant Trends 

Average New-Issue Clearing Spreads (Single B) and Covenant Terms for All First-Lien

Institutional Loans

CovenantReview-0108-1-1024x646 image
Download Data

Contact: Steven Miller / Covenant Review

High-Yield Bond Statistics

Launched Volume

Levfin-Launched-volume-0108-1024x615 image

New-issue Yields

Levfin-NIY-0108-1-1024x593 image

Weekly Fund Flows

Levfin-wff-0108 image

Weekly fund flows source: Lipper

Download Data

Contact: Robert Polenberg / LevFin Insights

Private Debt Intelligence

Preqin-vF image

Special situations funds close over

target in North America 

PREQIN-1211-2048x1310 image

The average percentage of target size at final close for North American special situations funds has reached over 100% in 2023 year to date (YTD)...

Read More & Download Data

Contact: Megan Harris / Preqin

Debtwire Middle-Market

debtwire-0108-1024x496 image

The blue line in the chart is the current dividend yield of the *VanEck BDC Income ETF (currently at 10.7% as of 8 January, down from the highest level in last 12 months of 12.1% in May 2023) that tracks the overall performance of publicly traded business development companies (BDCs, lenders to privately held middle-market businesses that tend to be below investment grade or not rated, with most lending comprising of senior secured loans)...

Read More & Download Data

Contact: Suneet Chandvani / Debtwire 

Middle Market Deal Terms at a Glance

SPP-11 image

Contact: Stefan Shaffer / SPP Capital Partners

Churchill-2020-logo-white-for-event-invite image
STAY CONNECTED
Twitter  Linkedin  Youtube  

This publication is a service to our clients and friends. It is designed only to give general information on the market developments actually covered. It is not intended to be a comprehensive summary of recent developments or to suggest parameters for any prospective financing opportunity.