|
Gordon T Long Research exclusively distributed at MATASII.com
Subscribe to Gordon T Long Research - $35 / Month - LINK
Complete MATASII.com Offerings - $55/Month - LINK
SEND YOUR INSIGHTFUL COMMENTS - WE READ THEM ALL - lcmgroupe2@comcast.net
| |
CURRENT MARKET PERSPECTIVE | |
|
BEWARE: NOT EVERYTHING WE SEE IS REAL!
"GOOD NEWS IS NOW GOOD NEWS!"
Click All Charts to Enlarge
| |
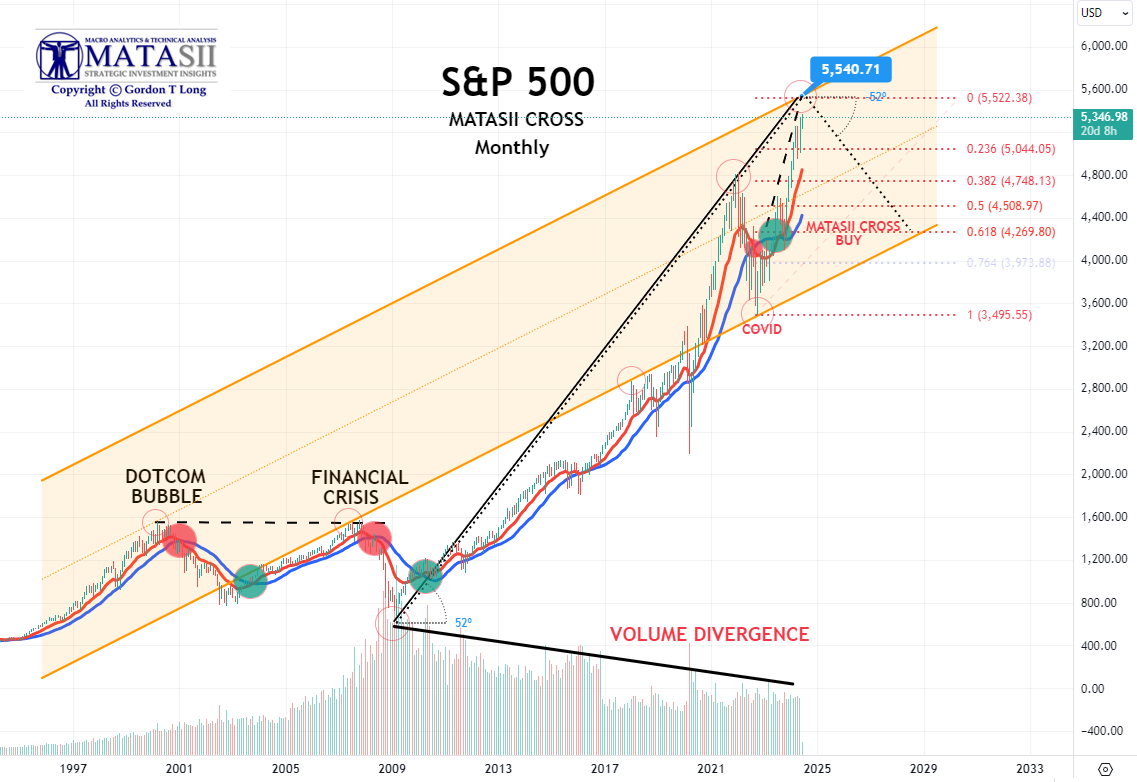
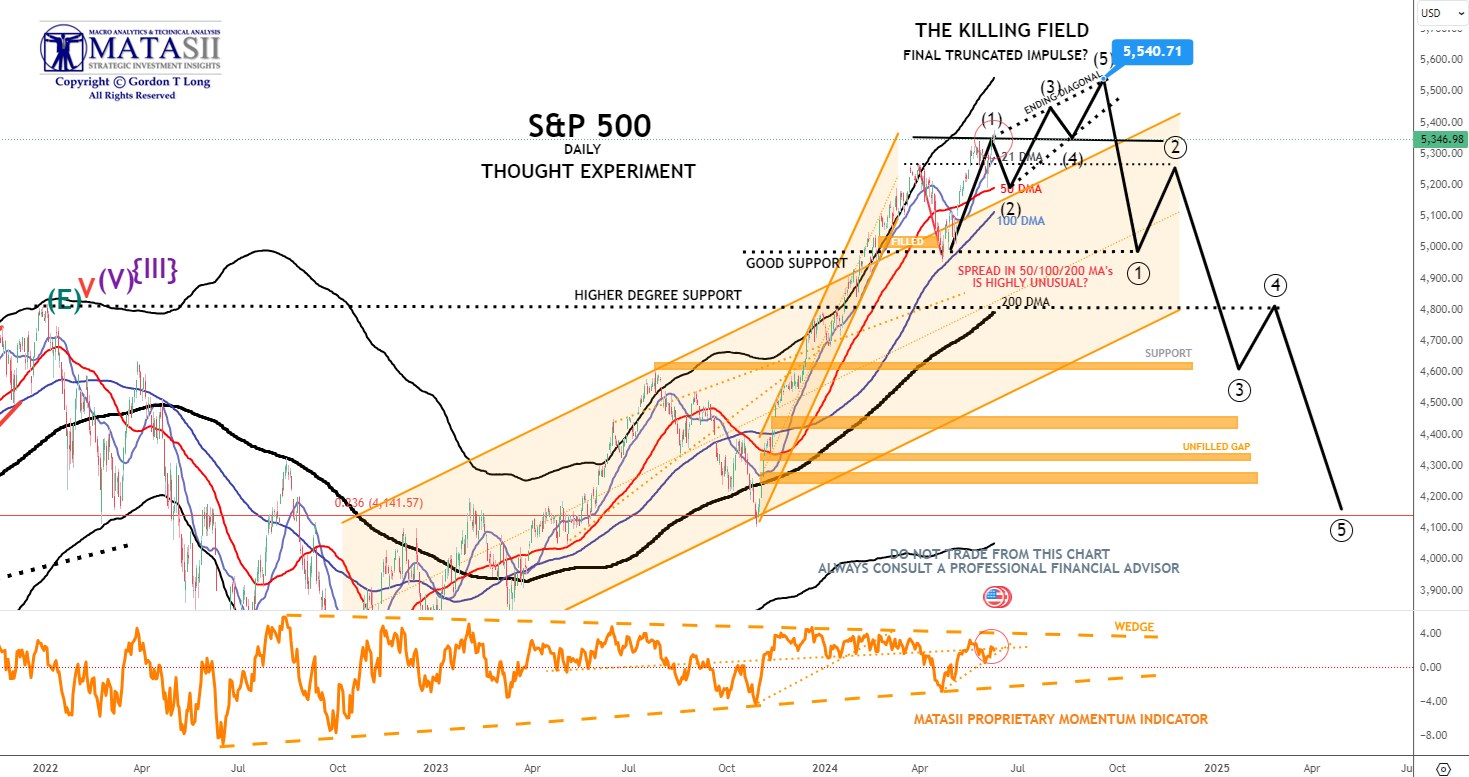
MONTHLY MATASII CROSS STILL A BUY - The S&P 500 target price of 5540 shown above matches our S&P 500 "Thought Experiment" which we have been showing in our Newsletter for a few months now. The "Thought Experiment" is a shorter Daily view analysis which matches the above Monthly analysis connecting multiple intersection reference points. The reference points are shown by seven non-shaded red circles within a trend channel and rate of change analysis. We have found that a multitude of these connecting factors often "point the way" through more or less long term controlling market "boundary conditions". | |
|
1 - SITUATIONAL ANALYSIS
SOMETHING JUST ISN'T RIGHT??
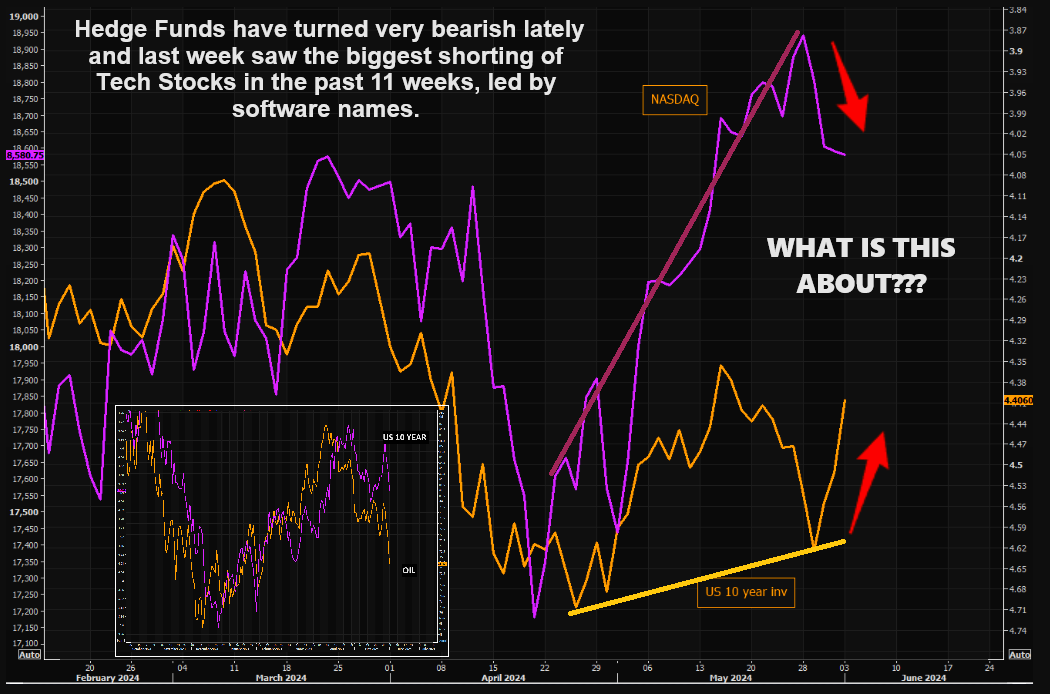
Wednesday night I pointed out that something wasn't right with the Inverse 10Y Treasury Yield not trading in concert with the Nasdaq (chart below)?
| |
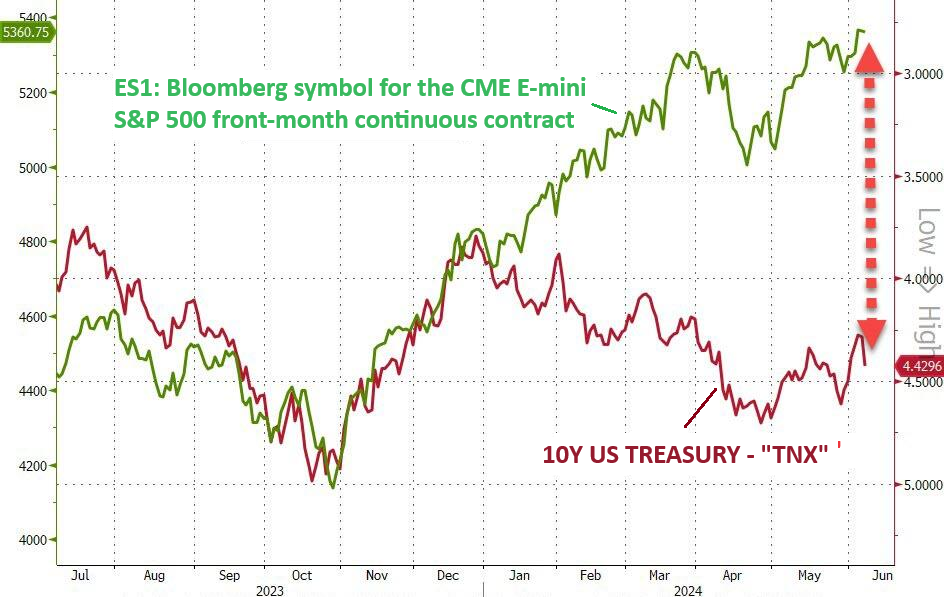
We are also seeing the 10Y Treasury Yield diverging significantly against the e-Mini contract (chart top right).
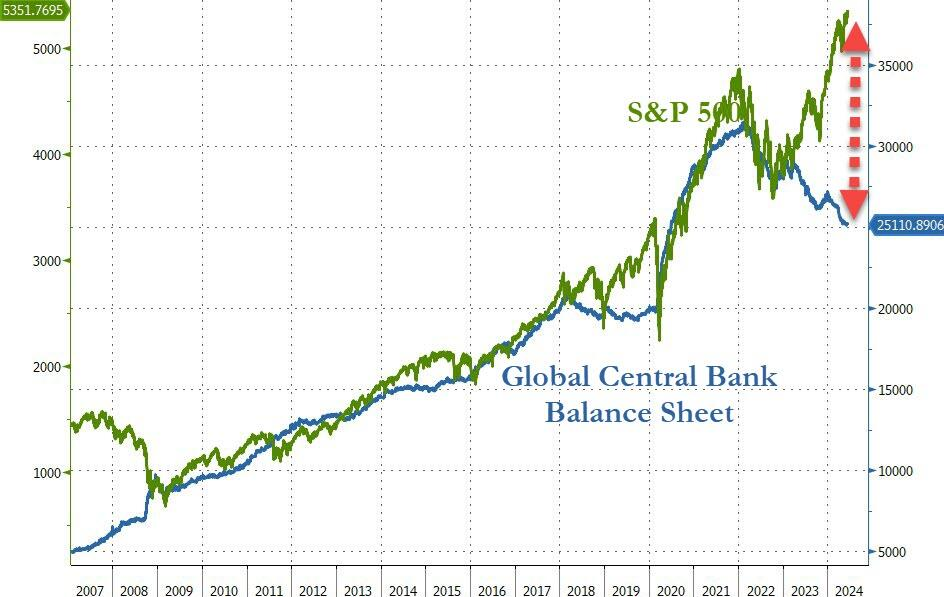
Additionally, we see the S&P 500 diverging significantly from the Global Central Bank Balance Sheet (chart right).
| |  |
| |
|
WHAT EXPLAINS THE DIFFERENCE?
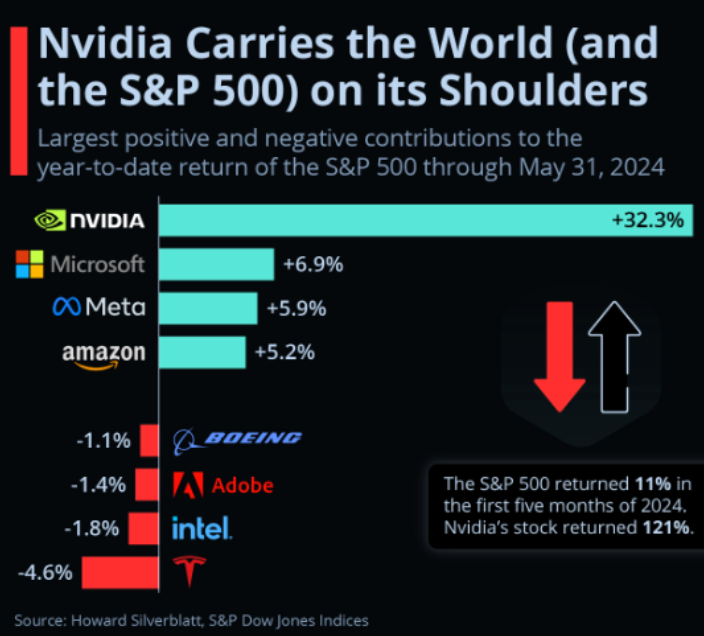
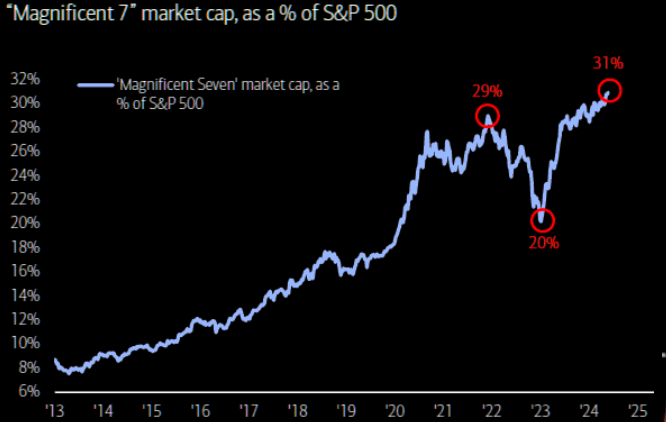
The short answer to explain the divergences above is the extreme and historic narrowness of the Breadth of the US Equity market. The market is now controlled by the Magnificent 7 in a manner never seen before. The Magnificent 7 ascent has been built on effective use and funding of Stock Buybacks. Since January of 2024 the further parabolic explosion of the Magnificent 7 has been further fueled by Nvidia and the current AI Mania.
The long answer involves a full understanding of the role Shadow Banks (specifically Private Equity players) are now playing in global equity markets, corresponding shrinking stock floats & pools and the colossal growth in controlling derivative trading.
That discussion we must leave for a future subscriber video.
| |
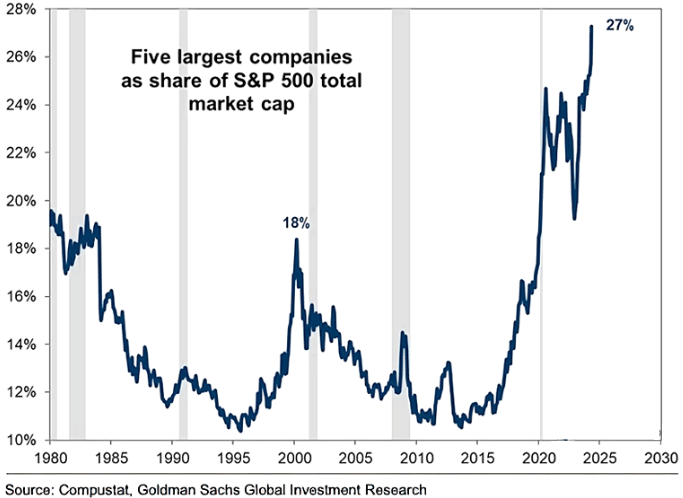
27%: Five largest companies as share of S&P 500 total market capitalization. | | |
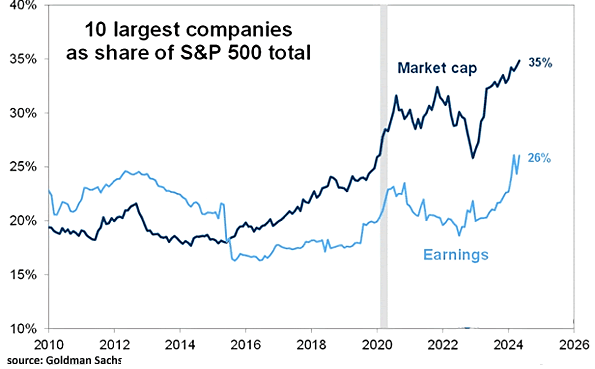
35%: Ten largest companies as share of S&P 500 total. | | |
|
"AS GO THE FINANCIALS, SO GO THE BANKS: AS GO THE BANKS, SO GO THE MARKETS"
MATASII FINANCIAL STOCK INDEX
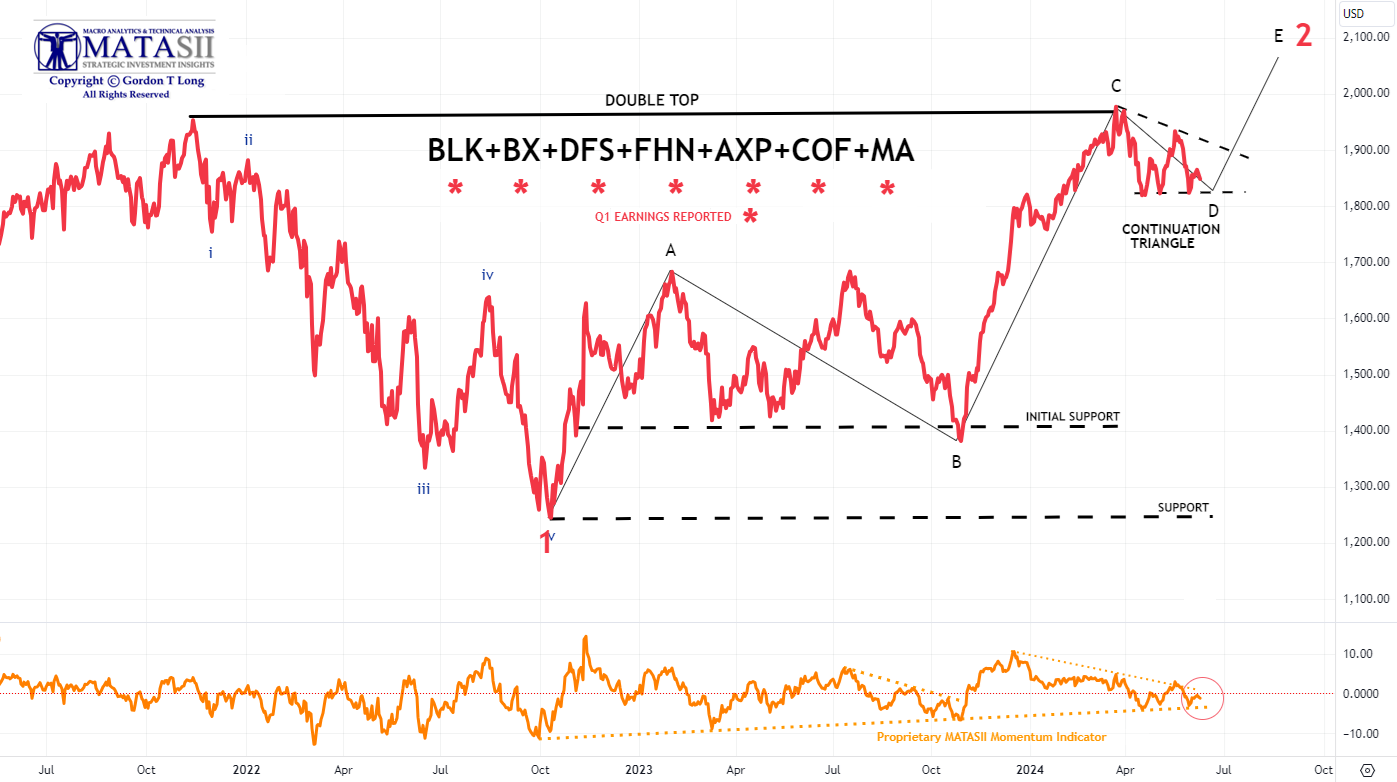
We continue to keep an eye on both the Bank and Financial stocks to give us an early signal of market direction. We have been showing the banks over the last few weeks, but the Financials now appear to be giving a clearer signal.
- The MATASII Financial Index stocks have begun to exhibit a potential continuation triangle pattern.
- The Elliott Wave analysis supports an "E" wave higher as part of an ABCDE pattern.
- Momentum (bottom pane) has found long term support and needs to be watched to see if it breaks shorter term overhead resistance shown by a dotted descending orange momentum trend line.
| |
|
YOUR DESKTOP / TABLET / PHONE ANNOTATED CHART
Macro Analytics Chart Above: SUBSCRIBER LINK
| |
|
2 - FUNDAMENTAL ANALYSIS
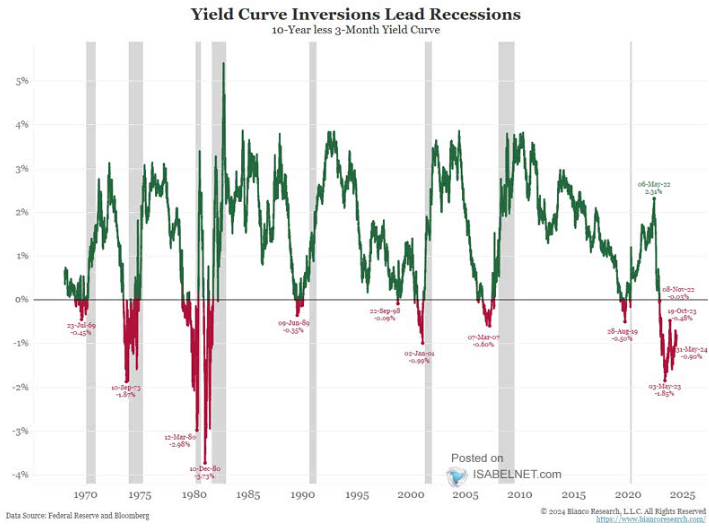
DON'T BELIEVE THE HYPE - A PE KILLING RECESSION IS IN THE WINGS!
Although the 10Y-3Mo Yield Curve is not yet on the verge of inverting, historical data suggests that the "uninversion" is a reliable indictor of an impending recession.
What might trigger that?
We believe it is the breaching of an Unemployment rate of 4.0%. The unemployment rate last month moved up to 3.9%. On Friday it moved to 4.0%.
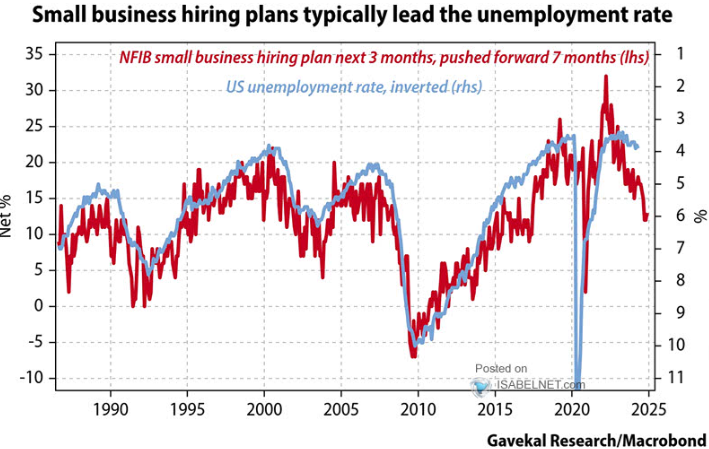
The JOLTS reports, layoffs and rising jobless claims suggest the Labor situation is weakening significantly. The Friday Labor Report, as we will show in tomorrow's Newsletter, is highly manipulated.
CHART BELOW
Small business hiring plans typically lead the US Unemployment Rate. The NFIB small business hiring plans for the next 3 months, when pushed forward 7 months, has proven to be a strong leading indicator. Clearly the signal is for a rising Unemployment Rate to soon occur - maybe Friday?
| |
|
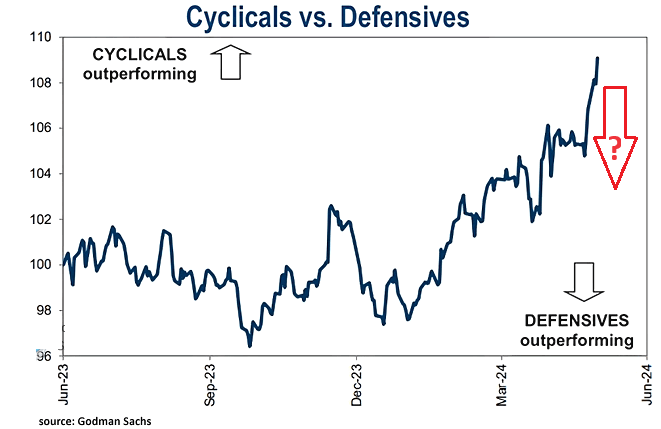
CHART RIGHT:
Investor sentiment is often mirrored in the performance of cyclicals and defensive equities. The anticipation of economic expansion usually prompts a preference for cyclical stocks, causing them to outperform defensive stocks. This is what we have been witnessing with strong earnings outlooks.
However, if the US Unemployment Rate starts to break 4.0%, then the worry of a recession will weaken outlooks and a shift to defensives is likely to occur.
EVERYONE EXPECTS NO LANDING WITH A
FEW EXPECTING A SOFT LANDING -
ARE THEY RIGHT?
| |
|
MARKET DRIVERS
As goes NVDA, so goes the MAG-7, As Goes Mag-7 so goes The Market.
| |
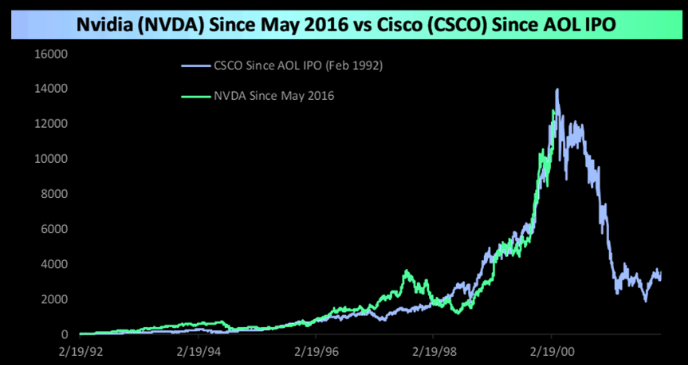
NVDA - Daily
CHART RIGHT: In the chart to the right, we have overlaid the performance of NVDA since May 2016, when Alphabet CEO Sundar Pichai first formally referred to the company as a leader in an “AI first world” to the performance of CSCO starting in February 1992 and America Online had its IPO. As shown, both stocks had insane and strikingly similar runs in the eight years following each of those events. On an ominous note, CSCO’s run at this point was only a month from its ultimate peak before an epic collapse. Then again, though, NVDA CEO Jensen Huang has said that he expects AI to be “bigger than the internet,” so maybe it’s not a fair comparison.
DOES THE MARKET NOW FINALLY BELIEVE NVIDIA HAS GONE TOO FAR, TOO FAST???
- Five years ago, Nvidia had a market cap of just $100 billion. It is now the 3rd largest public company in the world and 17% away from being larger than Apple.
- Nvidia is now larger than Tesla and Amazon combined.
- Nvidia is now larger than the entire German stock market.
- At $2.6 trillion, Nvidia's market cap is now $890 billion higher than all of the companies in the S&P 500 Energy sector combined. The total net income of the Energy sector is $128 billion vs. $43 billion for Nvidia.
- Nvidia's share of the Data Center Computer market has grown from ~15% five years ago to ~80% today.
- NVDA opened another Unfilled Gap this week as it reached for new highs yet again before pulling back slightly on Thursday & Friday.
- NVDA's lift this week pushed through the upper channel boundary trend line.
- The MATASII Proprietary Momentum Indicator (lower pane) appears to be attempting to roll over.
-
The Dotted Black Trend line in the MATASII Proprietary Momentum Indicator pane is suggesting a potential Divergence has been set up. This is normally seen as a warning to the downside that is ahead if the Divergence isn't removed by a movement higher in Momentum.
- At some point the major unfilled gaps (at much lower levels) must be filled. NVDA therefore may no longer become a Short to Intermediate Long Term hold, but rather a position trading stock as others entering the space and force margins to contract.
|  | |
YOUR DESKTOP / TABLET / PHONE ANNOTATED CHART
Macro Analytics Chart Above: SUBSCRIBER LINK
| |
MAGNIFICENT 7
Magnificent 7 is up a magnificent 24% YTD (chart right), contributing >50% of SPX return (NVDA alone = 25%) as monopolistic mega tech monopolizes performance.
Total CAPEX + R&D for the Magnificent Seven this year is expected to total $348bn. (Think about that for a second.)
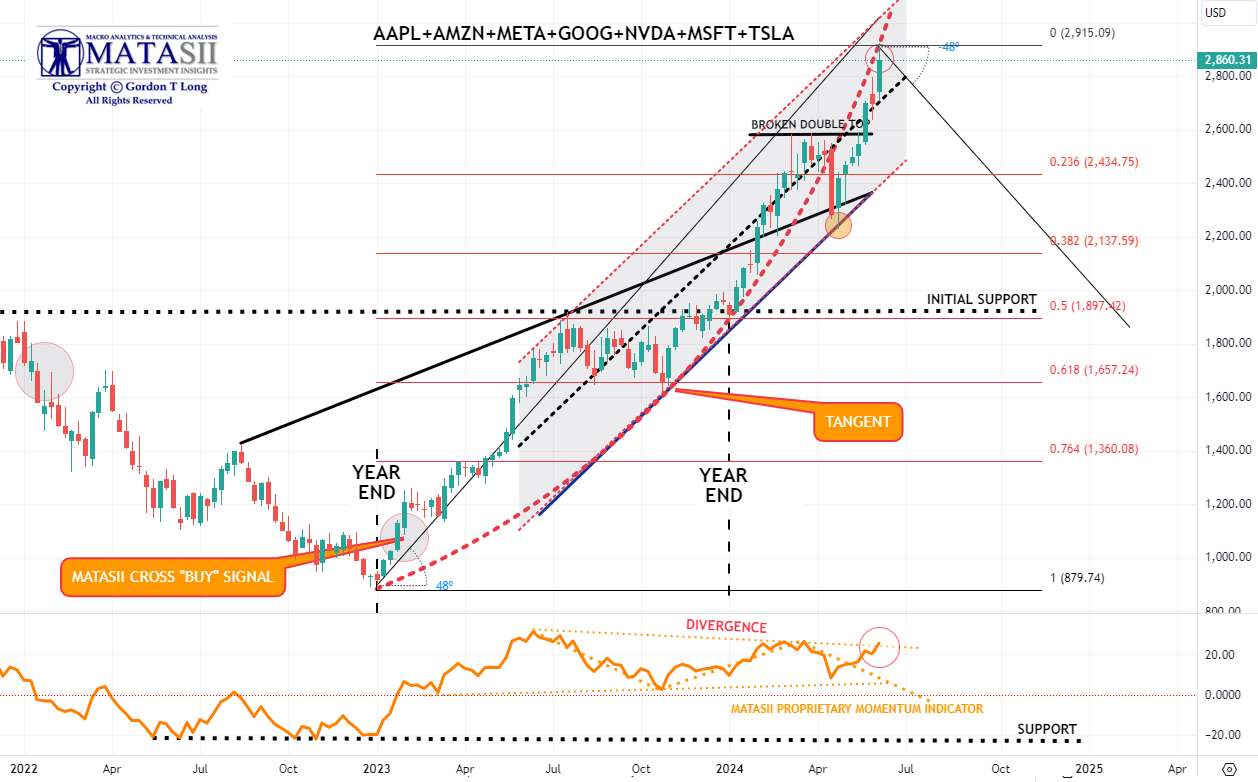
Here’s another way to frame it - the Magnificent 7 is reinvesting 61% of their operating free cash flow back into
CAPEX + R&D!
- The basket of 'Magnificent 7' stocks soared for the 6th week in the last 7 (and the best week in the last 7) before pulling back at the end of the week.
- The Magnificent 7 reached its rising parabolic trend (dashed red line).
- We continued to be concerned about the momentum Divergence signal that has been occurring for some time (bottom pane). NVDA has obviously extended the duration of the signal which we have tested again this week. When this occurs often there is normally a significant drop that occurs. Caution advised.
|  | |
YOUR DESKTOP / TABLET / PHONE ANNOTATED CHART
Macro Analytics Chart Above: SUBSCRIBER LINK
| |
"CURRENCY" MARKET (Currency, Gold, Black Gold (Oil) & Bitcoin) | |
|
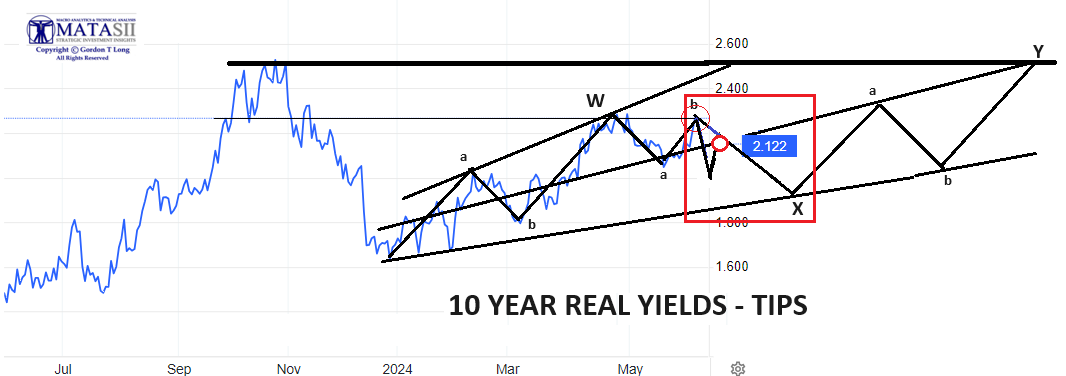
10Y REAL YIELD RATE (TIPS)
Real Rates reached our initial overhead resistance level of 2.25% before falling off hard as part of our expected "X" leg lower (chart right). On Friday the Biden Admin's apparent strong Labor Report pushed yields higher, taking needed pressure off the Fed to reduce rates.
| |
CONTROL PACKAGE
There are TEN charts we have outlined in prior chart packages, which we will continue to watch closely as a CURRENT Control Set:
-
US DOLLAR -DXY - MONTHLY (CHART LINK)
-
US DOLLAR - DXY - DAILY (CHART LINK)
-
GOLD - DAILY (CHART LINK)
-
GOLD cfd's - DAILY (CHART LINK)
-
GOLD - Integrated - Barrick Gold (CHART LINK)
- SILVER - DAILY (CHART LINK)
-
OIL - XLE - MONTHLY (CHART LINK)
-
OIL - WTIC - MONTHLY - (CHART LINK)
-
BITCOIN - BTCUSD -WEEKLY (CHART LINK)
-
10y TIPS - Real Rates - Daily (CHART LINK)
GOLD - DAILY
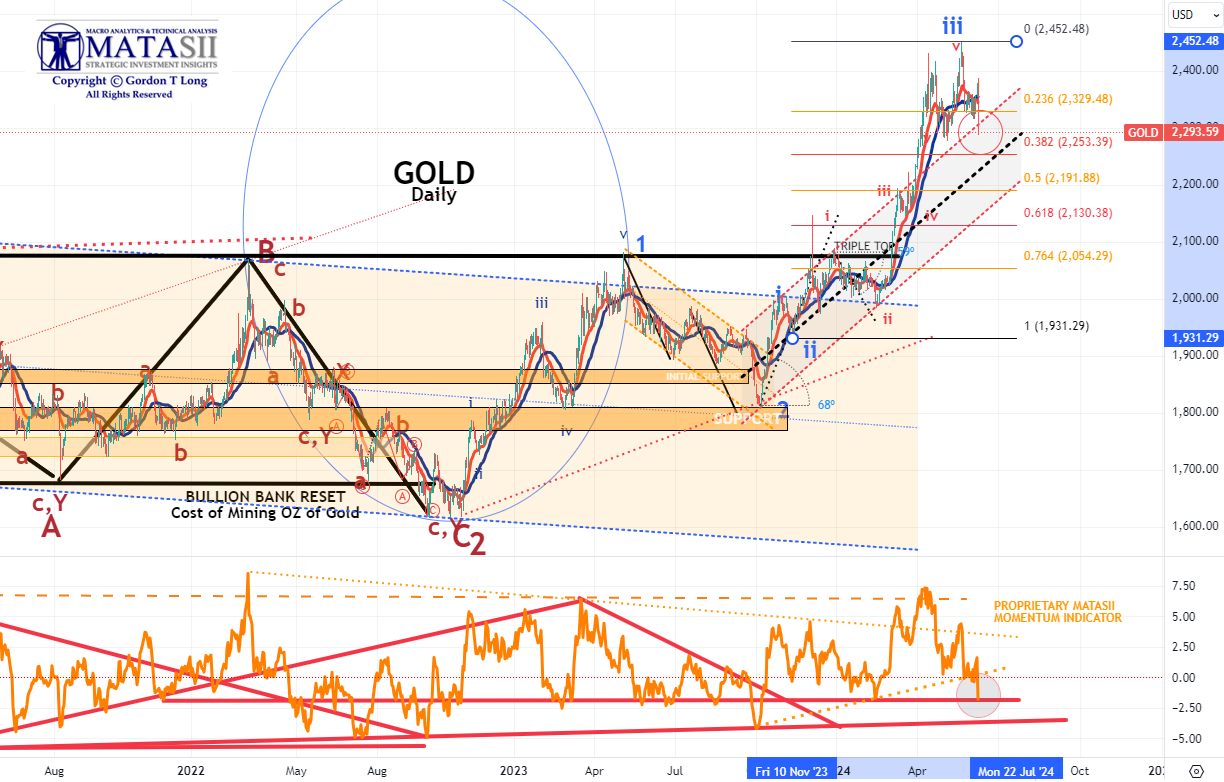
- Gold started to move again this week after the recent profit taking, was up a solid $27 Wednesday and putting in an all-time high. Friday's strong Labor report ruined the party and gold sold off substantially to 2293/oz.
- The Elliott Wave count still suggests a strong likelihood of a minimum retracement of 38.2% and likely in the area of 50% of this last "iii" leg.
- Momentum support (lower pane) shows gold has found an important support line. it should be noted there is another one even longer, slightly lower.
|  | |
YOUR DESKTOP / TABLET / PHONE ANNOTATED CHART
Macro Analytics Chart Above: SUBSCRIBER LINK
| |
|
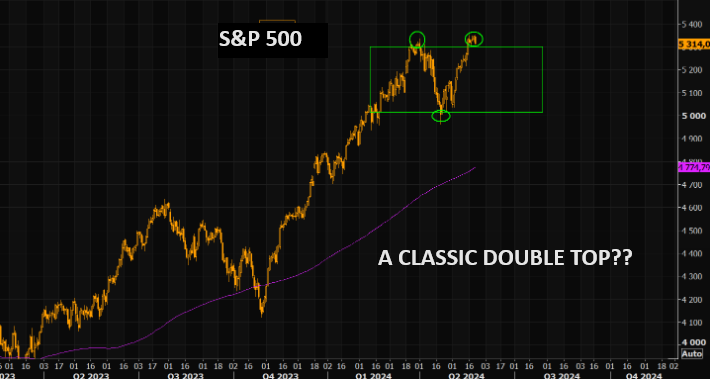
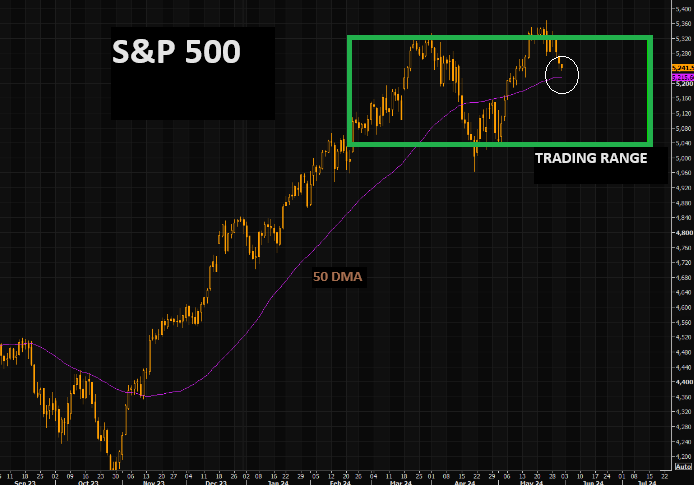
CHART RIGHT: We have seen bears throw in the towel lately, but what if this is just another overshoot? We have seen similar setups play out before. Believe it or not, but this is the biggest down candle for the SPX since April 30th.
CONTROL PACKAGE
There are FIVE charts we have outlined in prior chart packages that we will continue to watch closely as a CURRENT "control set":
- The S&P 500 (CHART LINK)
- The DJIA (CHART LINK)
- The Russell 2000 through the IWM ETF (CHART LINK)
- The MAGNIFICENT SEVEN (CHART ABOVE WITH MATASII CROSS - LINK)
- Nvidia (NVDA) (CHART LINK)
| |
CHART RIGHT: We are stuck and need new narratives. The range that has been in place for months continues to hold. SPX is trading at the same levels we traded at in mid March. Note the 50 day coming in.
S&P 500 CFD
- The S&P 500 cfd rose aggressively this week towards its upper trend channel boundary line (NOTE: see Thought Experiment note below.)
- However, the MATASII Proprietary Momentum Indicator (middle pane) appears to be showing signs of weakening within a Divergence pattern with price.
| |
YOUR DESKTOP / TABLET / PHONE ANNOTATED CHART
Macro Analytics Chart Above: SUBSCRIBER LINK
| |
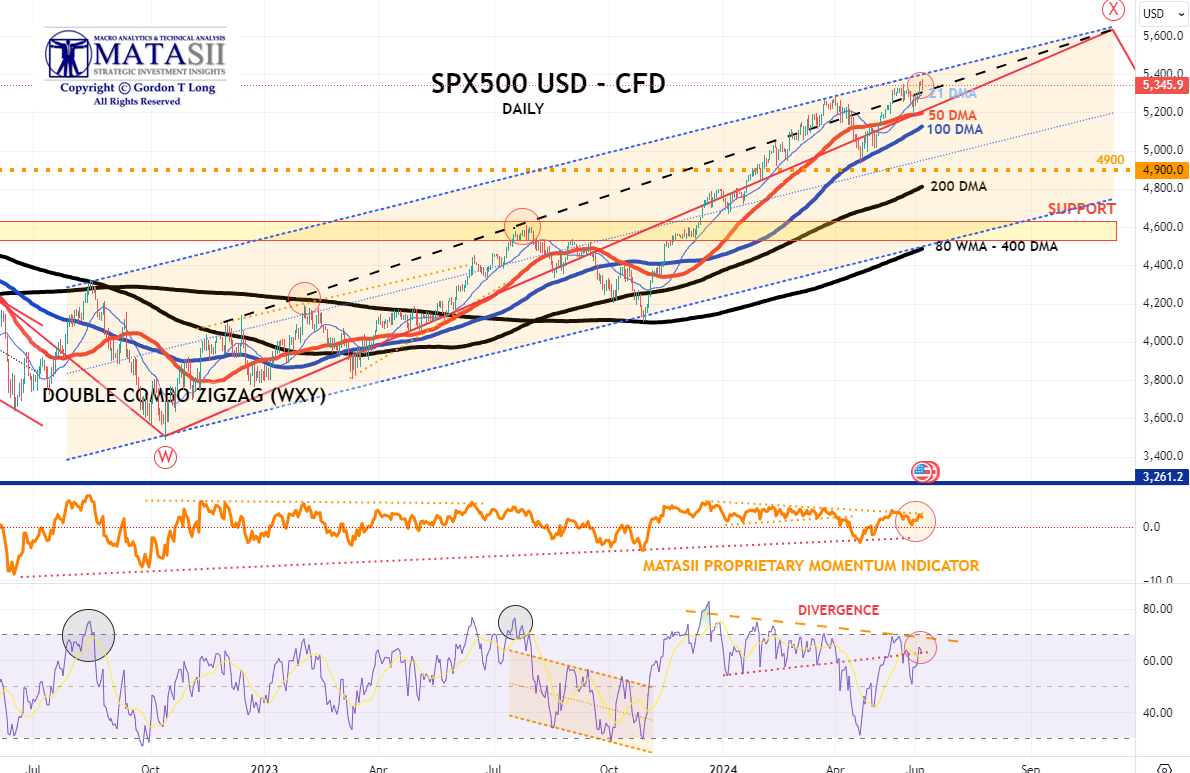
S&P 500 - Daily - Our Thought Experiment
Our Thought Experiment, which we have discussed many times previously in the way of a projection, suggests we have put in a near term top and will now consolidate before possibly completing one final small impulse higher OR put in a final Wave 5 of a higher degree.
NOTE: To reiterate what I previously wrote - "the black labeled activity shown below, between now and July, looks like a "Killing Field" where the algos take Day Traders, "Dip Buyers", the "Gamma Guys" and FOMO's all out on stretchers!"
- With an expected tidal wave of easing about to be unleashed by all central banks (Canada lowered rates Wednesday and the ECB lowered rates Thursday), it is no surprise that the S&P just hit a new all time high this week, up a whopping 30% from the October lows.
- However, the MATASII Proprietary Momentum Indicator appears to be showing signs of weakening (lower pane) with support quite a bit lower.
- The Divergence in Momentum (lower pane) needs to be noted along with a clear long term ending wedge.
OUR CURRENT ASSESSMENT IS THAT THE INTERMEDIATE TERM IS LIKELY TO LOOK LIKE THE FOLLOWING:
(NOTE - The black projection has not been changed since prior posts so as to serve as a reference.)
|  | |
YOUR DESKTOP / TABLET / PHONE ANNOTATED CHART
Macro Analytics Chart Above: SUBSCRIBER LINK
| |
STOCK MONITOR: What We Spotted
| | | |
CONTROL PACKAGE
Remember when "developed world" central banks pretended their inflation target was 2%? Well, that lie died a miserable death today - and will do so again for good measure tomorrow - after the BOC cut rates for the first time in 4 years, and less than a year after its last rate hike, from 5.0% to 4.75%. even as Canada's inflation remains a very sticky 2.7%.
And just to underscore the death of the 2% inflation target, tomorrow the ECB will also cut rates for the first time since March 2016 (and 8 months after the last rate hike), even though core Eurozone CPI remains 3%.
Of course, despite all the posturing, the Fed won't be far behind, especially once it becomes clear that the myth of strong US job growth was just a mirage, and either in July or September, the Fed will join the party despite core US inflation stuck at a blistering 2.8%.
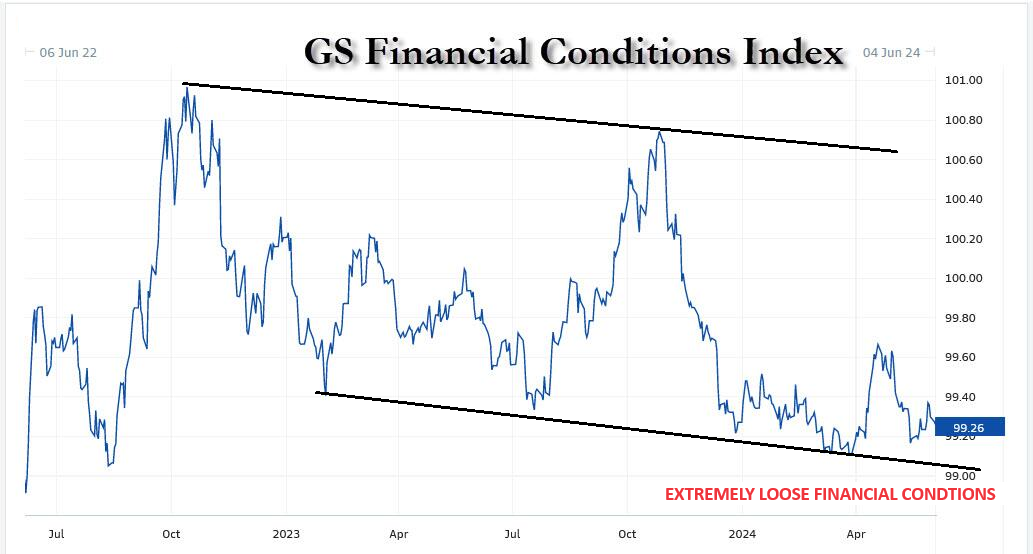
It was this long overdue realization that the G7 central banks have officially raised their inflation target by about 1% that helped pushed bond yields to fresh two month lows, and down more some 35bps in just the past week, down for a 5th straight day as financial conditions have eased dramatically (see chart of Goldman Financial Conditions Index above), undoing any jawboned tightening the Fed tried to inject into the market in recent months: indeed, the latest rate pricing shows a sharp dovish shift in the Fed cut narrative for Sept, rising to 80% vs 45% just one week ago. As Goldman's trader notes, CTAs will become a focus if yields keep moving lower. -- Tyler Durden
There are FIVE charts we have outlined in prior chart packages that we will continue to watch closely as a CURRENT "control set":
- The 10Y TREASURY NOTE YIELD - TNX - HOURLY (CHART LINK)
- The 10Y TREASURY NOTE YIELD - TNX - DAILY (CHART LINK)
- The 10Y TREASURY NOTE YIELD - TNX - WEEKLY (CHART LINK)
- The 30Y TREASURY BOND YIELD - TNX - WEEKLY (CHART LINK)
- REAL RATES (CHART LINK)
FISHER'S EQUATION = 10Y Yield = 10Y INFLATION BE% +REAL % = 2.307% + 2.122% = 4.429%
| |
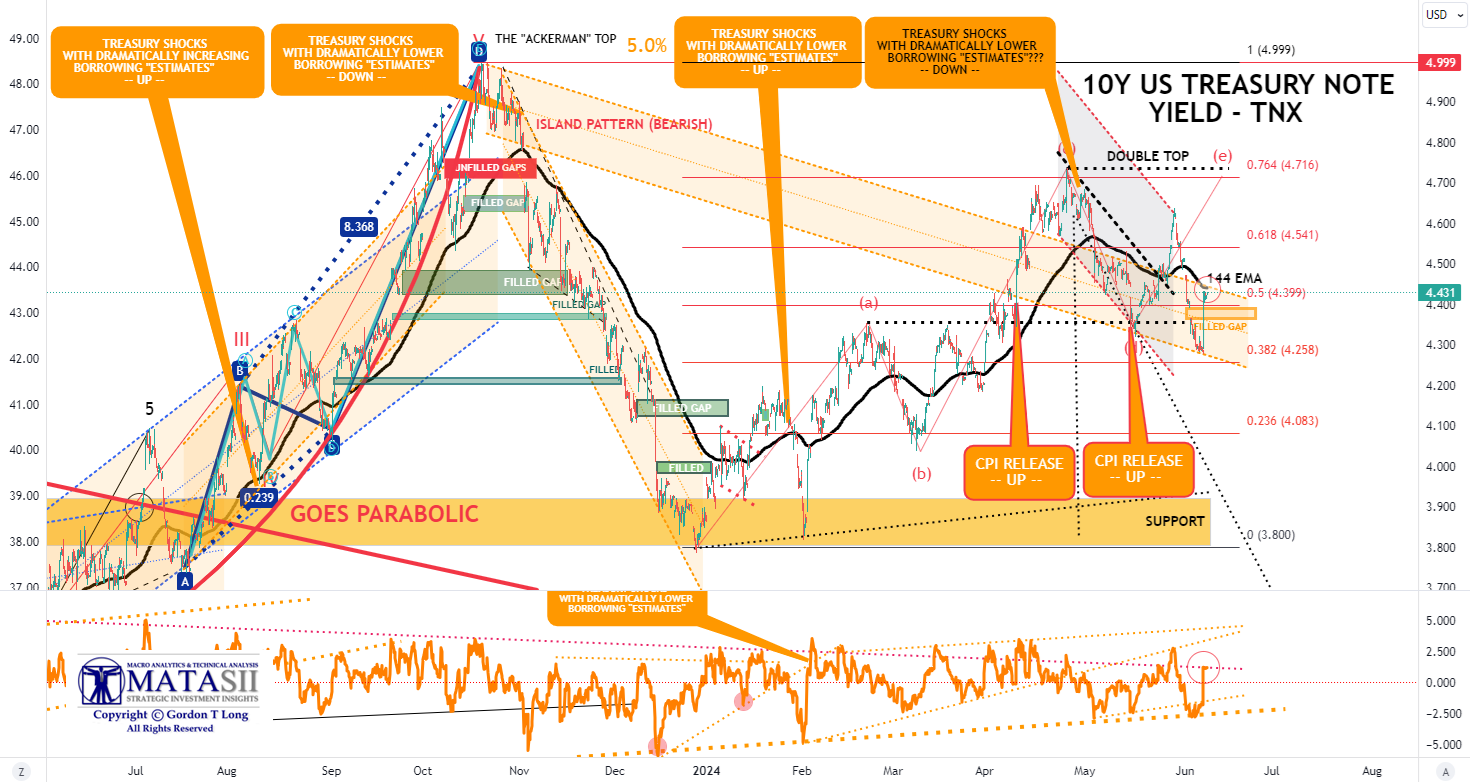
10Y UST - TNX - Hourly
- The TNX had continued to plunge since the release of the PCE until Friday's Labor Report which pushed yields up dramatically to 144 EMA overhead resistance.
- Momentum (lower pane) appears to have reached a longer term support line.
| |
YOUR DESKTOP / TABLET / PHONE ANNOTATED CHART
Macro Analytics Chart Above: SUBSCRIBER LINK
| |
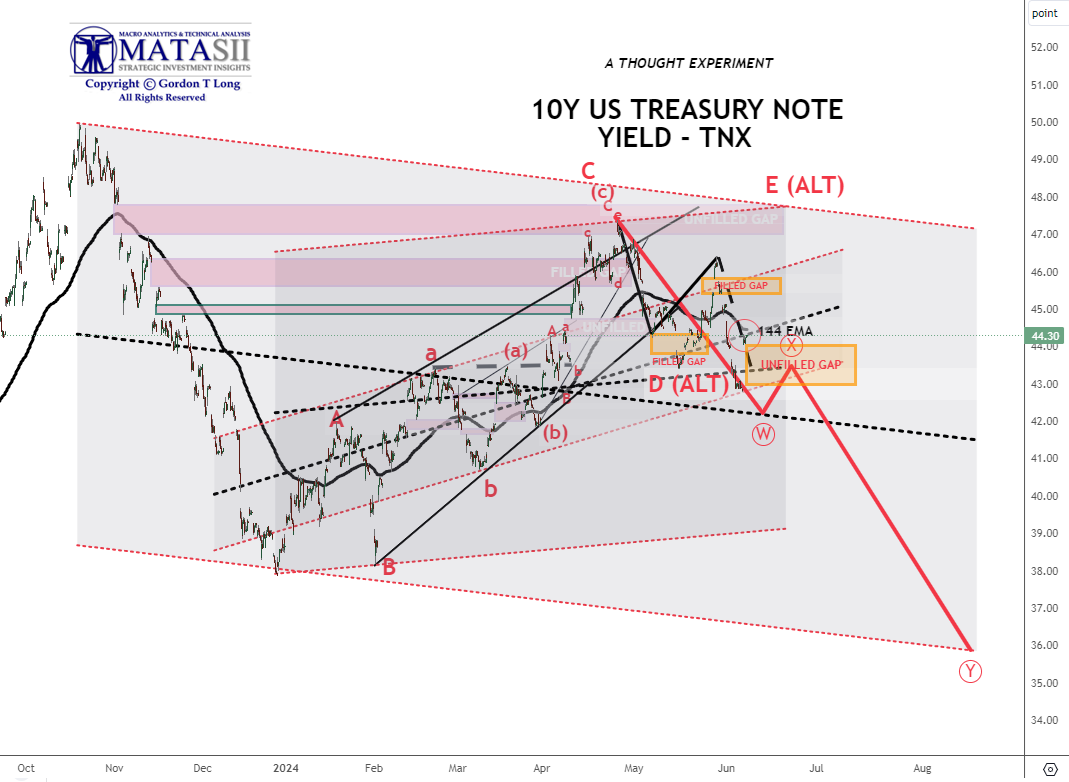
10Y UST - TNX - NASDAQ - Hourly
- The TNX (NASDAQ) continued to plunge since the release of the PCE until Friday's Labor Report.
- The "ALT E" count is back in play but a low probability.
| |
YOUR DESKTOP / TABLET / PHONE ANNOTATED CHART
Macro Analytics Chart Above: SUBSCRIBER LINK
| |
NOTICE Information on these pages contains forward-looking statements that involve risks and uncertainties. Markets and instruments profiled on this page are for informational purposes only and should not in any way come across as a recommendation to buy or sell in these assets. You should do your own thorough research before making any investment decisions. MATASII.com does not in any way guarantee that this information is free from mistakes, errors, or material misstatements. It also does not guarantee that this information is of a timely nature. Investing in Open Markets involves a great deal of risk, including the loss of all or a portion of your investment, as well as emotional distress. All risks, losses and costs associated with investing, including total loss of principal, are your responsibility.
FAIR USE NOTICE This site contains copyrighted material the use of which has not always been specifically authorized by the copyright owner. We are making such material available in our efforts to advance understanding of environmental, political, human rights, economic, democracy, scientific, and social justice issues, etc. We believe this constitutes a ‘fair use’ of any such copyrighted material as provided for in section 107 of the US Copyright Law. In accordance with Title 17 U.S.C. Section 107, the material on this site is distributed without profit to those who have expressed a prior interest in receiving the included information for research and educational purposes. If you wish to use copyrighted material from this site for purposes of your own that go beyond ‘fair use’, you must obtain permission from the copyright owner.
========
| |
IDENTIFICATION OF HIGH PROBABILITY TARGET ZONES | |
Learn the HPTZ Methodology!
Identify areas of High Probability for market movements
Set up your charts with accurate Market Road Maps
Available at Amazon.com
| |
The Most Insightful Macro Analytics On The Web | | | | |