|
Morning Coffee & Ag Markets
Monday, April 21, 2025
| | |
|
Preliminary Analysis Suggests Historic Flooding Results in $79 Million in Crop-Related Damages
Dr. Hunter D. Biram, Assistant Professor and Extension Agricultural Economist, University of Arkansas
Dr. Ryan Loy, Assistant Professor and Extension Agricultural Economist, University of Arkansas
| |
Background
Over the span of April 2, 2025 through April 5, 2025, the National Weather Service (NWS) at Little Rock, Arkansas and Memphis, Tennessee reported the equivalent of three months of expected[1] rainfall (i.e., 12 inches) with six inches of rain reported on April 5th, alone. While early season rainfall is generally beneficial to produce agricultural crops, excess rainfall can result in significant economic losses leaving farmers and those throughout the industry left to deal with the fallout. In this fact sheet, we estimate the economic impact of this “generational” flooding (Brooks, 2025) on the Arkansas agricultural crop sector. Using field-level reports, crop enterprise budgets, and historical insurance loss data, we provide a preliminary estimate of the economic impact to be $78,932,457.
Field-Level Data Collected on Flooded Crop Acreage
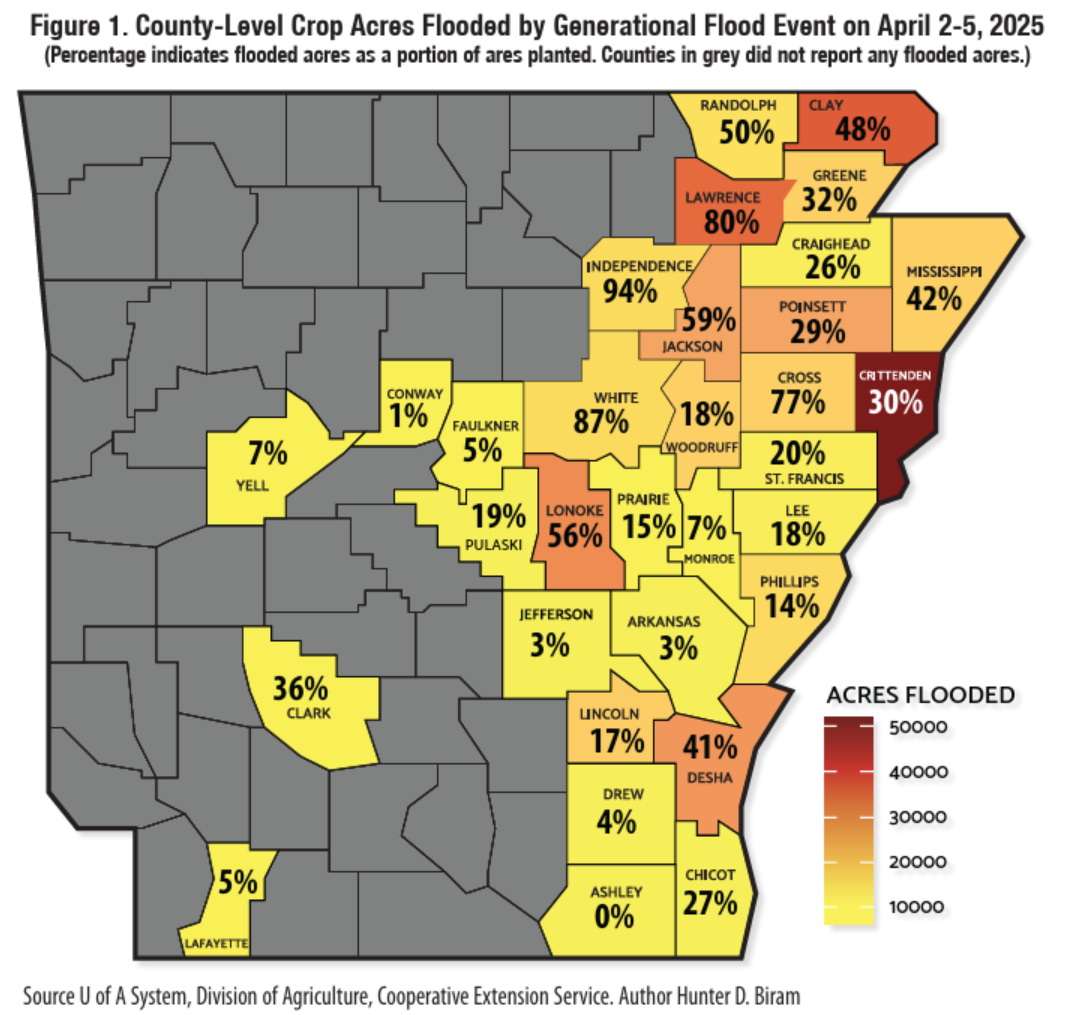
We surveyed county extension agents across 32 impacted counties in Arkansas, which account for nearly 90% of all historical[2] acres planted, and asked them how many acres had been planted prior to the flood event and how many acres were flooded over the April 2-5 time frame. We collected acreage data for corn, rice, soybeans, and wheat since these crops have either had some acreage planted or had a fully emerged crop prior to the flood event. The 2025 planted acreage totaled 839,798 acres (i.e., 13% of historical acreage) with 31% of these acres reported as having been flooded as of April 7, 2025. Corn, rice, soybeans, and wheat accounted for 23%, 46%, 30%, and 1% of total flooded acres, respectively. This is reflective of the planting progress of each crop, as well as the historical crop mix with corn, rice, soybeans, and wheat accounting for 8%, 22%, 50%, and 8% of historical acres planted. A county-specific breakdown of flooded acreage is provided in figure 1 below.
[1] According to the 1991-2020 NWS daily Precipitation normal, 12.60 inches is the usual accumulated rainfall total over the January through March time frame.
[2] We define “historical acres planted” to be the average of USDA-NASS planted acreage for principal crops grown in Arkansas (i.e., corn, cotton, peanuts, rice, sorghum, soybeans, wheat) over the span 1999-2023. This equates to an average of 6,400,695 planted acres.
| | Figure 1. County-Level Crop Acres Flooded by Generational Flood Event on April 2-5, 2025 | | |
Figure 1. County-Level Crop Acres Flooded by Generational Flood Event on April 2-5, 2025 The map above shows the number of acres flooded, as of April 7, reported by U of A Cooperative Extension Service county extension agents. The percentages indicate flooded acres as a portion of acres planted. For example, there was about 50,000 acres that flooded in Crittenden County as of April 7, 2025 which accounts for 30% of the acres planted thus far. (Source: U of A System, Division of Agriculture, Cooperative Extension Service Fact Sheet Number FSA93)
Measuring Economic Impact Using Replant and Production Losses
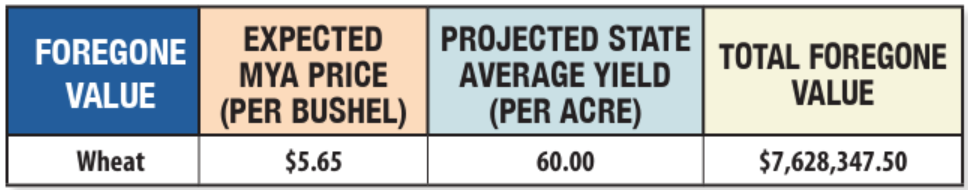
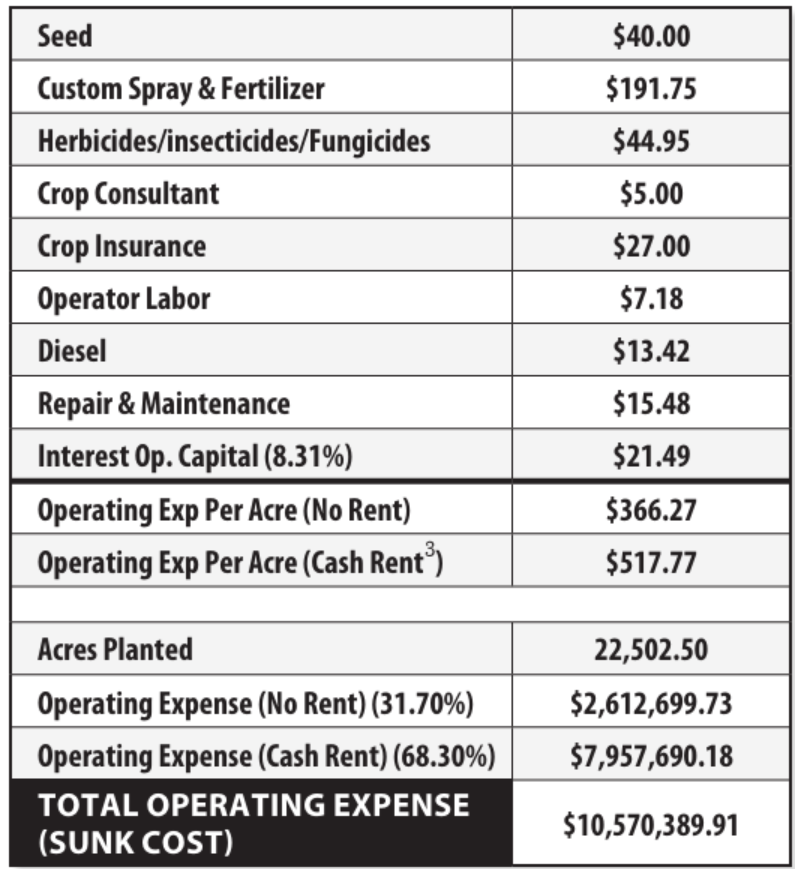
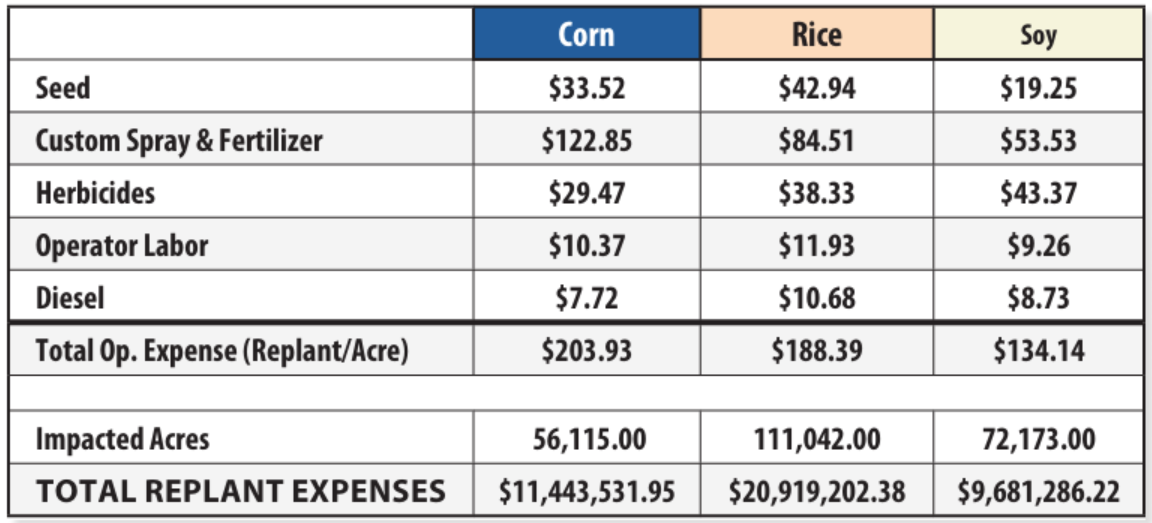
Planting expenses are accounted for using operating costs from the 2025 University of Arkansas System, Division of Agriculture (UADA) crop enterprise budgets. Only cost items such as seed, fertilizer, herbicides, labor, and diesel are incurred when replanting a crop, while the remaining operating expenses (e.g., crop insurance, interest, and cash rent) are only incurred in the initial planting. Corn, rice, and soybean acres are assumed to be replanted, while wheat is not and is considered to have a total loss from flooded acres. From this perspective, the foregone wheat crop value over flooded acres amounts to $7,628,348 (Table 1), while the sunk cost of planting that wheat crop is $10,570,390 (Table 2). Total flood damage estimates for the wheat crop alone amount to roughly $18 million. On the other hand, replanting expenses over the flooded acres for corn, rice, and soybeans total $11,443,532, $20,919,202, and $9,681,286, respectively (Table 3). Total replanting expenses from flooded acres for all three crops amount to $42,044,021.
| Table 1. Foregone Wheat Crop Value Estimate | Table 2. Total Operating Expenses (Sunk Cost) of the Wheat Crop | Table 3. Post-Flood Replant Expenses | |
Leveraging Historical Crop Insurance Losses
We leverage loss data from the USDA, Risk Management Agency (RMA) to determine the potential Prevented Planting and Replant indemnities for corn, soybeans, and rice, as well as potential Production losses for wheat. Using data on purchased liability from the RMA Summary of Business and indemnities by month and cause of loss Cause of Loss data files, we construct two key measures: estimated liability for 2025 and the expected indemnity per dollar of liability (USDA-RMA, 2025a and USDA-RMA, 2025b). Since RMA does not release complete data on purchased liabilities until the year following the harvest of an insured crop, we estimate the liability following a method outlined in Biram et al. (2024). We estimate the expected loss by taking an average of the ratio between indemnities reported in April for Excess Rainfall and purchased liability for each crop over the span 1989-2023. We multiply the estimated liability and this ratio for each crop and add them together to arrive at $18,689,699 in estimated indemnities because of the flood event.
Conclusion
We have estimated the economic impact of the “generational” flood in April to agricultural crops produced in 32 counties across Arkansas. Using field-level reports of planted and flooded acres, planting expenses from the UADA crop enterprise budgets, and historical crop insurance loss data, we estimate that the economic losses total $78,932,457. We breakdown the major loss categories into sunk costs and foregone value of production for wheat, replant expense, and expected indemnities which are $10,570,390, $7,628,348, $42,044,021, and $18,689,699, respectively. We recognize that this is a conservative estimate as we have not accounted for yield loss resulting from late planting, damage to farm structures (e.g., grain bins), and unreported acreage that is flooded. We note that this is a preliminary damage estimate and plan to incorporate flooded acreage measured by satellite imagery as more county-level reports are provided. We further note that these losses are one-third of the projected economic assistance to be received by Arkansas crop producers highlighting the significance of this flood event in the face of multi-year declines in net farm income and heightened market volatility.
| | |
References:
Biram, H.D., Loy, R., Hardke, J., Kelley, J., Ross, J., & Davis, J. (2025). Preliminary Analysis Suggests Historic Flooding Results in $79 Million in Crop-Related Damages. University of Arkansas System Division of Agriculture, Cooperative Extension Service Fact Sheet No. FSA93. (Link)
Biram, H., Tack, J., Nehring, R., & Yu, J. (2024). Empirical Challenges for Estimating Moral Hazard Effects of Crop Insurance on Pesticide Use. Journal of Agricultural and Resource Economics, 49(2), 265-282. (Link)
Brooks, B. (2025, April 3). US South, Midwest face 'generational' flood threat after severe storms, two dead.
Reuters. https://www.reuters.com/sustainability/climate-energy/warning-generational-floods-storms-hit-us-midwest-south-2025-04-03/
National Weather Service. (2025, April 7). NOWData – NOAA Online Weather Data. https://www.weather.gov/wrh/Climate?wfo=lzk
United States Department of Agriculture, National Agricultural Statistics Service. (2024). Arkansas Cash Rents County Estimates. Retrieved April 10, 2025, from https://www.nass.usda.gov/Statistics_by_State/Arkansas/Publications/County_Estimates/2023-2024/24_AR_cash.pdf
University of Arkansas System Division of Agriculture. (2025). Crop Enterprise Budget for Arkansas. Retrieved April 10, 2025, from https://www.uaex.uada.edu/farm-ranch/economics-marketing/farm-planning/budgets/crop-budgets.aspx
USDA-RMA (2025a). USDA Risk Management Agency. Summary of Business.
Retrieved from: https://www.rma.usda.gov/tools-reports/summary-of-business
USDA-RMA (2025b). USDA Risk Management Agency. Cause of Loss Data Files.
Retrieved from: https://www.rma.usda.gov/tools-reports/summary-business/cause-loss
| |
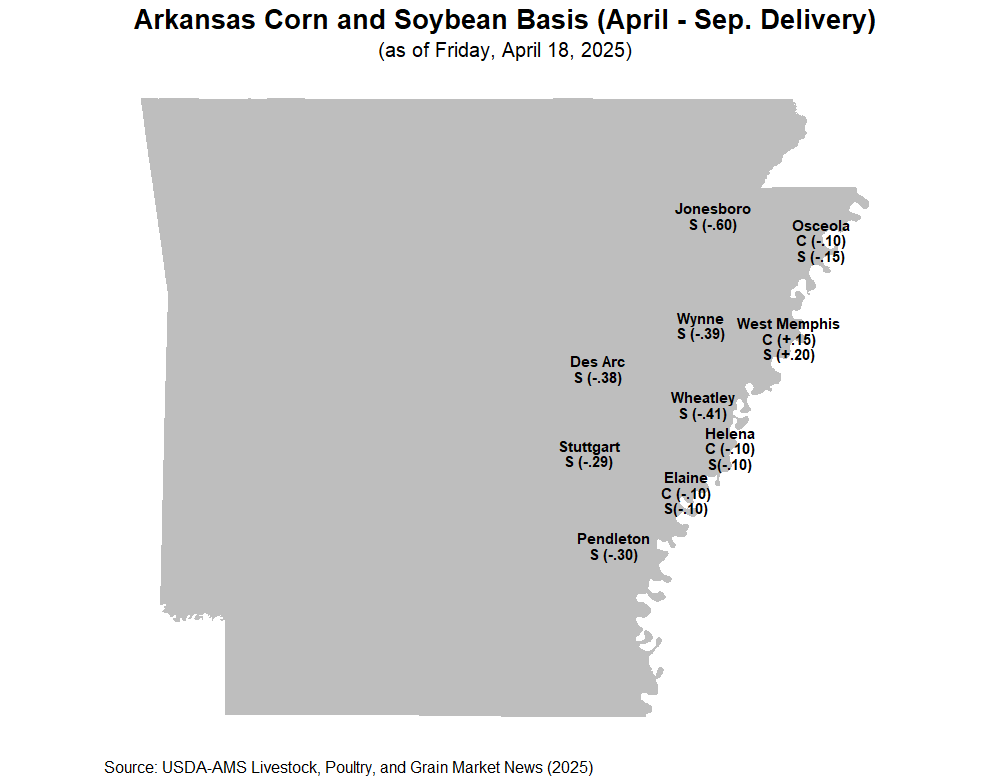
Arkansas Market Update
(as of April 18, 2025)
| | *SOURCE: Peanut Prices, Runner-type, USDA, National Agricultural Statistics Service, April 18,2025. | | NOTE: Each state average price is taken across multiple input suppliers across Arkansas. For a price more local to you, please contact Mr. Riley Smith at rsmith@uada.edu. | | |
Mississippi River Level at Memphis, TN
(as of April 18, 2025)
| | | Current Level (ft) | 37.40 | | Year Ago (ft) | 21.90 | | Critical Low Water Level (ft) | -5.00 | | Action Flood Stage Level (ft) | 28.00 | | | |
NOAA 7-Day Weather Forecast
(as of 4/18/2025)
| | | | |