Market Update - February 2024 | |
- Stocks rose in January as investors anticipated significant Fed rate cuts in 2024. However, the Fed dampened those expectations January 31st, hinting at no rate cuts till summer time.
- Reliable leading indicators show a recession is imminent, yet GDP growth and corporate profits continue to muddle along.
- Labor market data is mixed and inconclusive at this time.
| |
Table 1: Market performance estimate as of 1/31/2024 (LIMW) | |
Labor market weakness will confirm recession onset | |
|
Many analysts classify recession indicators into categories that tell us if they are leading, coincident or lagging compared to the cycle they are trying to analyze. After discussing the important leading economic indicators in prior reports, it is now time to discuss some of the most followed late-cycle indicators.
Labor market data is considered a classic lagging indicator. By the time layoffs show up in the government employment data, usually a recession is well underway. Additionally, companies are reluctant to layoff employees until they are certain about weak economic conditions because it costs money to recruit and screen new employees.
There is also a behavioral aspect to large layoffs. When a large employer lays off many people, they are required to report it to the government. This may draw unwelcome political attention. However, if other companies are laying off people due to a bad economy, management is less likely to get a call from the governor's office.
With most of the leading indicators signalling recession, let's look at some of the widely followed labor market indicators to see if they can provide confirmation of economic weakness.
| |
Service employment indicators are falling
The Institute for Supply Management (ISM) distributes surveys to service sector firms as well as manufacturing companies. The data they collect on employment activity is particularly interesting because the United States is a service-based economy. Significant portions of our manufacturing base have moved overseas in recent decades, leaving health care, government and education as major employers in the economy.
The ISM services sector employment indicator has fallen dramatically over the last few months, indicating higher layoffs are imminent.
Figure 1: ISM Service Employment indicator (Institute for Supply Management, Bloomberg)
| |
Some, but not all labor data is negative
Here are the key labor market data points indicating stability:
- Nonfarm Payrolls - recent data revised down, however
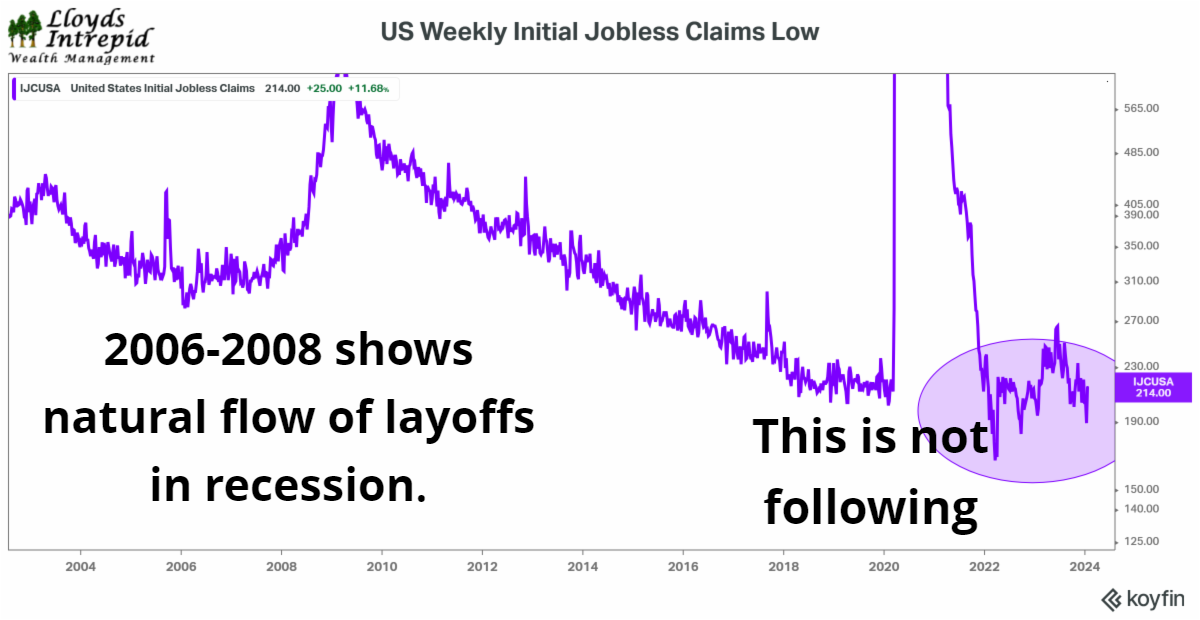
- New claims for unemployment
Here are the key labor market data points indicating weakness:
- Household payrolls used in the unemployment rate calculation
- ISM Services employment
- JOLTS Hiring Rate
Figure 2: Labor Market dashboard (US Bureau of Labor Statistics, ISM, Goldman Sachs)
| |
Figure 3: Weekly Initial Jobless Claims (Bureau of Labor Statistics, LIWM) | |
Figure 4: Revisions to non-farm payrolls are in recession territory (Jeff Weniger, Wisdom Tree Investments) | |
Will the trickle turn into a flood? | |
|
Large companies are starting to announce major layoffs. Perhaps some of them are starting to affect the data we just reviewed:
1. Twitch: 35% of workforce
2. Hasbro: 20% of workforce
3. Spotify: 17% of workforce
4. Levi's: 15% of workforce
5. Zerox: 15% of workforce
6. Qualtrics: 14% of workforce
7. Wayfair: 13% of workforce
8. Duolingo: 10% of workforce
9. Washington Post: 10% of workforce
10. eBay: 9% of workforce
11. Business Insider: 8% of workforce
12. Charles Schwab: 6% of workforce
13. Blackrock: 3% of workforce
14. Citigroup: 20,000 employees
15. Pixar: 1,300 employees
16. UPS: 12,000 employees
In general, the labor data is mixed and indicates mild weakness in the labor market. On Friday this week, we will get fresh payroll and unemployment numbers to guide our views.
| |
All time stock market highs during Fed tightening usually don't end well | |
|
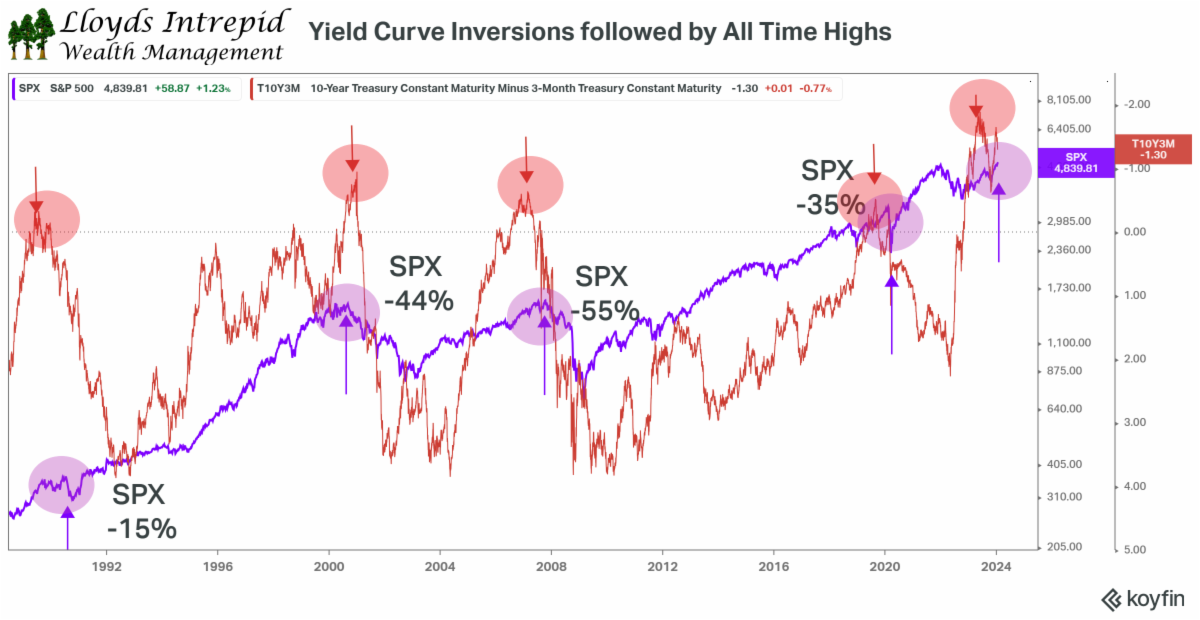
It is quite common to have record stock market highs during Fed tightening cycles. The only problem is that at market highs, the Fed is worried about too much growth and rising inflation. Their response is to slow down the economy and reduce inflation. Unfortunately, this frequently results in a recession and bear market for stocks.
(When the Federal Reserve raises interest rates, we call that a "tightening" cycle. When they raise short-term interest rates above long-term interest rates, we call that a "yield curve inversion.")
Over the last 35 years, we've experienced four Fed tightening cycles where the yield curve inverted. In the graph below, the red line shows the shape of the yield curve. A rising red line reflects the Fed raising interest rates; when it crosses zero the curve is inverted. In purple, you can see the S&P 500 with an arrow at each all-time-high. In 2000, 2007 and 2020, there was a significant stock market sell-off following the yield curve inversion and market peak.
Figure 5: Yield Curve Inversions versus the S&P 500 (LIWM)
| |
S&P 500 earnings unchanged for 3 years | |
|
With all the price appreciation this year, one should expect to see corporate earnings rising to support the new market highs. You would be wrong.
S&P 500 aggregate earnings can be calculated by adding up all the earnings of the component stocks in the benchmark. By tracking this metric, we can get a sense for how good or bad the underlying fundamentals are for the benchmark.
The S&P 500 earnings have been essentially unchanged for three years. This is in contrast to the narrative we see in the paper or on TV that everything is awesome. The forecasts for future earnings are just that: forecasts. In past years, optimistic growth forecasts have been revised down to the levels you see for 2021, 2022 and 2023.
Figure 6: S&P 500 earnings by year (Factset)
| |
Technology versus the blob | |
|
Most stock market gains in the last 5 years have been in the technology sector. It didn't matter which sector you owned, as long as it contained Nvidia, Microsoft and Apple.
Historically, these long periods of outperformance mean revert; just as they outperformed, eventually they underperform for a period of time. We have low expectations that technology stocks will keep beating the S&P 500 for the next 5 years.
In the chart below, you can see the technology index fund (XLK) in light blue beating all the other sectors over the last 5 years.
Figure 7: 5-year S&P 500 sector performance (LIWM)
| |
Equity markets rise, but caution is warranted | |
|
After rising in 2023, stocks continued to climb in January. As noted above, there has been no improvement in earnings for quite a while with most of the earnings growth and performance generated by a handful of names.
Normally, breaking out to new all-time-highs is considered a bullish development. However, in this case we have an inverted yield curve in the bond market. Historically, this combination of all-time-highs and inverted-yield-curves in 2000, 2007 and 2020 ended in tears for stock investors.
Another way of saying this is that the Fed is deliberately restrictive when the stock market is highly optimistic. The Federal Reserve focuses on restraining inflation and supporting employment. Today, inflation is a problem even though it is falling, while the employment situation is still excellent.
We are expecting 2024 to be a very choppy year for stock investors.
Figure 8: S&P 500 2020-2023 (LIWM)
| |
LIWM Bear Market Indicator still pointing to problems | |
The LIWM Bear Market Indicator combines the five best S&P 500 leading macroeconomic indicators into one to help visualize market stress. The indicator says there is currently a 76% probability of a bear market ahead of us. Historically, this is a high reading, but not as high as the end of 2022. A key reason for its decline from the recent peak is the recessionary reading coming from the ISM manufacturing variable.
Table 2: LIWM Bear Market Indicator Components (LIWM)
| |
Figure 9: LIWM Bear Market Indicator versus S&P 500 (LIWM) | |
Yields may have hit this cycle's high in 2023 | |
|
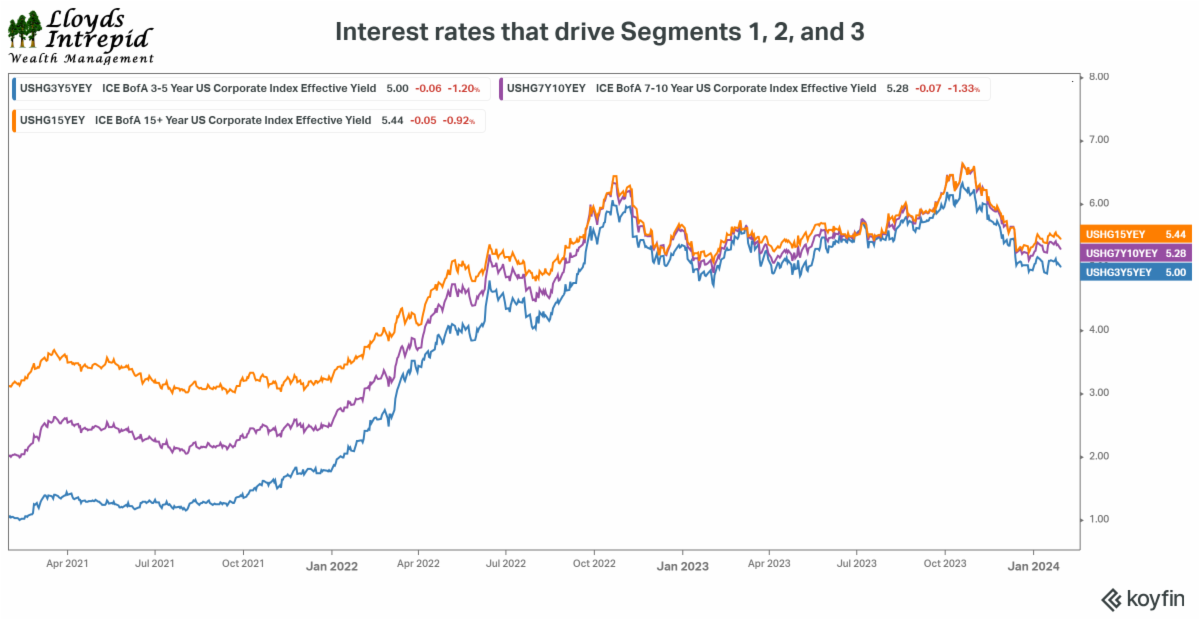
For those following yields used to calculate pension lump-sum payments, there is good news. The three key markets used to estimate the IRS segment rates are all moving in a direction that drives down interest rates.
In the next graph, you can see the historical yields for short-term, intermediate-term, and long-term investment grade corporate bonds. Rates appear to have peaked and are moving lower.
Figure 10: Corporate bond yields analogous to IRS Segment rates 1, 2, and 3 2021-2023 (LIWM)
| |
|
The leading indicators still say trouble is ahead. The labor market, a lagging indicator, is showing some signs of weakness. The recent Federal Reserve meeting on January 31st announced that no rate cuts are expected in March 2024. The Fed's policy to carry interest rates higher for longer is a big disappointment to many investors. Expect this news to be good for bonds and bad for stocks.
If you'd like to discuss any of our research, please feel free to reach out to us.
| |
|
Rob 281-402-8284
Chris 281-547-7542
| |
|
Christopher Lloyd, CFP ®
Vice President and Senior Wealth Planner
Lloyds Intrepid Wealth Management
1330 Lake Robbins Dr., Suite 560
The Woodlands, TX 77380
281-547-7542
Chris.Lloyd@lloydsintrepid.com
www.lloydsintrepid.com
| Lloyds Intrepid LLC is an Investment Advisor registered with the State of Texas, where it is doing business as Lloyds Intrepid Wealth Management. All views, expressions, and opinions included in this communication are subject to change. This communication is not intended as an offer or solicitation to buy, hold or sell any financial instrument or investment advisory services. Any information provided has been obtained from sources considered reliable, but we do not guarantee the accuracy, or the completeness of, any description of securities, markets or developments mentioned. We may, from time to time, have a position in the securities mentioned and may execute transactions that may not be consistent with this communication's conclusions. Please contact us at 281.886.3039 if there is any change in your financial situation, needs, goals or objectives, or if you wish to initiate any restrictions on the management of the account or modify existing restrictions. Additionally, we recommend you compare any account reports from Lloyds Intrepid LLC with the account statements from your Custodian. Please notify us if you do not receive statements from your Custodian on at least a quarterly basis. Our current disclosure brochure, Form ADV Part 2, is available for your review upon request, and on our website, www.LloydsIntrepid.com. This disclosure brochure, or a summary of material changes made, is also provided to our clients on an annual basis. | | | | |