|
MARKET PERSPECTIVE
TECHNICAL ANALYSIS
| | |
EUROPE OVERBOUGHT - US OVERSOLD!
DEFENSIVE ROTATION COMPLETE - TIME FOR A BOUNCE??
| | |
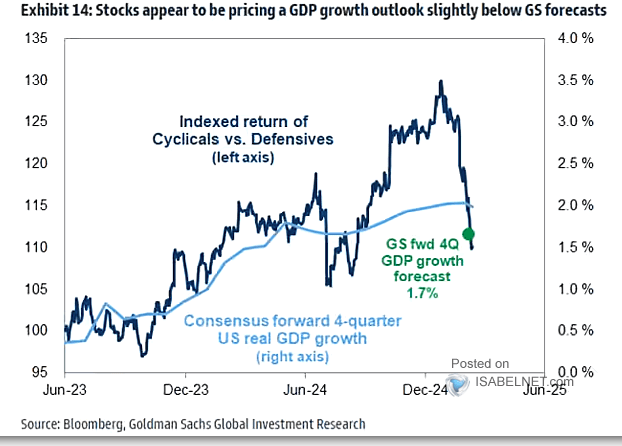
THE CYCLICAL v DEFENSIVE ROTATION
03-06-25
We updated the chart above which we highlighted previously (Last Weeks Chart Link) to shown how quickly the markets have rotated to Defensives versus Cyclicals.
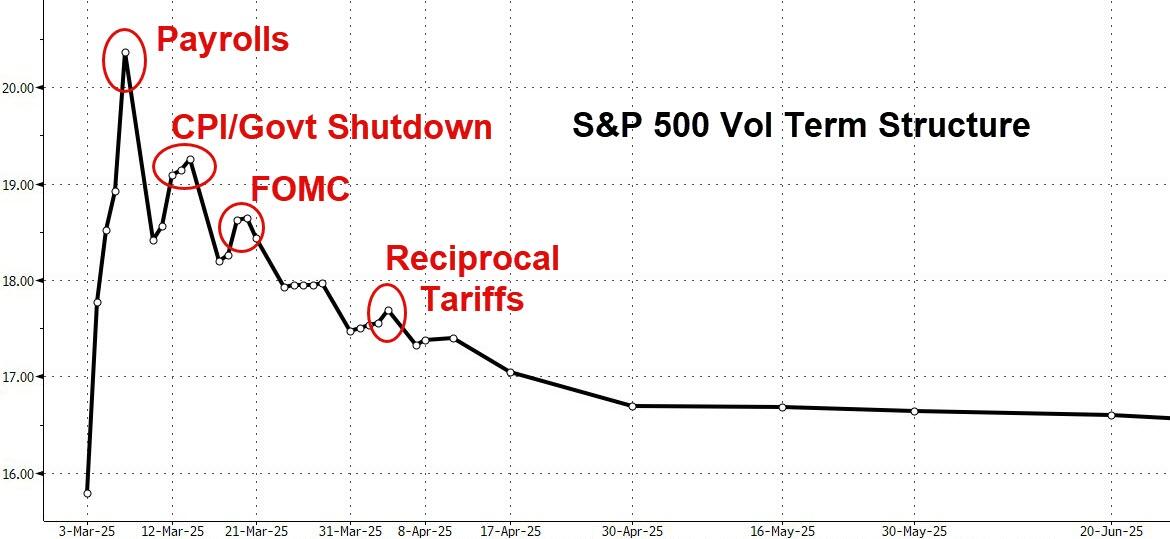
RSI suggests the bottom is in, Sentiment says maybe not yet though the average stock is off 30% from highs. The vol Term structures (chart right) suggest we may initially get a bounce but the lows are likely to be retested before heading higher. The markets are generally oversold and the all-important CTA community has de-risked, but certain aspects of sentiment in general, and gross leverage among hedge funds in particular, make the overall tactical backdrop messy and absolutely not a clear-cut signal.
| | |
JPM's head trader Elan Luger:
"the bottom line for me: yes we are technically oversold. Yes we are very close to a bounce (I like Financials specifically alts best for a long trade + Mag 7 + Utilities)…but we are in a new regime that warrants a sell rally mentality more than a buy dip mentality"
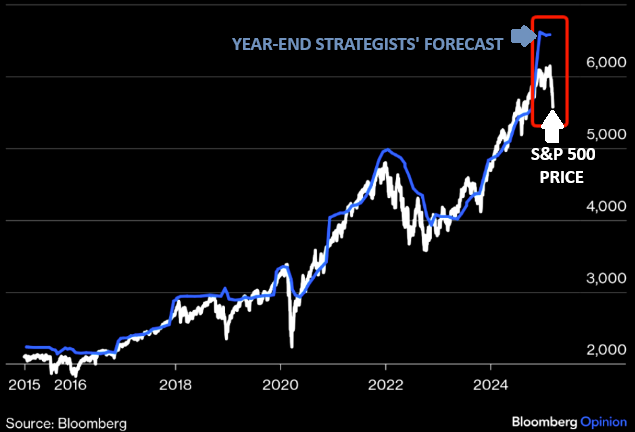
CHART RIGHT:
The gap between strategists' SPX target and SPX is very wide. Market too bearish, or strategists too bullish?
Maybe the gap shrinks, from both "sides"...
| | |
TECHNICAL ANALYSIS
THESE WEEKS INDEX (See Prior Weeks for Links to Real Time Live "Grey" area charts below)
| | |
1 - EQUITY MARKETS
CONTROL PACKAGE
S&P 500 (MULTIPLE DEGREES)
RUSSELL 2000 (IWM)
DJIA
MATASII BANKING INDEX
MATASII FINANCIALS INDEX
MAGNIFICENT 7
CONTROL PACKAGE
NVDA
GOOG
META
AAPL
TSLA
MSFT
AMZN
FOREIGN EXCHANGES (SITUATIONAL SELECTIONS)
| |  | |
GLOBAL
2 - COMMODITIES
CRB COMMODITY INDEX
GOLD
SILVER
3 - CURRENCY MARKET
DXY
4 - BOND MARKET
CONTROL PACKAGE
TNX
5 - CREDIT MARKET
YIELD CURVE
JNK (HY)
MARKET MONITOR (SUBSCRIBERS ONLY)
| | | |
NEW IMAGE CHANGES ARE LABELED WITH A BLUE TRIPLE ***STAR***
OLD IMAGE CHANGES ARE LABELED WITH A RED TRIPLE ***STAR***
OLD IMAGES REFLECT MINIMAL CHANGE, but Narrative is ALWAYS updated.
REMEMBER: SIMPLY CLICK YOUR LIVE SUBSCRIBER LINK TO SEE THE LATEST UPDATED LIVE CHART.
| | |
CONTROL PACKAGE
There are FOUR charts we have outlined in prior chart packages that we will continue to watch closely as a CURRENT "control set":
- THE S&P 500 (CHART LINK)
- THE DJIA (CHART LINK)
- THE RUSSELL 2000 Russell 2000 IWM ETF (CHART LINK),
- THE MAGNIFICENT SEVEN WITHOUT THE MATASII CROSS - (LINK)
| | | | | |
IT WAS ANOTHER TUMULTUOUS WEEK!!
A 10% correction in 20 days, the 5th fastest correction in the last 75 years (fastest ever was 8 days during the onset of Covid – 2/27/20)
THE TRIGGERING SEQUENCE
-
VALUATIONS: Concern with Mag-7 sustaining rate of sales growth and historic level of margins
-
ROTATION: Rotation begins to S&P 500 493 and cheaper Euro and European bank stocks.
-
DOLLAR WEAKNESS: Weakening USD with falling US stocks forces European to chase DAX & Military Build up stocks
-
GROWTH: US Economic growth becomes an increasing concern primarily on the worry of Tariffs and Trade Wars.
-
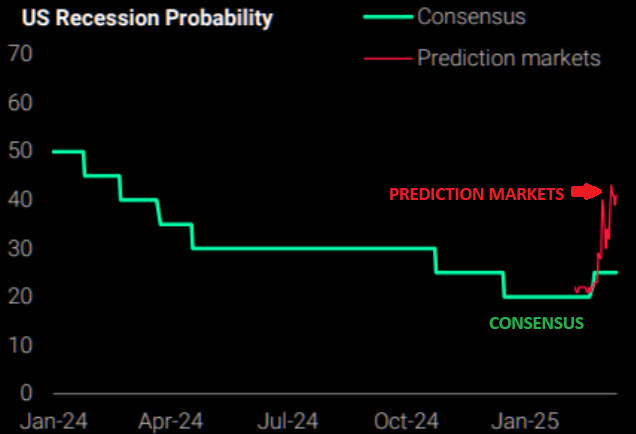
RECESSION: A late 2025 US Recession increasing;y on investors radar
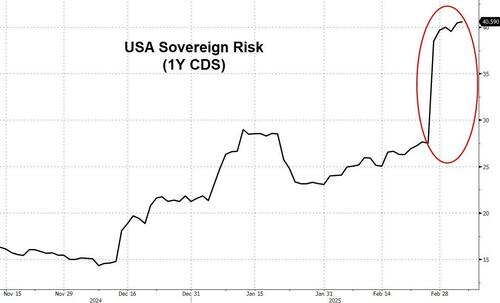
The Prediction Markets (chart above right) were early and highly accurate in predicting a Trump victory. They are rapidly seeing the betting increase for a Recession ahead!
GROWTH => STAGFLATION => RECESSION
THIS IS NOT THE START OF A BEAR MARKET FOR US STOCKS
STILL MOST LIKELY ONLY A INTERMEDIATE DEGREE "WXYXZ" CORRECTION
More pain may be in stocks (after a bounce) as the current “down-in-yields/down-in-stocks” move is ominous, and very 2000, 2002, 2008. Buy SPX @ ~5300 in late Spring
| |
REASONS TO CONTINUE TO BE FEARFUL:
- Growth Concerns (payrolls + ISM manuf.. follows weak confidence readings)
- Tariff Fatigue magnified by thematic re-pricing in AI
- Global Complexity (Ger & Fra Yields breaking out + China higher again on JD, BABA QwQ-32B AI Model)
- Technicals Weak (SPX flirting with 200dma 5732, counterbalanced by most major indices & single stock bellwethers approaching technically "oversold" levels)
- Systematic Supply (CTAs have sold almost $60bn of US equity delta in the last week, ~30bn SPX)
- Positioning Elevated (HF Gross Leverage rose +1.1 pts this week and sitting in 100th percentile vs past 1-year // Nets remained ~flat and in 47th percentile vs past 1-year)
- Liquidity very challenged making new lows
- LO Risk Reduction (seen in relative out-performers such as HCare, Utilities, & Semis)
- Consumer Woes (think: ANF, FL, ROST, VSCO, Cruise lines, etc.)
- Poor Seasonality (bounce set up for 3/14)
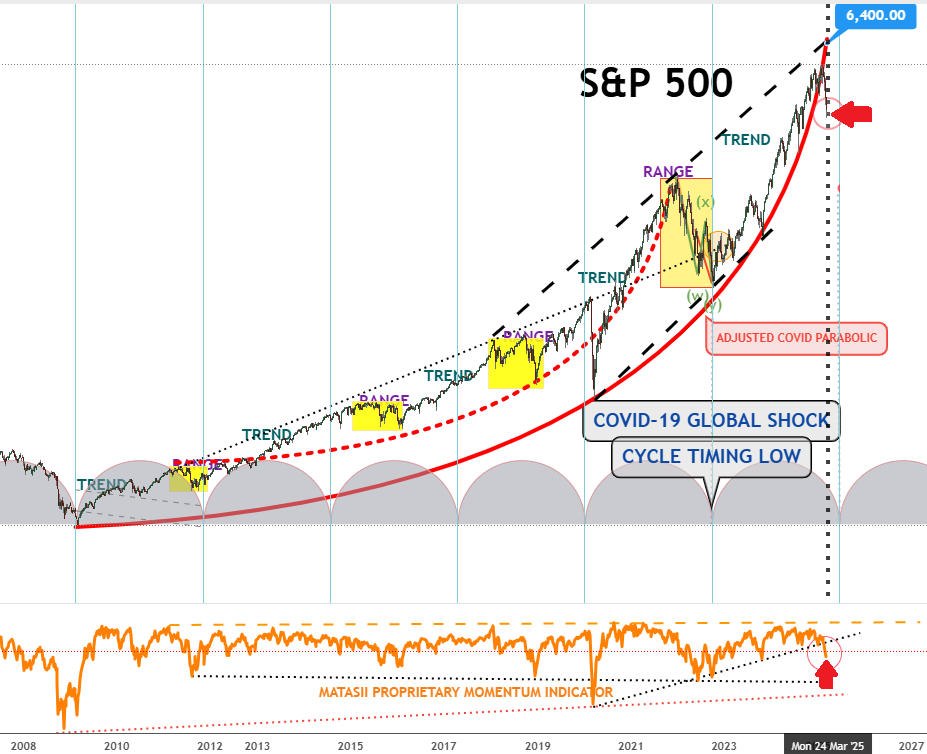
| | ***S&P 500 MONTHLY - POST GFC*** | |
CHART NOTES:
-
PRICE - Price has decidedly broken away and below the red parabolic trend that has been in place since the 2008 GFC with one modification (a big one) for Covid.
-
MATASII PROPRIETARY MOMENTUM INDICATOR - Momentum in the bottom panel has broken the major support shown by the black dotted trendline & marked by the red arrow. The next level of support is much further below.
| | | |
MARKET LAB
Being bearish on US mega-cap tech carries higher risk than being bullish. Timing is crucial — history shows that even correctly calling the 2000 tech bubble peak, but being early led to massive rallies against short positions (13% in one month, 31% in three, and 94% in six). ,While today’s market may not have the same upside, Shorting US tech still requires near-perfect timing.
OBSERVATION -
During the 2000 Dotcom Bubble the market also weakened near the March Quadruple Witch, but didn't fully start breaking down until September.
| | | |
YOUR DESKTOP / TABLET / PHONE ANNOTATED CHART
Macro Analytics Chart Above: SUBSCRIBER LINK
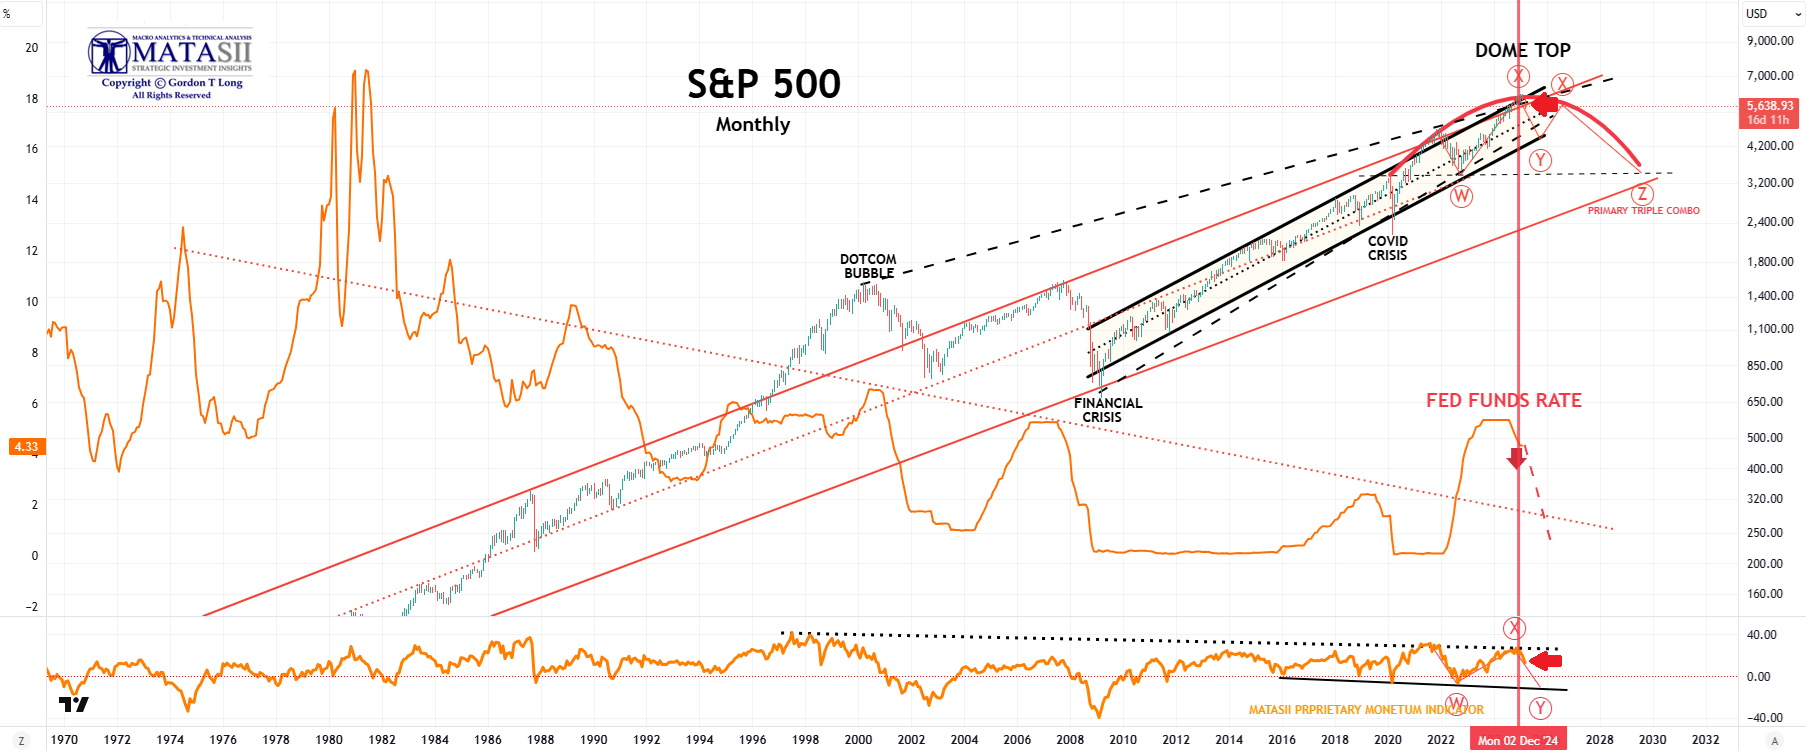
| | ***S&P 500 MONTHLY - 55 YA*** | |
CHART NOTES:
-
PRICE - The S&P 500 has stayed comfortably within the Dome Top (in red) which is to be expected at a major top since they normally take an extended period of time to develop.
-
MATASII PROPRIETARY MOMENTUM INDICATOR - Momentum in the lower panel has offered consistent overhead resistance support (marked by the the major black dotted trend line & marked above the red arrow.
| | | |
MARKET LAB
ELLIOTT WAVE COUNT
- The best overall Elliott Wave count we can arrive at is a Triple Complex Combo labeled as a Primary WXYXZ
- This count shows itself as a Fractal in lower degree counts down to the Daily level (see S&P 500 charts below, as well as in other Equity Indexes, the MATASII Banking and Financial Indexes.
| | | |
YOUR DESKTOP / TABLET / PHONE ANNOTATED CHART
Macro Analytics Chart Above: SUBSCRIBER LINK
| | |
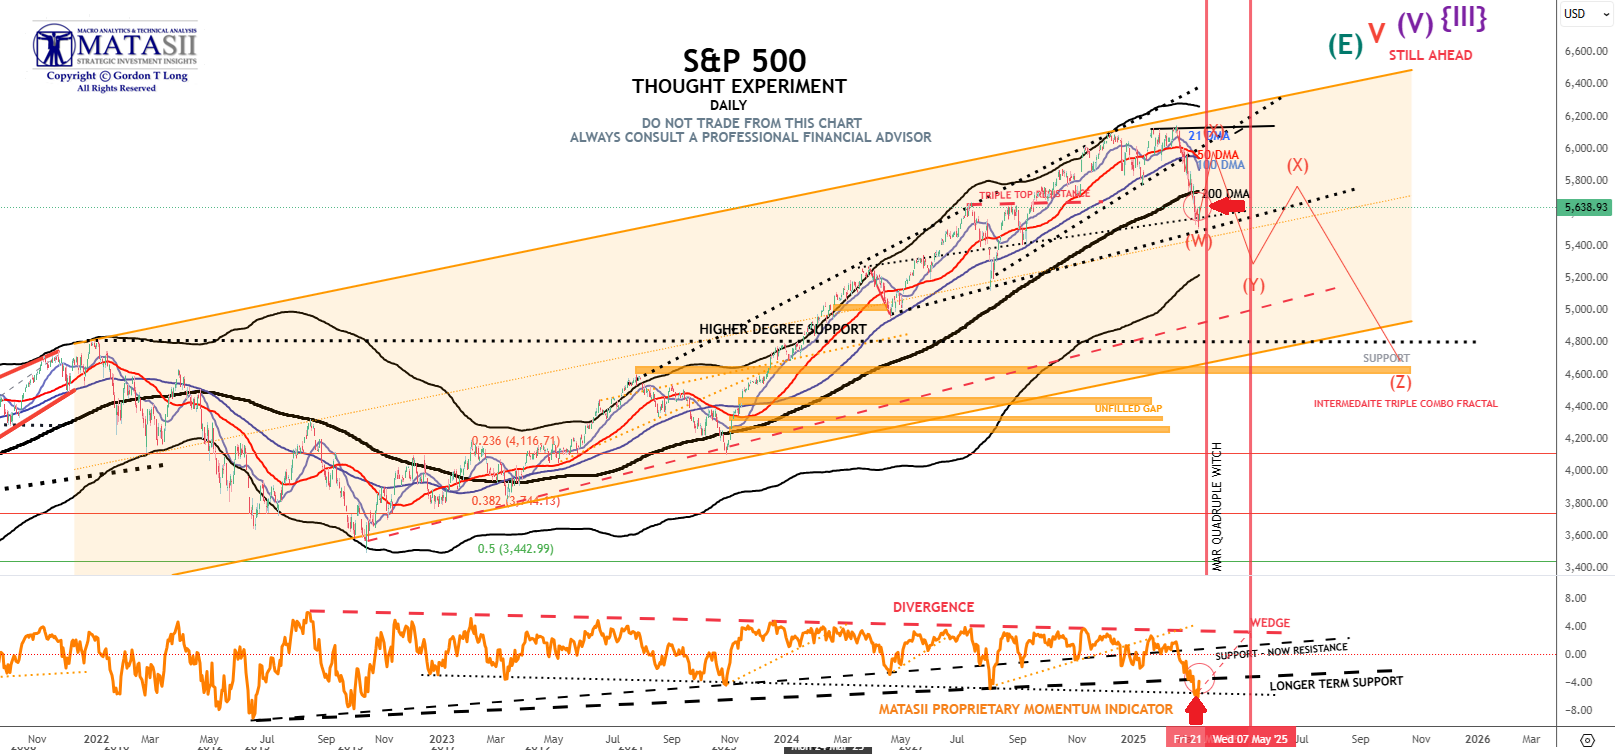
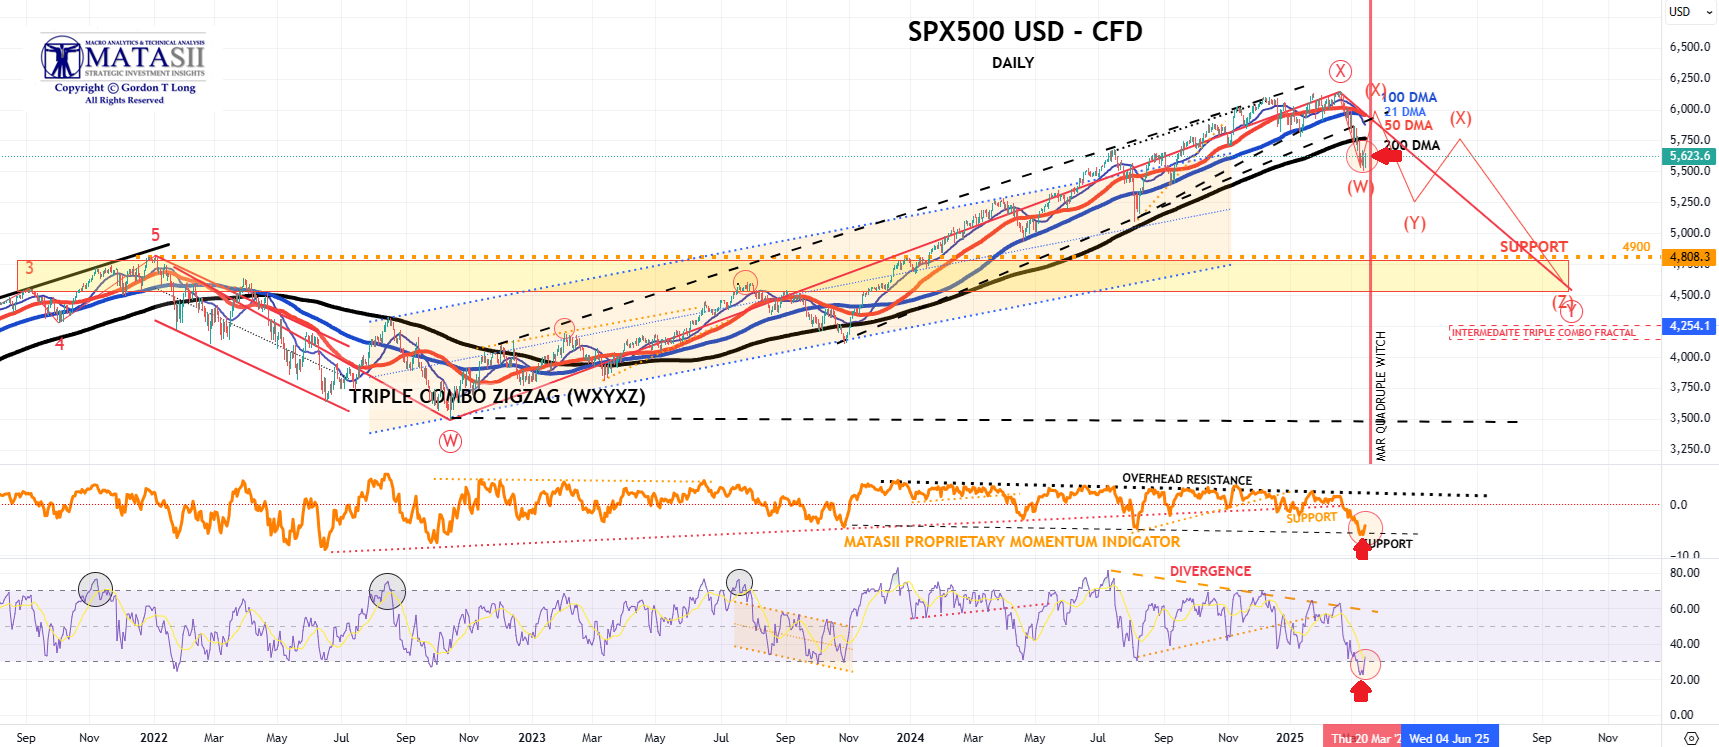
CHART NOTES:
-
PRICE - The S&P 500 was trading at the cash close Friday of 5638.93 up +117.40 (+2.13%) for the day but down significantly compared to last Friday's close at 5770.19 and Q1 highs.
-
DMA - Price decidedly broke the important 200 DMA level finding temporary support at trend support levels shown below.
-
MATASII PROPRIETARY MOMENTUM INDICATOR - Momentum in the lower panel broke major support indicted by the black dashed trend line. Momentum found support at a lower support level marked by the red arrow.
| | | |
MARKET LAB
ELLIOTT WAVE COUNT
- The best overall Elliott Wave count we can arrive at is a Triple Complex Combo labeled as a Primary WXYXZ
- This count shows itself as a Fractal in lower degree counts down to the Daily level (see S&P 500 charts below, as well as in other Equity Indexes, the MATASII Banking and Financial Indexes.
| | | |
SPX CASH
CHART BELOW NOTES:
| | |
YOUR DESKTOP / TABLET / PHONE ANNOTATED CHART
Macro Analytics Chart Above: SUBSCRIBER LINK
| | |
SPX cfd
NOTES - CHART BELOW:
| | |
YOUR DESKTOP / TABLET / PHONE ANNOTATED CHART
Macro Analytics Chart Above: SUBSCRIBER LINK
| |
|
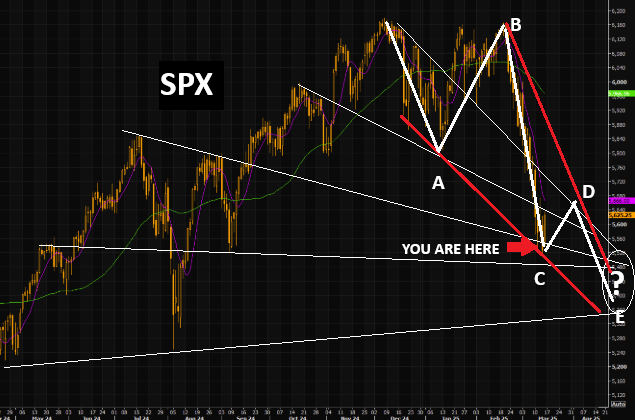
NEW-- PATTERNS
03-14-25
SPX has come down quickly.
These "Convergence" lines have historically often been quite predictive!
| | | | | |
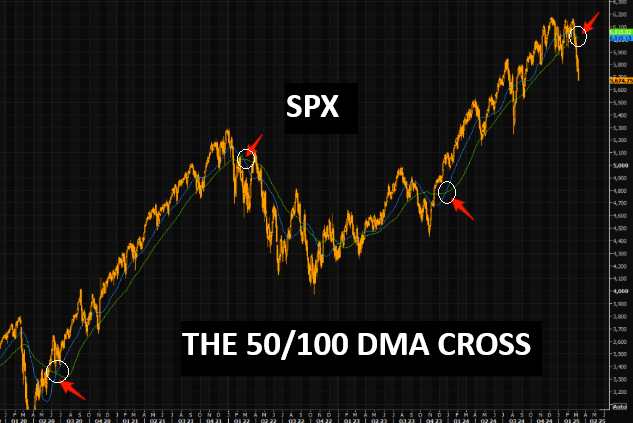
PATTERN – SPX
03-08-25
We have noticed similarities to the 2022 correction in markets. Yes, we will have bounces, but sometimes you should zoom out and look at longer term crosses. The post Covid bull started with the 50 day crossing the 100 day in Q32020. The 2022 bear went serious post the negative 50/100 day cross early in the year. The latest bull went aggressive as the positive 50/100 day cross occurred in early 2024. Note the that the negative 50/100 day crossed kicked in this week. (click to enlarge).
| | | |
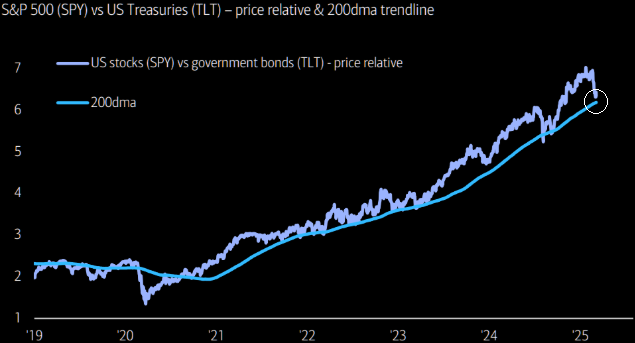
CORRELATION - SPX v 20Y TLT - 03-07-25
SHOWTIME!!
Critical - SPY/TLT - Price Ratio v 200 DMA trendline.
| |
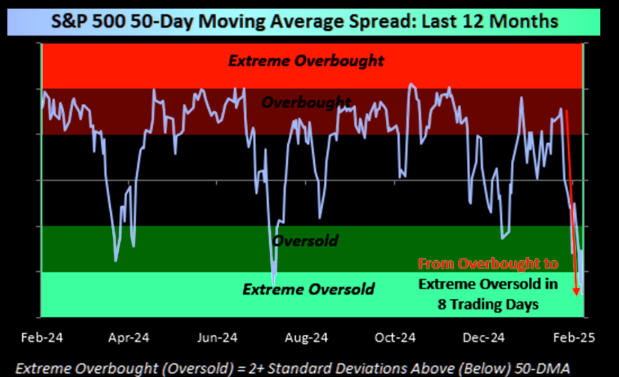
SENTIMENT - OVERSOLD - 03-08-25
The S&P went from overbought to extreme oversold in just eight trading days recently.
| | | |
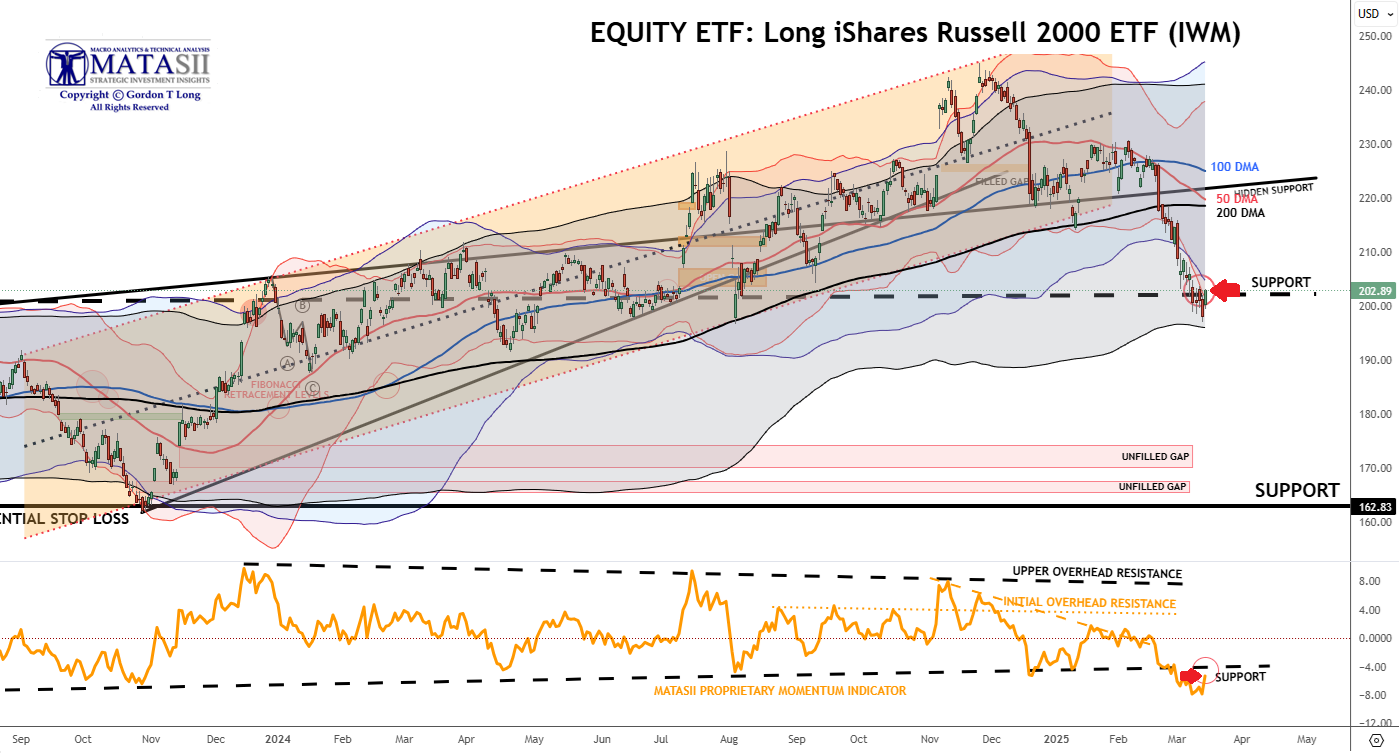
***IWM - LONG iSHARE RUSSELL 2000 ETF - Daily***
MATASII CHART NOTES:
-
PRICE - The IWM - LONG iShare Russell 2000 ETF was up Friday closing at 202.89 +4.79 (+2.42%) compared to closing last Friday at 205.95.
-
DMA - Price broke through the 200 DMA support finding support at a long term support level marked by a large horizontal dashed black line in the Price chart below.
-
MATASII PROPRIETARY MOMENTUM INDICATOR - The IWM broke a major Proprietary Momentum Indicator support level (lower panel). That level appears to now be acting as overhead resistance marked by the red arrow.
| | | |
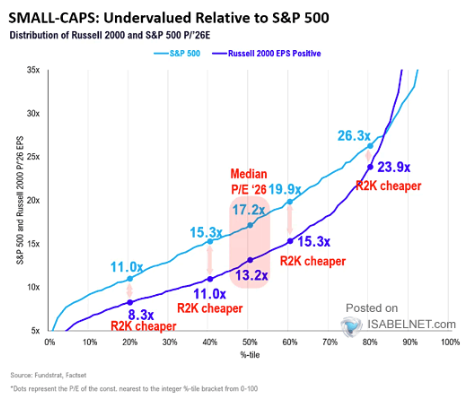
CORRELATION - 02-08-25
RUSSELL undervalued relative to S&P 500
| | | |
YOUR DESKTOP / TABLET / PHONE ANNOTATED CHART
Macro Analytics Chart Above: SUBSCRIBER LINK
| | |
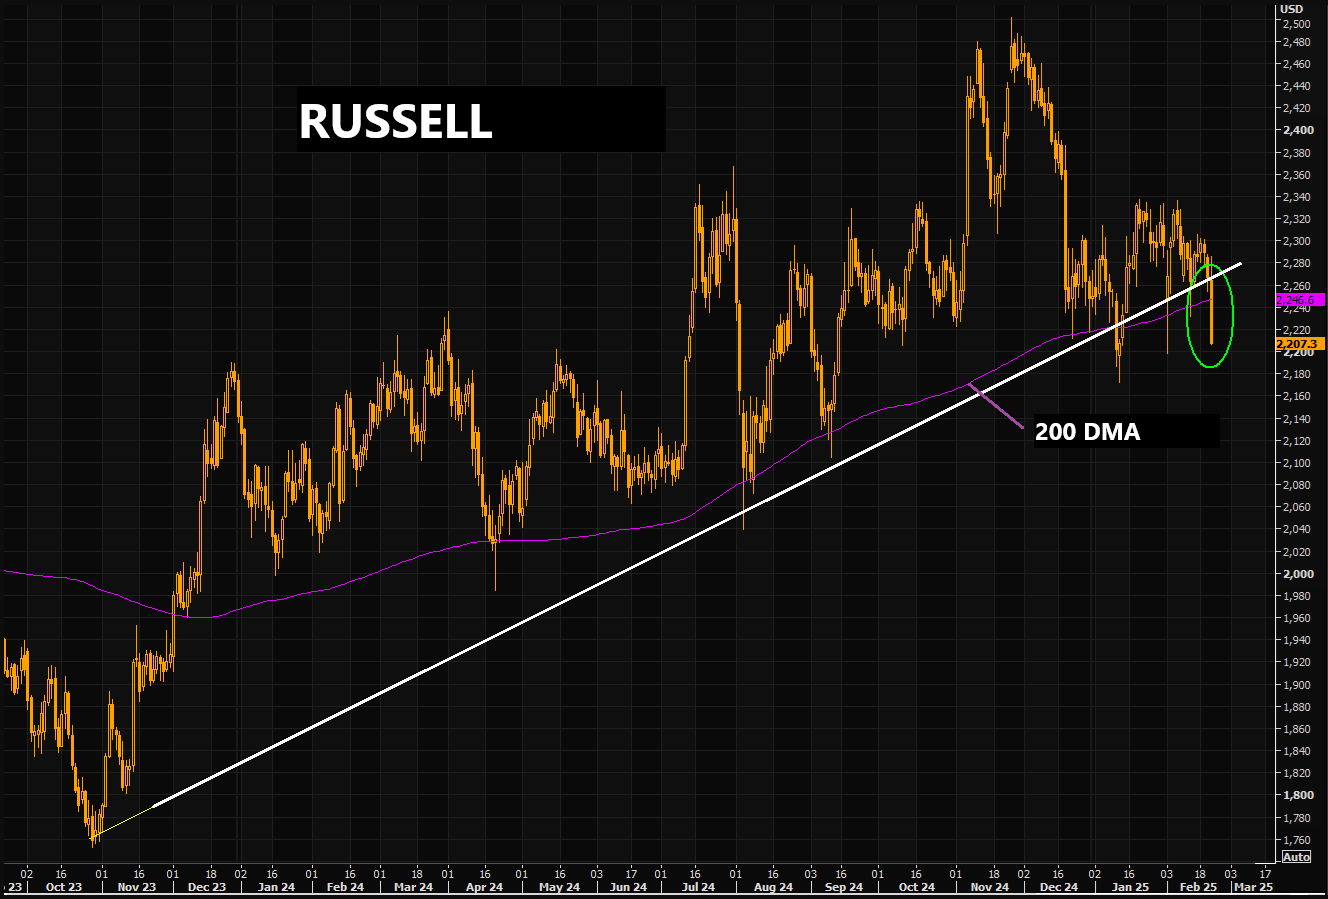
PATTERN - 02-21-25
Russell put in a massive down candle, breaking slightly below the 200 day moving average and the longer term trend line. No bueno.
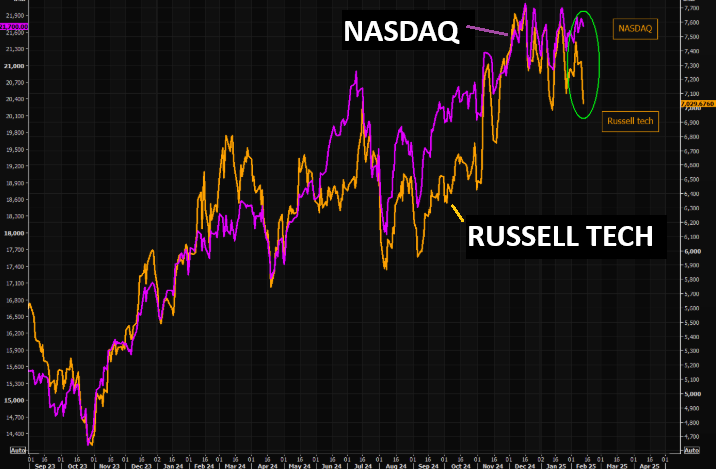
| | | RUSSELL TECH - The low quality tech stuff has been fading lately... | | | |
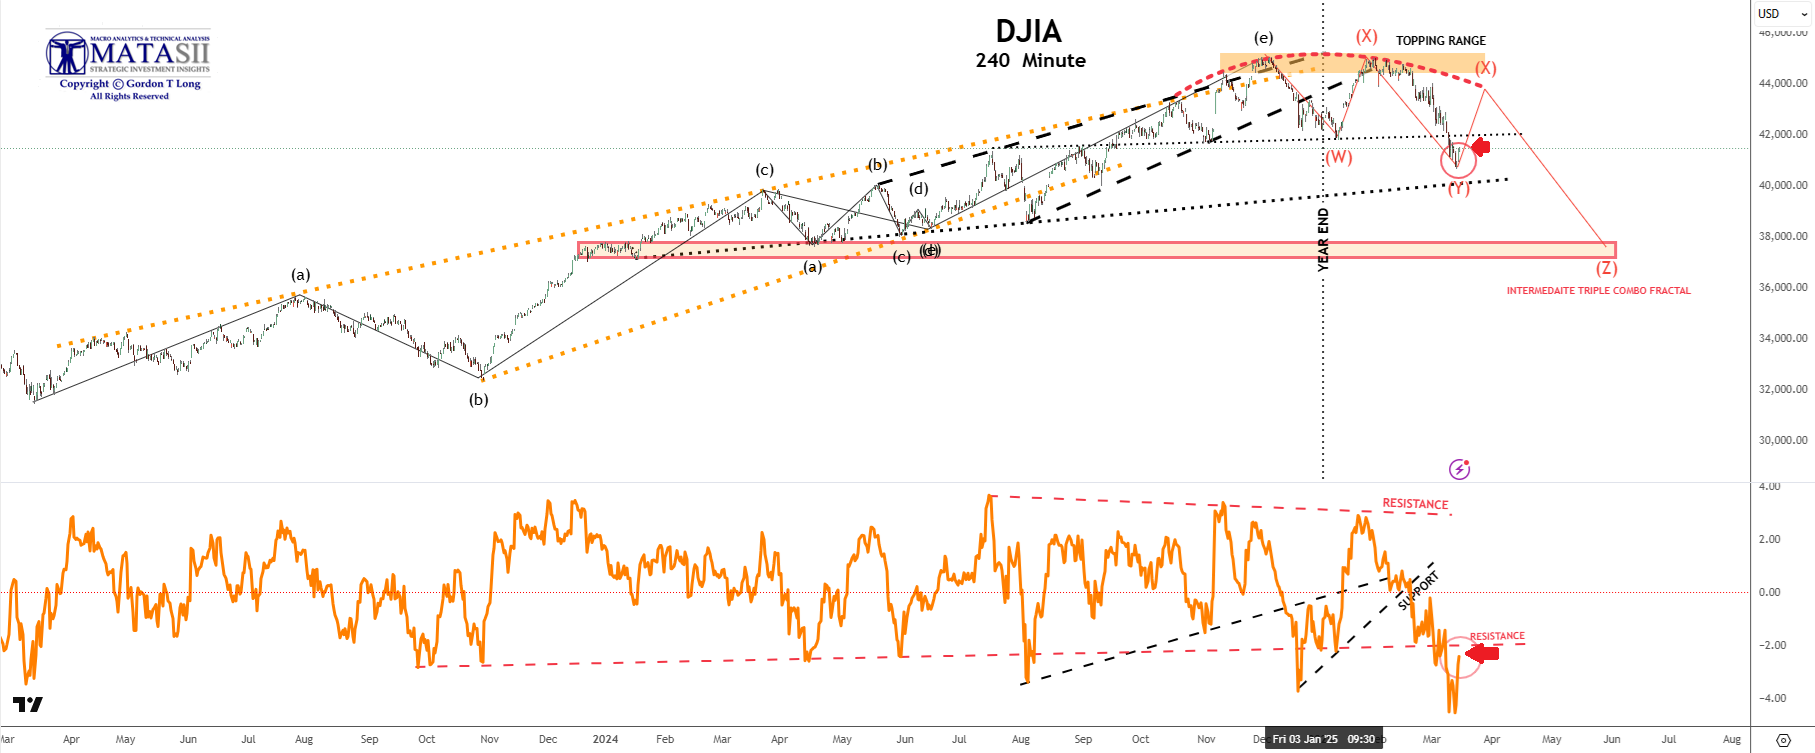
***DJIA - 240 MINUTE***
MATASII CHART NOTES:
-
PRICE - The DJIA rose Friday closing at 41488.19 +674.62 (+1.65%) for the day.
-
MATASII PROPRIETARY MOMENTUM INDICATOR - In the bottom panel, the MATASII Proprietary Momentum Indicator broke major support at the dashed orange trend line above the red arrow. This support level now appears to be offering overhead resistance.
| | | |
MARKET LAB
ELLIOTT WAVE COUNT
- The best overall Elliott Wave count we can arrive at is a Triple Complex Combo labeled as a Primary WXYXZ
- This count shows itself as a Fractal in lower degree counts down to the Daily level (see also S&P 500 charts as well as in other Equity Indexes, the MATASII Banking and Financial Indexes.
| | | |
YOUR DESKTOP / TABLET / PHONE ANNOTATED CHART
Macro Analytics Chart Above: SUBSCRIBER LINK
| | |
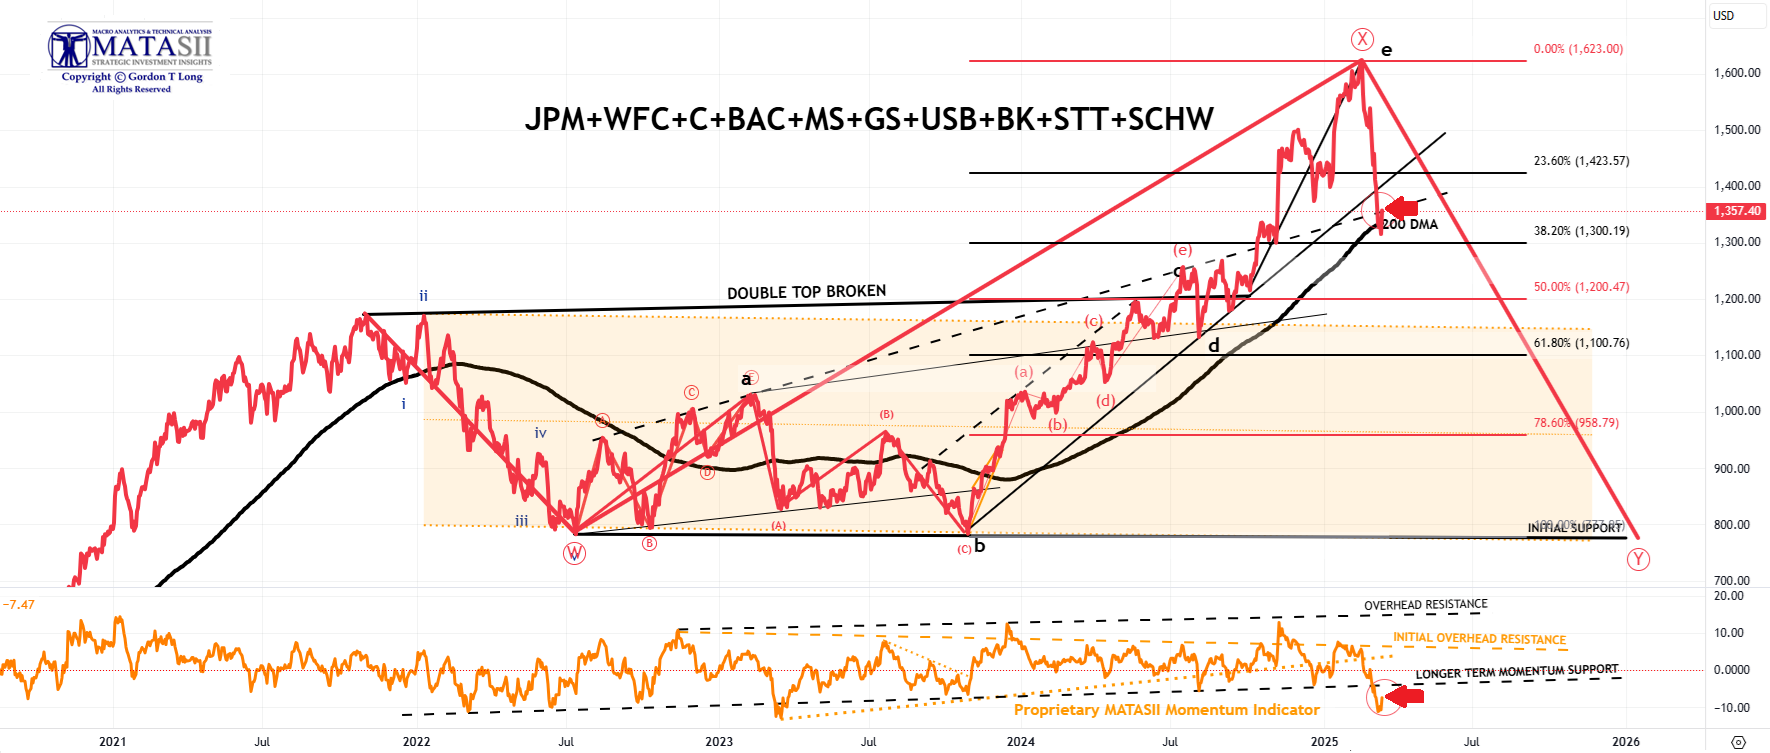
***THE MATASII BANK INDEX***
STRONG BANK EARNINGS & WEAKENING YIELDS PROPEL BANKS HIGHER
MATASII CHART NOTES:
-
PRICE - The MATASII Bank Index rose Friday closing at 1357.40 +41.8 (+3.18%) for the day and down for the week compared to last Friday's close at 1398.93.
-
DMA - tHE 200 DMA is now offering support
-
MATASII PROPRIETARY MOMENTUM INDICATOR - In the bottom panel, the MATASII Proprietary Momentum Indicator broke major support shown by the dashed black trend line above the red arrow.
| | | |
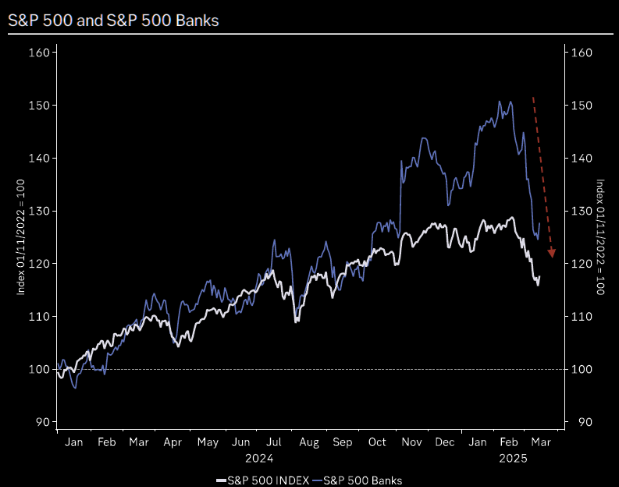
MARKET LAB
Banks falling faster than the S&P 500 is "tell" indication of increased economic and financial stress!
| | | |
YOUR DESKTOP / TABLET / PHONE ANNOTATED CHART
Macro Analytics Chart Above: SUBSCRIBER LINK
| | |
MATASII BANK INDEX - ANALYTICS
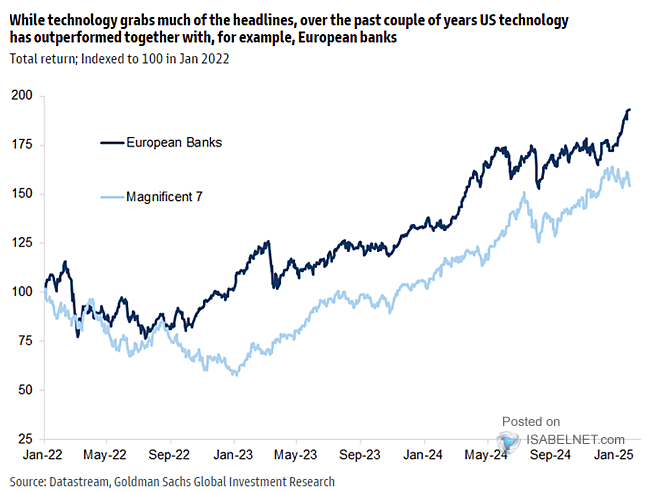
THE EURO BANK INDEX CONTINUES TO OUTPERFORM
| | |
PERFORMANCE - 02-17-25:
YTD: SX7E +20%, QQQ +5%, MAG +1%.
| | | |
PATTERN
European Banks have been matching Mag-7 performance!
| | | |
***THE MATASII FINANCIAL INDEX***
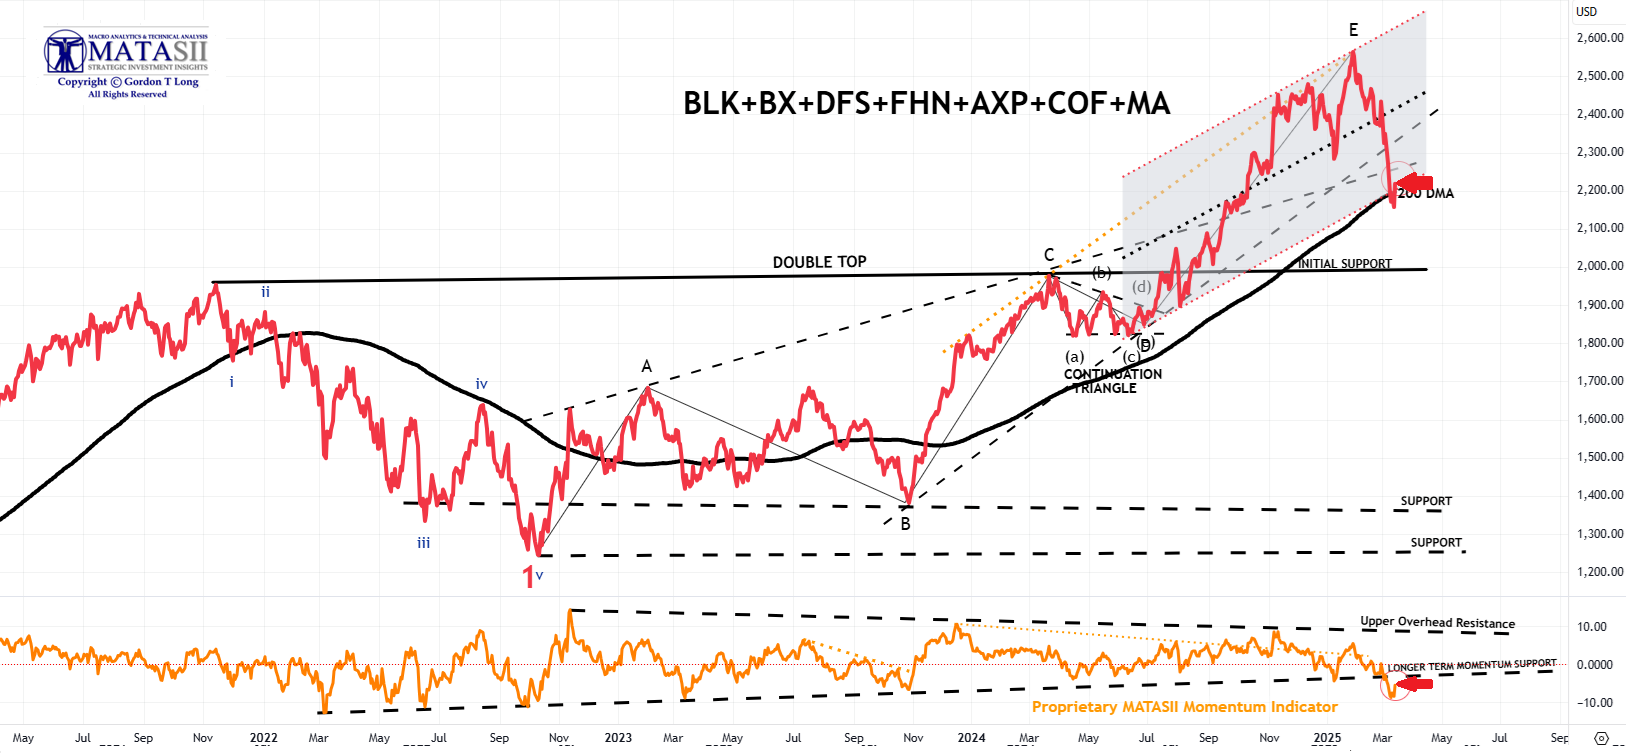
FINANCIAL MARKETS CURRENTLY STRONGER THAN MAG-7
MATASII CHART NOTES:
-
PRICE - The MATASII Financial Index rose hard this week to close Friday at 2218.02 up 60.96 (+2.83%) for the day and down compared to last Friday's close at 2271.62.
-
DMA - It appears the target is the 200 DMA which matches the bottom of the control channel.
-
MATASII PROPRIETARY MOMENTUM INDICATOR - In the bottom panel, the MATASII Proprietary Momentum Indicator broke support at the major black dashed line trend line highlighted by the red arrow.
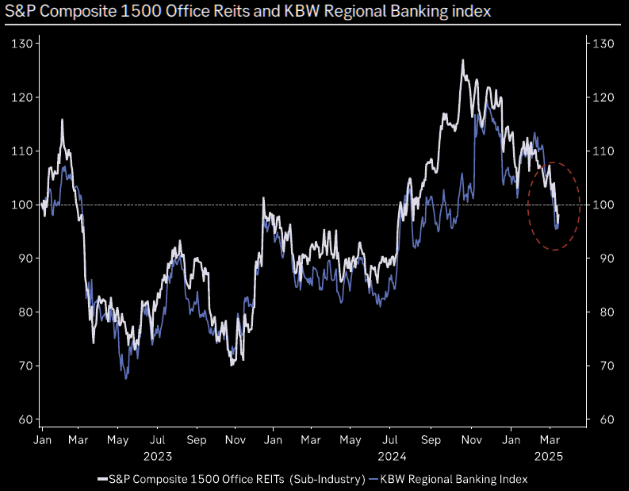
| | | Underperforming financials, banks and falling REITS are an early indication of increased economic and financial stress | | | |
YOUR DESKTOP / TABLET / PHONE ANNOTATED CHART
Macro Analytics Chart Above: SUBSCRIBER LINK
| | |
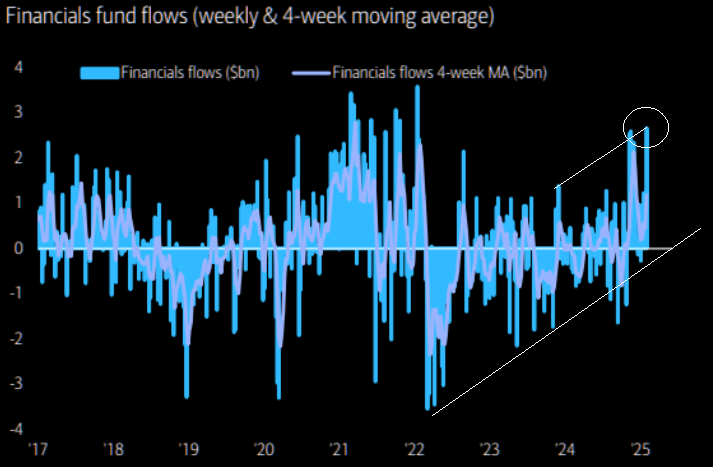
MATASII FINANCIAL INDEX - ANALYTICS
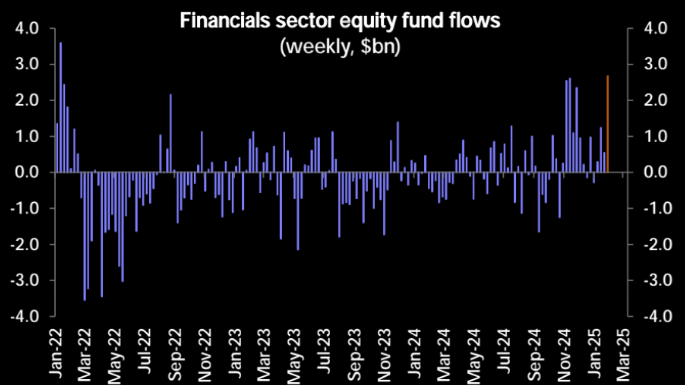
In one month these flows have reversed and fallen.
| | |
FUND FLOWS
02-04-25
Fund flows to Financials surged to a 3-year high on the back of strong Q4 earnings reports.
| | | |
FUND FLOWS
02-02-25
Financial Mania - Biggest inflows to financials since Jan’ 22.
| | | |
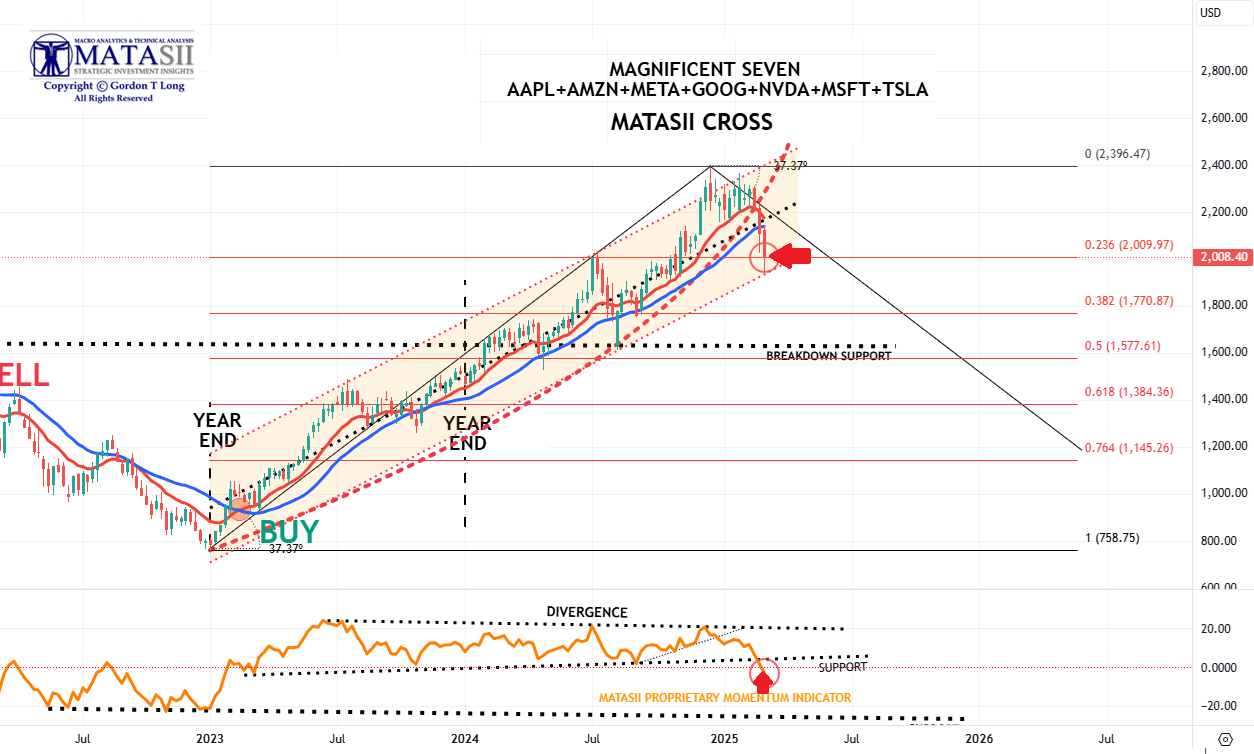
***MAGNIFICENT 7***
MATASII CHART NOTES:
-
PRICE - The Mag-7 closed Friday at 1946.87 up +52.9 (+2.79%) for the week compared to last Friday when we closed at 2008.40.
-
MATASII PROPRIETARY MOMENTUM INDICATOR - Meanwhile the MATASII Proprietary Momentum Indicator (lower panel) broke support level marked but held within its' rising trend channel marked by the red arrow.
| | | |
MARKET LAB
Consider that the typically high-performing S&P 500 technology sector lagged the broader index in January by the widest margin since 2016. Four of the Magnificent 7 have recently been trading below their 50-day moving averages, another bearish signal for traders. In addition, hedge funds are increasingly reducing gross exposures to these kinds of stocks for the first time in a year, while companies' insiders are selling shares at the highest rate since 2021, raising questions about the company's ability to achieve earnings targets and justify their lofty valuations. (Morgan Stanley)
| | | |
YOUR DESKTOP / TABLET / PHONE ANNOTATED CHART
Macro Analytics Chart Above: SUBSCRIBER LINK
| |
|
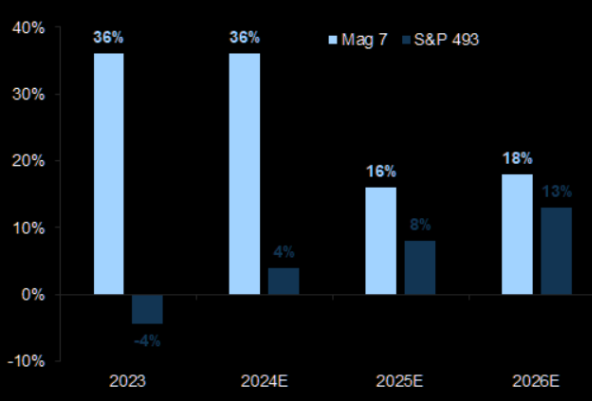
NEW-- EARNING
03-14-25
Expect earnings conversion
Despite recent large earnings growth differences between the Magnificent 7 and the rest of the S&P 500, we now expect convergence
| | | | | |
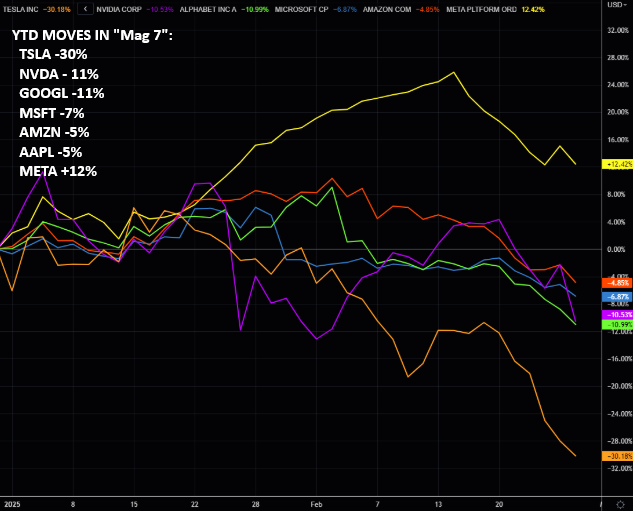
PATTERNS - 02-28-25
MAG7 - YTD moves in "Mag 7":
TSLA -30% / NVDA - 11% / GOOGL -11% / MSFT -7% / AMZN -5% / AAPL -5%...META +12%
| | | |
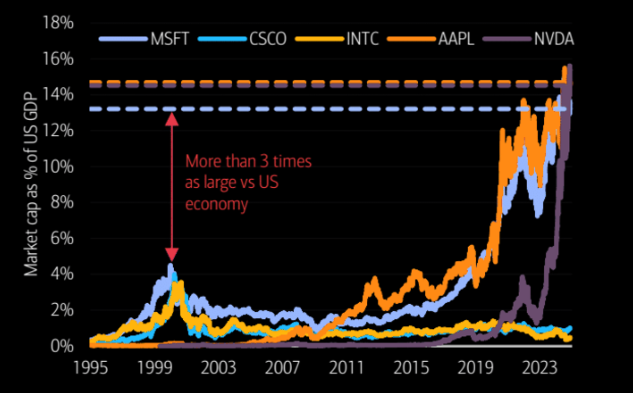
CORRELATION
This chart makes the 2000 Dotcom Bubble look like a "minor warm-up"?
| | | |
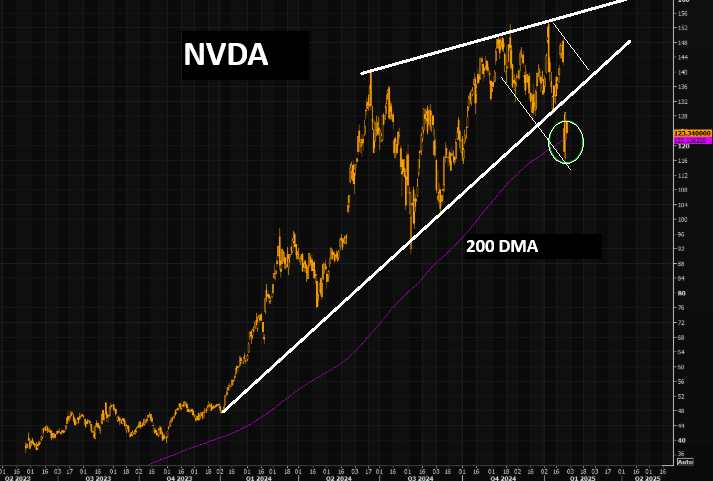
***NVIDIA - NVDA - DAILY***
MATASII CHART NOTES:
-
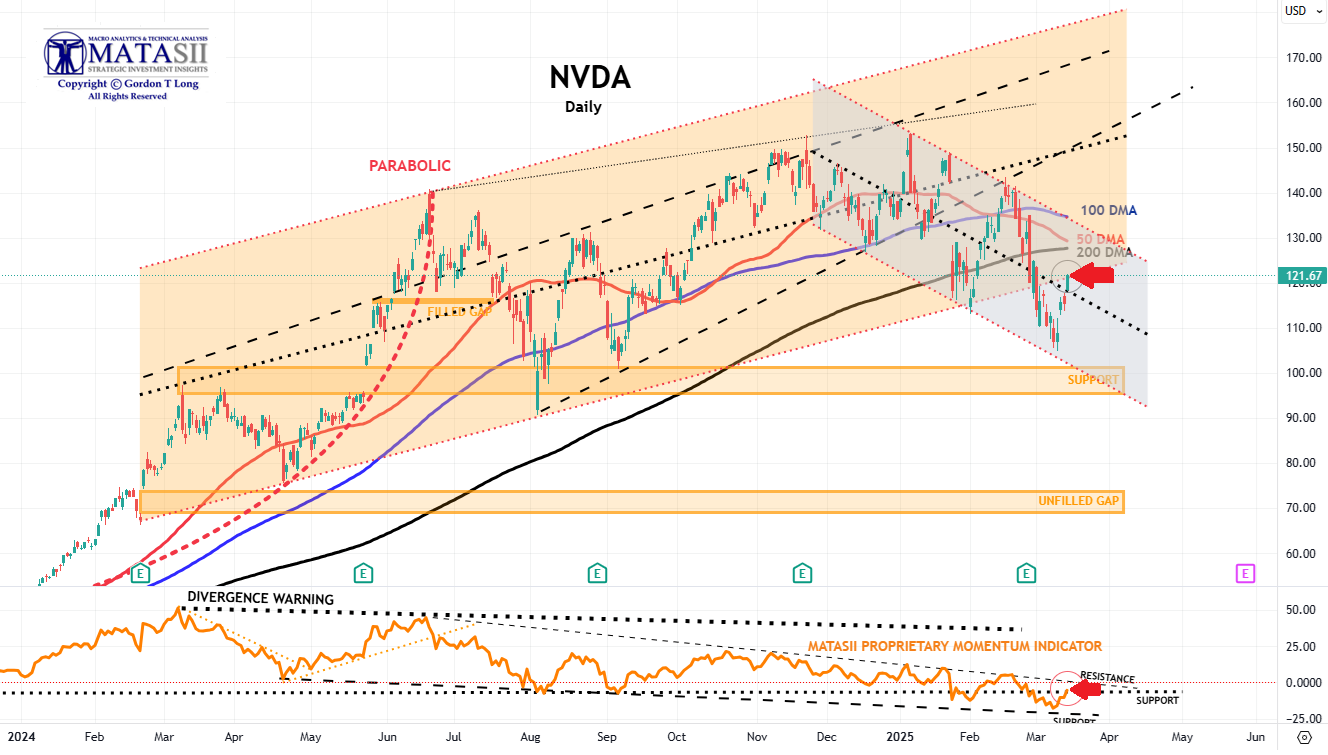
PRICE - NVDA pushed higher Friday closing at 121.67 up +6.09 (+5.27%), and up compared to last Friday at 112.69
-
DMA - Price has broken well below the 200 DMA and with support being found with the lower trendline of the shorter term support channel.
-
MATASII PROPRIETARY MOMENTUM INDICATOR - The NVDA MATASII Momentum indicator finally found support at its lower support level (black dashed line) and has been rallying from it.
Prior Longer Term Note:
- At some point, the major unfilled gaps (at much lower levels) must be filled. We anticipate a likely test of the 200 DMA in Q4 2024 or Q1 2025.
- NVDA therefore may no longer become a Short to Intermediate Long Term hold, but rather a position trading stock, as other competitors enter the space, force margins and the earnings growth rate contracts.
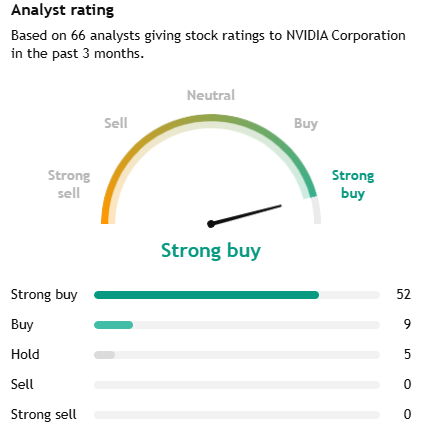
NOTE RIGHT: Analyst Rating to the right are always too positive and delayed. History suggests the trick is to BEGIN reducing positions as soon as ANYONE changes their rating to Hold or Lower.
5 OUT OF 66 IS A CONCERN
(We use the ratings for Mag-7 Only.)
| | | |
MARKET LAB
AS GOES NVDA SO GOES THE MAG-7!
AS GOES THE MAG-7 SO GOES THE MARKET!
| |
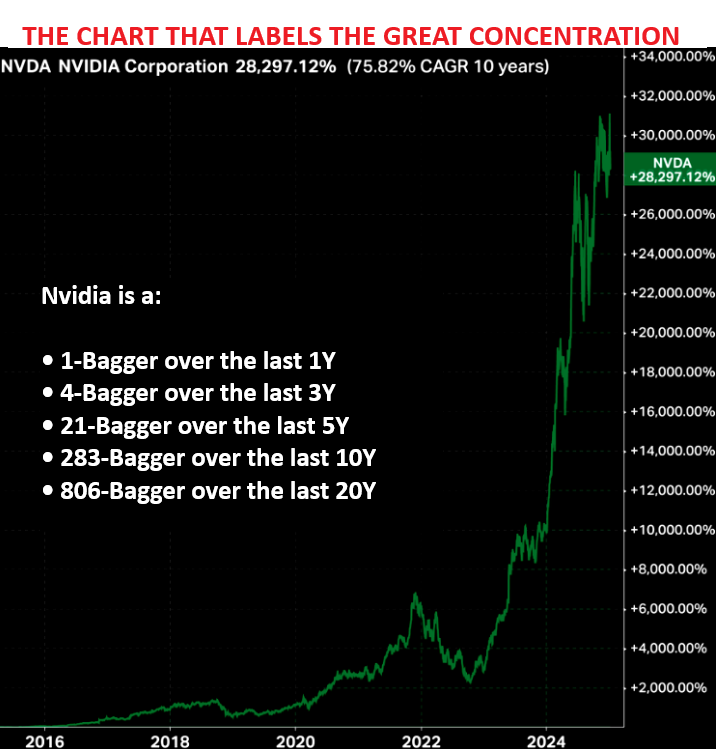
With a market cap of $3.61tn and nearly as big as the entire DAX and CAC combined, earnings are going to be a big event. To give you a scale for their astonishing earnings trajectory over such a short period of time, at the recent lows in Jan 2023 Nvidia earned $4.4bn over the preceded last 12m. However, today the consensus will see them earn $61.4bn over the last 12 months. By the time we hit 2027, they are expected to earn $118.1bn LTM.
The growth in NVDA’s forward revenues and operating earnings have both been remarkable, as has its ability to maintain a forward profit margin north of 55%. Nvidia’s forward P/E of 32.6 is certainly higher than the S&P 500’s forward earnings multiple of 21.6. But it looks reasonable relative to the company’s expected forward earnings growth of 53.1%.
| | | |
YOUR DESKTOP / TABLET / PHONE ANNOTATED CHART
Macro Analytics Chart Above: SUBSCRIBER LINK
| | | | | |
CHART RIGHT-- NVDA - 01-29-25
Fighting the 200 DMA
NVDA is trading right on the 200 day moving average as of writing. Massive moves, especially if you consider the changes in market cap. This is not how strong leaders behave.
| | | |
CONTROL PACKAGE
- Invesco DB Agricultural Fund (DBA)
- VanEck Agribusiness (MOO)
- Food Producers (FT350 Food Producers - NMX45)
- Teucrium Agricultural Fund ETV (TAGS)
- Advisory Shares Restaurant ETF (EATZ)
- Invesco Food & Beverage ETF (PBJ)
- Teucrium Wheat Fund ETV (WEAT)
- Teucrium Corn Fund ETV (CORN)
- Teucrium Soybean Fund ETV (SOTB)
- Teucrium Sugar Fund ETV (CANE)
| | | | | |
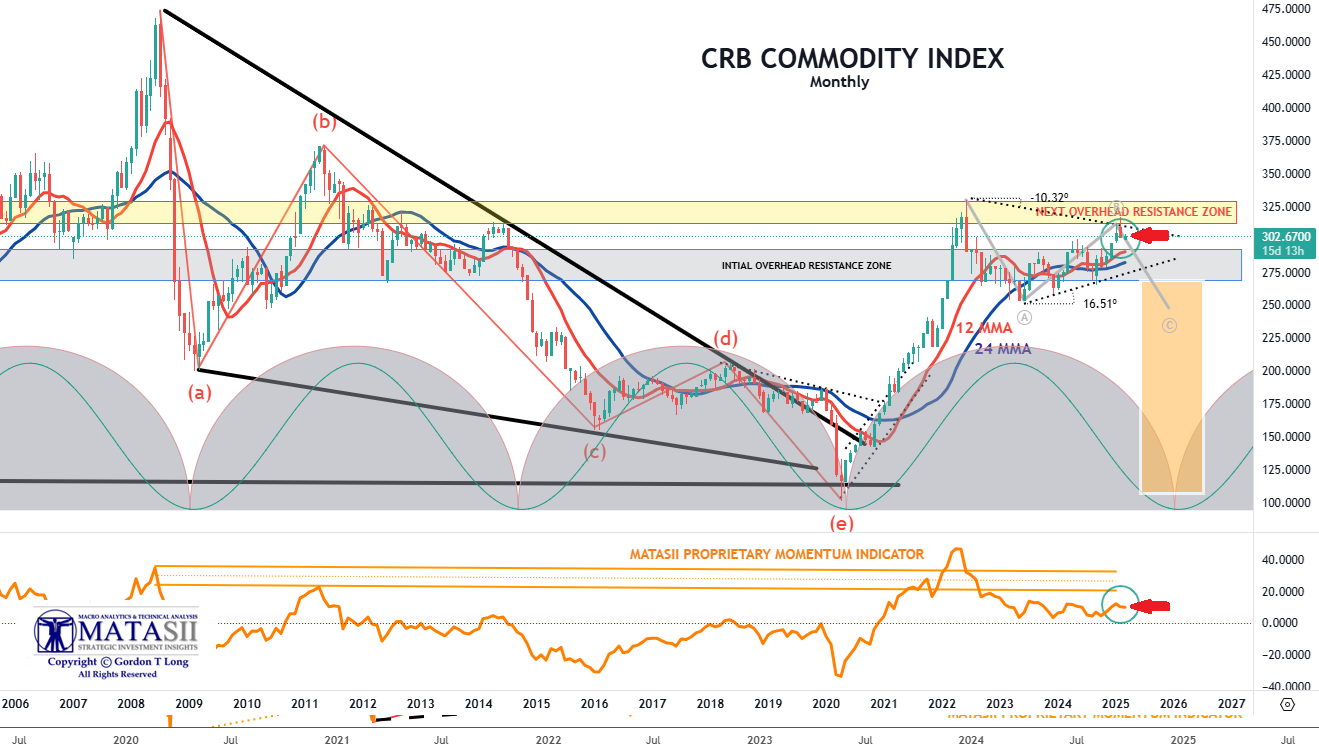
***CRB COMMODITY INDEX***
CHART NOTES:
- The overall Commodity Indexes, as measured by the CRB Commodity, reflect a Corrective / Consolidation is presently nearing completion.
- However, many of the individual sectors (not shown here) have already completed the Corrective / Consolidation and broken higher over the last 30-60 days.
| | | |
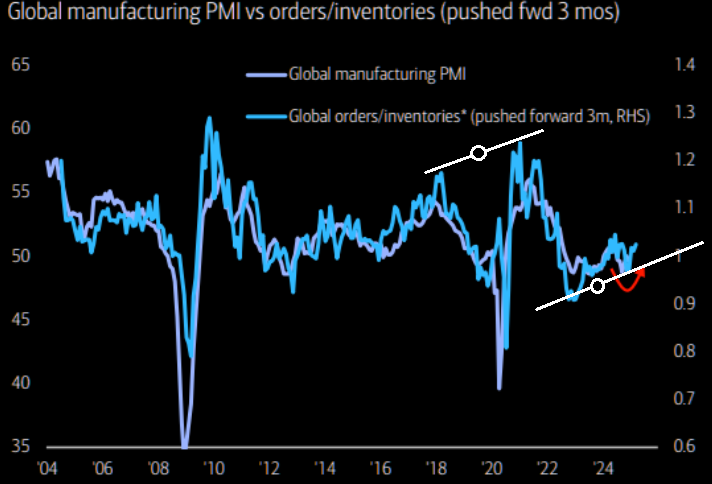
01/18/25: Rising global PMIs = Long commodities
Got Commodities?
| | | |
YOUR DESKTOP / TABLET / PHONE ANNOTATED CHART
Macro Analytics Chart Above: SUBSCRIBER LINK
| | |
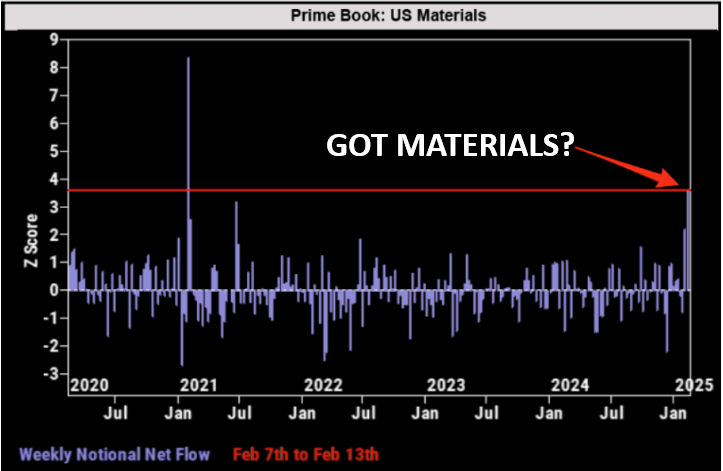
COMMODITIES - MATERIALS
02-20-25
HFs net bought US Materials at the fastest pace since February 2021, driven entirely by long buys.
| | | |
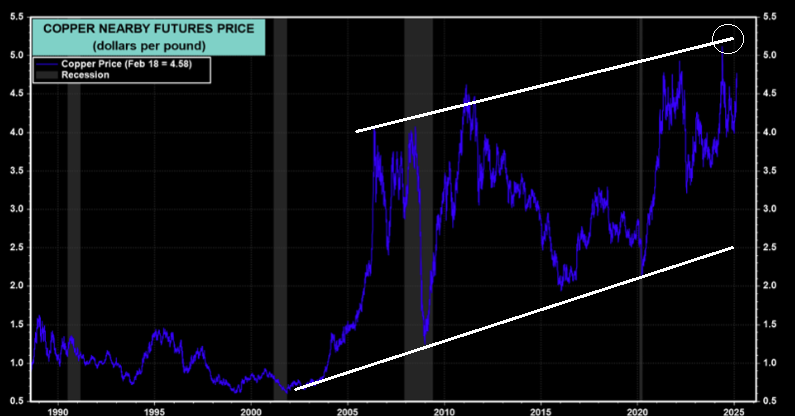
DR COPPER - 02-20-25
"If the aggressive fiscal actions taken by Trump 2.0 and the Chinese government improve global economic growth, that might increase business and consumer confidence and spending. We’ve been watching for signs of this in copper prices, which have popped 14.9% ytd."
| | | |
***GOLD***
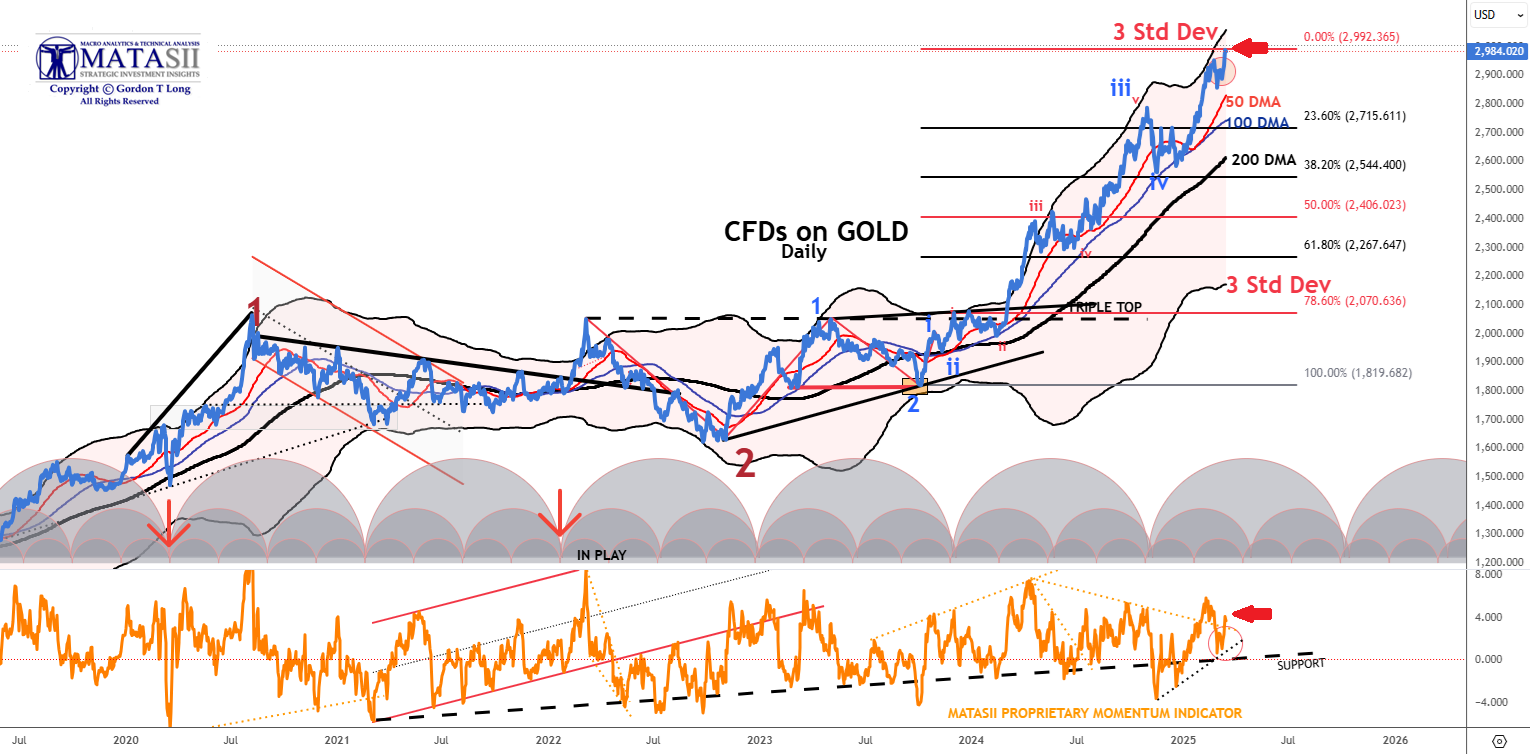
CHART NOTES:
-
PRICE - Gold fell with Friday's post-market trading at 2984 down -4.67 (-0.16) for the day, but well up from last Friday's close of ~2850.
-
3 SIGMA BOMAR - Gold once again back at its' 3 Standard Deviation Bomar Band and a new high.
-
MATASII PROPRIETARY MOMENTUM INDICATOR - Momentum found support at a lower MATASII Momentum Indicator trend line shown in the lower panel and marked by the black dashed trendline before bouncing above a small degree overhead resistance trendline (as shown by the red arrow).
GOLD IS DUE FOR A CORRECTIVE / CONSOLIDATION!
| | | |
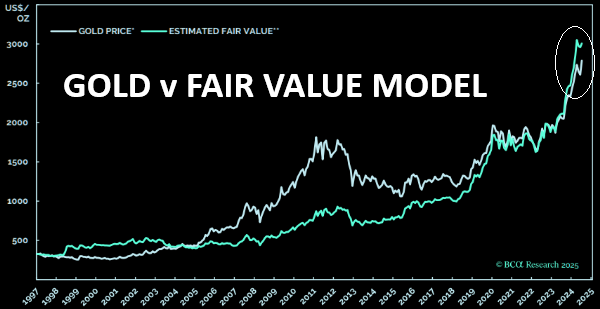
CORRELATION - 03-07-25
GOLD versus Fair Value Model
| |
SITUATIONAL ANALYSIS
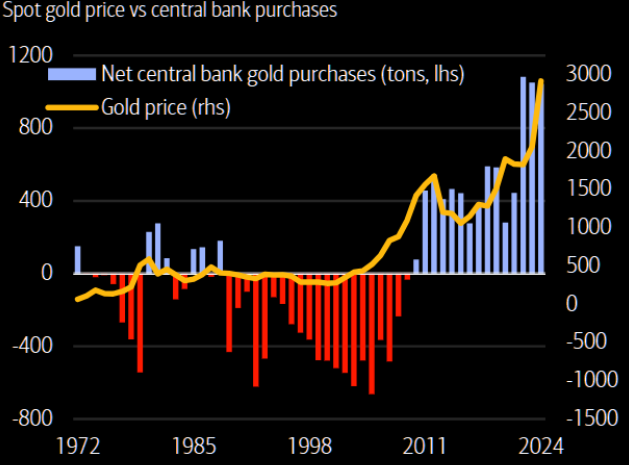
- Gold has recently been supported and further boosted by the PBoC resuming Gold purchases in November after a six-month halt.
- We note that ETF buying however has been surprisingly weak over the past four years, as shown by the 2nd chart above.
| | | |
YOUR DESKTOP / TABLET / PHONE ANNOTATED CHART
Macro Analytics Chart Above: SUBSCRIBER LINK
| |
|
NEW-- GOLD
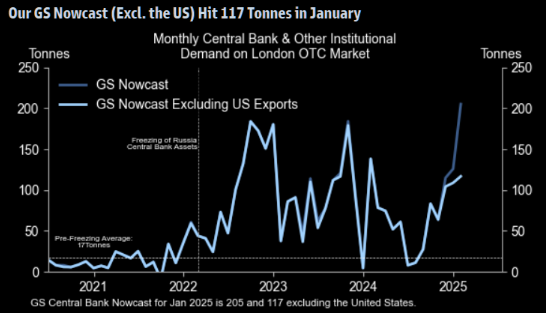
CENTRAL BANK BUYING
03-14-25
The longer term gold Central Bank chart
Hunger for gold is huge.
| | | | |
|
NEW-- GOLD UPSIDE RISK
03-15-25
Goldman Sachs
"We see upside risk to our $3,100 end-2025 base case and to our $3,100-3,300 forecast range because US policy uncertainty may support investor demand, and because we believe that central bank gold buying will remain structurally higher than before the freezing of Russian central bank reserves in 2022. We think this is the case even after a potential Russia-Ukraine ceasefire given the freezing of assets established a significant precedent."
| | | | | |
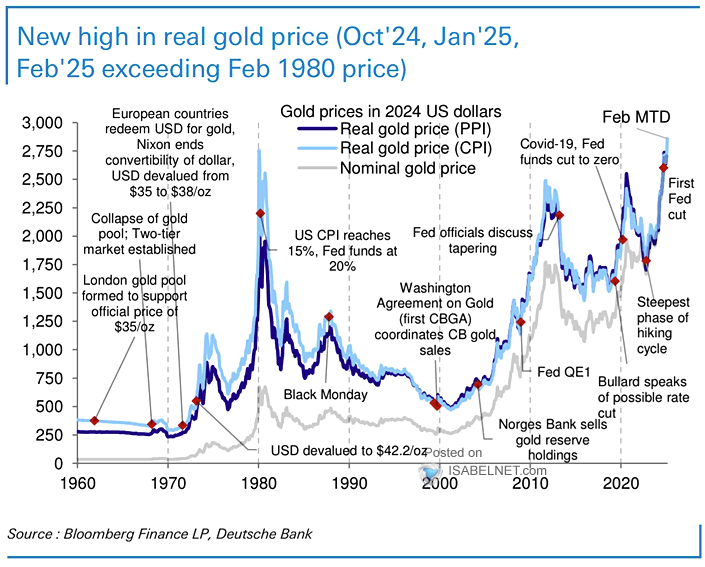
GOLD - 02-14-25
Gold Prices in 2024 U.S. Dollars - The real (inflation-adjusted) price of gold has reached a new all-time high, driven by several factors including U.S. tariff uncertainties, geopolitical tensions, and increased demand from global central banks. - Deutsche Bank
| | | |
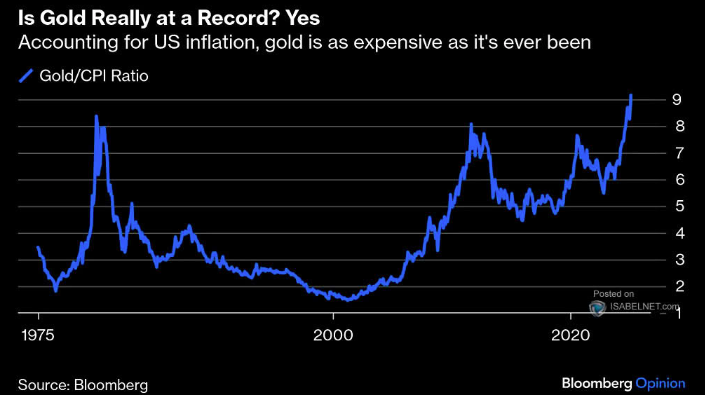
GOLD/CPI RATIO - 02-12-25
The inflation-adjusted price of gold has reached a new high, breaking its previous record from January 1980. This reflects the ongoing devaluation of the U.S. dollar, global economic uncertainties and strong demand from central banks.
| | | |
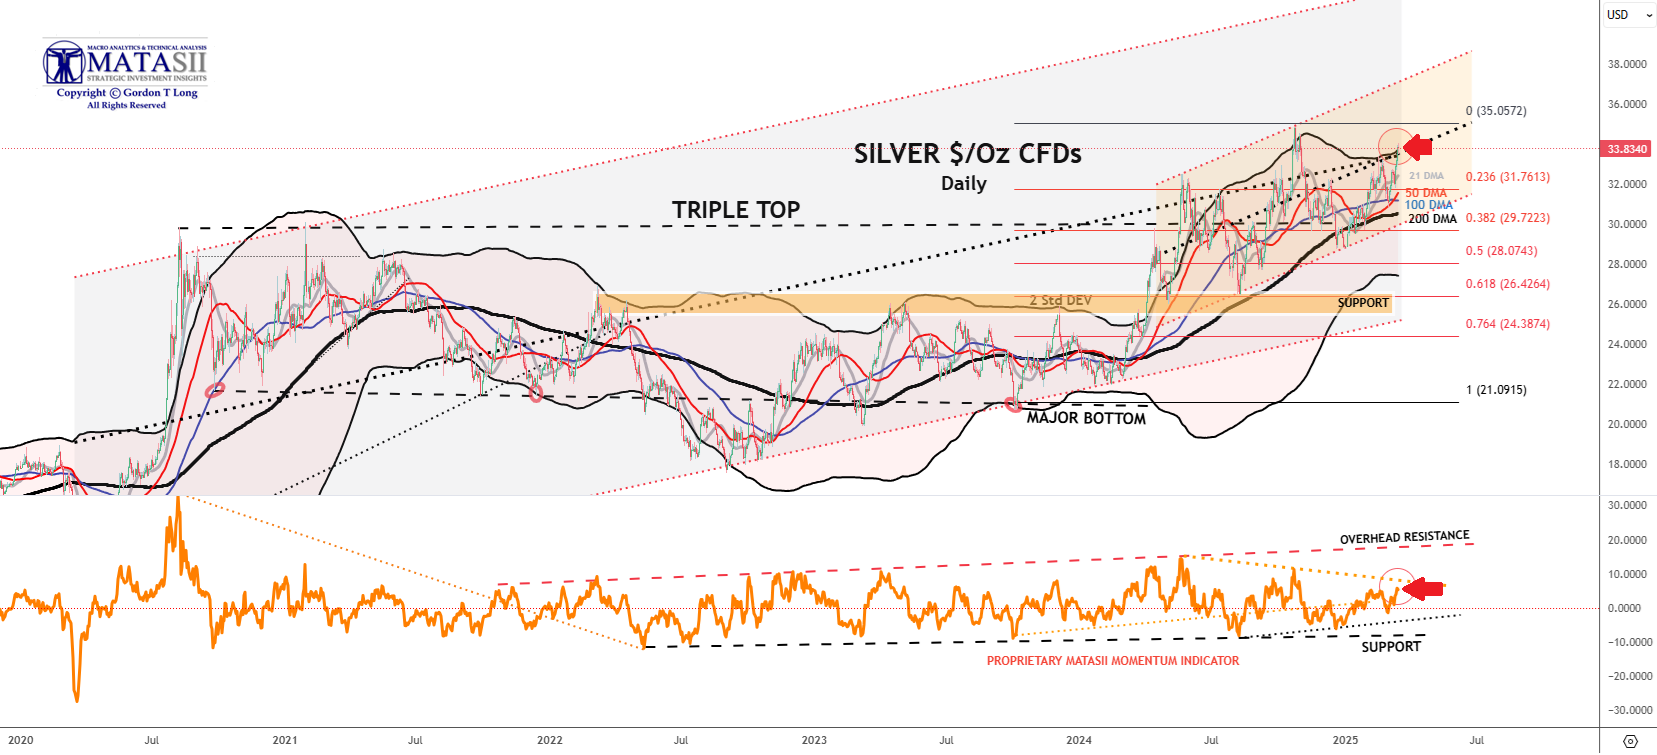
***SILVER***
MATASII CHART NOTES:
-
PRICE - Silver closed Friday at 33.234 down -0.031 (-0.09%) for the day, but up for the week compared to last Friday's close at 32.506.
-
DMA - Silver broken above all its' Moving Averages 21 / 50 / 100 /200 DMA to its upper Bomar Band.
-
MATASII PROPRIETARY MOMENTUM INDICATOR - The MATASII Proprietary Momentum Indicator shows there is more upward potential before touching overhead resistance.
| | 02-17-25: Silver often comes late to the party, but when it finally gets there it can be an unstoppable hedonist. | | |
YOUR DESKTOP / TABLET / PHONE ANNOTATED CHART
Macro Analytics Chart Above: SUBSCRIBER LINK
| | |
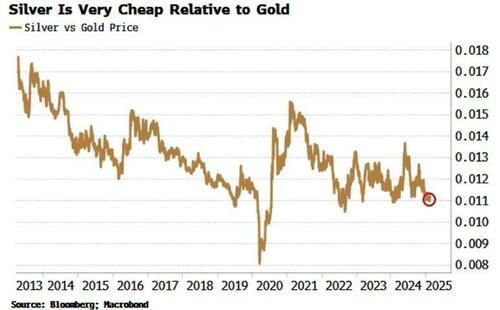
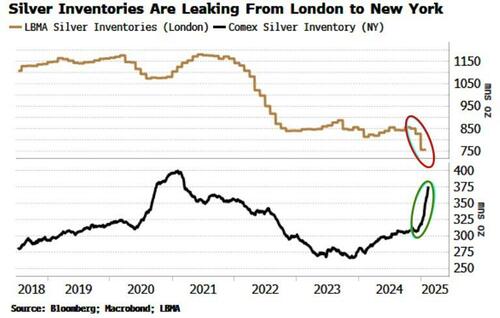
SILVER - 02-17-25
We are seeing the same dynamics with silver as we are seeing with gold. There is a shortage of deliverable physical metal in London after years of EM central-bank hoarding.
Comex silver warehouses in the US are filling up while stocks in London are falling.
| | |
THIS WEEK'S MARKET MONITOR | |
MONDAY
- US equities started the week slumping in the red (SPX -2.7%, NDX -3.8%, RUT -2.7%, DJI -2.1%), wiping out Friday's rally and hitting six-month lows as concerns over the US economy, present/incoming US tariffs and retaliatory tariffs from others. e.g China's latest retaliatory tariffs (effective today) weighed.
- Sectors ex-Utilities & Energy were in the red, with all of the MAG-7 losing ground.
- As such, Technology, Discretionary, and Communications were hit the hardest.
- For Discretionary, pressure came largely by way of Tesla (TSLA) having its worst day since 2020 (-12%) after China vehicle exports tanked in February.
- In FX, the Dollar caught relief from recent heavy selling, prevailing over the CAD amid intensifying relations between Canada and the US, given that the incoming PM Carney showed no immediate plan of removing their tariffs on the US.
- Meanwhile, the Euro was weighed on by a Greens Party official recommending the party's lawmakers to not vote for the spending plan bill, contending it must show investment goes towards climate and the country.
- On Crude, prices were lower by over USD 1/bbl with energy/geopolitical updates taking the backfoot as the subdued demand picture took the reins.
- That said, the US Energy Secretary said he is looking at working with Congress on cancelling mandate sales from oil reserve. In geopolitics, via AFP, Kyiv will propose a truce in the air and sea during talks with Washington in Riyadh.
- Elsewhere, Treasuries were firmer across the curve, with the 10-year yield having its biggest down day since September, -10bps, as risk-off trade lifted the space higher.
- Data in the US was contained to the NY SCE, which saw the 1-yr ahead exp. inflation rise to 3.1% (prev. 3.% in Jan) and consumers expected probability of missing debt payments at its highest level since April 2020.
- For the week ahead, main events take off on Wednesday, with US tariffs on aluminium and steel to go into effect and the release of February CPI, ahead of PPI on Thursday and UoM on Friday.
INFLATION BREAKEVENS: 5yr BEI -3.9bps at 2.432%, 10yr BEI -3.4bps at 2.314%, 30yr BEI -2.6bps at 2.238%.
REAL RATES: 10Y - 1.9625%
STOCK SPECIFICS:
- Tesla (TSLA): China sold 1.41mln passenger cars in Feb., +26.1% Y/Y; TSLA exported 3.9k China-made vehicles (prev. 30.2k Y/Y).
- DoorDash (DASH), TKO Group Holdings (TKO), and Williams-Sonoma (WSM) to join the S&P 500 at the open on March 24th.
- Novo Nordisk (NVO) weighed on latest Cagrisema data.
- Ford (F): Will provide up to EUR 4.4bln in new financing for German subsidiary.
- Applied Materials (AMAT): Raises Q cash div. 15% to USD 0.46/shr & new 10bln share repurchase authorisation.
- Cognizant Technology Solutions (CTSH): Activist Mantle Ridge has built > USD 1bln interest & believes shares are undervalued.
- QXO (QXO) & Beacon Roofing Supply (BECN) in discussions about a potential combination; QXO would acquire BECN for USD 124.35/shr in cash or ~USD 11bln.
- DexCom (DXCM): Received a warning letter from the US FDA following inspections of Cos. facilities.
- Redfin (RDFN): To be acquired by Rocket Companies (RKT) for USD 12.50/shr or USD 1.75bln; Closed Fri. at USD 5.82/shr.
- ServiceNow (NOW): Reportedly near a deal for Moveworks which could value the firm at ~USD 3bln.
- Apple (AAPL) and Meta (META) likely to face modest fines, not massive fines, for allegedly breaching EU's Digital Markets Act, according to Reuters citing sources.
TUESDAY
- US indices eventually closed in the red on Tuesday (RUT stayed green), albeit well off the earlier highs and lows, in what was a headline-intensive day which drove choppy trade.
- On Trump tariffs, the President initially raised the 25% tariff on all steel and aluminium coming into the US from Canada to 50%, effective March 12th, but this was later revoked after the Ontario Premier announced they are suspending the 25% surcharge on exports of electricity.
- Elsewhere, and also improving risk sentiment through the US afternoon, was the joint US/Ukraine statement on a ceasefire proposal.
- The US State Department said the US and Ukraine took important steps toward restoring durable peace for Ukraine and Ukraine expressed readiness to accept the US proposal to enact an immediate and interim 30-day ceasefire.
- Following this, Trump stated he will talk to Russian President Putin, but it takes "two to tango" and thinks he will talk with him this week but he hopes to have a total ceasefire in the coming days.
- On data, the JOLTS report came in above expectations while the quits rate and vacancy rate increased, but saw little reaction due to it being stale data whilst participants had tariff updates to focus on.
- The Dollar was sold with DXY hitting a YTD trough.
- The EUR outperformed as it was boosted by comments from the German Green party co-leader that they are hopeful of a defence deal occurring this week.
- Meanwhile, JPY lagged as it was hit by Nikkei reporting that the GPIF will not be boosting its holdings of stocks, firmer UST yields also weighed.
- Treasuries were sold on the choppy tariff updates and Russia/Ukraine ceasefire optimism.
- The crude complex was choppy but settled with slight gains as it pared some of Monday's losses amid broader macro sentiment, as opposed to energy-specific headlines.
- Ahead, US CPI and BoC are the highlights on Wednesday, as well as any further rhetoric on Trump Tariffs on Ukraine/Russia.
INFLATION BREAKEVENS: 5yr BEI +0.6bps at 2.441%, 10yr BEI +0.4bps at 2.316%, 30yr BEI +0.4bps at 2.241%.
REAL RATES: 10Y -- 1.9486%
GUIDANCE UPDATES:
Communications
- AT&T (T): Disappointing Q1 adj. EPS view.
- Verizon (VZ): Growth in Q1 will be 'probably soft'.
Airlines:
- Delta Air Lines (DAL): Cut Q1 EPS guidance and lowered revenue growth expectations amid weakened domestic demand due to macro uncertainty.
- American Airlines (AAL): Trims Q1 outlook.
- Southwest Airlines (LUV): Accelerated its USD 2.5bln share buyback programme and to charge for bags, which is offsetting them reducing Q1 RASM view.
- JetBlue (JBLU): Left revenue guidance unchanged, but did lower Q1 capacity down. Shares potentially supported by leaving the top line the same in wake of DAL/AAL cutting.
- United Airlines (UAL): Offered cautious commentary noting they have seen weakness in the demand market, but now expects EPS to be in the low range of forecast range. As such, it didn't cut like other airline peers.
Industrials:
3M (MMM): Continued to add the glum picture, as it expects Q1 organic sales growth between 1-1.5%, with some order deliveries shifting into Q2 amid a cautious macro landscape.
STOCK SPECIFICS:
- Tesla (TSLA): CEO Musk says it is going to double vehicle output in the next two years, and plans to remain CEO.
- Oracle (ORCL): EPS & revenue missed with light Q4 guidance citing investment losses
- Asana (ASAN): Announced CEO succession plan & weak next quarter revenue outlook
- Sonoco (SON): Will raise prices by USD 70/tonne for uncoated recycled paperboard in the US & Canada, effective April 10th.
- Meta (META): Reportedly to be testing first AI training chip
- Kohls (KSS): Profit missed w/ dismal FY25 SSS guidance
WEDNESDAY
- US indices saw gains in a choppy day of trade, and it was ultimately boosted by a soft US CPI report quelling some recent US economic fears, although US growth concerns and tariff uncertainty continue to loom heavily in the background.
- Highlighting the slight reversal in risk sentiment today, was the mega-cap sectors, Technology, Communication Services, and Consumer Discretionary, with NVDA (+6.4%) and TSLA (+7.6%) seeing heavy gains.
- Back to data, US CPI was cooler than expected across the board, although the headline was largely weighed on by a 4% plunge in airline fares, but it won’t feed through to the PCE.
- In reaction, markets saw a broad-based dovish reaction (Tsys upside, Dollar downside), but both Treasuries and the Dollar pared initial moves as focus swiftly went back to global trade, rather than CPI metrics as it was released a day after blanket tariffs imposed by the US.
- In FX, CAD outperformed in wake of BoC, whereby the bank lowered rates by 25bps, as widely expected, with Governor Macklem noting the BoC will be "proceeding carefully" when it comes to the policy path.
- Yen lagged amid yield differentials. In the energy space, crude saw gains as it was buoyed by a turnaround in recent risk sentiment as cooler-than-expected US CPI supported as well as bullish inventory data, although the aforementioned macro woes remain ever-present.
INFLATION BREAKEVENS: 5yr BEI +2.7bps at 2.472%, 10yr BEI +2.1bps at 2.339%, 30yr BEI +2.0bps at 2.262%.
REAL RATES: 10Y -- 1.9348%
STOCK SPECIFICS:
- Goldman Sachs reduced its 2025 year-end S&P 500 target to 6,200 (prev. 6,500) citing a lower fair-value forward P/E multiple (20.6x vs. 21.5x).
- TSMC (TSM): Approached US chipmakers, Nvidia (NVDA), AMD (AMD), and Broadcom (AVGO) about investing in a JV to operate Intel (INTC) factories.
- Verizon (VZ): US DoT criticised Co. for slow progress on its USD 2.4bln FAA contract.
- Casey's (CASY): EPS & revenue beat.
- Merck (MRK): A federal judge ruled in favour of Merck in a safety lawsuit involving its Gardasil vaccine.
- Inditex (IDEXY): Reported a slower start to Q1 ‘25.
- Walmart (WMT): China summoned Walmart execs to express concerns re. tariff response.
- Tesla (TSLA): President Trump positive mentions.
- HubSpot (HUBS): Upgraded to 'Overweight' from 'Equal Weight' at Barclays, citing Cos. near-term benefit from a price increase, new core customer ramp, and easier compares.
- PepsiCo (PEP): Downgraded to 'Hold from 'Buy' at Jefferies, noting Frito Lay continue to struggle, which will weigh on PEP's multiple.
- Trump's FTC moves ahead with broad Microsoft (MSFT) antitrust probe, according to Bloomberg.
- Tesla’s (TSLA): New Model Y order backlog in China is less than half of what was reported, via Electrek.
- Merck (MRK): Announced positive data from P3 trials that show the investigational, once-daily, oral, two-drug regimen of Doravirine/Islatravir (DOR/ISL) was maintained HIV-1 viral suppression at week 48.
- US FTC asked to delay trial against Amazon (AMZN) over Prime because of 'severe resource shortfalls in terms of both money and personnel' - court hearing.
THURSDAY
- Stocks saw further selling pressure on Thursday, with more trade threats from US President Trump weighing.
- Trump threatened a 200% tariff on alcohol within the EU in response to the 50% EU tariff on US whiskey.
- All sectors were red aside from Utilities, with downside led by Consumer Discretionary and Communication names as the heavyweight stocks took a beating.
- Aside from trade, data and geopolitics took the limelight.
- The US PPI data was softer than expected but offset by upward revisions, while the PCE components were hotter than the prior.
- Meanwhile, both Initial and Continued Jobless claims fell beneath analyst forecasts.
- The data saw two-way price action in T-notes, with T-notes hitting session lows once the data was digested.
- However, the downbeat risk tone reignited the flight-to-quality bid to see T-notes settle higher across the curve.
- On geopolitics, Russian President Putin supported the idea of a ceasefire but stressed that the ceasefire must lead to a final settlement of the conflict and solve the root causes of the conflict.
- Oil prices were lower in response to the geopolitical updates, with selling pressure seen as US Envoy Witkoff arrived in Russia and as Putin responded to the ceasefire proposal, but trade fears and the impact on economic growth hit the demand side of the equation.
- European gas prices were hit after Putin said if the US and Russia agreed on energy cooperation, then a gas pipeline for Europe could be provided.
- The downbeat risk tone on trade fears saw gold prices rally to a peak of USD 2,985/oz, a fresh record high.
- Attention on Friday turns to the US UoM Consumer Sentiment survey and inflation expectations.
INFLATION BREAKEVENS: 5yr BEI -4.8bps at 2.419%, 10yr BEI -3.1bps at 2.304%, 30yr BEI -2.1bps at 2.237%.
REAL RATES: 10Y -- 1.9791%
STOCK SPECIFICS:
- Intel (INTC): Appointed Lip-Bu Tan CEO, effective March 18th.
- Adobe (ADBE): Reaffirmed FY25 & Q2 outlook.
- SentinelOne (S): Light Q1 & FY revenue view.
- American Eagle Outfitters (AEO): Sees revenue decline due to weaker demand & tariff impacts; tariffs could negatively affect margins by USD 5-10mln.
- Dollar General (DG): EPS, revenue & SSS beat; FY guidance light.
- FTC continues probes against Microsoft (MSFT) and Amazon (AMZN).
- UiPath (PATH): Revenue disappointed for the quarter, and Q1 & FY25 revenue guidance underwhelmed.
- UAE official to press US on ability to buy more Nvidia (NVDA) AI chips, Blomberg reports.
- Tesla (TSLA): Warned Trump Administration it's 'exposed' to retaliatory tariffs, FT reports.
FRIDAY
- Stocks caught a bid on Friday, finding some solace after the recent rout that saw the S&P enter correction territory on Thursday.
- The Nasdaq and Russell outperformed, but S&P and Dow both also saw strong gains.
- All sectors were green, with Tech, Energy and Financials outperforming.
- Consumer Staples, Health Care and Materials were the relative laggards.
- Risk sentiment was buoyed overnight with China performing very well on chatter of a PBoC RRR cut, while strong sentiment continued throughout the US session.
- There were no fresh trade/tariff updates on Friday, but the focus was on the UoM Consumer Sentiment survey, which saw headline sentiment heavily miss expectations with downside in both conditions and expectations.
- The inflation expectations meanwhile surged.
- T-Notes settled lower across the curve in risk-on trade while the inflation expectations added to pressure.
- The Dollar saw mild selling pressure while Antipodes outperformed on the risk sentiment, but the chatter of an RRR cut in China was also supportive.
- Havens lagged with JPY also weighed on by soft Rengo wage data.
- The Euro was buoyed after Germany came to an agreement on the fiscal reform package, although there are still some hurdles ahead.
- Crude prices settled in the green as the crude complex benefitted from the positive risk tone.
- Gold briefly rose above USD 3,000/oz for the first ever time, but it failed to hold above the level.
- Next week attention lies on the FOMC and updated dot pots, as well as the SNB, BoE and BoJ rate decisions, while US Retail Sales are due on Monday for another look into the consumer amid fears of an economic slowdown ahead.
INFLATION BREAKEVENS: 5yr BEI +0.2bps at 2.419%, 10yr BEI +0.7bps at 2.308%, 30yr BEI +1.0bps at 2.242%.
REAL RATES: 10Y -- 2.012%
STOCK SPECIFICS:
- DocuSign (DOCU): EPS & revenue beat with better than expected margins FY26 billings guidance impressed.
- Ulta Beauty (ULTA): EPS, revenue & comp. sales topped, but FY outlook was light.
- MGM Resorts International (MGM): Plans to boost profits by implementing cost-saving measures.
- Crown Castle (CCI): Reached agreement to sell its Small Cells & Fiber Solutions businesses for USD 8.5bln.
- Hon Hai Precision Industry (HNHPF): 13% drop in Foxconn net income, driven by weak Chinese iPhone sales & greater investments in AI server production.
- Apple (AAPL): UK & US officials in talks over concerns that Britain is pressuring AAPL to weaken encryption. Elsewhere, Siri Chief calls delays ‘ugly’ in a meeting and promises fixes, according to Bloomberg.
- Tesla (TSLA): Plans to launch a lower-cost Model Y variant, reducing production costs by at least 20% compared to the refreshed version, Reuters reports.
- T-Mobile (TMUS): Downgraded to 'Neutral' from 'Buy' at Citi.
- PepsiCo (PEP): Reportedly near USD 1.5bln-plus deal for soda brand Poppi, according to Bloomberg.
| |
NOTICE Information on these pages contains forward-looking statements that involve risks and uncertainties. Markets and instruments profiled on this page are for informational purposes only and should not in any way come across as a recommendation to buy or sell in these assets. You should do your own thorough research before making any investment decisions. MATASII.com does not in any way guarantee that this information is free from mistakes, errors, or material misstatements. It also does not guarantee that this information is of a timely nature. Investing in Open Markets involves a great deal of risk, including the loss of all or a portion of your investment, as well as emotional distress. All risks, losses and costs associated with investing, including total loss of principal, are your responsibility.
FAIR USE NOTICE This site contains copyrighted material the use of which has not always been specifically authorized by the copyright owner. We are making such material available in our efforts to advance understanding of environmental, political, human rights, economic, democracy, scientific, and social justice issues, etc. We believe this constitutes a ‘fair use’ of any such copyrighted material as provided for in section 107 of the US Copyright Law. In accordance with Title 17 U.S.C. Section 107, the material on this site is distributed without profit to those who have expressed a prior interest in receiving the included information for research and educational purposes. If you wish to use copyrighted material from this site for purposes of your own that go beyond ‘fair use’, you must obtain permission from the copyright owner.
========
| | IDENTIFICATION OF HIGH PROBABILITY TARGET ZONES | |
Learn the HPTZ Methodology!
Identify areas of High Probability for market movements
Set up your charts with accurate Market Road Maps
Available at Amazon.com
| | The Most Insightful Macro Analytics On The Web | | | | |