The economy chugs along with some new data points that say all is not well. | |
Market Update - March 2025 | |
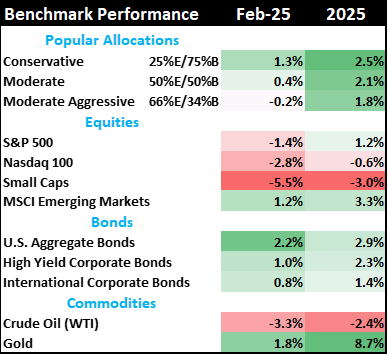
- Equities fell in February as markets digested the impact of President Trump's economic policies to trim government spending and impose tariffs on our trade partners.
- Consumer Staples, Real Estate and Utilities did well in this environment, while Consumer Discretionary and Industrial stocks fell. Falling exports and declining consumer spending started showing up in the data.
- Bond markets rose during February. While Congress has not committed any effort to cutting spending, Elon Musk's exposure of waste, fraud and abuse has some hoping that actual spending might fall without Congressional action.
- There are some parts of President Trump's agenda that will hurt the economy and there is interest to make rapid changes now and fix problems later.
| |
Table 1: Market performance estimates as of 2/28/2025 (LIMW) | |
The economy muddles along | |
|
The broad economy continues to muddle along. The most important data points used to forecast economic growth are in conflict. This is a pattern that has been in place for a few years now.
- The yield curve indicates we should be in early recession.
- Inflation indicates the economy still has growth pressures.
- Labor data shows the workforce is doing ok.
- Earnings are stable and many large companies are very profitable.
- Consumer spending and exports recently weakened dramatically.
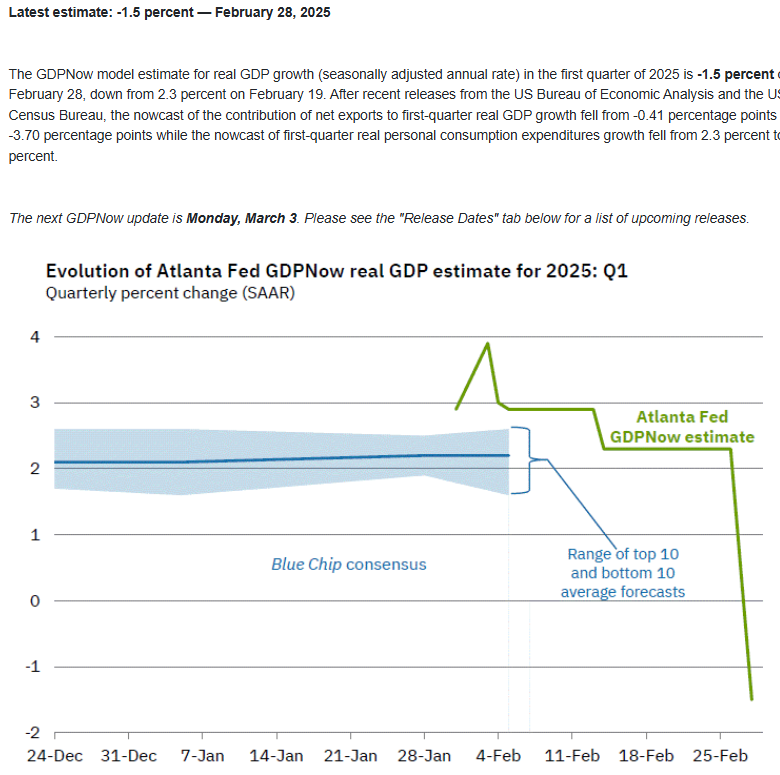
This week, one particular report raised some eyebrows. The GDPNow forecast from the Atlanta Federal Reserve pulls in monthly data to forecast current quarter GDP. Recent data points on consumer spending fell from +2.3% to +1.3% and net exports fell from -0.41% to -3.7%, which caused the forecast for US GDP to fall into recession territory. This doesn't guarantee a recession in the first quarter of 2025, but it does indicate some data is rapidly turning south.
Figure 1: GDPNow forecast for 1Q2025 (Atlanta Federal Reserve)
| |
|
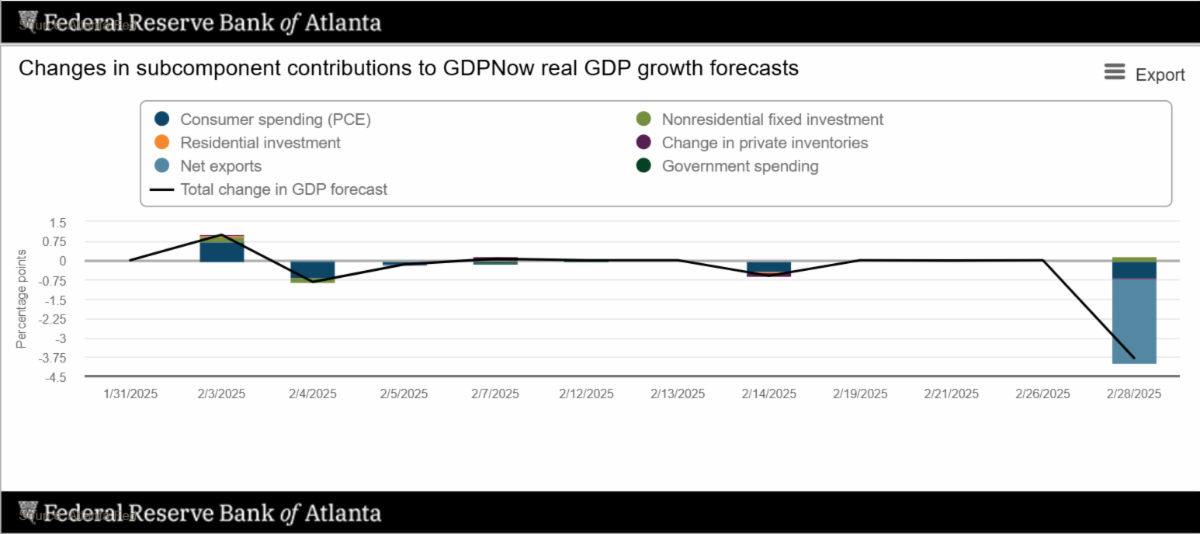
Perhaps this is just seasonality as we go from December to January. Over the last 4 years there has been some seasonality (December UP and January DOWN), but in the last few months these data points are showing big downward movements in December AND January. Could President Trump's election win change trade flows before he is even in office? Maybe. There are too many moving parts to test that theory. It is our job to recognize the changes that are occurring and include them in our investment thesis.
Figure 2: Weekly component changes to GDPNow (Atlanta Federal Reserve)
| |
|
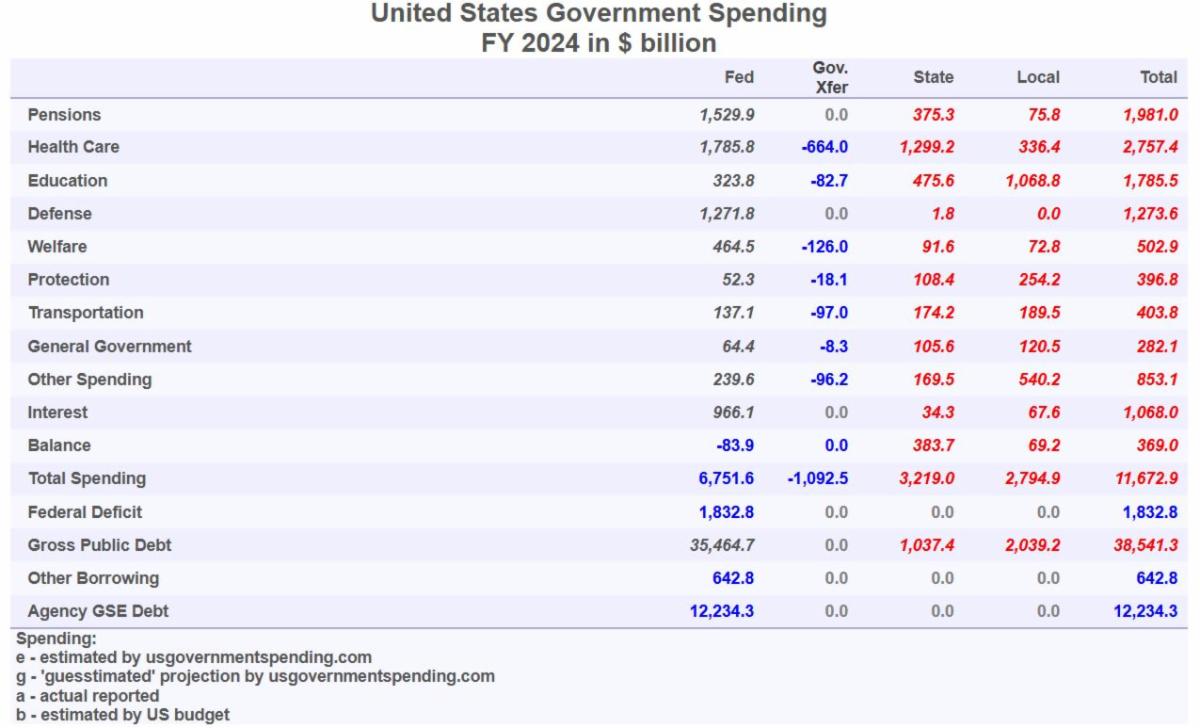
In recent weeks, Elon Musk and his team have uncovered many examples of government fraud, waste and abuse to great fanfare. There is some hope that these audits will allow the government to significantly cut wasteful spending without hurting programs approved by Congress. However, only $64 billion has been recovered so far. This is a large amount of money, but the 2024 deficit was $1,833 billion ($1.8 trillion). Hopefully, as the audit progresses, we will see a more significant decline in the deficit.
Table 2: Where the 2024 Federal budget was spent in 2024 (usgovernmentspending.com)
| |
The labor market appears stable, but with caveats | |
|
The primary data points on the labor market are 1) monthly non-farm payrolls, 2) weekly new claims for unemployment and 3) the broad unemployment rate. Each of them show a stable, but slightly weakening labor market.
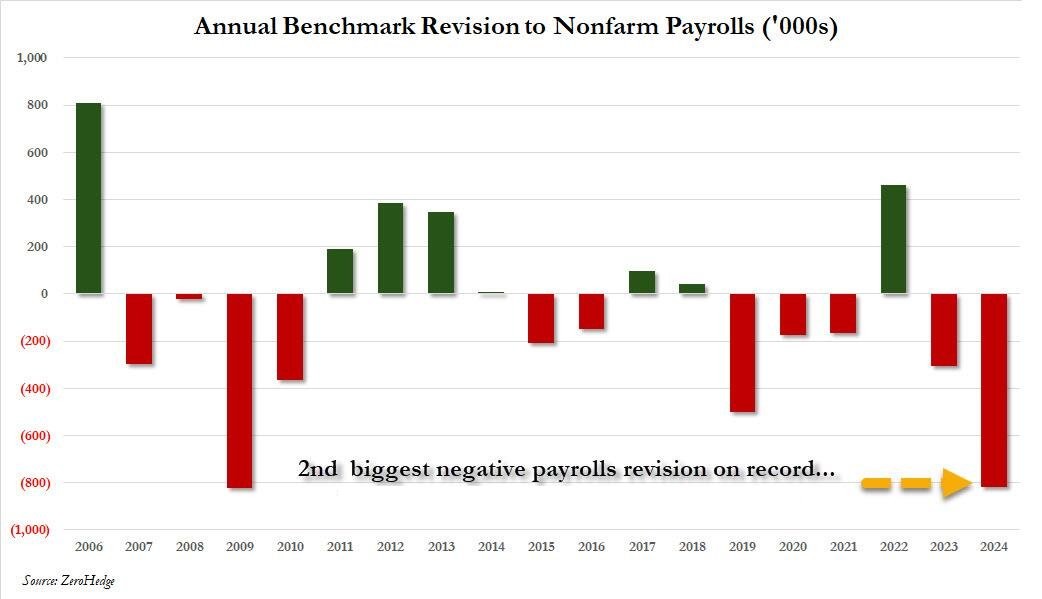
Secondary data points for the labor market are interesting. The first is the benchmark revisions to the monthly payrolls data. The headline payrolls number we see each month is heavily revised as the government collects more data and refines their original estimate. Ironically, these revisions tend to be good early warning indicators that the economy is better than reported or worse than reported.
In the next chart, you can see the benchmark revisions over the last few years. In particular, look at how the revisions evolved during and after the 2009 financial crisis. The negative revisions tell us that payrolls were much worse than initially reported during the 2009 recession. Similarly, in 2019, the negative revisions tell us the labor market was worse than reported even before the pandemic shutdown killed the economy.
Fast forward to today and we see huge negative revisions to the reported data. This means employment is doing worse than what was originally reported and that we may see the 2024 growth numbers revised downwards.
| |
Figure 3: Annual benchmark revisions to Nonfarm Payrolls (Bureau of Labor Statistics, ZeroHedge) | |
|
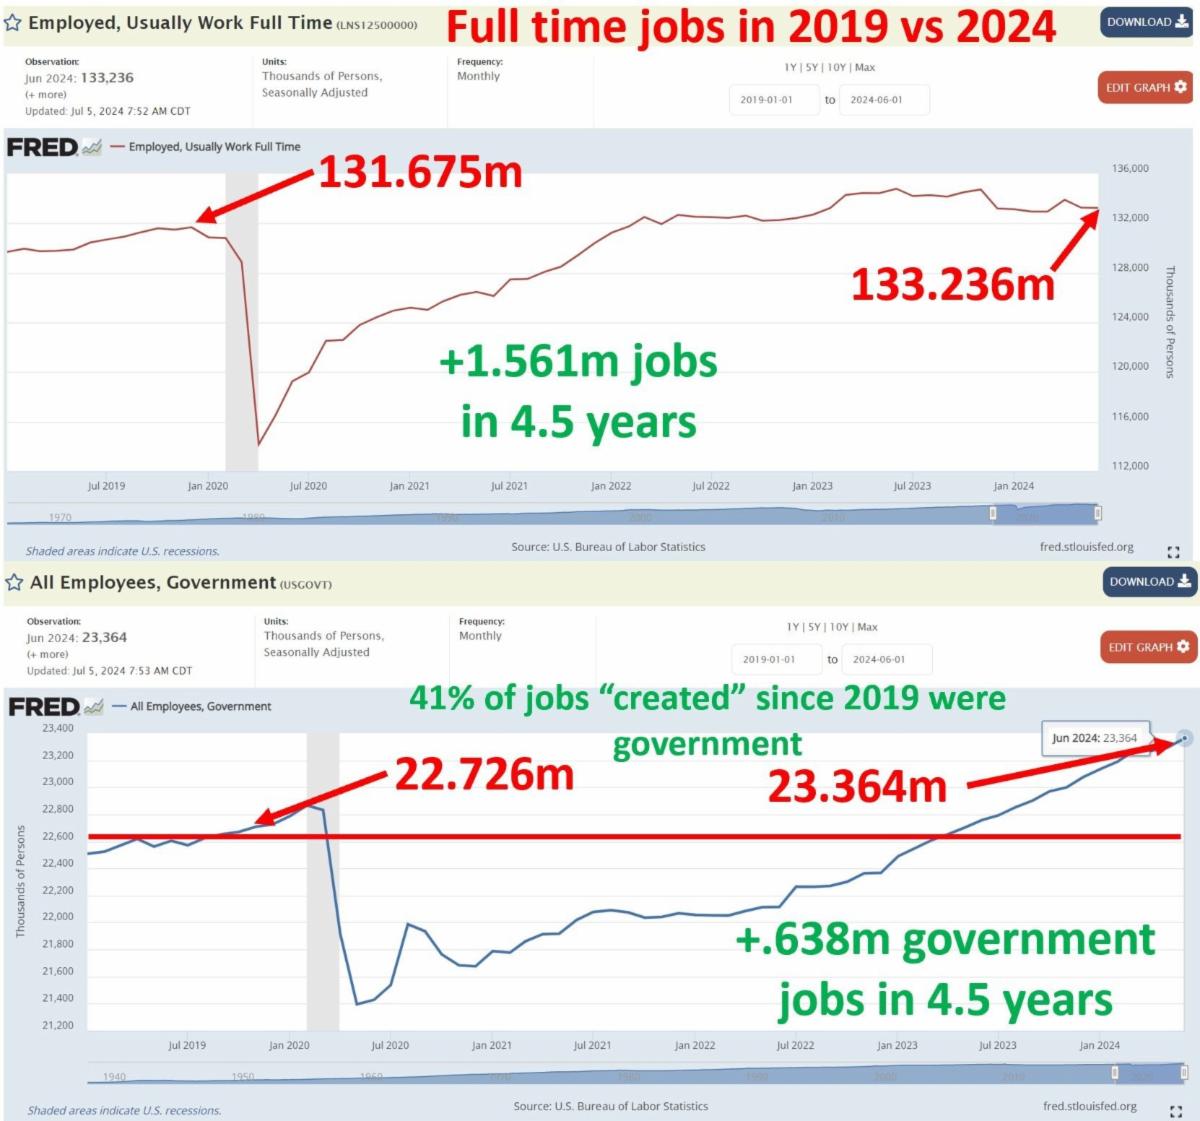
Another interesting analysis looks at the role government jobs have placed in the stability and strength of the labor market. Since the 2020 pandemic shutdown, 41% of all new jobs have been government jobs. This is extraordinary and supports the anecdotal stories contrasting the struggling private sector and healthy government sector.
Of course, President Trump is preparing the government workforce for mass layoffs, but even losing 1 million jobs may not severely impact the broad job market. This is something to watch carefully in 2025.
Figure 4: Job growth and federal job levels (St. Louis Federal Reserve, BLS)
| |
Inflation is stable, but not low enough | |
|
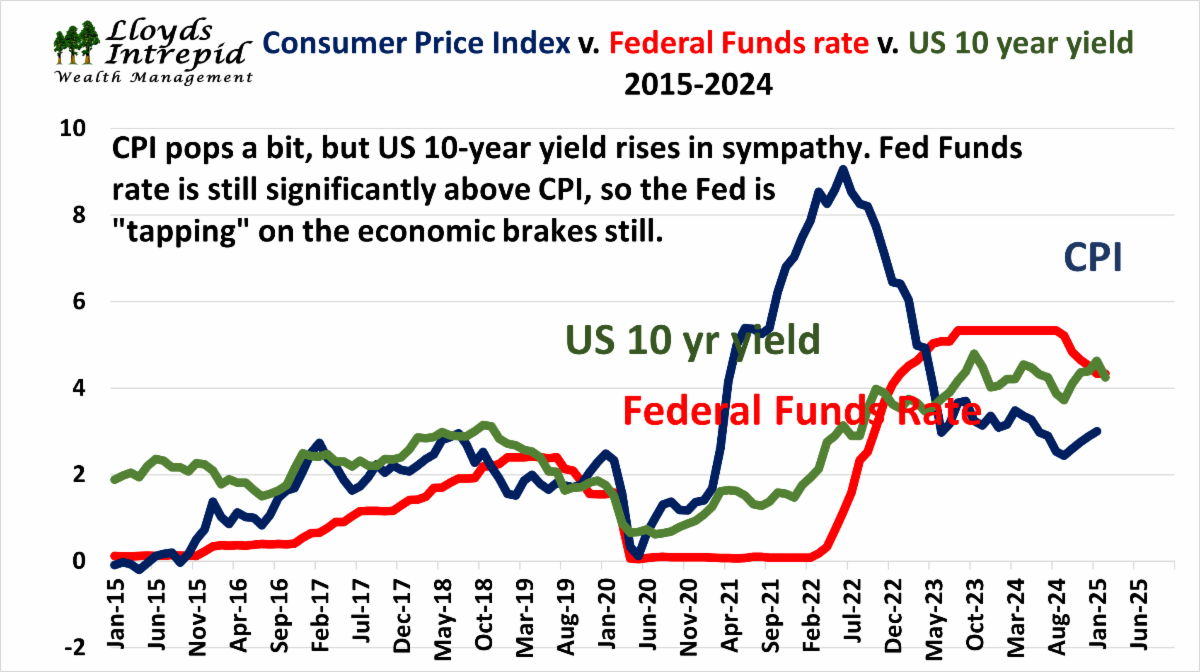
Inflation has stabilized, but at levels that are too high for comfort. Many investors want to see a return to the ultra-low interest rates of the 2010's, but this is unlikely in the current era of heavy government spending. The government also wants to see lower interest rates because that will lower the interest expense in the federal budget.
It is curious that the new Republican Congress has not proposed a reduction or restructuring of President Biden's large spending bills. These spending programs are one of the reasons inflation is high and deficits are out of control. Let's keep an eye on this.
Figure 5: Consumer Price Index, Federal Funds Rate, and US 10 year yield (LIWM)
| |
|
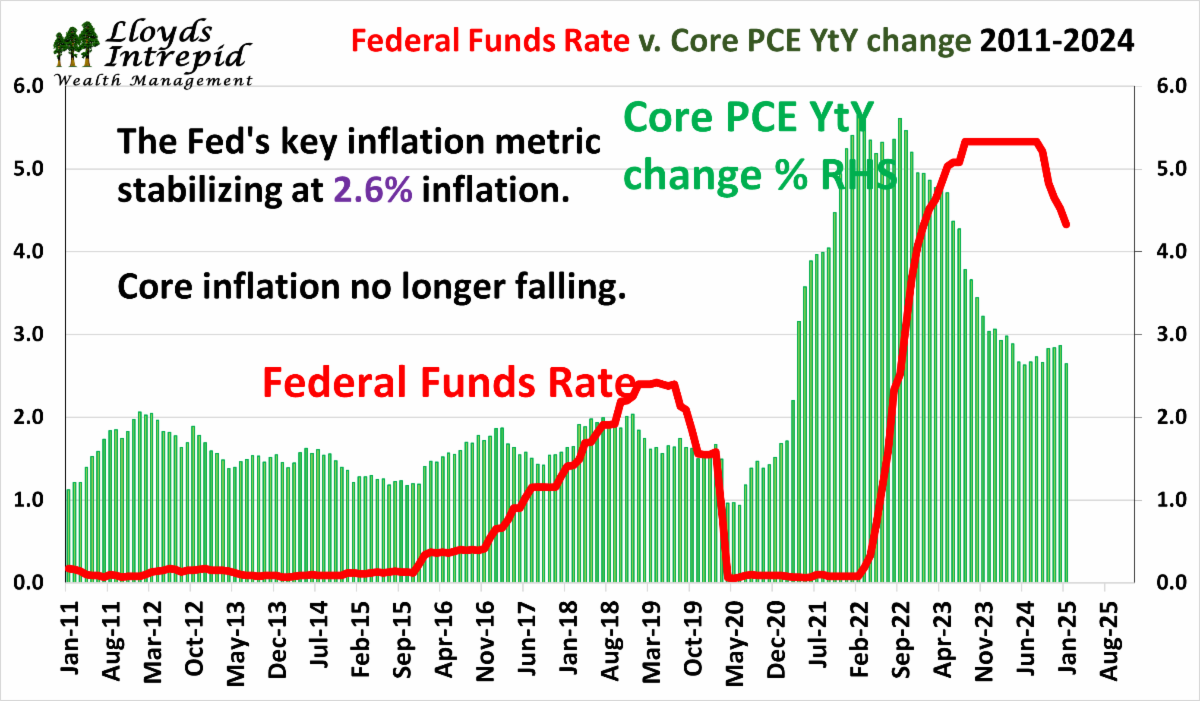
Core inflation is also subdued at 2.6%. These inflation readings are a relief compared to what we saw a few years ago. However, without a reduction in government spending it is likely we see inflation return when economic growth re-accelerates. Incidentally, tax cuts and "DOGE refunds" are also forms of government spending or stimulus in the sense that they stimulate growth and aggravate the budget deficit.
Figure 6: Federal Fund Rate v. Core PCE Inflation (LIWM)
| |
|
It is important to keep our inflation fears in line. Over the last six decades there have been huge swings in inflation as the economy cycled up and down. It is unlikely we return to the low inflation of the 2010's, but there is fear that Federal Reserve policy and Congressional spending will deliver us into a 1970's experience.
Table 3: Inflation by decade (LIWM)
| |
|
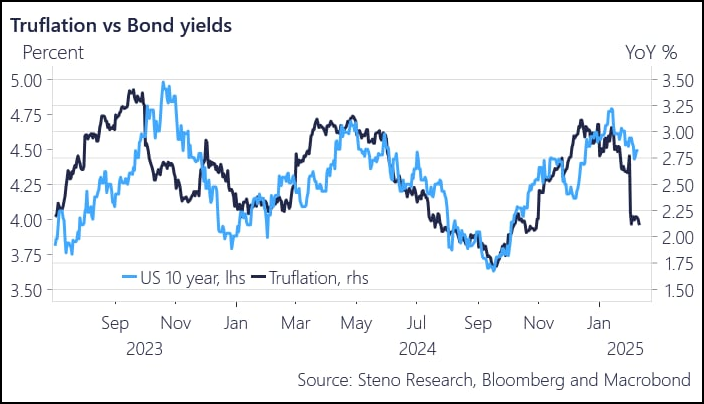
Finally, there are private sources of inflation data that predict an imminent fall in inflation. The Truflation index was created to track thousands of items on the internet to measure short term trends in inflation. As you can see below, this indicator hints that lower inflation numbers are just ahead of us in 2025.
Figure 7: Truflation v. Bond yields (Steno Research, Bloomberg)
| |
Interest rates are anything but stable | |
|
Interest rate movements continue to frustrate everyone: Federal Reserve policy makers, investors, home buyers and anyone trying to borrow money.
Short-term interest rates are high; long-term interest rates are even higher. There is a tug-of-war in the market over views that 1) government spending is out of control creating inflationary pressures, and 2) monetary tightening by the Federal Reserve will eventually slow the economy easing our problematic inflation.
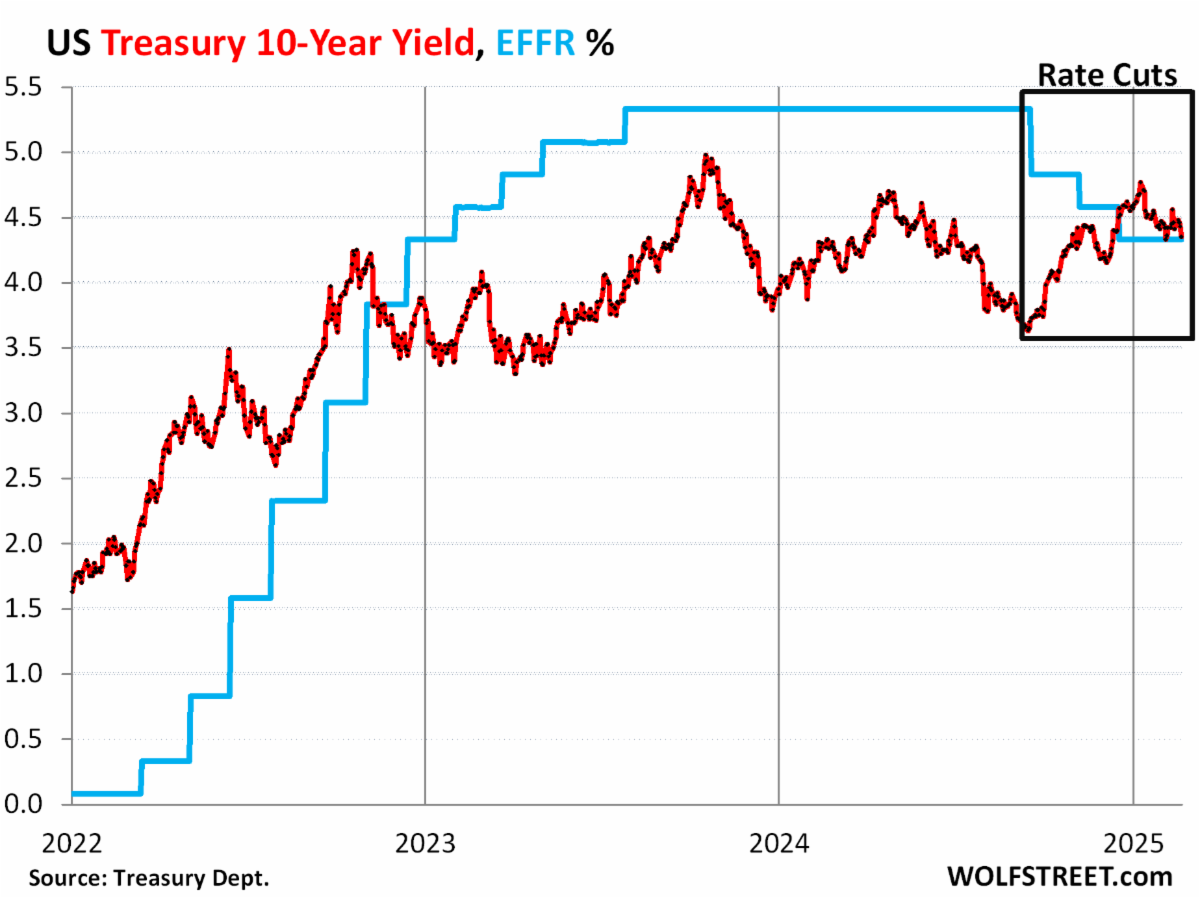
In late 2024, the Fed cut interest rates by 1.00%. The bond market promptly sold off, pushing up long-term interest rates by 1.00% The result: the Fed stopped cutting rates. Do you see how this works?
The bond markets gets a vote in how monetary policy is conducted. If the Fed mis-manages policy by promoting inflation, the bond market will drive up yields. This creates a problem for the government, because the Treasury department needs to borrow an additional $2 trillion this year to balance the books. This is on top of the $36 trillion in national debt that must be paid interest on the issued notes.
Figure 8: US Treasury 10-year yield, Effective Federal Funds Rate (Wolfstreet.com)
| |
|
The interaction of long-term and short-term interest drives lending behavior in the global markets. This is one of the reasons investors pay attention to central banks and monetary policy. Here is a quick summary:
- To PUSH UP growth: create LOW short-term rates, HIGH long-term rates
- To SLOW DOWN growth: create HIGH short-term rates, LOW long-term rates
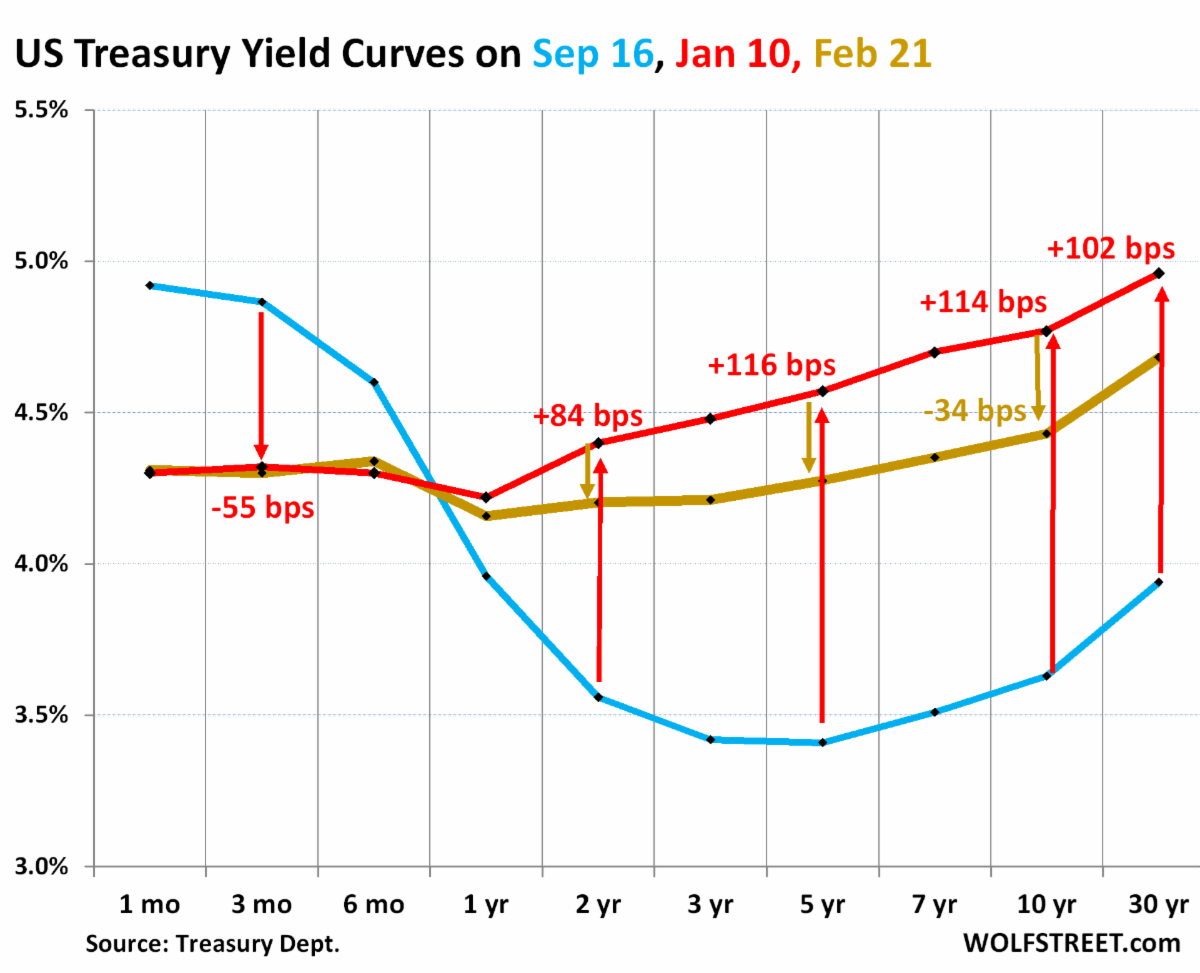
In the figure below, you can see interest rates at various time periods to help us picture the "yield curve". In September 2024 before the rate cuts, Fed policy was to SLOW DOWN growth. Now, with yield curve sloping upwards, Fed policy is to mildly PUSH UP growth.
Do you see why the bond market is getting worried about inflation, again?
Figure 9: US Treasury yield curves (Wolfstreet.com)
| |
|
Is there a way to compare today's environment to those of the inflationary 1970s? Yes, there is.
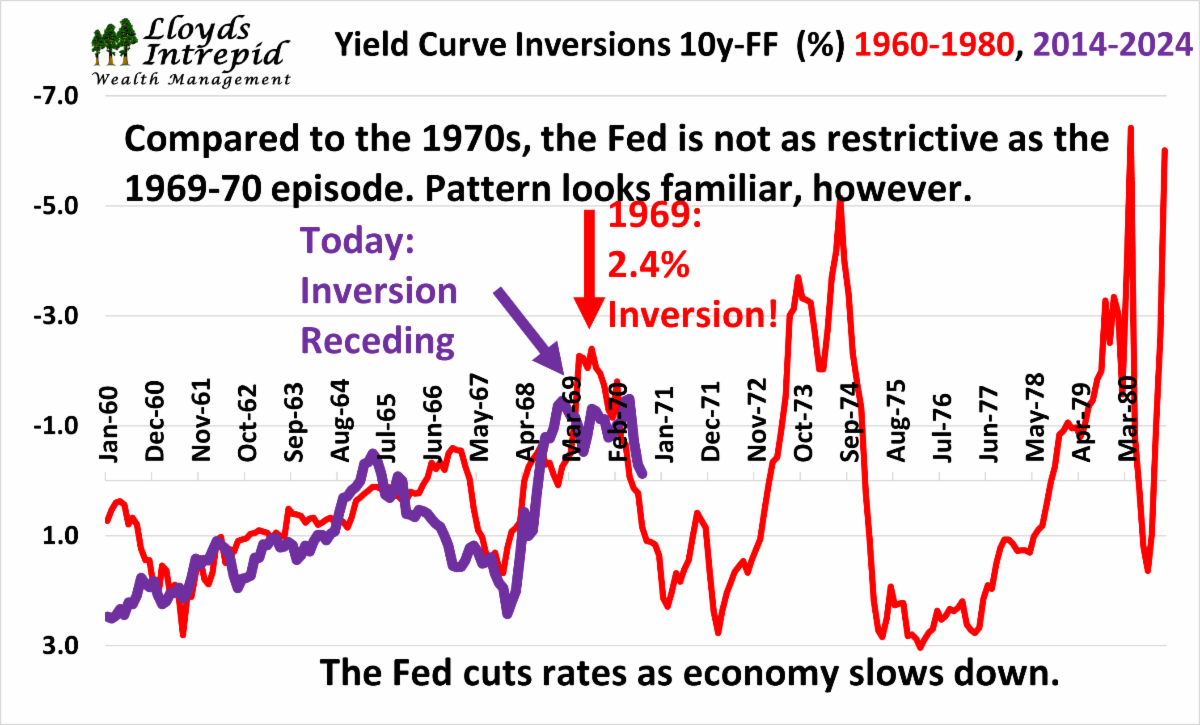
The next chart compares Fed policy during the 1970s with what we see today. The 1970s were a decade of high and volatile movements in inflation and interest rates. So far, we are tracking this period fairly closely. The relationship between the Federal Funds rate and the US 10-year yield over time are compared by overlying the two time periods. It is amazing how closely we are tracking that historical period.
The 1970s were a period of high government spending and a Federal Reserve reluctance to slow economic growth to preserve jobs. The problem with this combination of policies is that it created much higher inflation in the late 1970s and 1980s. There was no free lunch.
There are many similarities to the 1970s and today that inform our investment strategy. Similarly, the Fed has stated that they want to avoid a 1970s situation, however, politics play a significant role in what policy is approved.
| |
Figure 10: Comparing today's Fed policies with those of the 1970s (LIWM) | |
Are the markets at a turning point? | |
|
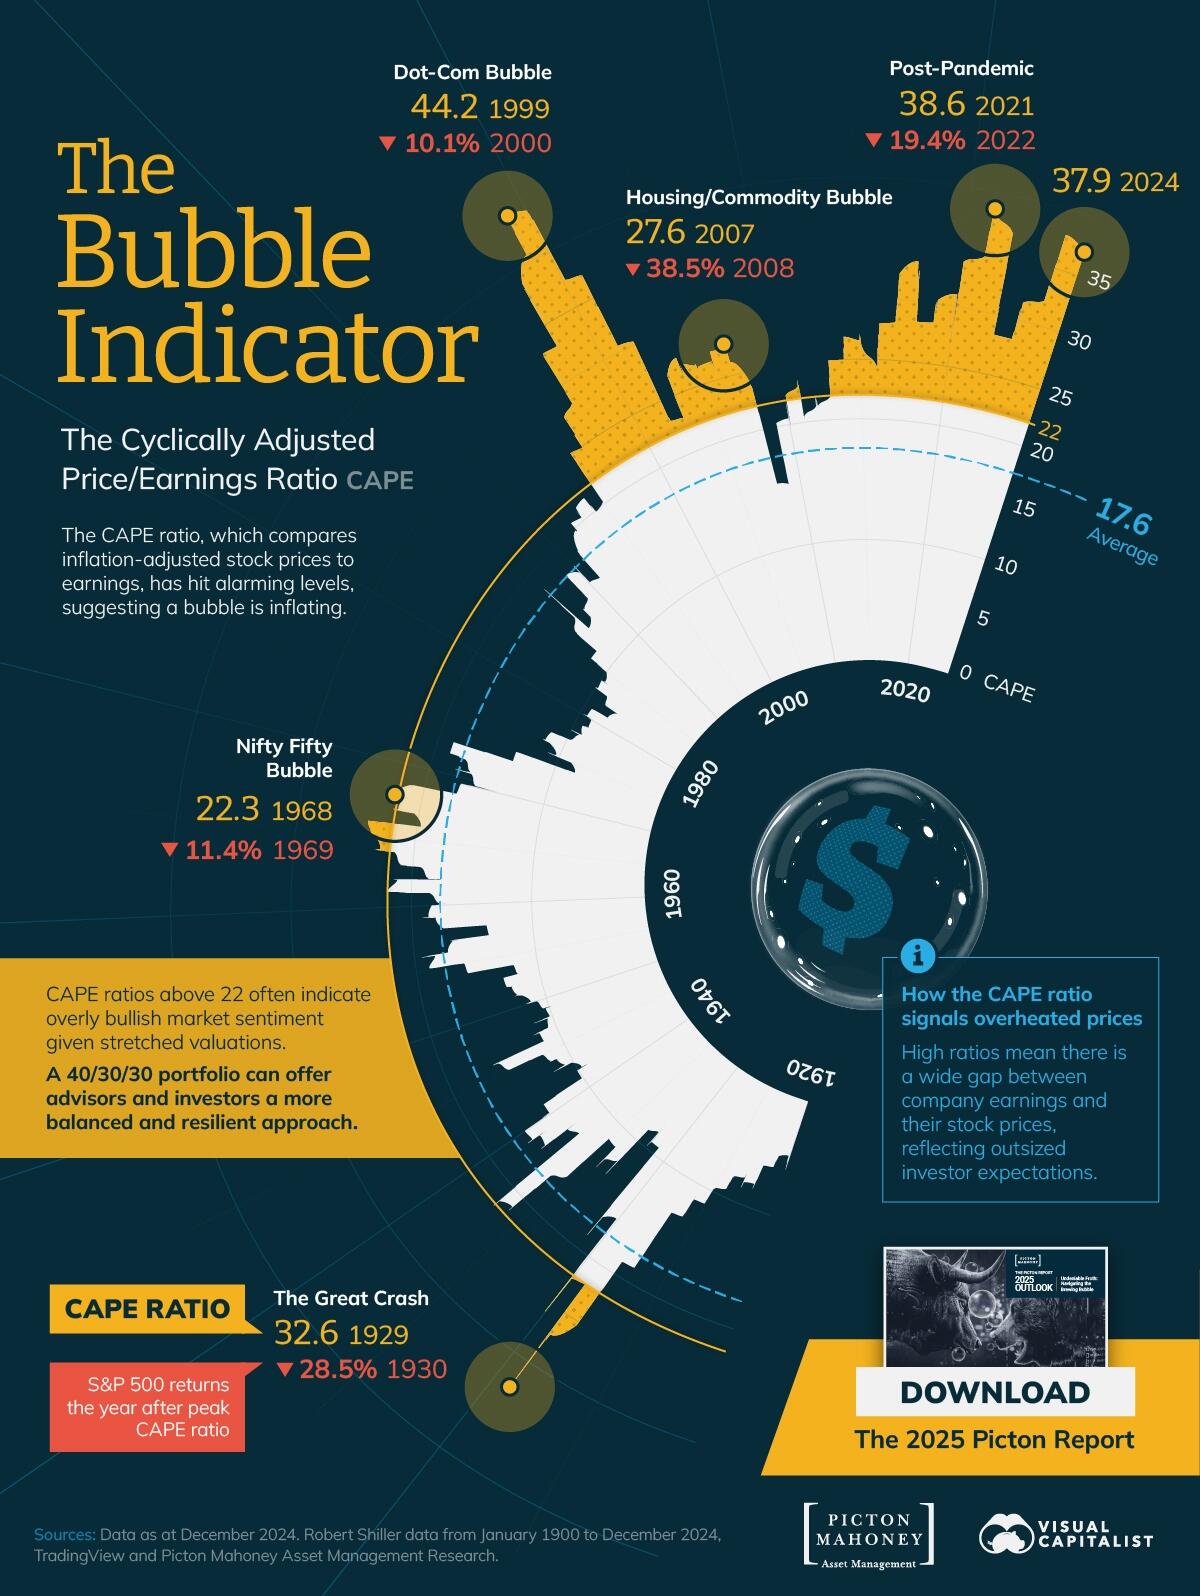
Charts can be fascinating, especially if they can take a boring topic like stock market valuation and put into a visually appealing format. The key takeaway on the next chart is that we are living through an historic stock market bubble; bigger than 1929 and 1971, but not at big as the 2000 bubble.
Bubbles are difficult to analyze because they are driven by behavior. The markets, despite all the technology utilized today, are still ultimately controlled by flesh and blood investors subject to those sins peculiar to investors; FEAR and GREED. As a bubble expands and GREED takes over the mentality of investors, many disciplines are abandoned to chase the hot new thing. Sadly, it is only in hindsight that many investors see the mistake in this.
There is no question we are in a bubble. However, when and how it ends are still unclear. Historically, the Fed has played a prominent role in bringing down every bubble.
Figure 11: The Bubble Indicator (Visual Capitalist)
| |
|
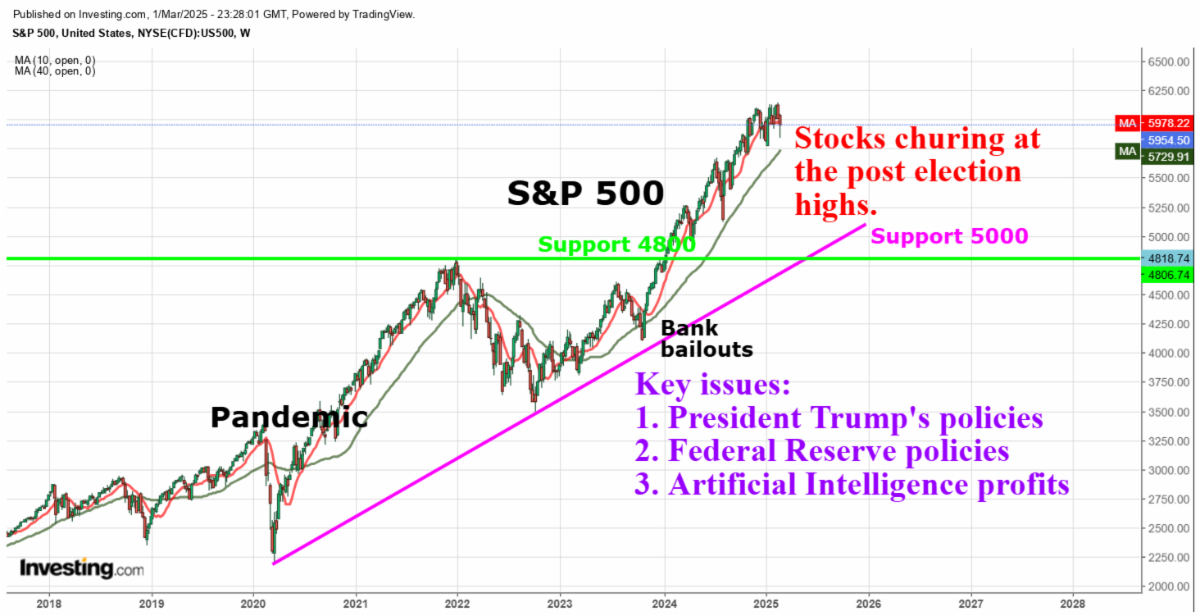
The stock market has been churning near its all-time highs for months now. Are our companies profitable? Yes. Is employment good? Yes. Are valuations high? Yes, sky high.
However, the stock market is a discounting mechanism that tries to look forward one or two years into the future to estimate earnings and economic health. Here are some key questions stock investors are trying to digest:
- Are President Trump's policies going to promote or slow growth?
- Tariffs
- Tax policy
- Regulation
- Will Federal Reserve policy promote or slow growth?
- Federal Funds rate
- Regulatory policy
- Bond market reaction
- Currency market reaction
- Will artificial intelligence change the world?
- Nvidia, Microsoft, and Google earnings depend on this
- Data analysis
- Self-driving cars
- Robots
There are other factors at work on stocks, but these are the big ones.
Figure 12: The S&P 500 (LIWM)
| |
|
The bond market recently passed an important test. After a deep sell-off following the Fed interest rate cuts, bond prices recently started moving up again on two key factors:
- Inflation data points remained subdued
- President Trump's audits may shrink the deficit as wasteful spending is cut
In the short-term, we are optimistic that bonds will be a safe haven while the President rolls out his spending and management plan. However, without a deliberate effort to curb spending by Congress, it is highly likely we fall into the 1970s trap of rising spending and the associated inflation.
Remember, it is not our job as investors to dictate policy or implement solutions, but to react to what we see and invest accordingly. For now, we are bullish on bonds, but this is dependent on circumstances and the facts on the ground.
Figure 15: Broad bond benchmark (LIWM)
| |
|
If you found this research report informative, would you please help us by leaving a review? The State of Texas recently changed their rules allowing us to collect testimonials from the families we serve. Online reviews are used by people to conduct due diligence and evaluate the advisers they do business with. Think about the reviews you have viewed when shopping for some item. A good review will help us grow our business. Thank you in advance for your support!
Please leave us a review here!
As always, we welcome your feedback and are happy to discuss our research or your situation.
| |
|
Rob 281-402-8284
Chris 281-547-7542
| |
|
Christopher Lloyd, CFP ®
Vice President and Senior Wealth Planner
Lloyds Intrepid Wealth Management
1330 Lake Robbins Dr., Suite 560
The Woodlands, TX 77380
281-547-7542
Chris.Lloyd@lloydsintrepid.com
www.lloydsintrepid.com
| Lloyds Intrepid LLC is an Investment Advisor registered with the State of Texas, where it is doing business as Lloyds Intrepid Wealth Management. All views, expressions, and opinions included in this communication are subject to change. This communication is not intended as an offer or solicitation to buy, hold or sell any financial instrument or investment advisory services. Any information provided has been obtained from sources considered reliable, but we do not guarantee the accuracy, or the completeness of, any description of securities, markets or developments mentioned. We may, from time to time, have a position in the securities mentioned and may execute transactions that may not be consistent with this communication's conclusions. Please contact us at 281.886.3039 if there is any change in your financial situation, needs, goals or objectives, or if you wish to initiate any restrictions on the management of the account or modify existing restrictions. Additionally, we recommend you compare any account reports from Lloyds Intrepid LLC with the account statements from your Custodian. Please notify us if you do not receive statements from your Custodian on at least a quarterly basis. Our current disclosure brochure, Form ADV Part 2, is available for your review upon request, and on our website, www.LloydsIntrepid.com. This disclosure brochure, or a summary of material changes made, is also provided to our clients on an annual basis. | | | | |