|
Gordon T Long Research exclusively distributed at MATASII.com
Subscribe to Gordon T Long Research - $35 / Month - LINK
Complete MATASII.com Offerings - $55/Month - LINK
SEND YOUR INSIGHTFUL COMMENTS - WE READ THEM ALL - lcmgroupe2@comcast.net
| |
|
CURRENT MARKET PERSPECTIVE
NOTE: You Are Missing our Subscriber Mid-Week Update - You Are working with only half the info!
| |
|
CPI, PPI & BANKS ALL COME IN HOT
MARKETS SURGE ON RISING YIELDS, DOLLAR & VIX???
Click All Charts to Enlarge
|  | |
EXCESS LIQUIDITY & LOOSE FINANCIAL CONDITIONS INDEX: This weekend represents the two year anniversary from the bear market lows. The S&P is up 66% from the lows in October 2021, helped by an endless supply of liquidity from global central planners. Friday saw the 45th all-time-high of the year, but none of the prior 44 have occurred alongside this elevated level of volatility. This will be the first week of the year where the VIX has closed above 20 every day, while yields and the dollar rose.
NOTE: The above chart is a "Proxy". It works well in identifying trends. Short term moves have to be viewed carefully as a trend in change. The red circle in fact is such an incidence. Tomorrow's Newsletter will show a more accurate picture, which illustrates Global Liquidity just hit a historic high of $107 Trillion.
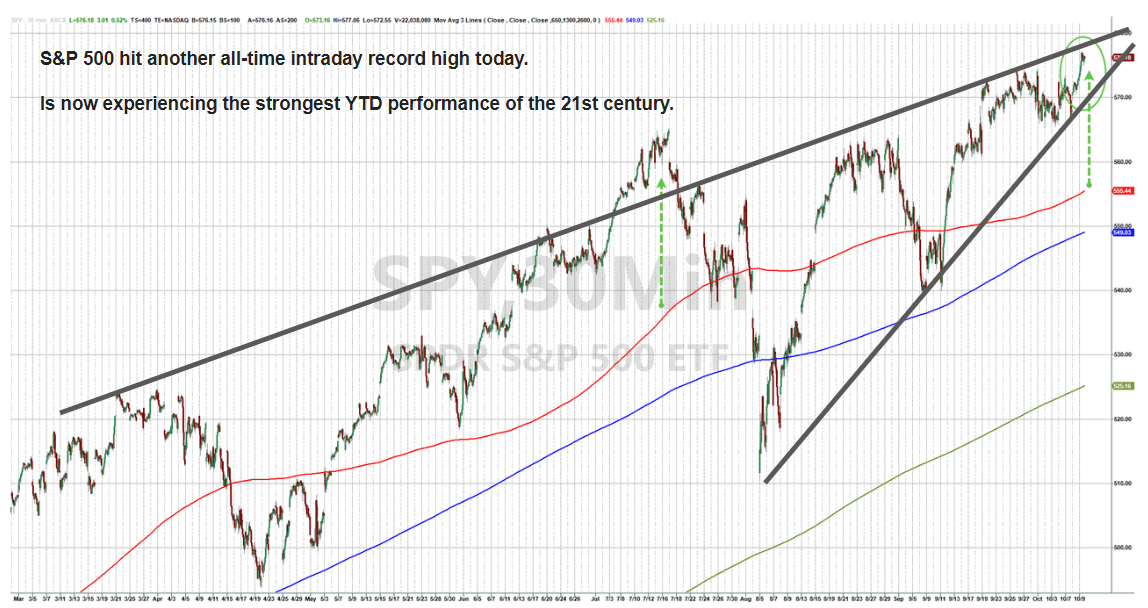
QUESTION: So what is up when the S&P 500 hits yet another all-time intraday record high and is now experiencing the strongest YTD performance of the 21st century?
ANSWER: EXCESS GLOBAL LIQUIDITY & EXTREMELY LOOSE FINANCIAL CONDITIONS.
BUT WHY?:SOMETHING IS SERIOUSLY WRONG SOMEWHERE (CHINA?) AND THE CENTRAL BANKS KNOW IT!
| |
|
SENTIMENT
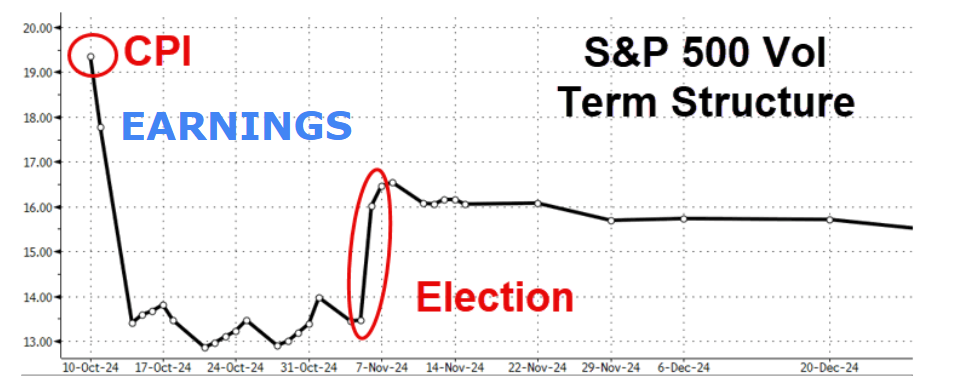
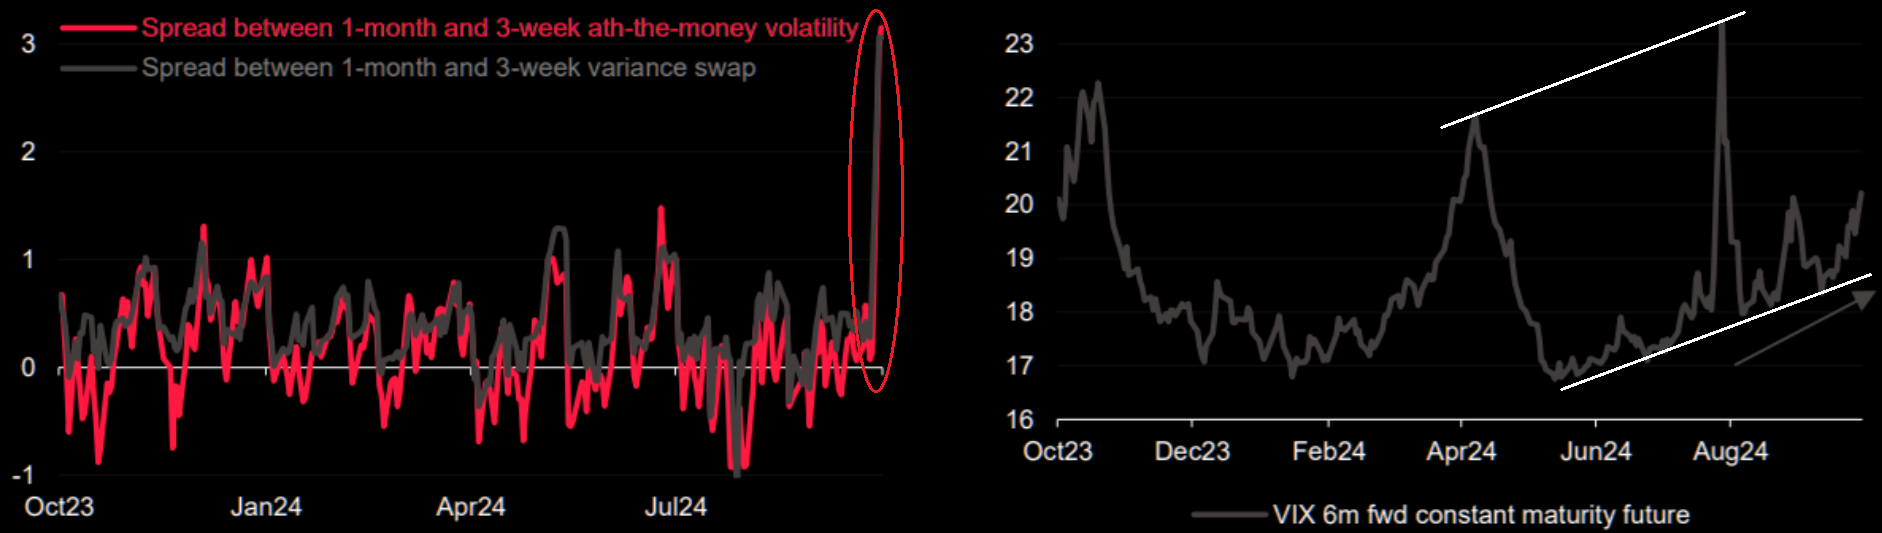
The S&P 500 Volatility Term Structure additionally echos some significant short term concerns (chart right) about the upcoming Q3 Earnings Season.
Bond volatility (MOVE Index) is riising; which is lifting Equity Volatility (VIX); which is pushing the change in Volatility (VVIX). These all make options and hedging more expensive (chart).
THERE ARE NO BEARS LEFT!
Almost Everyone Is Now On The Same Side Of The Boat.
| |
|
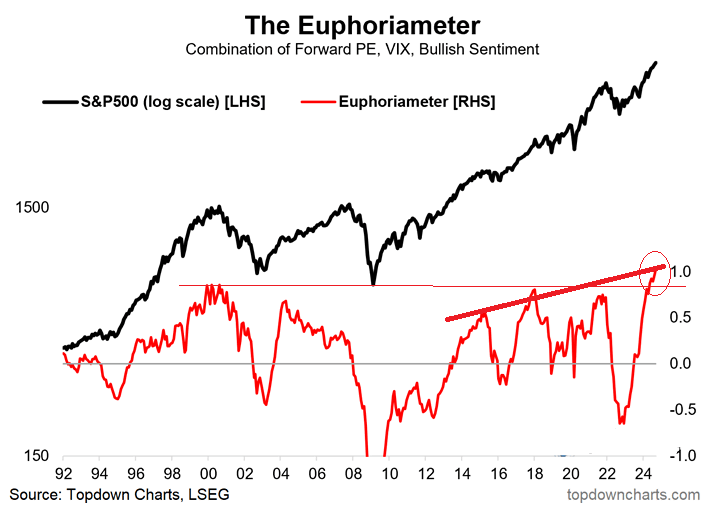
Meanwhile, now that everyone is onboard the equity train (see last week's report's detail), the Bullish sentiment among investors in the U.S. stock market continues to be strong, hitting new all-time highs as measured by the "Euphoria Meter".
The Euphoria Meter measures: a combination of:
- Forward PE
- VIX
- Bullish Sentiment
CHART BELOW
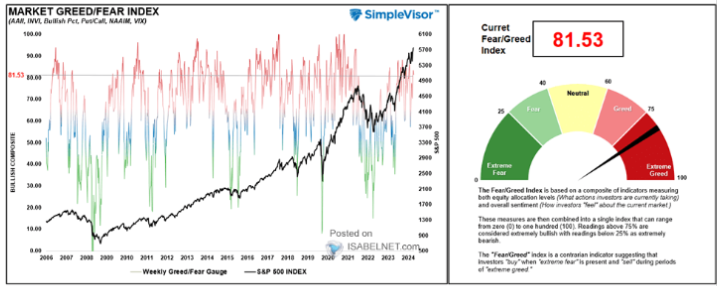
Greed/Fear index continues to stay elevated!
| |
|
SEASONALITY - IF IT REPEATS WITH THIS AMOUNT OF "EXCESS LIQUIDITY"?
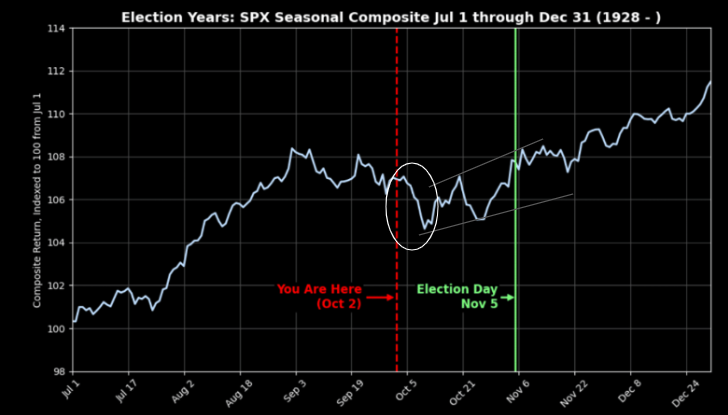
CHART RIGHT: SPX - The historical election performance of the SPX suggests our expected near term corrective / consolidation is likely with a follow on Year End stock run-up.
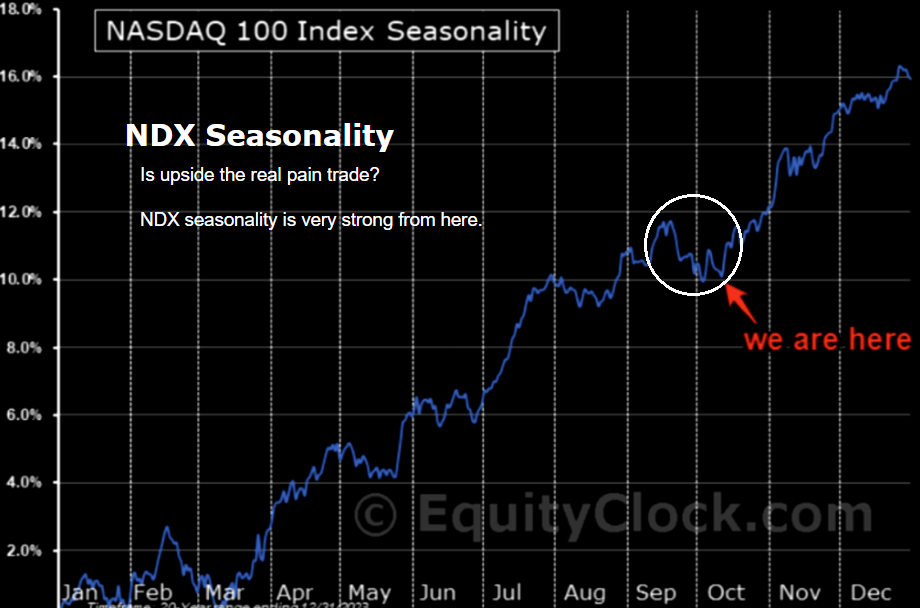
CHART LOWER RIGHT:The NDX seasonality has a similar but slightly different performance profile.
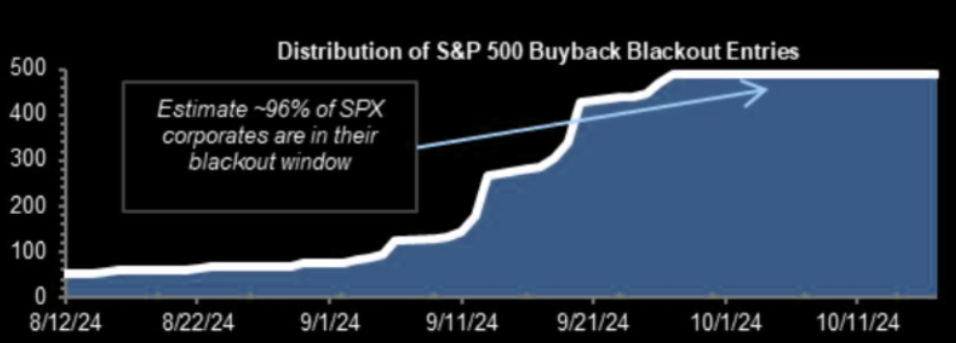
CHART BELOW: 96% of stocks are now in their blackout window.
| |
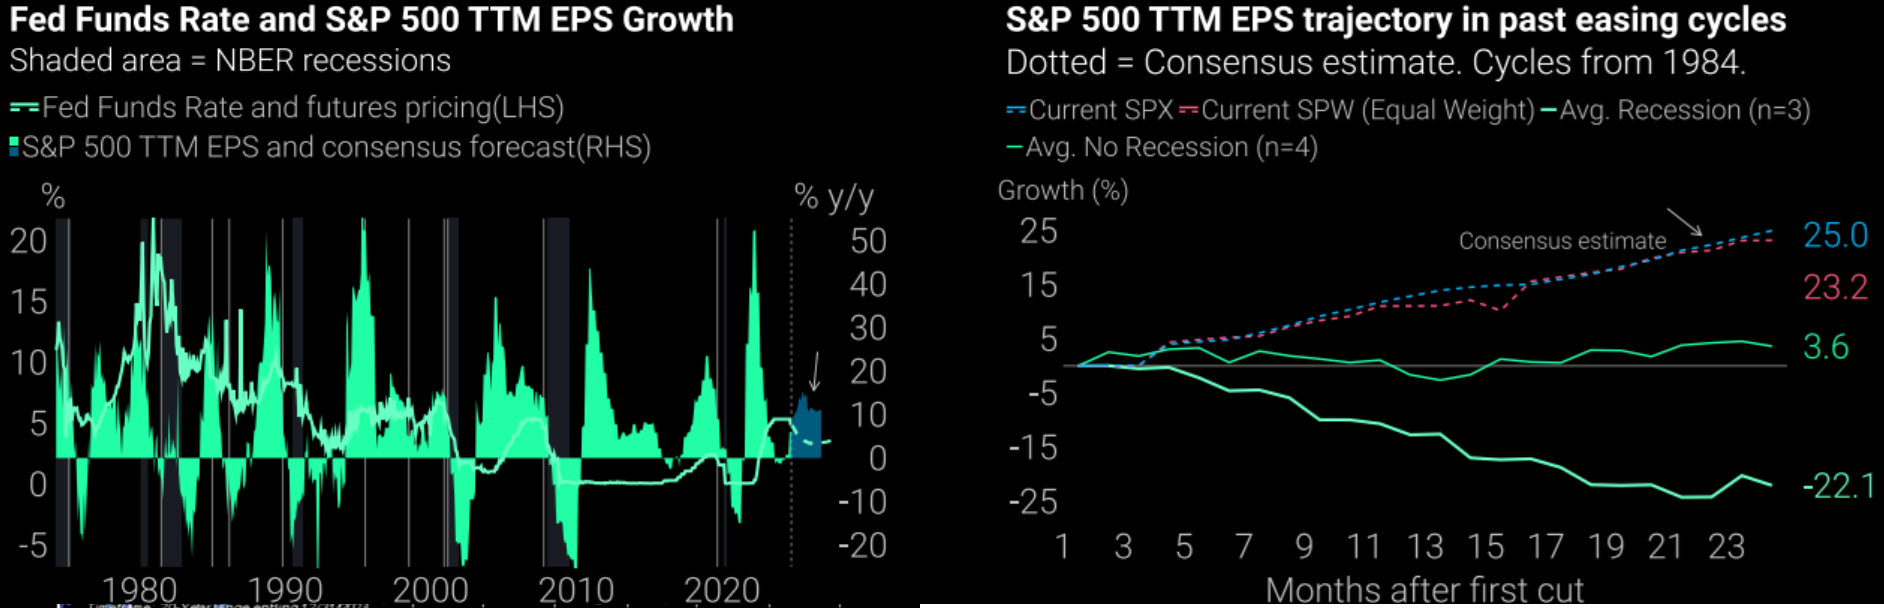
CHART BELOW: Risk On Mix
Above trend growth in the US, rising EPS and rate cuts are an attractive mix for risk assets, despite high valuations.
"Fed cutting into strong EPS recovery is bullish... EPS trajectory stronger than in past soft landings".
T.S. Lombard
| |
|
|
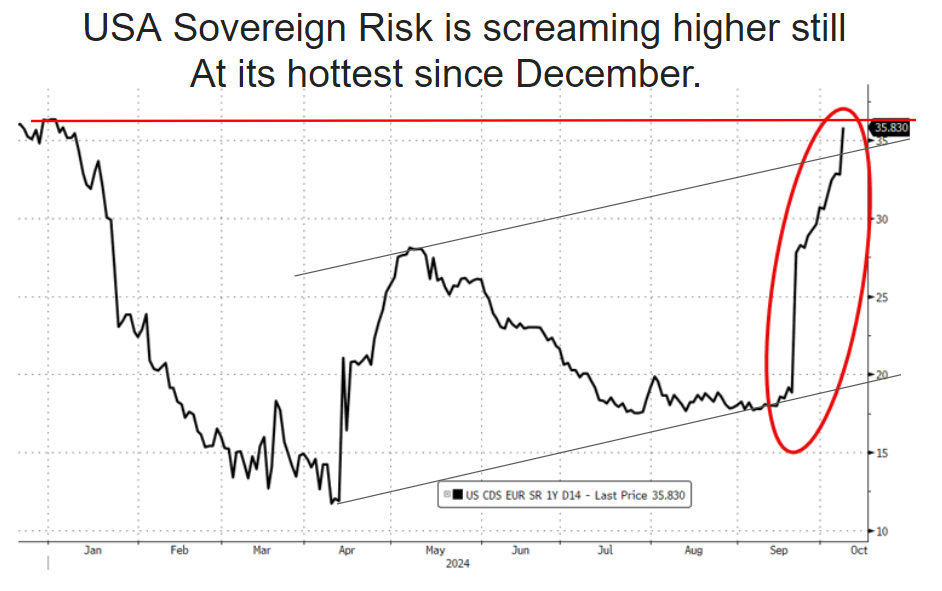
A FLIGHT TO SAFETY UNDERWAY? Bond Yields and the US$ just continue to rise!. Normally when yields rise and the dollar surges, (especially when both occur together), it weighs on equities since a stronger dollar makes US equities more expensive while higher yields are neither good for earnings nor evaluations.
Something is scaring the markets behind the scene as shown by 1 Year Credit Default Swaps (CDS)!
CHART RIGHT
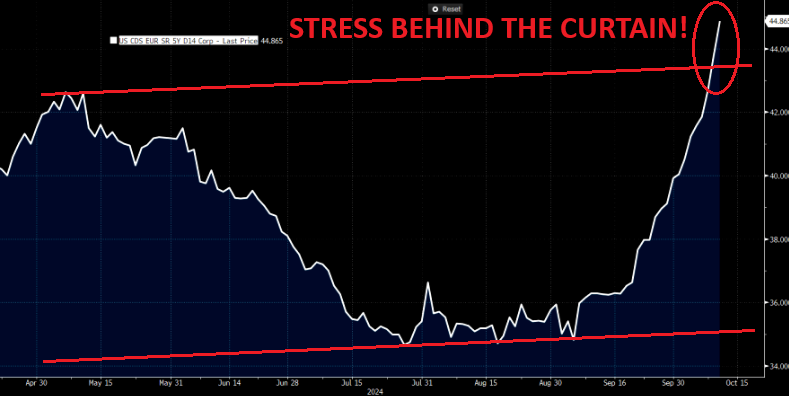
... and the US 5 Year Credit Default Swap (CDS).
CHART BELOW: Some of this has to do with the US elections, but even longer dated tenors have picked up substantially. GS notes that this will be the first week of the year where the VIX has closed above 20 every day.
| |
|
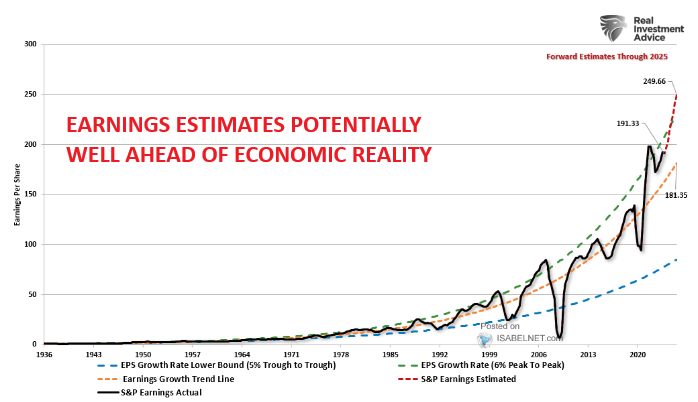
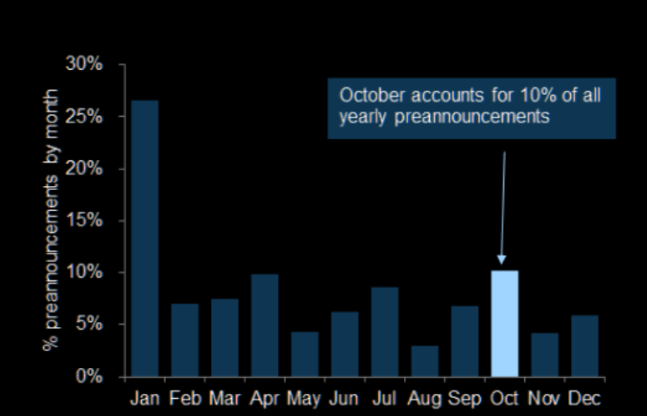
The projected earnings growth for 2025 exceeds historical norms, indicating a sense of optimism. However, there are potential risks if these estimates are not met.
REAL STOCK MARKET RISK in this earnings season the disappoint is likely to be negative earnings surprises.
CHART RIGHT: October accounts for 10% of all yearly preannouncements. This is the earning season where companies announce that their Year end "Hockey Stick" will disappoint.
This is also the season where any weakness seen in 2025 is taken out of the forecast by CEOs.
| |
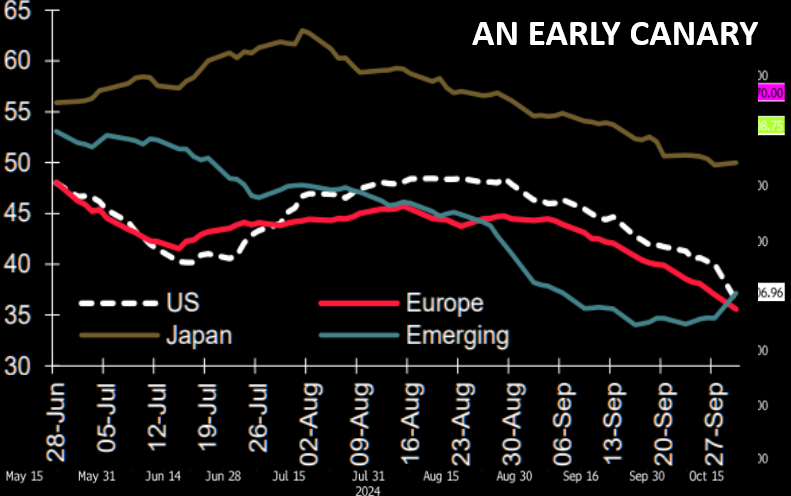
EARNINGS MOMENTUM: This low is concerning for the Intermediate outlook. It is an early Canary for 2025, since it has been extraordinary Earnings Growth (along with Corporate Buybacks) that has ben propelling the equity market. | |
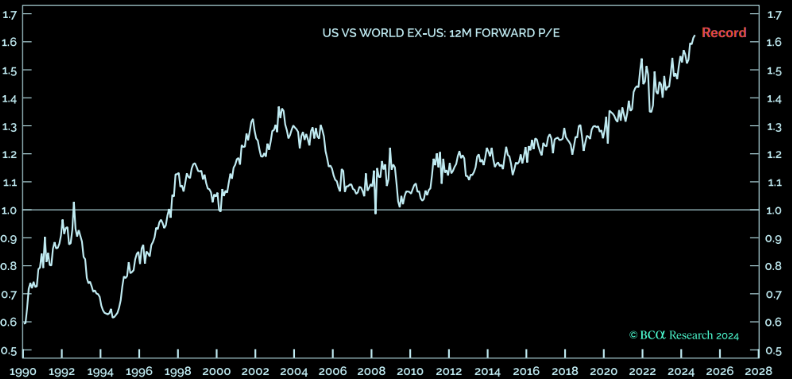
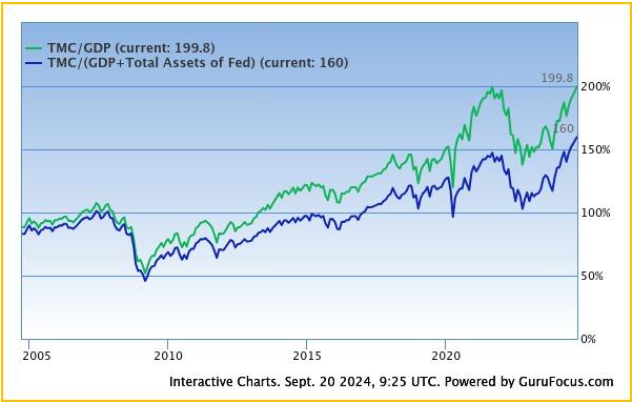
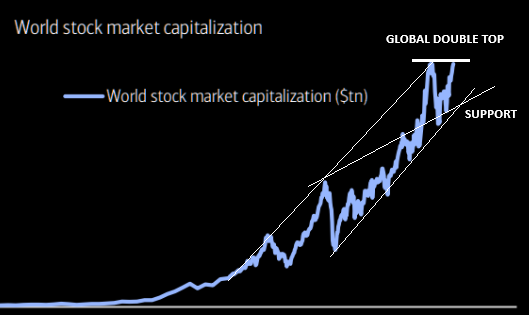
Stocks have NEVER been more expensive relative to the economy.
Total US market cap back up to 200% of GDP.
"43% of S&P 500 market cap now under FTC/DoJ antitrust investigation".
| |
|
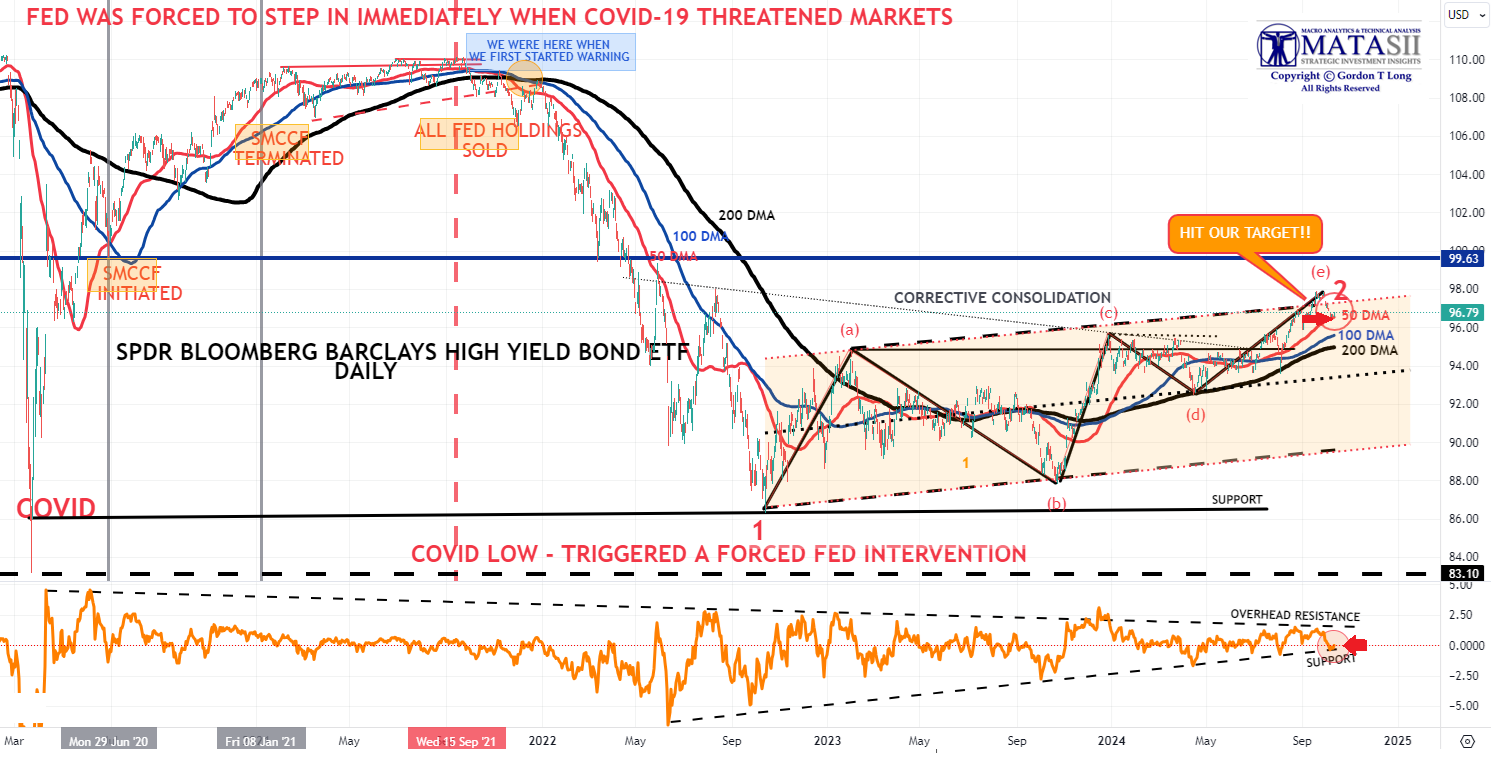
CREDIT ALWAYS LEADS! - We Have Our Target Met
HY Credit, as represented by the Bloombergs High Yield Bond ETF (JNK), has reached our target. All indications are that the corrective consolidation wave since Covid (and the buying at the time of Corporate Bonds by the Fed) have now ended.
With the Fed initiating the process of lowering the Fed Funds Rate, we should soon expect HY spreads to begin widening to reflect the reason the Fed is lowering rates - a concern for slowing economic growth, potential increasing unemployment levels and the longer term impact of elevated rates hitting! All this leads credence to a Recession being ahead of whatever degree (soft or hard)?
| |
|
YOUR DESKTOP / TABLET / PHONE ANNOTATED CHART
Macro Analytics Chart Above: SUBSCRIBER LINK
| |
|
2 - TECHNICAL ANALYSIS.
WE ARE VERY CLOSE TO A POTENTIAL MINOR CORRECTIVE / CONSOLIDATION
BEFORE A YEAR-END STOCK RUN-UP.
| |
|
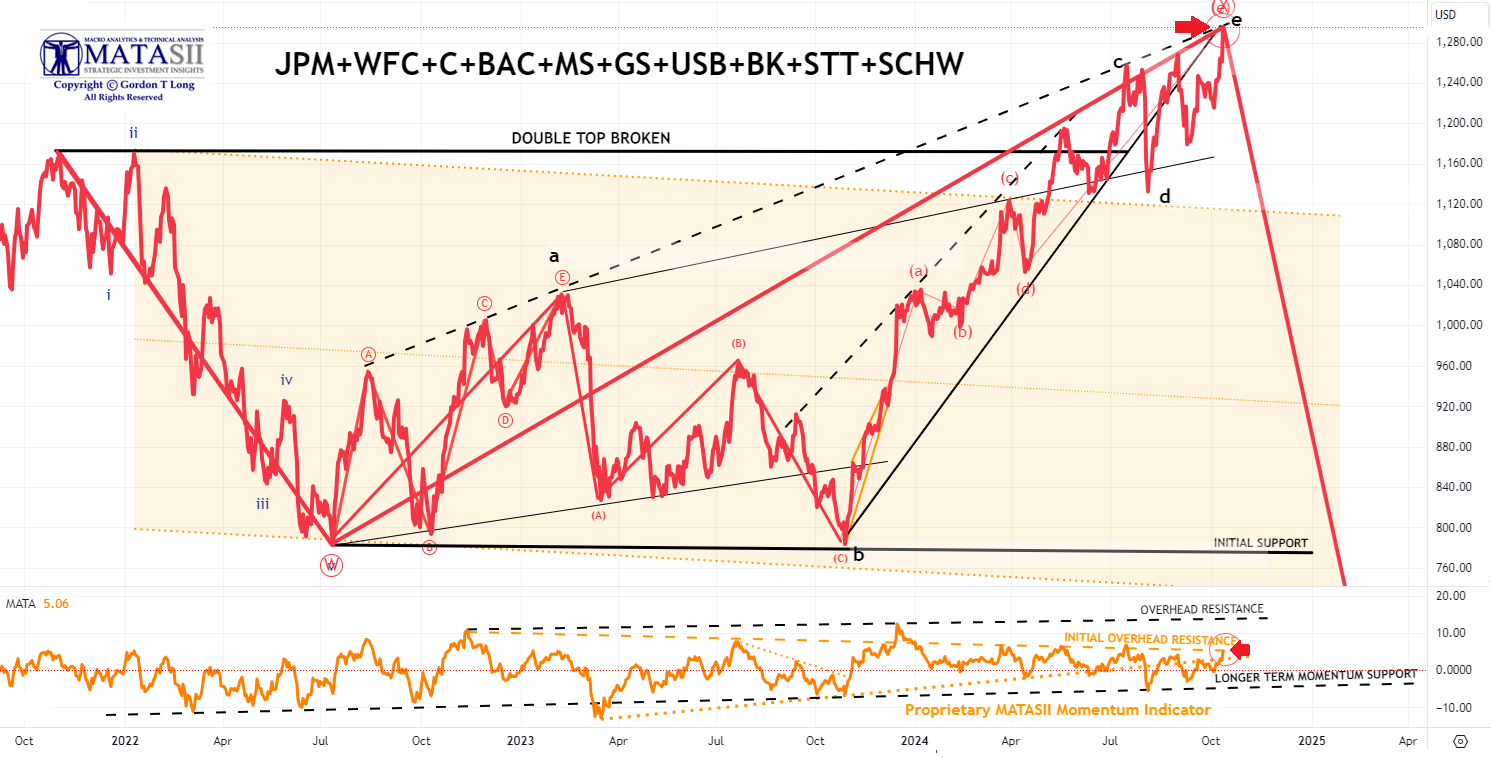
THE MATASII BANK INDEX
- The MATASII Bank Index surged on Q3 Banking results for earnings from JPM (JPM), Wells Fargo (WFC) and Mellon Bank (BK).
- The MATASII Proprietary Momentum Indicator has reached an initial overhead resistance trend line, but is below a higher overhead resistance level (dashed black line), which banks may see if bank earnings continue to report strong results!
| |
|
YOUR DESKTOP / TABLET / PHONE ANNOTATED CHART
Macro Analytics Chart Above: SUBSCRIBER LINK
| |
|
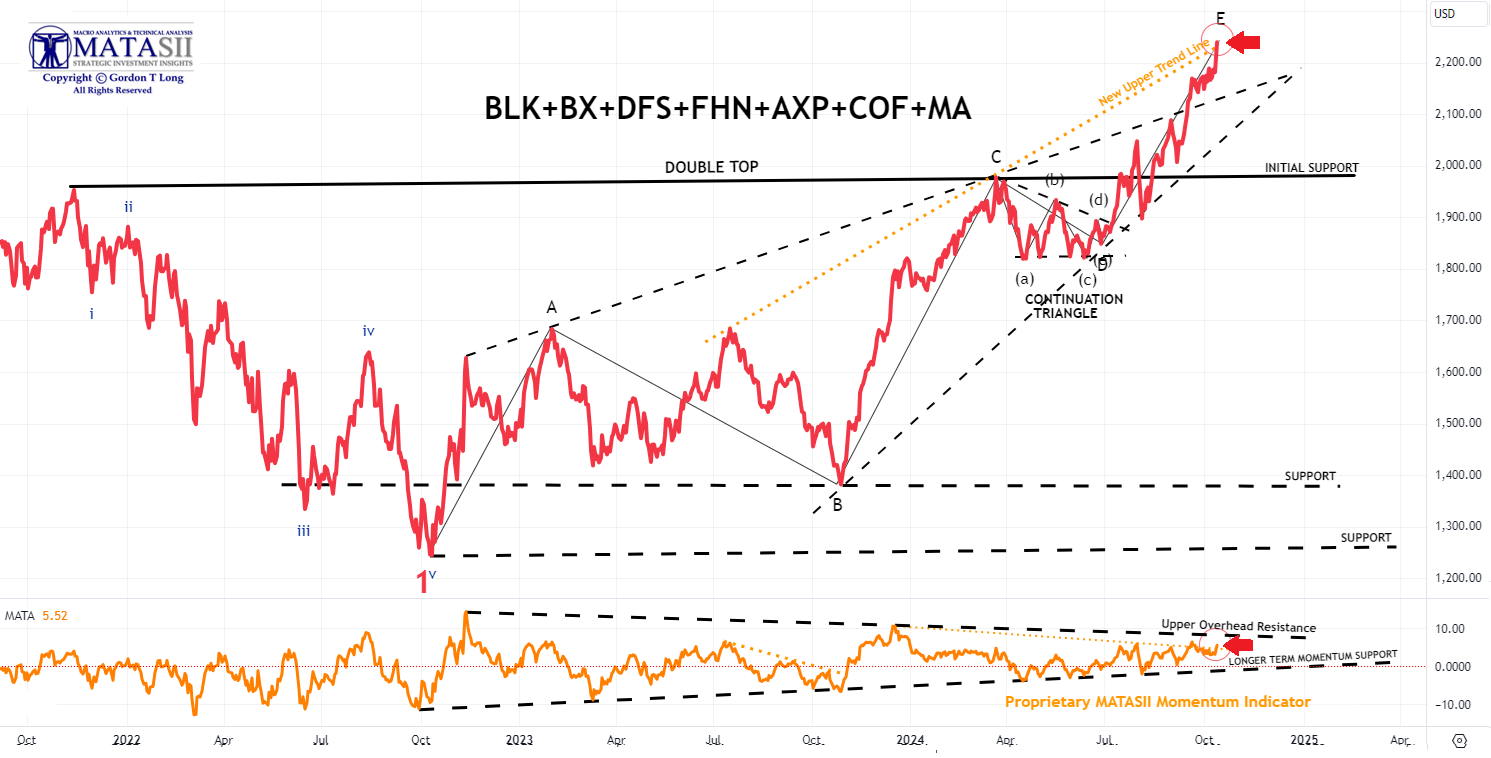
THE MATASII FINANCIAL INDEX
- The MATASII Financial Index surged to new highs with the earnings report of Blackrock (BLK), which surpassed expectations on the top and bottom line while reporting a record high AUM and a quarterly record for net inflows.
- The MATASII Proprietary Momentum Indicator, pushed through an initial overhead resistance trend line and appears to now be stretching for an upper trend line (dashed black line), if reported earnings for financials continues to be strong.
| |
|
YOUR DESKTOP / TABLET / PHONE ANNOTATED CHART
Macro Analytics Chart Above: SUBSCRIBER LINK
| |
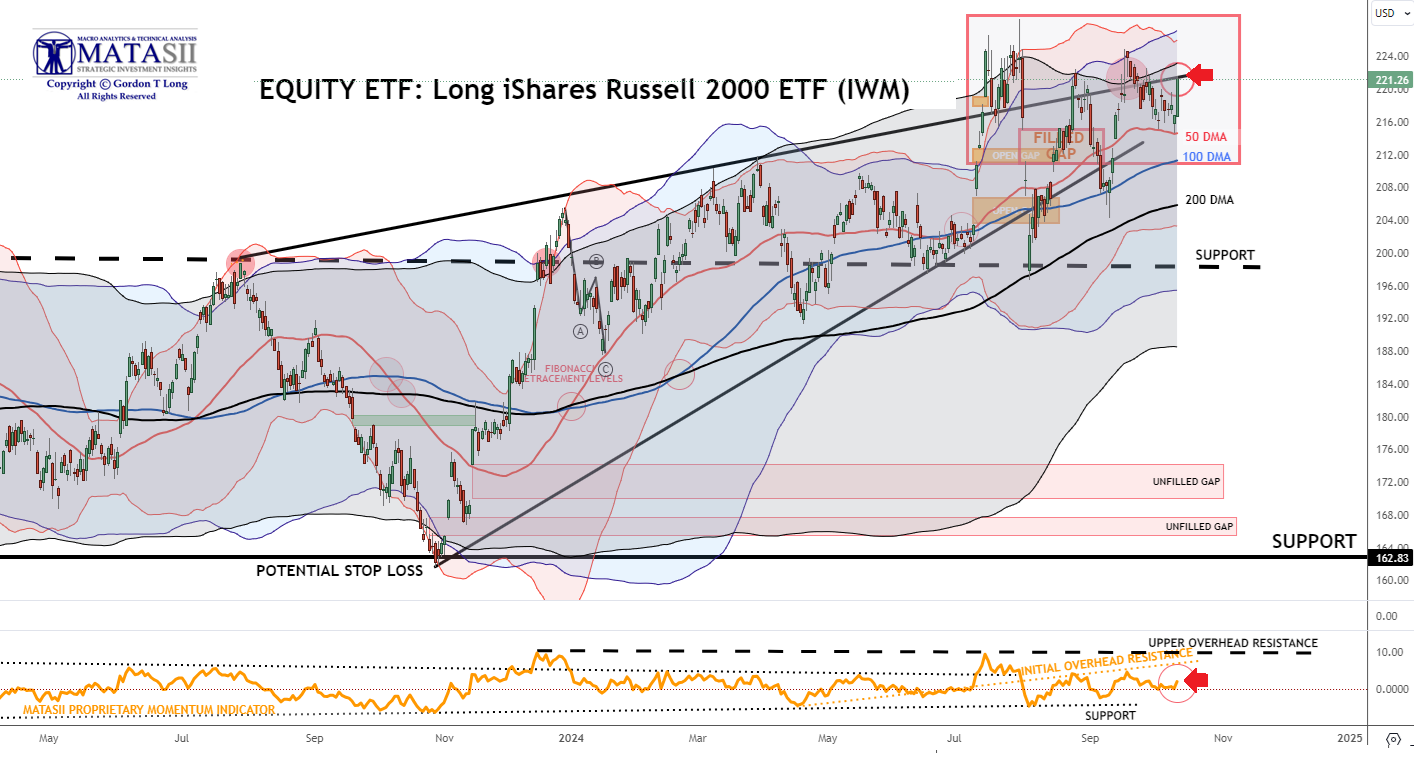
IWM - LONG iShare Russell 2000 ETF - Daily
- The IWM - LONG iShare Russell 2000 ETF exploded higher on Friday with the Russell 2000 notching a 2.1% increase.
- The IWM reached its upper rising wedge trend channel (sold black line).
| |
|
YOUR DESKTOP / TABLET / PHONE ANNOTATED CHART
Macro Analytics Chart Above: SUBSCRIBER LINK
| |
|
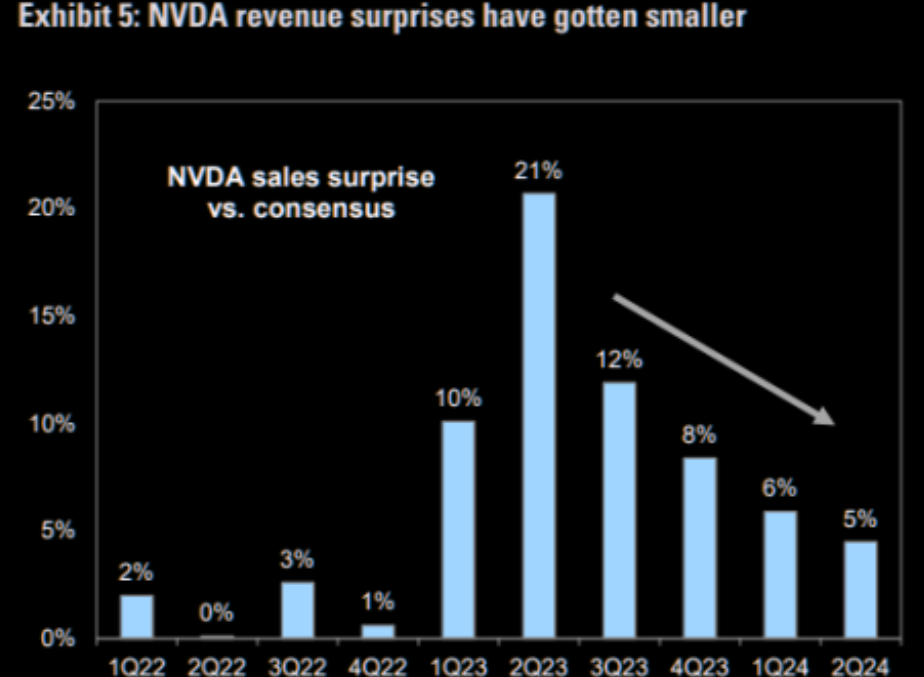
CHART RIGHT: The Phase 2 trading of Nvidia will mature as earnings growth, rather than valuation expansion, driving prices higher.
Today's Note:
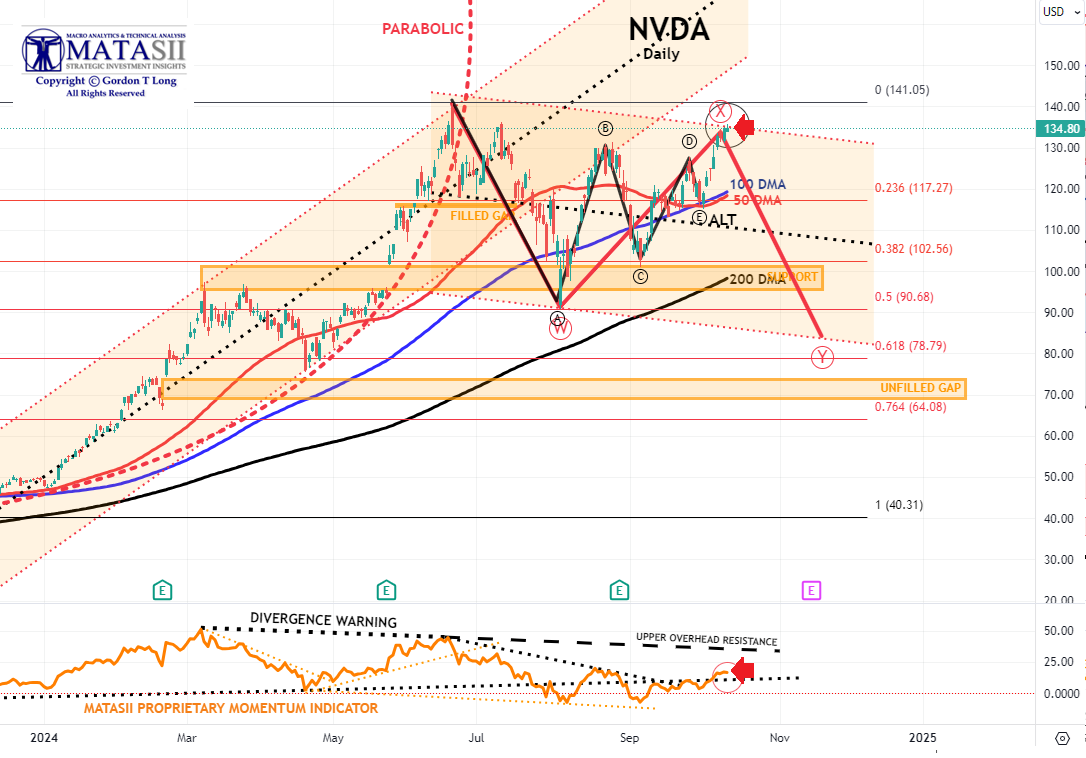
- NVDA has strengthened this week with an announcement of a significant new order. The stock surged on the announcement and pushed its upper channel boundary higher.
- We now have an ALTERNATIVE ABCDE Corrective count (shown in black), which suggests the possibility of a significant breakout higher in Nvidia.
- The 50 DMA appears about to cross above the 100 DMA - a Bullish signal.
- Meanwhile the MATASII Proprietary Momentum Indicator (lower panel) has nothing its way until it reaches the upper overhead resistance level (dotted black lines).
Longer Term Note:
- The MATASII Proprietary Momentum Indicator (lower pane below) has been signaling that this sell-down was coming for some time now.
- Divergence is normally seen as a warning to the downside and is still ahead if the Divergence isn't removed by a movement higher in Momentum.
- At some point, the major unfilled gaps (at much lower levels) must be filled. We anticipate a likely test of the 200 DMA in Q4.
- NVDA therefore may no longer become a Short to Intermediate Long Term hold, but rather a position trading stock, as other competitors enter the space, force margins and the earnings growth rate contracts.
| |
|
YOUR DESKTOP / TABLET / PHONE ANNOTATED CHART
Macro Analytics Chart Above: SUBSCRIBER LINK
| |
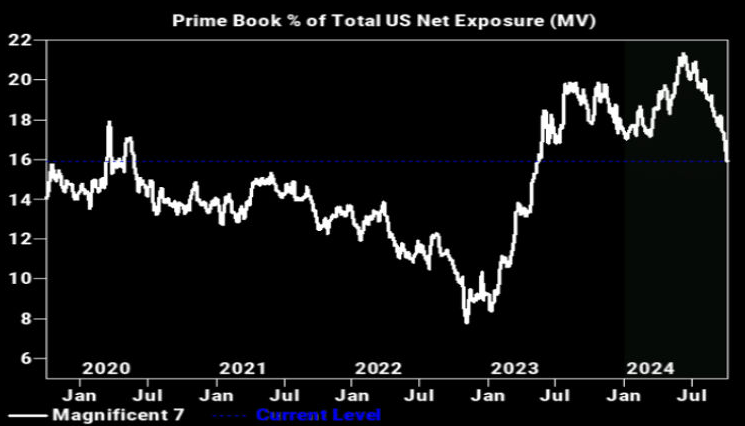
CHART RIGHT: The Hedge Fund Positioning in Mag7 now lowest since May 2023. Mega cap Tech stocks (Mag7) were collectively net sold for a 9th straight week (12 of the last 13). Net length is now at the lowest level since May ‘23.
CONTROL PACKAGE
- APPLE - AAPL - DAILY (CHART LINK)
- AMAZON - AMZN - DAILY (CHART LINK)
- META - META - DAILY (CHART LINK)
- GOOGLE - GOOG - DAILY (CHART LINK)
- NVIDIA - NVDA - DAILY (CHART LINK)
- MICROSOFT - MSFT - DAILY (CHART LINK)
- TESLA - TSLA - DAILY (CHART LINK)
AS GOES NVDA SO GOES THE MAG-7
AS GOES THE MAG-7 SO GOES THE MARKET!
| |
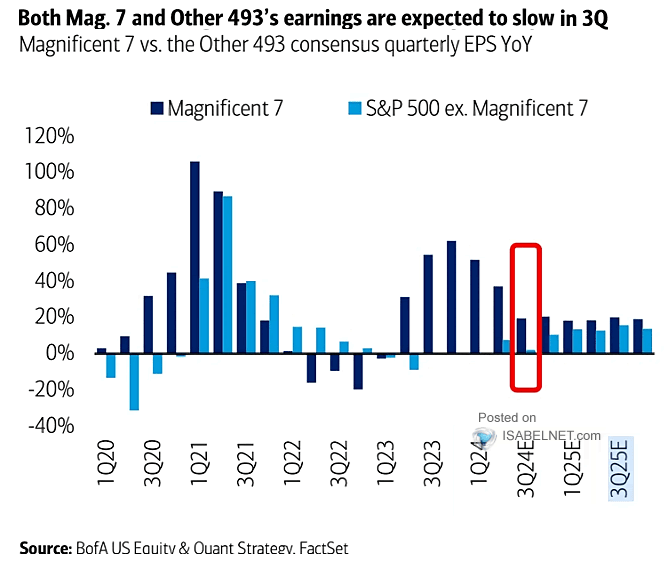
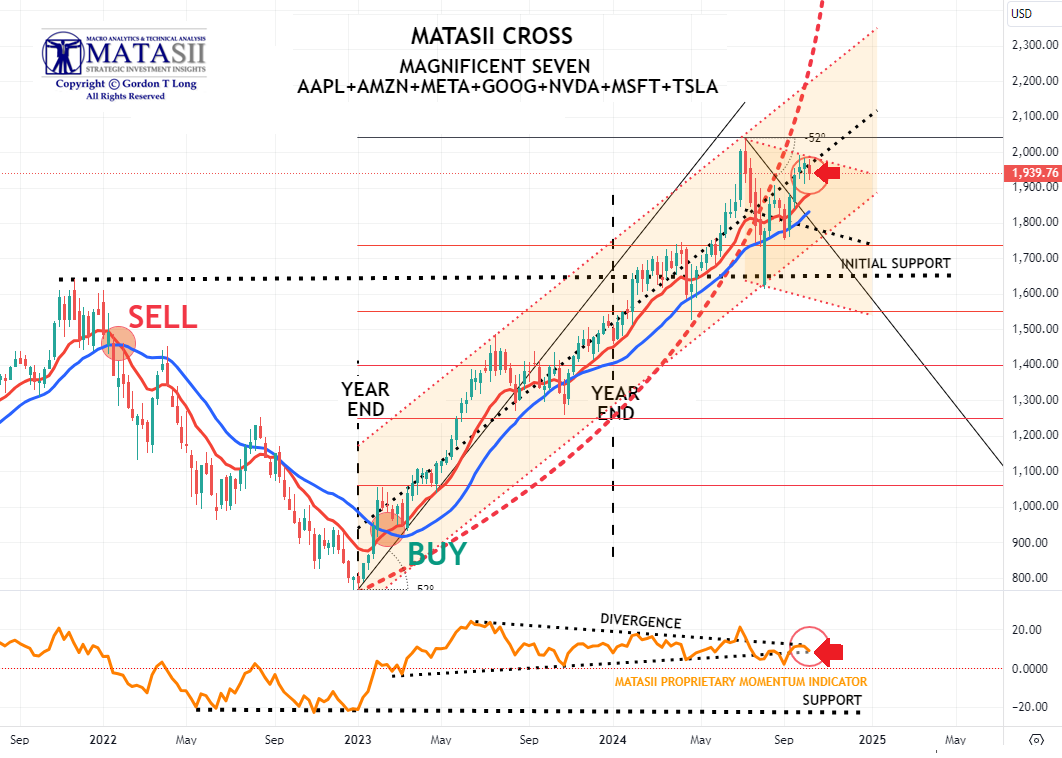
MAGNIFICENT 7
CHART RIGHT: Earnings for both the Magnificent Seven and the Other 493 stocks in the S&P 500 are projected to slow in the third quarter of 2024, reflecting broader economic uncertainties and reduced consumer demand.
CURRENT DAY'S VIEW
- The Magnificent Seven has again reached the upper boundary of its descending trend channel as well the center line of its longer term rising trend channel before weakening Friday on Tesla's RoboTaxi announcement disappointed investors.
- Meanwhile the MATASII Proprietary Momentum Indicator (lower pane) appears temporarily trapped between two major overhead resistance levels (dotted black lines) with weakness on Friday.
PRIOR OBSERVATIONS - STILL VALID
- As we said in former reports: "A brief counter rally may ensue, but it is highly likely that the much lower Longer term Momentum Support (lower pane black dashed line) will soon be tested".
- Continued caution is advised since major global "Dark Pools" have been identified as presently operating behind the scenes on the Mag-7.
| |
|
YOUR DESKTOP / TABLET / PHONE ANNOTATED CHART
Macro Analytics Chart Above: SUBSCRIBER LINK
| |
"CURRENCY" MARKET (Currency, Gold, Black Gold (Oil) & Bitcoin) | |
|
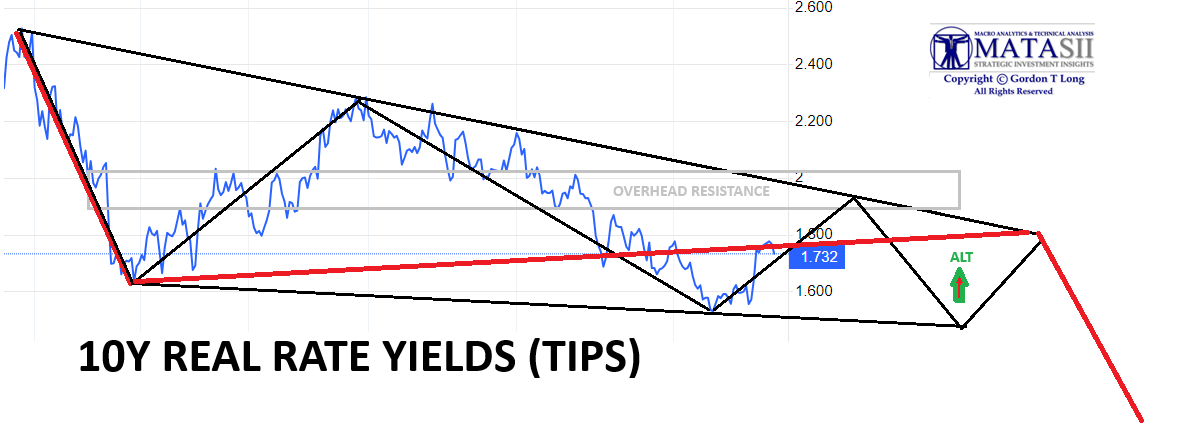
10Y REAL YIELD RATE (TIPS)
Real Rates continue to fall and begin to suggest an ending diagonal pattern is emerging, (shown in the chart to the right - as of close week ending 10/12/24). (LATEST)
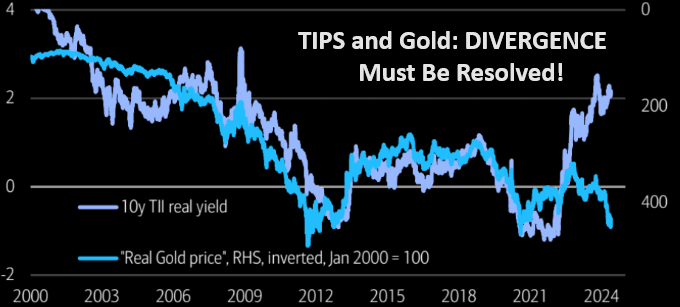
NOTE: Gold is suggesting it will be resolved by the red line (chart right) with a fall in real rates (chart lower right) and rising Gold prices.
| |
CONTROL PACKAGE
There are TEN charts we have outlined in prior chart packages, which we will continue to watch closely as a CURRENT Control Set:
-
US DOLLAR -DXY - MONTHLY (CHART LINK)
-
US DOLLAR - DXY - DAILY (CHART LINK)
-
GOLD - DAILY (CHART LINK)
-
GOLD cfd's - DAILY (CHART LINK)
-
GOLD - Integrated - Barrick Gold (CHART LINK)
- SILVER - DAILY (CHART LINK)
-
OIL - XLE - MONTHLY (CHART LINK)
-
OIL - WTIC - MONTHLY - (CHART LINK)
-
BITCOIN - BTCUSD -WEEKLY (CHART LINK)
-
10y TIPS - Real Rates - Daily (CHART LINK)
| |
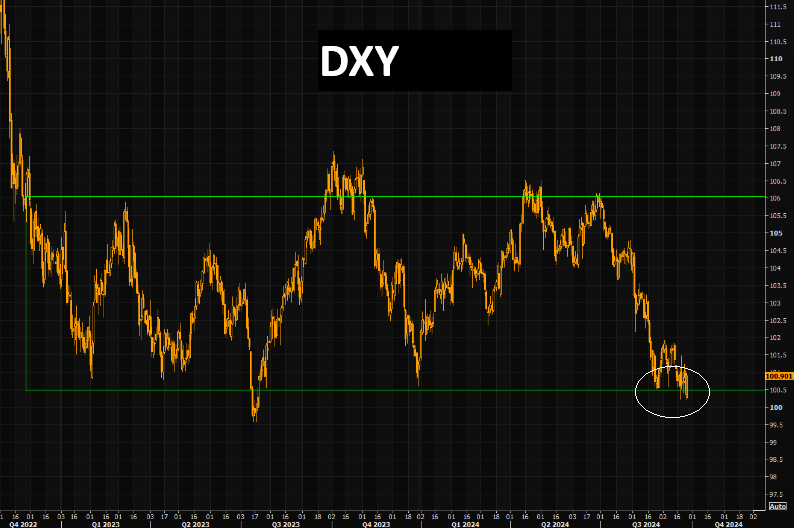
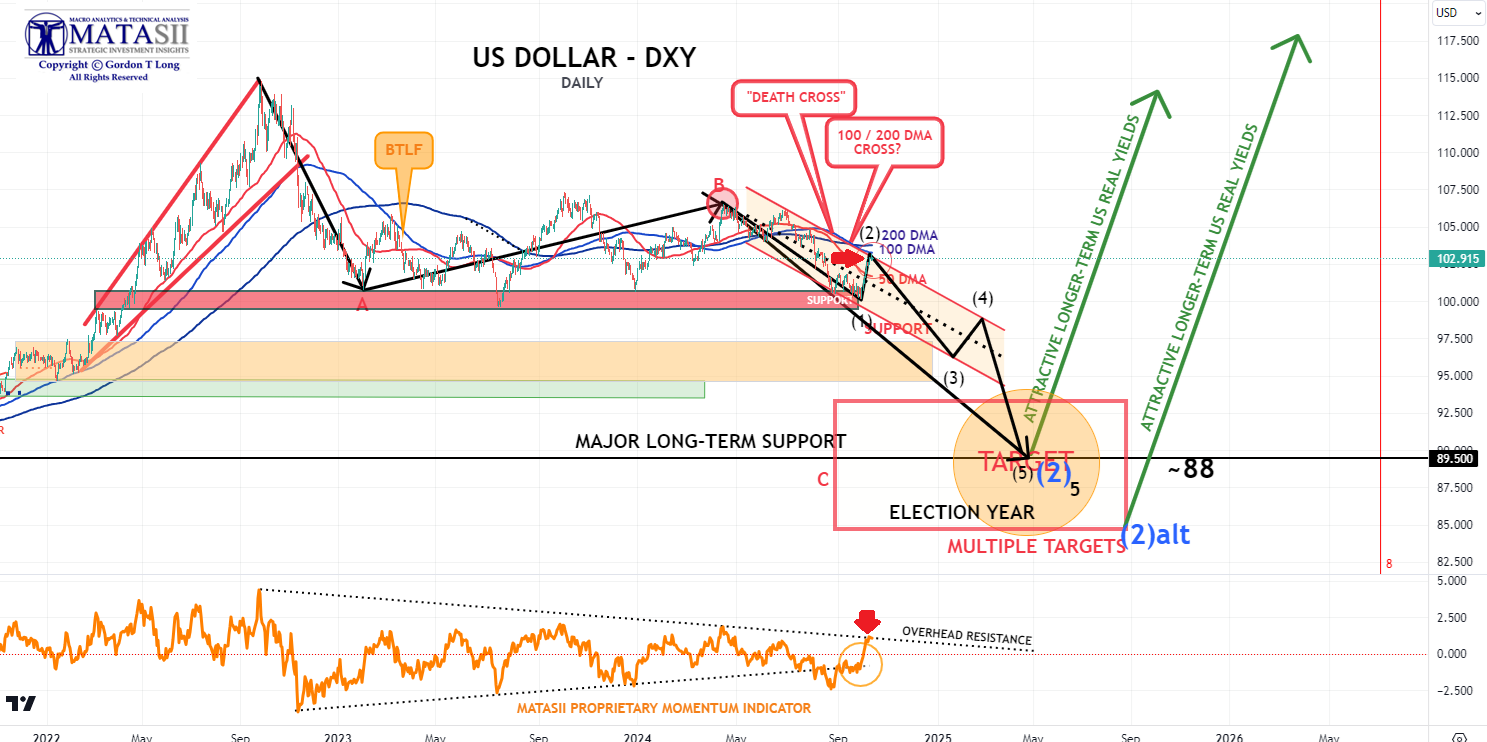
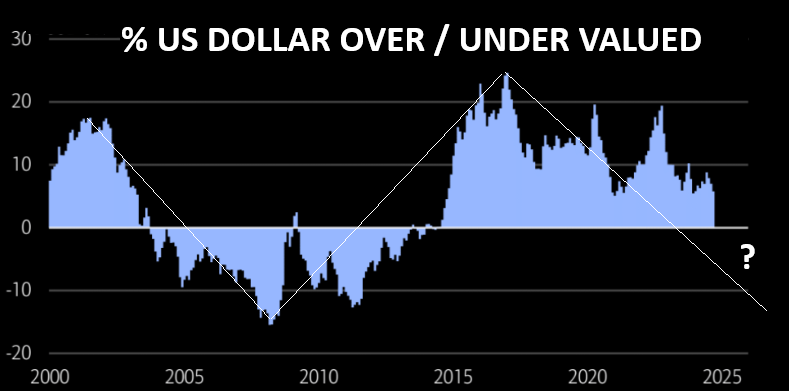
US DOLLAR - DXY - DAILY
CHART RIGHT:
Trading mean reversion often involves pain. The dollar continues trading close to range lows. It looks like it is going to "give in", but the DXY still manages holding these supports. Likely get a pop higher (max pain trade)?
CHART BELOW:
The US real effective exchange rate relative to moving average over past ten years.
This historically has been a mean reverting oscillator.
|  | |
MATASII CHART BELOW
CURRENT DAY'S VIEW
- The DXY continues to rally towards its 100 & 200 DMA, thereby closing the gap between its price and bands in the process of turning the moving average bands downward
- The DXY's Momentum Indicator (lower panel) has reached its overhead resistance level.
- A touch of the 100 DMA before beginning to fall towards support is likely.
PRIOR OBSERVATIONS - STILL VALID
- We have a Death Cross on the DXY, (the 50 DMA crosses the 200 DMA to the downside).
- We also have the 100 DMA having crossed the 200 DMA to the downside.
- We would expect the Dollar to soon break its long held support level (red band below).
- A short term counter rally towards the descending 50 / 100 /200 DMA would be normal.
- Meanwhile the MATASII Proprietary Momentum Indicator (lower pane) has now hit the longer term resistance level (dotted black trend line).
| |
|
YOUR DESKTOP / TABLET / PHONE ANNOTATED CHART
Macro Analytics Chart Above: SUBSCRIBER LINK
| |
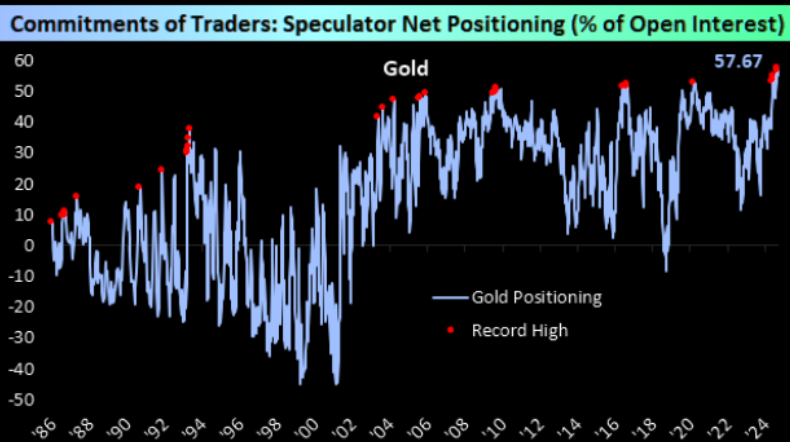
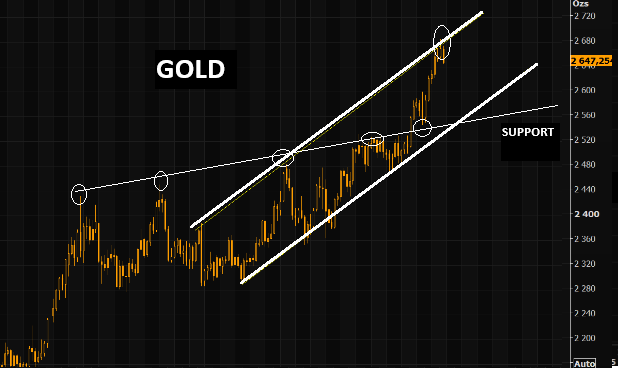
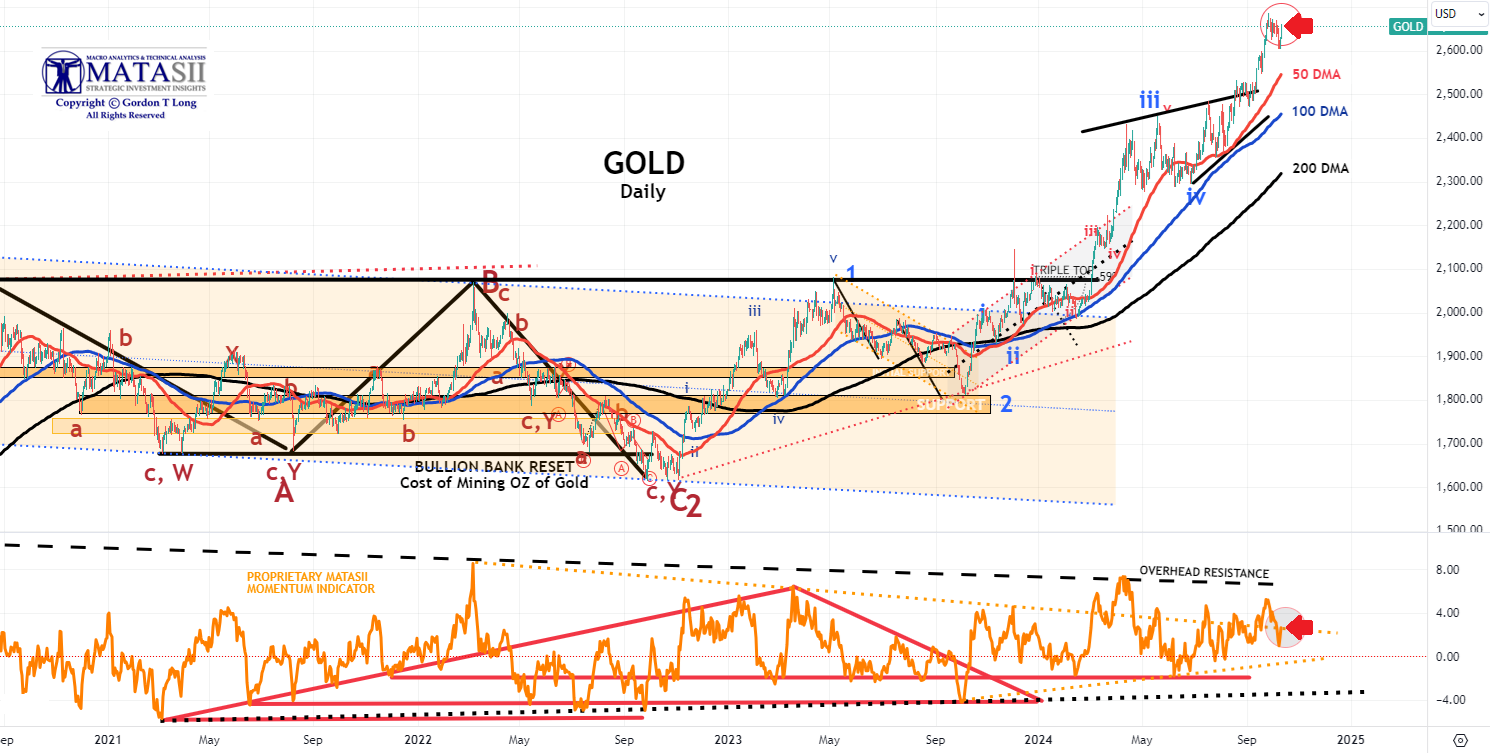
GOLD
CHART RIGHT:
It appears everyone is now chasing gold up here!
CHART BELOW:
Gold reversing in the upper part of the trend channel. The run up to channel highs has been impressive, but even great things "come to an end", or at least take a pause.
NOTE: The US 10Y Real Yield Rate (chart) is showing indications of a short term lift. Gold moves inversely to the Real Rate.
| |
CHART BELOW
- Gold continues to move marginally higher even without the support of a falling dollar or further weakening in Real Rates.
- However, you should continue to watch Real Rates closely for a potential corrective / consolidation retreat. (see chart - we had a marked rise in Real Rates on Friday!)
- The Macro continues to suggest higher prices with the dollar falling and Real Rates weakening.
| |
|
YOUR DESKTOP / TABLET / PHONE ANNOTATED CHART
Macro Analytics Chart Above: SUBSCRIBER LINK
| |
|
CONTROL PACKAGE
CHART RIGHT: The SPY is sending a potential warning that needs to be heeded!
There are FIVE charts we have outlined in prior chart packages that we will continue to watch closely as a CURRENT "control set":
- The S&P 500 (CHART LINK)
- The DJIA (CHART LINK)
- The Russell 2000 through the IWM ETF (CHART LINK)
- The MAGNIFICENT SEVEN (CHART ABOVE WITH MATASII CROSS - LINK)
- Nvidia (NVDA) (CHART LINK)
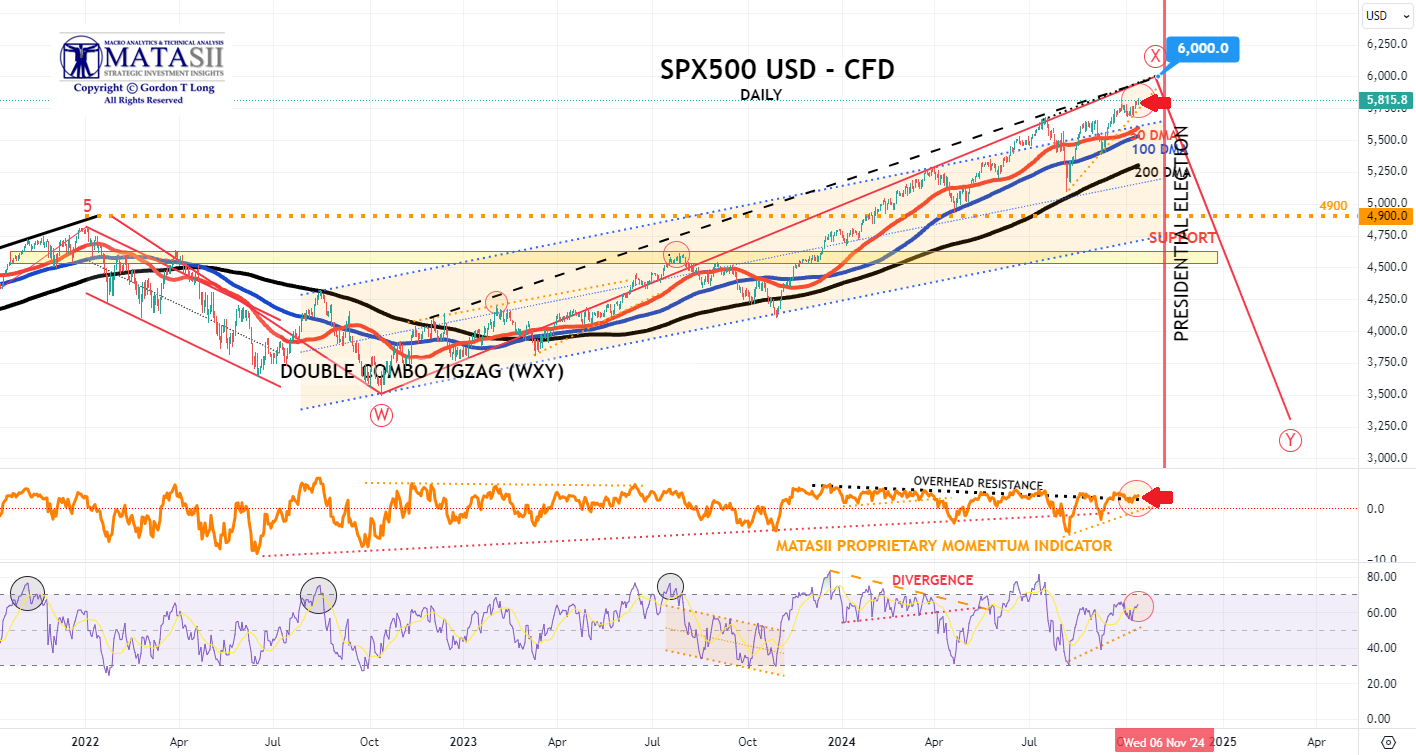
S&P 500 CFD
- The S&P 500 cfd decisively broke the previous Triple Top with the FOMC Rate announcement and continues to rise to new highs, but with a weakening rate of rise.
- The MATASII Proprietary Momentum Indicator (middle panel) has found resistance at its overhead resistance "Divergence" level, (as part of a large wedge that appears soon to end) and has started flattening.
| |
YOUR DESKTOP / TABLET / PHONE ANNOTATED CHART
Macro Analytics Chart Above: SUBSCRIBER LINK
| |
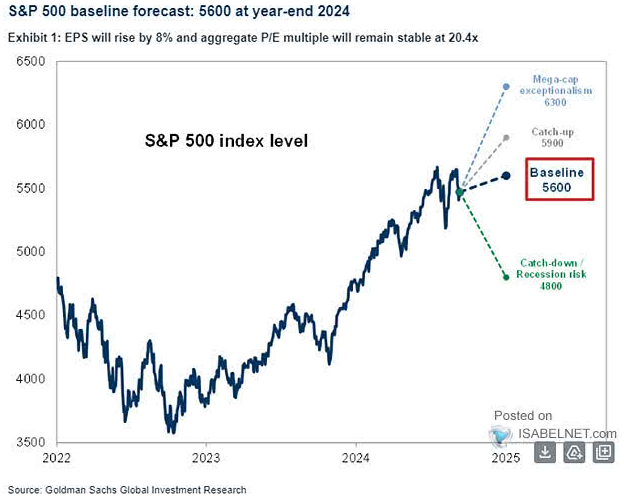
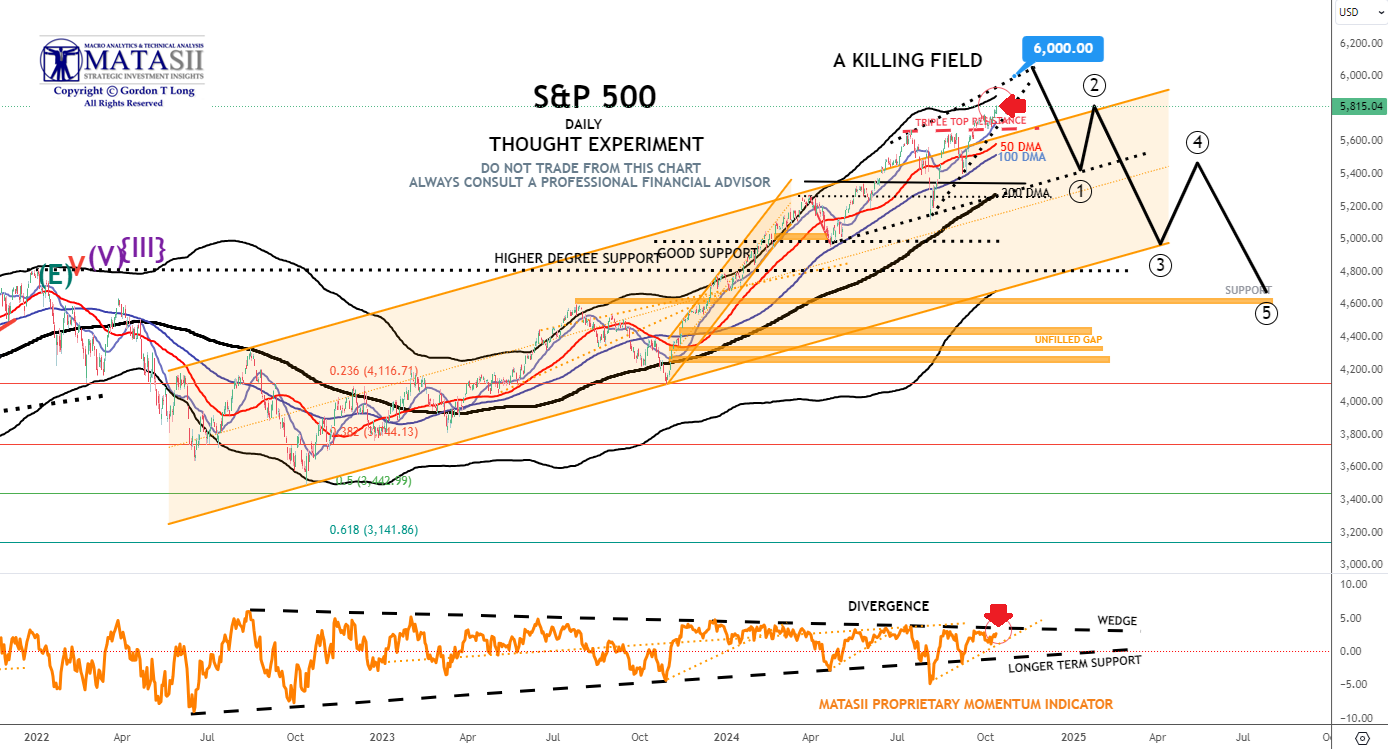
S&P 500 - Daily Our Thought Experiment
OUR CURRENT ASSESSMENT IS THAT THE INTERMEDIATE TERM IS LIKELY TO LOOK LIKE THE FOLLOWING:
CHART RIGHT: In its base case scenario, Goldman Sachs projects a year-end 2024 price target of 5,600 for the S&P 500 index, supported by robust earnings growth and a stable price-to-earnings ratio.
NOTE: To reiterate - "the black labeled activity shown below, between now and September, looks like a "Killing Field", where the algos take Day Traders, "Dip Buyers", the "Gamma Guys" and FOMO's all out on stretchers!"
- The S&P 500 decisively broke the previous Triple Top with the FOMC Rate announcement and continues to rise to new highs, but with a weakening rate of rise.
- The MATASII Proprietary Momentum Indicator (middle pane) is approaching its overhead resistance "Divergence" level, (as part of a large wedge that appears soon to end).
| |
YOUR DESKTOP / TABLET / PHONE ANNOTATED CHART
Macro Analytics Chart Above: SUBSCRIBER LINK
| |
STOCK MONITOR: What We Spotted
|  | |
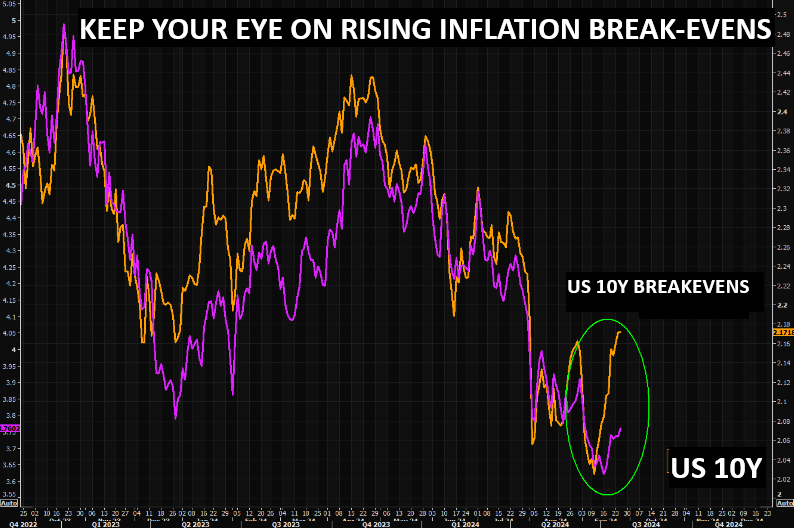
LOWER BOND YIELDS CORRECTLY SPOT A WEAKER MACRO
CONTROL PACKAGE
There are FIVE charts we have outlined in prior chart packages that we will continue to watch closely as a CURRENT "control set":
- The 10Y TREASURY NOTE YIELD - TNX - HOURLY (CHART LINK)
- The 10Y TREASURY NOTE YIELD - TNX - DAILY (CHART LINK)
- The 10Y TREASURY NOTE YIELD - TNX - WEEKLY (CHART LINK)
- The 30Y TREASURY BOND YIELD - TNX - WEEKLY (CHART LINK)
- REAL RATES (CHART LINK)
FISHER'S EQUATION = 10Y Yield = 10Y INFLATION BE% + REAL % = 2.326% + 1.732% = 4.058%
3YR AUCTION: The US Treasury sold USD 58bln of 3yr notes at a high yield of 3.878%, tailing the when issued by 0.7bps (the first tail since June), a much softer reception than the prior stop through of 1.7bps and six auction average for the high yield to come in on the screws. The Bid-to-Cover also disappointed at 2.45x, vs. the prior 2.66x and average 2.57x. The soft demand was led by a pullback in indirect demand, taking just 56.9% of the auction, well below the prior 78.2% and average of 66.1%. Direct demand saw a decent improvement to 24%, however, up from the 11.3% and average of 18.1%. Nonetheless, it still saw dealers with a chunky 19.2% takedown, above the average 15.8% and prior 10.5%.
10YR AUCTION: Overall a mixed auction but not as strong as the September offering. The 0.4bps tail was not as strong as the prior stop-through of 1.4bps but a touch better than recent averages. The Bid-to-Cover of 2.48x was beneath the prior 2.64x and six auction average 2.51x. Direct demand fell to 8.44% from 13.7%, well beneath the 16.2% average but the indirect demand remained strong at 77.63%, above the prior 76.0% and average of 68.6%. This left dealers taking under 14% of the auction, slightly better than the average 15.2% but still up from the prior 10.2%.
30YR AUCTION: Overall a strong 30yr auction, likely supported by the concession in wake of hawkish Bostic remarks just before the auction. The US Treasury sold 22bln of 30yr bonds at a high yield of 4.389%, stopping through the WI by 1.5bps, much stronger than the prior tail of 1.4bps and six auction average for a tail of 0.9bps, marking the first stop through in the 30yr auctions since June. The Bid-to-Cover of 2.50x was well above the prior and average of 2.38x. Although a strong auction, there was a lack of direct demand which only took 7.37% of the supply, down from the prior 15.7% and the average of 18.4%, however, this was heavily offset by a surge in indirect bidders. Indirect demand jumped to 80.47% from 68.7%, well above the six-auction average of 65.4%, leaving dealers with just 12.16% of the auction, beneath the prior 15.7% and average 16.2%.
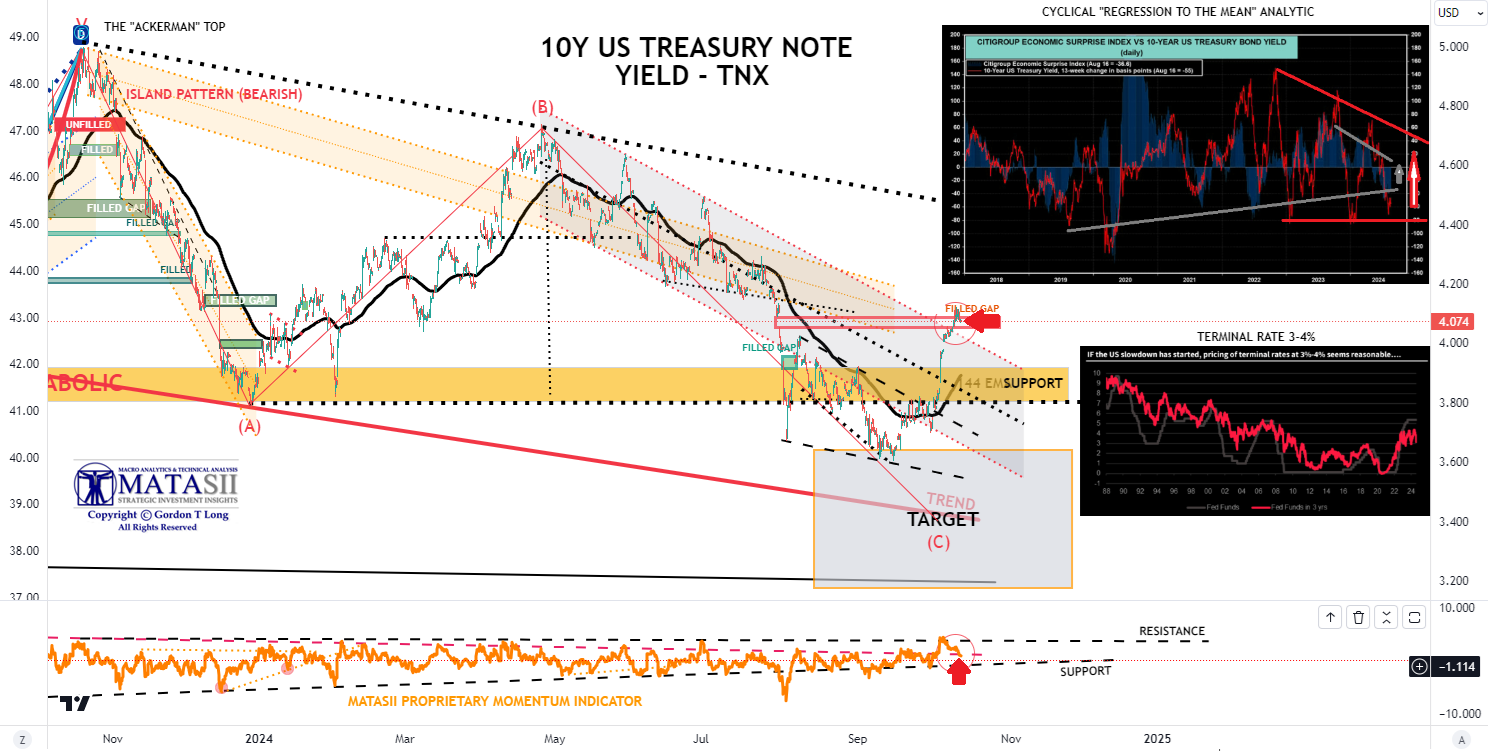
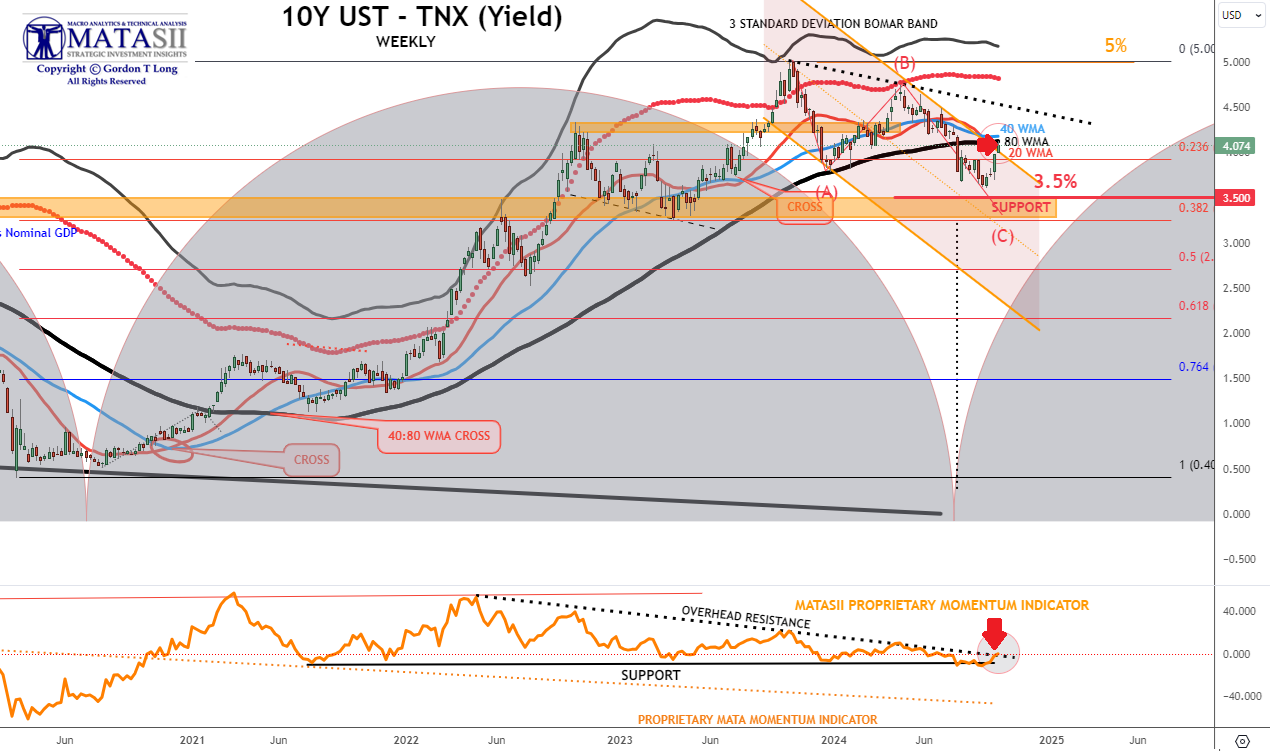
10Y UST - TNX - WEEKLY
CURRENT DAY'S VIEW
- Yields continue to rise, having reached the 20 WMA and close to touching the 80 WMA.
- The TNX has reached overhead resistance on its' MATASII Proprietary Momentum Indicator.
- The expected counter rally is likely close to being finished.
PRIOR OBSERVATIONS - STILL VALID
- The 20 WMA has crossed the 80 WMA - this is normally quite Bearish for Yields!
- The distance of yields below the WMAs was quite large and as we suggested a retracement towards the bands should be expected before heading lower (occurred this week).
- The Proprietary MATASII Momentum Indicator (lower pane) is now showing the beginnings of a test of its overhead resistance trend level.
|  | |
YOUR DESKTOP / TABLET / PHONE ANNOTATED CHART
Macro Analytics Chart Above: SUBSCRIBER LINK
| |
10Y UST - TNX - HOURLY
CURRENT DAY'S VIEW
- The TNX is in the process of closing an unfilled open gap.
- Momentum has already began falling off (lower panel).
- The counter rally is likely near being completed.
PRIOR OBSERVATIONS - STILL VALID
- The TNX yields aggressively rose this week filling the open gap before falling off slightly on Friday.
- The Momentum Indicator (lower pane) is now showing a test of a lower support level level.
- The Fed has been signalling rates will be taken lower, but at a slower rate than the market is currently pricing in. The "hot" CPI and PPI releases this week now makes it more difficult for the Fed to cut rates aggressively.
| |
YOUR DESKTOP / TABLET / PHONE ANNOTATED CHART
Macro Analytics Chart Above: SUBSCRIBER LINK
| |
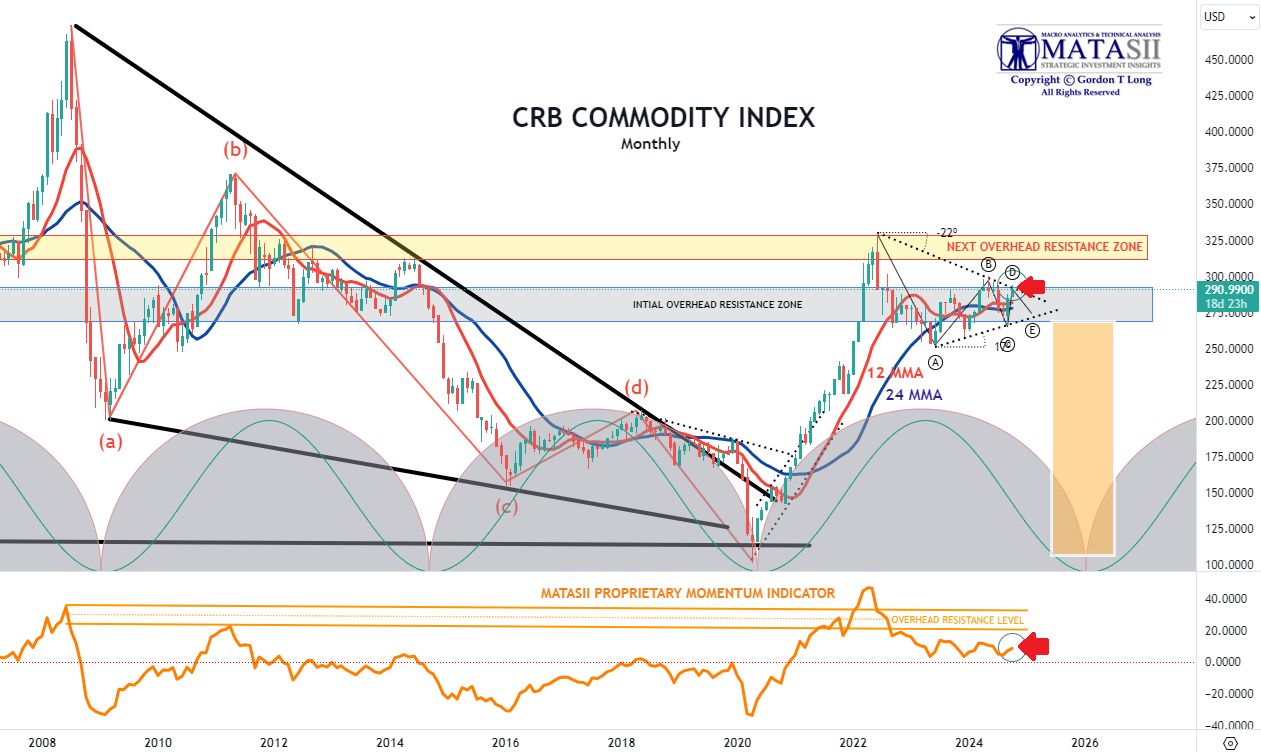
CRB COMMODITY INDEX - MONTHLY
- The overall Commodity Indexes, as measured by the CRB Commodity, reflect a Corrective / Consolidation is presently nearing completion.
- However, many of the individual sectors (not shown here) have already completed the Corrective / Consolidation and broken higher over the last 30-60 days.
- Examples:
- Invesco DB Agricultural Fund (DBA)
- VanEck Agribusiness (MOO)
- Food Producers (FT350 Food Producers - NMX45)
- Teucrium Agricultural Fund ETV (TAGS)
- Advisory Shares Restaurant ETF (EATZ)
- Invesco Food & Beverage ETF (PBJ)
- Teucrium Wheat Fund ETV (WEAT)
- Teucrium Corn Fund ETV (CORN)
- Teucrium Soybean Fund ETV (SOTB)
- Teucrium Sugar Fund ETV (CANE)
| |
YOUR DESKTOP / TABLET / PHONE ANNOTATED CHART
Macro Analytics Chart Above: SUBSCRIBER LINK
| |
NOTICE Information on these pages contains forward-looking statements that involve risks and uncertainties. Markets and instruments profiled on this page are for informational purposes only and should not in any way come across as a recommendation to buy or sell in these assets. You should do your own thorough research before making any investment decisions. MATASII.com does not in any way guarantee that this information is free from mistakes, errors, or material misstatements. It also does not guarantee that this information is of a timely nature. Investing in Open Markets involves a great deal of risk, including the loss of all or a portion of your investment, as well as emotional distress. All risks, losses and costs associated with investing, including total loss of principal, are your responsibility.
FAIR USE NOTICE This site contains copyrighted material the use of which has not always been specifically authorized by the copyright owner. We are making such material available in our efforts to advance understanding of environmental, political, human rights, economic, democracy, scientific, and social justice issues, etc. We believe this constitutes a ‘fair use’ of any such copyrighted material as provided for in section 107 of the US Copyright Law. In accordance with Title 17 U.S.C. Section 107, the material on this site is distributed without profit to those who have expressed a prior interest in receiving the included information for research and educational purposes. If you wish to use copyrighted material from this site for purposes of your own that go beyond ‘fair use’, you must obtain permission from the copyright owner.
========
| |
IDENTIFICATION OF HIGH PROBABILITY TARGET ZONES | |
Learn the HPTZ Methodology!
Identify areas of High Probability for market movements
Set up your charts with accurate Market Road Maps
Available at Amazon.com
| |
The Most Insightful Macro Analytics On The Web | | | | |