|
Gordon T Long Research exclusively distributed at MATASII.com
Subscribe to Gordon T Long Research - $35 / Month - LINK
Complete MATASII.com Offerings - $55/Month - LINK
SEND YOUR INSIGHTFUL COMMENTS - WE READ THEM ALL - lcmgroupe2@comcast.net
| |
CURRENT MARKET PERSPECTIVE | |
|
EYES ON THE US TREASURY REFUNDING THIS COMING WEEK
EQUITIES TO TRADE ON YIELDS, EARNINGS & TREASURY SIGNALS
Click All Charts to Enlarge
| |
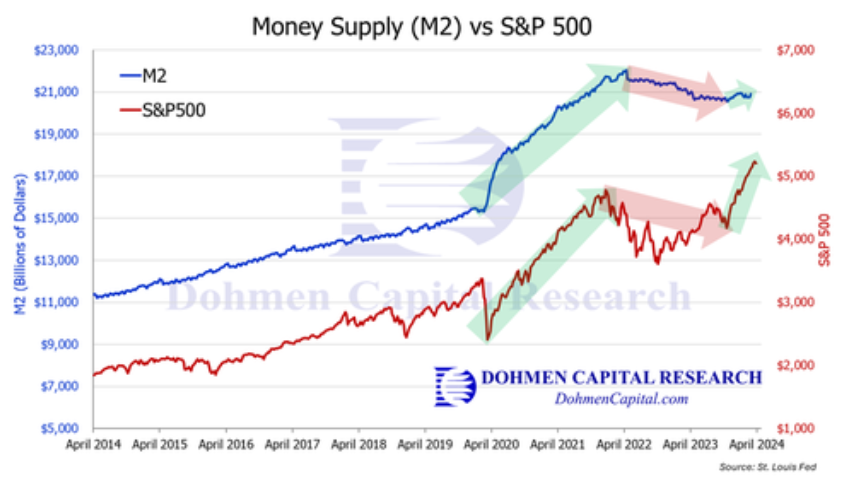
M2 MONEY SUPPLY TURNS: Late last year the Fed started stimulating again, contrary to what Fed officials said publicly. The chart of M2 vs the S&P 500 above confirms that money supply is growing again. The rate of change turned nicely positive. That is the green light for reflating markets….and inflation!! | |
|
1 - SITUATIONAL ANALYSIS
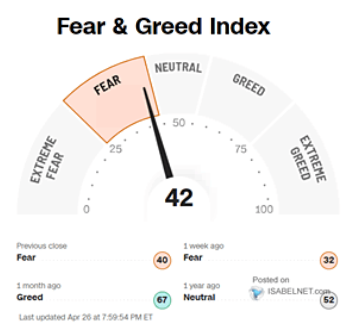
Stock Market remains in fear for the 8th consecutive trading day. The Fear Index has been gradually lessening. It was 31 last week and now registers 42. (chart right)
In terms of market volatility the VVIX has collapsed and is trading at lower levels than prior to this latest mini panic move. The VIX is also significantly down. Both indicating that worry is subsiding though intra day volatility is causing a lot of trading frustration.
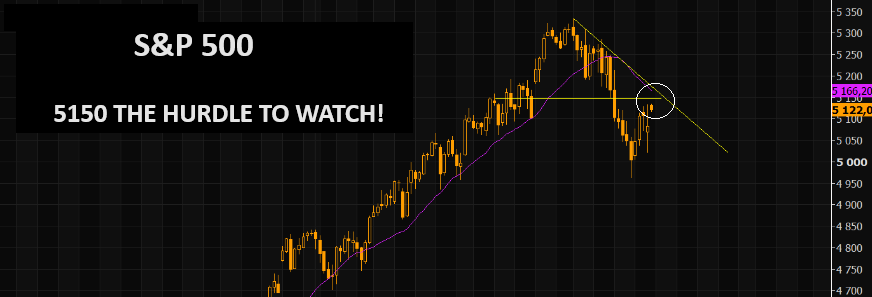
So far this is just a "normal" bounce post the sell off. 5150 appears to be the key in SPX to the upside. The short term negative trend line comes in there, as well as the 21 day moving average, sloping negatively.
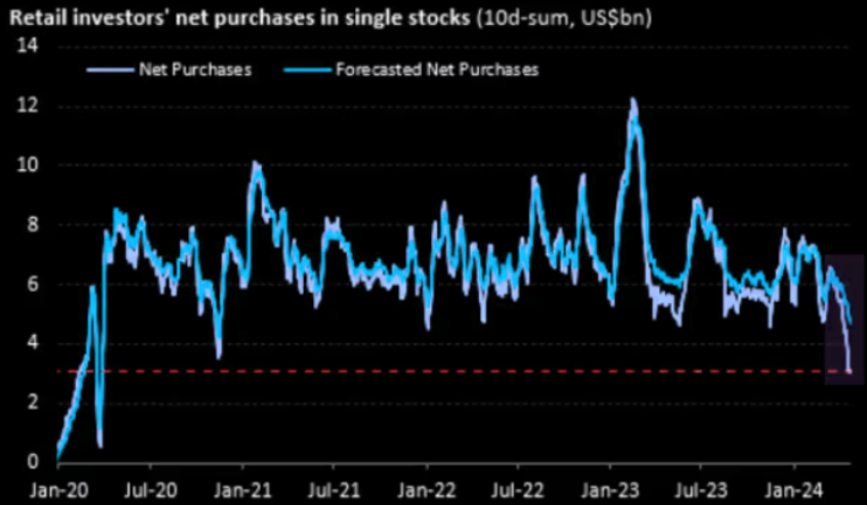
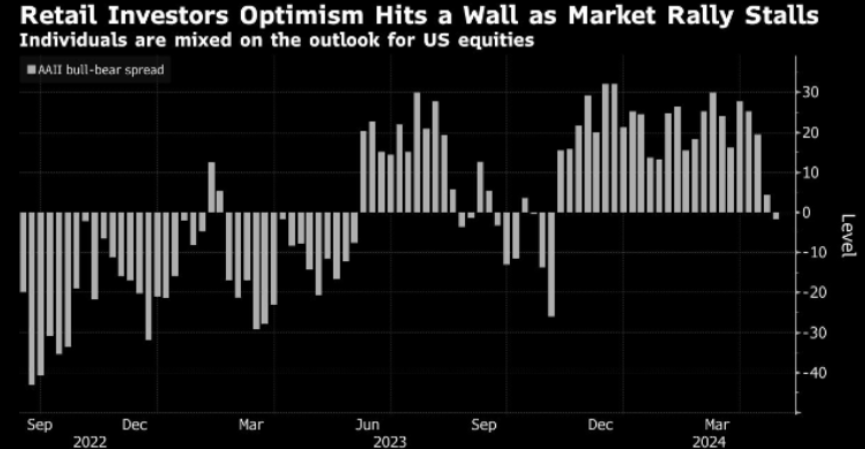
CHART BELOW: Retail Investors are now the most pessimistic / least optimistic about stocks since November
|  | |
Your copy should address 3 key questions: Who am I writing for (audience)? Why should they care (benefit)? What do I want them to do (call-to-action)?
Create a great offer by adding words like "free," "personalized," "complimentary," or "customized." A sense of urgency often helps readers take action, so consider inserting phrases like "for a limited time only" or "only 7 remaining!"
| |
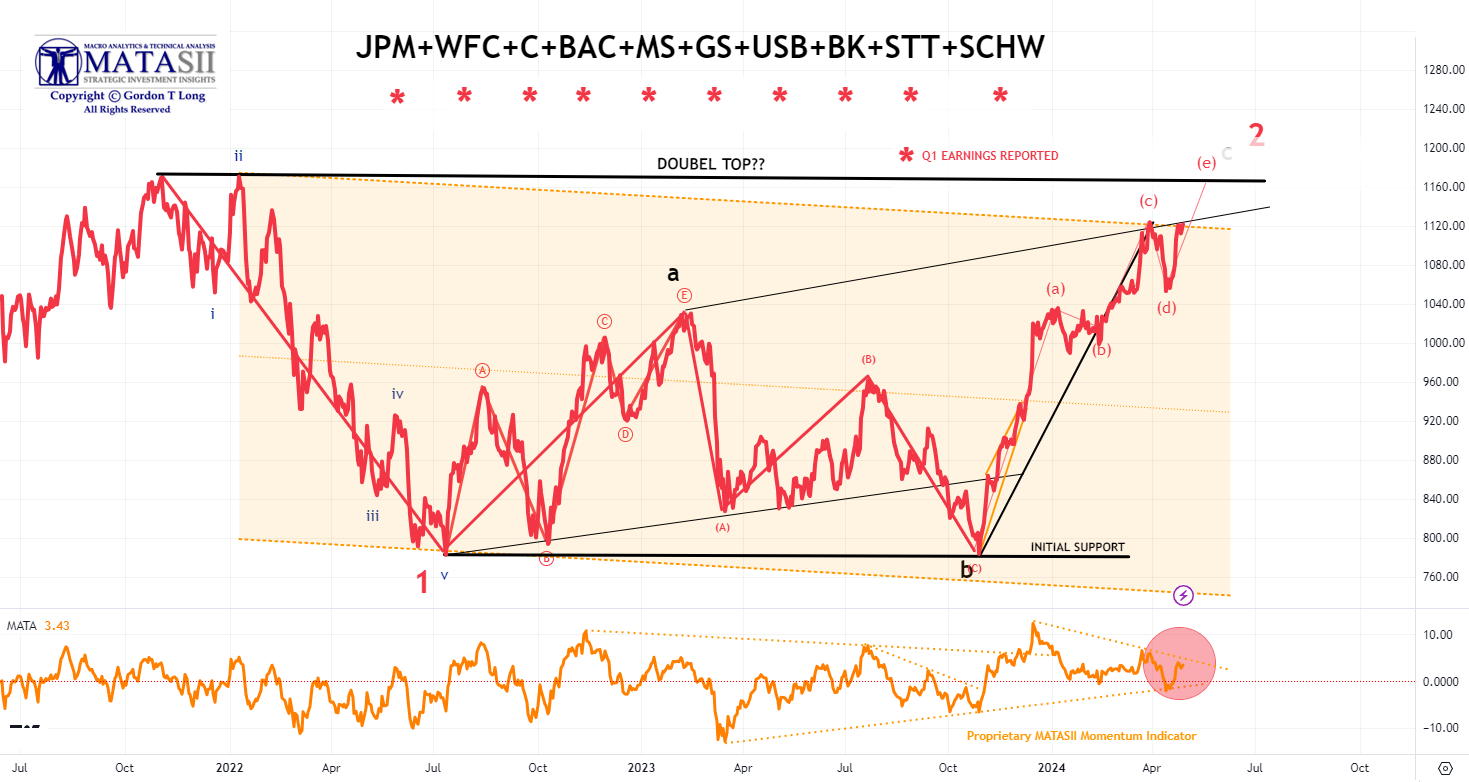
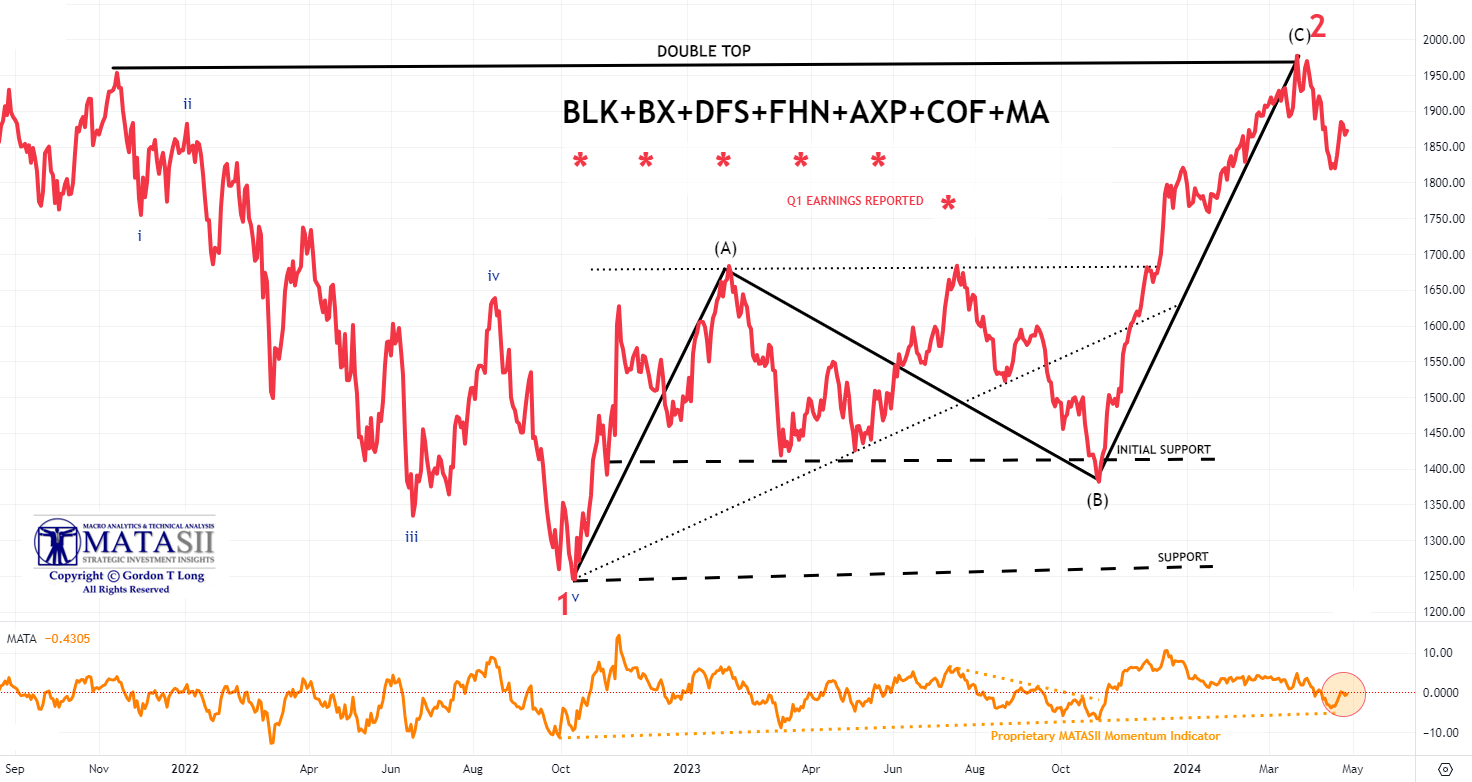
AS GO THE BANKS, SO GO THE MARKETS - AS GO THE FINANCIALS, SO GO THE BANKS! | |
|
1- BANKING STOCKS
Bank stocks though initially weak on earnings release have been trending up ever since, while the overall market weakened until recently rising along with Bank stocks.
| |
|
2- FINANCIALS STOCKS
The Financials appear to be trying to follow the Banking stocks higher against the overall trend of the market. The MATASII Financial Index has reached overhead momentum resistance (lower pane).
| |
|
2 - FUNDAMENTAL ANALYSIS
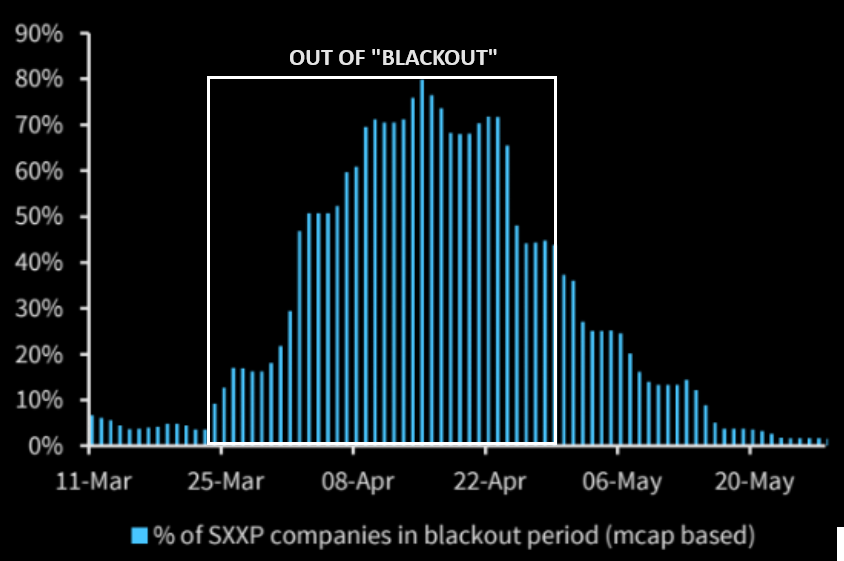
CORPORATE BUYBACKS
On the authorization front, 2024 YTD authorizations stand at $317.4B vs $377.0B 2023 YTD authorizations. Expectations are that authorizations this year will finish higher. Estimates for 2024 authorizations are to finish $1.15T (up ~16%) according to Goldman Sachs.
CHART RIGHT: Buyback blackout window ending.
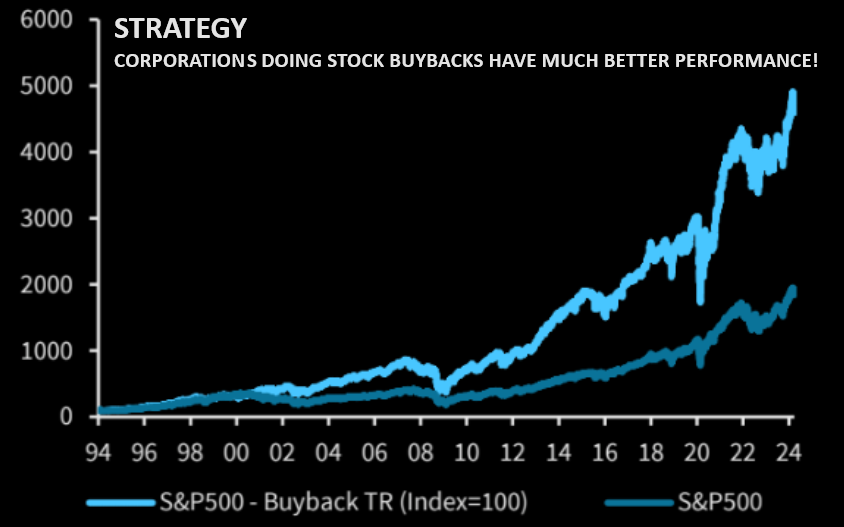
CHART BELOW
Buyback yield strategy has outperformed in the US, where buybacks and therefore compounding have been part of the equity culture for a long time.
| |
|
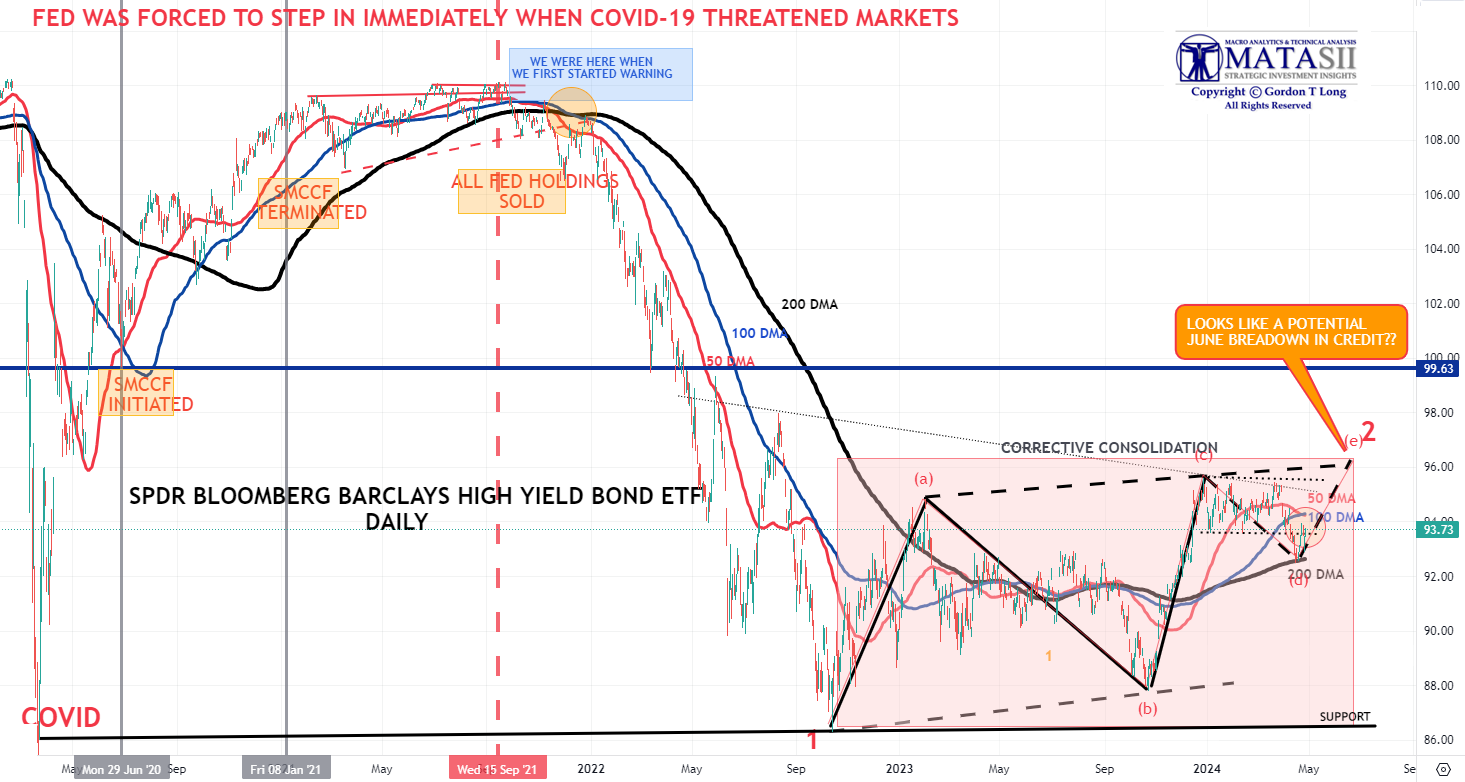
CREDIT LEADS
The High Yield Credit sector as represented by the "JNK" is currently reflecting nothing more than a consolidation to the 200 DMA then completing a potential final leg up. Though expected to be of short duration this is normally good for the equity markets.
| |
|
YOUR DESKTOP / TABLET / PHONE ANNOTATED CHART
Macro Analytics Chart Above: SUBSCRIBER LINK
| |
3 - TECHNICAL ANALYSIS
OVERALL EQUITY MARKET
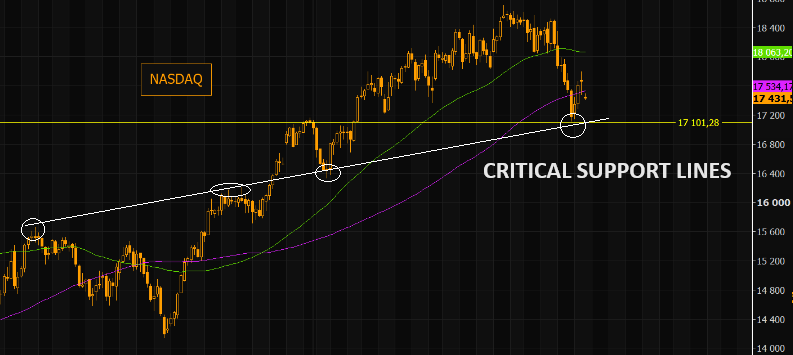
We are just above critical support lines in the Nasdaq. NASDAQ's short term must hold is down around the 17100 area. We are presently falling below the 100 day .
The 50 day is reversing and has just started sloping negatively. Indicates are we are slowly rolling over.
MAGNIFICENT 7
- We are reaching the vertical lift part of the parabolic (geometric) lift shown by the dashed red line.
- We have intermediate term Divergence with momentum (bottom pane).
In the short term Momentum has rolled over but hasn't yet decisively broken the Momentum trend line support.
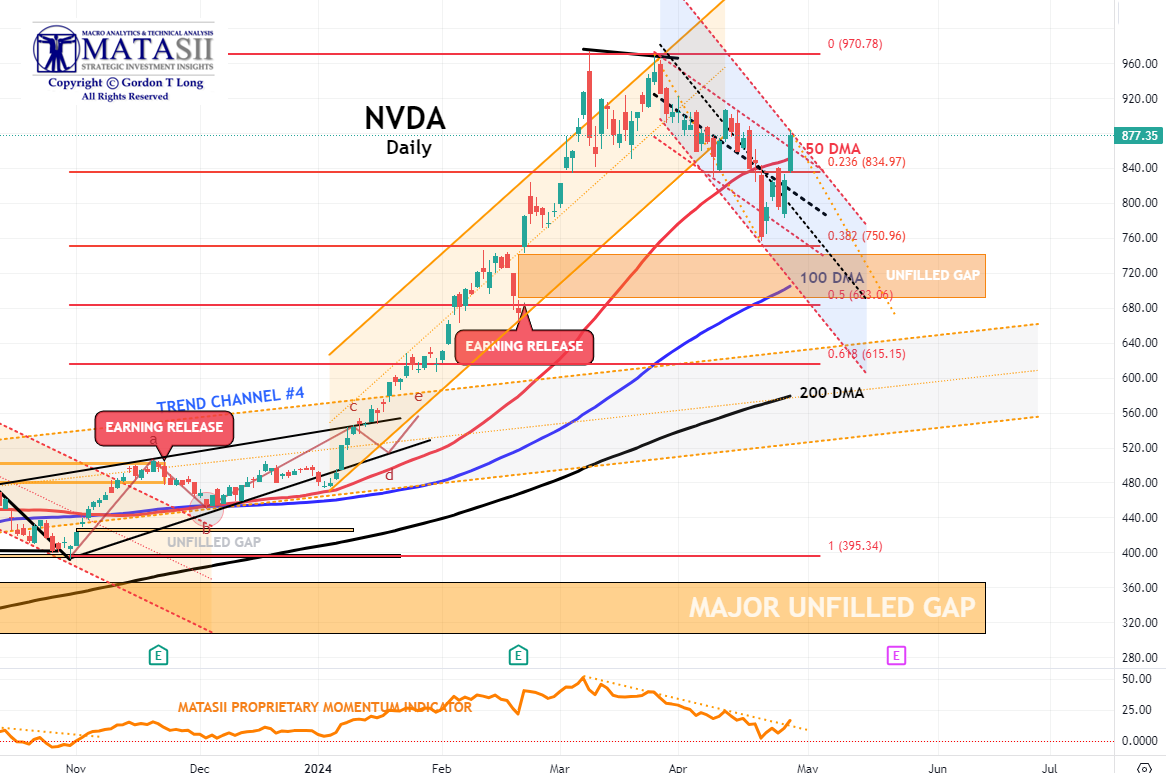
NVDA - Daily
- NVDA broke through the overhead 50 DMA on a retest.
- NVDA Momentum (lower pane) has also broken through its overhead resistance trend line.
- This counter rally is noticeably strong for NVDA and may lead the market higher - at least in the short term.
| |
YOUR DESKTOP / TABLET / PHONE ANNOTATED CHART
Macro Analytics Chart Above: SUBSCRIBER LINK
| |
|
"CURRENCY" MARKET (Currency, Gold, Black Gold (Oil) & Bitcoin)
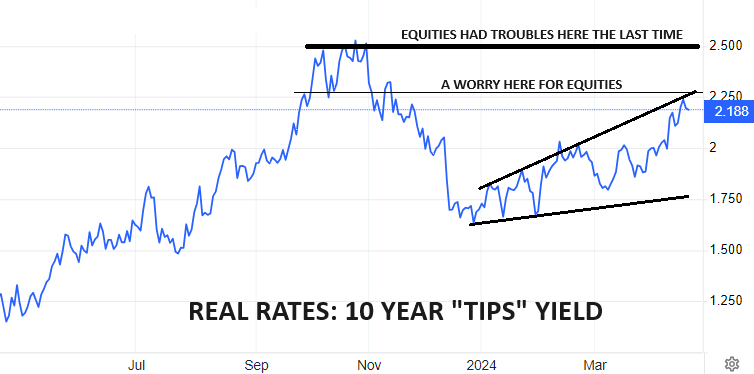
CHART RIGHT: As gold pushes to higher & higher record highs (in USD terms), Real yields have so far refused to play along (right)?? Normally Gold falls when real yields rise and are historically negatively correlated.
What we believe is that what we are seeing is Gold aggressively discounting a coming collapse in Real Rates which we expect between 2.25% - 2.5%.
CONTROL PACKAGE
There are NINE charts we have outlined in prior chart packages which we will continue to watch closely as a CURRENT "control set".
-
US DOLLAR -DXY - MONTHLY (CHART LINK)
-
US DOLLAR - DXY - DAILY (CHART LINK)
-
GOLD - DAILY (CHART LINK)
-
GOLD cfd's - DAILY (CHART LINK)
-
GOLD - Integrated - Barrick Gold (CHART LINK)
-
OIL - XLE - MONTHLY (CHART LINK)
-
OIL - WTIC - MONTHLY - (CHART LINK)
-
BITCOIN - BTCUSD -WEEKLY (CHART LINK)
-
10y TIPS - Real Rates - Daily (CHART LINK)
GOLD cfd's - DAILY
- Gold pulled back on Monday finding initial support at the 23.6% Fibonacci Retracement level.
- God Momentum (lower pane) also found support (dotted black trend line).
- It appears that this initial corrective leg is an "A" wave of an ABC corrective pattern before heading higher when completed. The "C" down leg of the ABC is likely to find firm support at the 38.2% Fibonacci Retracement level.
|  | |
YOUR DESKTOP / TABLET / PHONE ANNOTATED CHART
Macro Analytics Chart Above: SUBSCRIBER LINK
| |
INTEGRATED GOLD MINERS
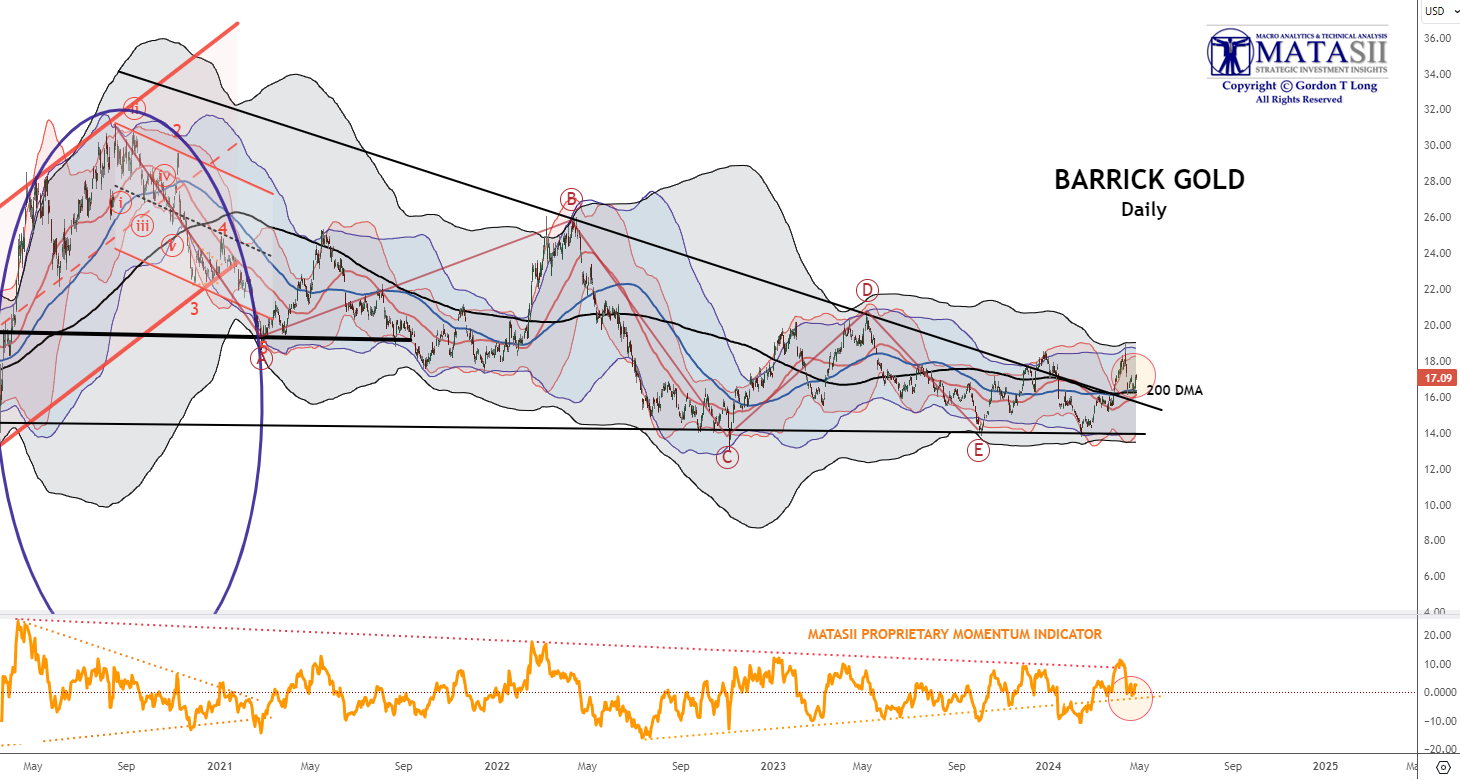
We continue to have a close eye on Gold and the INTEGRATED GOLD MINERS as represented by Barrick Gold. Barrick has broken out of its long term declining overhead resistance trend.
Barrick has been pulling back this week as Gold Bullion has. It may be a good opportunity to be adding to your Gold and Silver positions on any further pullbacks.
| |
|
YOUR DESKTOP / TABLET / PHONE ANNOTATED CHART
Macro Analytics Chart Above: SUBSCRIBER LINK
| |
|
US EQUITY MARKETS
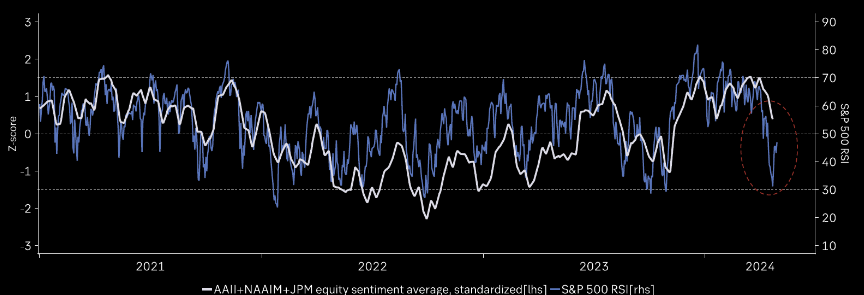
If this is a mild 5-10% correction, investor sentiment should bottom soon around neutral. (Chart Right)
CONTROL PACKAGE
There have FIVE charts we have outlined in prior chart packages that we will continue to watch closely as a CURRENT "control set".
- The S&P 500 (CHART LINK)
- The DJIA (CHART LINK)
- The Russell 2000 through the IWM ETF (CHART LINK),
- The MAGNIFICENT SEVEN (CHART ABOVE WITH MATASII CROSS - LINK)
- Nvidia (NVDA) (CHART LINK)
| |
RUSSEL 2000
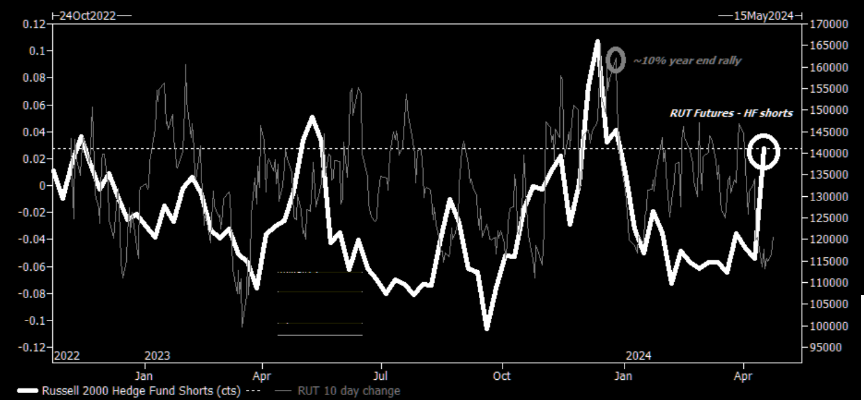
Hedge funds have been strongly adding RTY shorts!
NOTE: The positioning is approaching levels that preceded the sharp short covering we saw at the end of last year (CHART RIGHT)
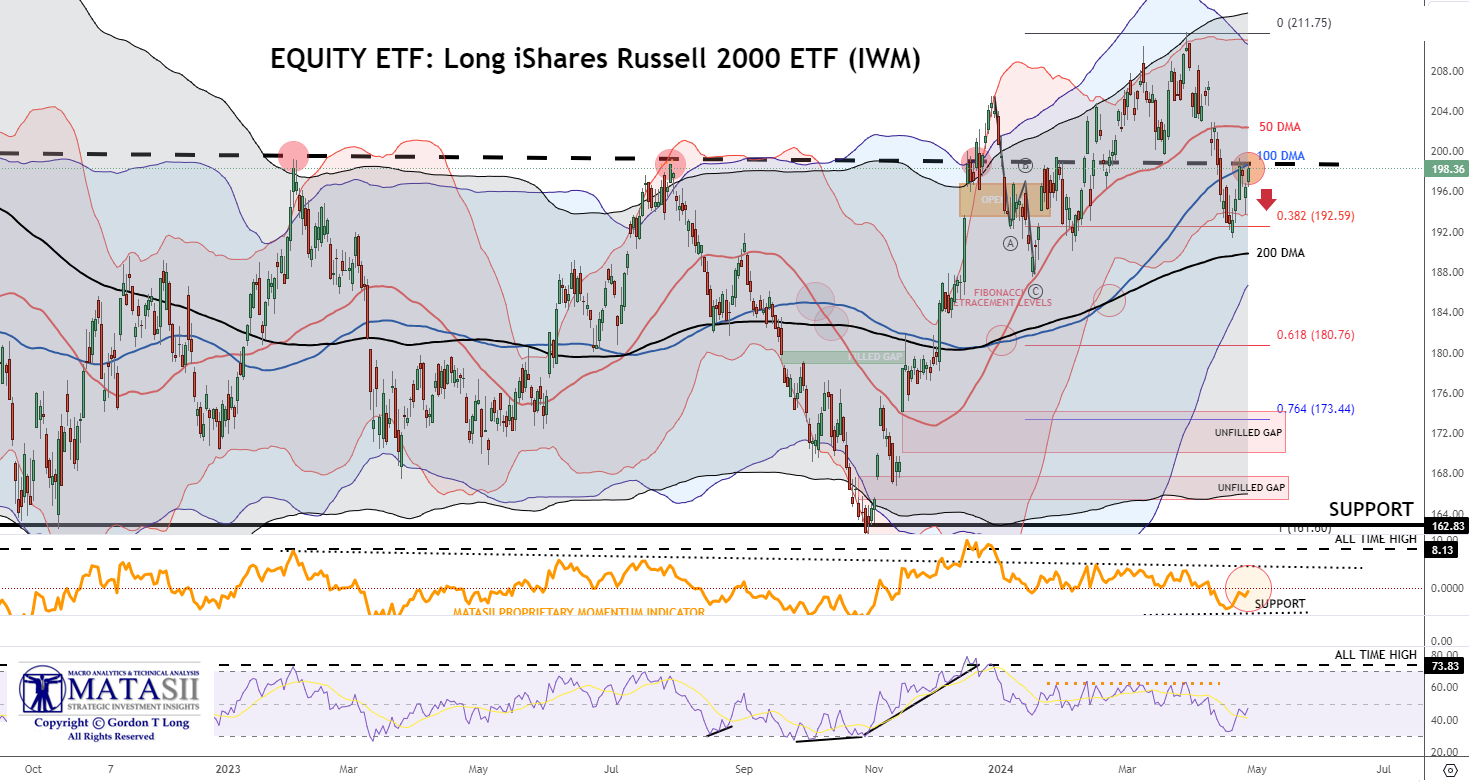
EQUITY ETF: Long iShares Russell 2000 ETF (IWM)
| |
YOUR DESKTOP / TABLET / PHONE ANNOTATED CHART
Macro Analytics Chart Above: SUBSCRIBER LINK
| |
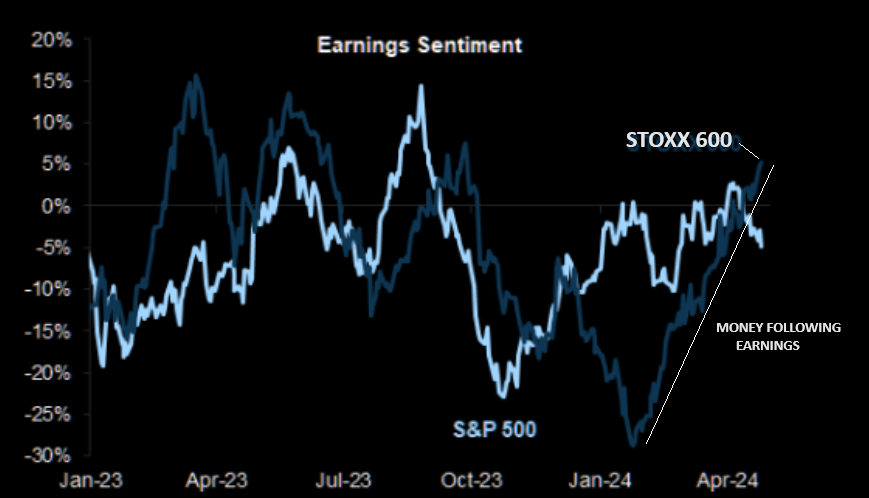
NOTE: Though Hedge funds net bought global equities at the fastest pace in nearly 3 months as overall gross trading activity increased for the 16th straight week, driven by long buys outpacing short sales (~3.6 to 1) THE ACTIVITY HAS BEEN DOMINATELY SLANTED TOWARDS THE EU.
Earnings sentiment for Europe is trending upwards.(Chart Right)
| |
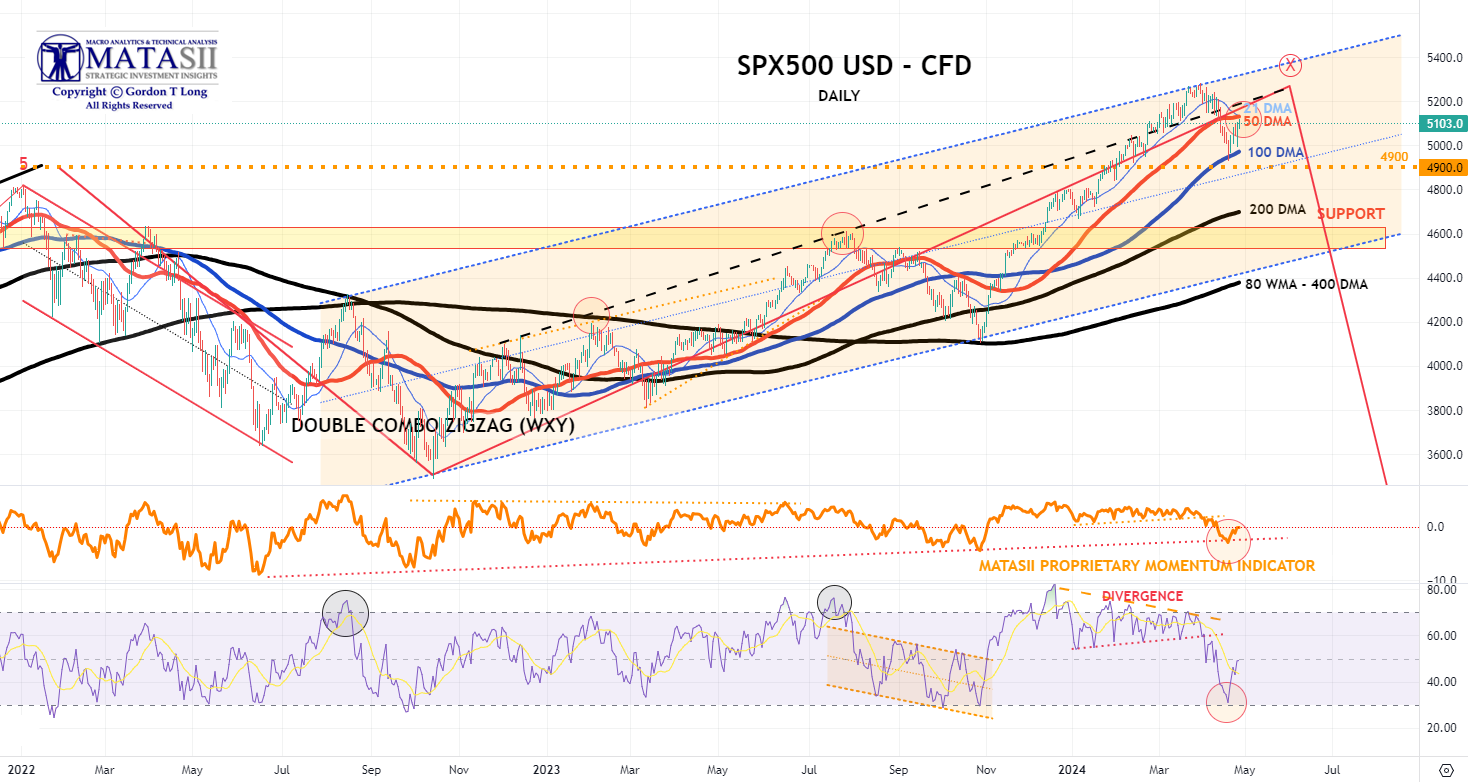
S&P 500 CFD
The S&P 500 cfd bounced off its 100 DMA an subsequently retraced to test its 50 DMA. Momentum (lower pane) also bounced off its lower support to a more neutral level.
| |
YOUR DESKTOP / TABLET / PHONE ANNOTATED CHART
Macro Analytics Chart Above: SUBSCRIBER LINK
| |
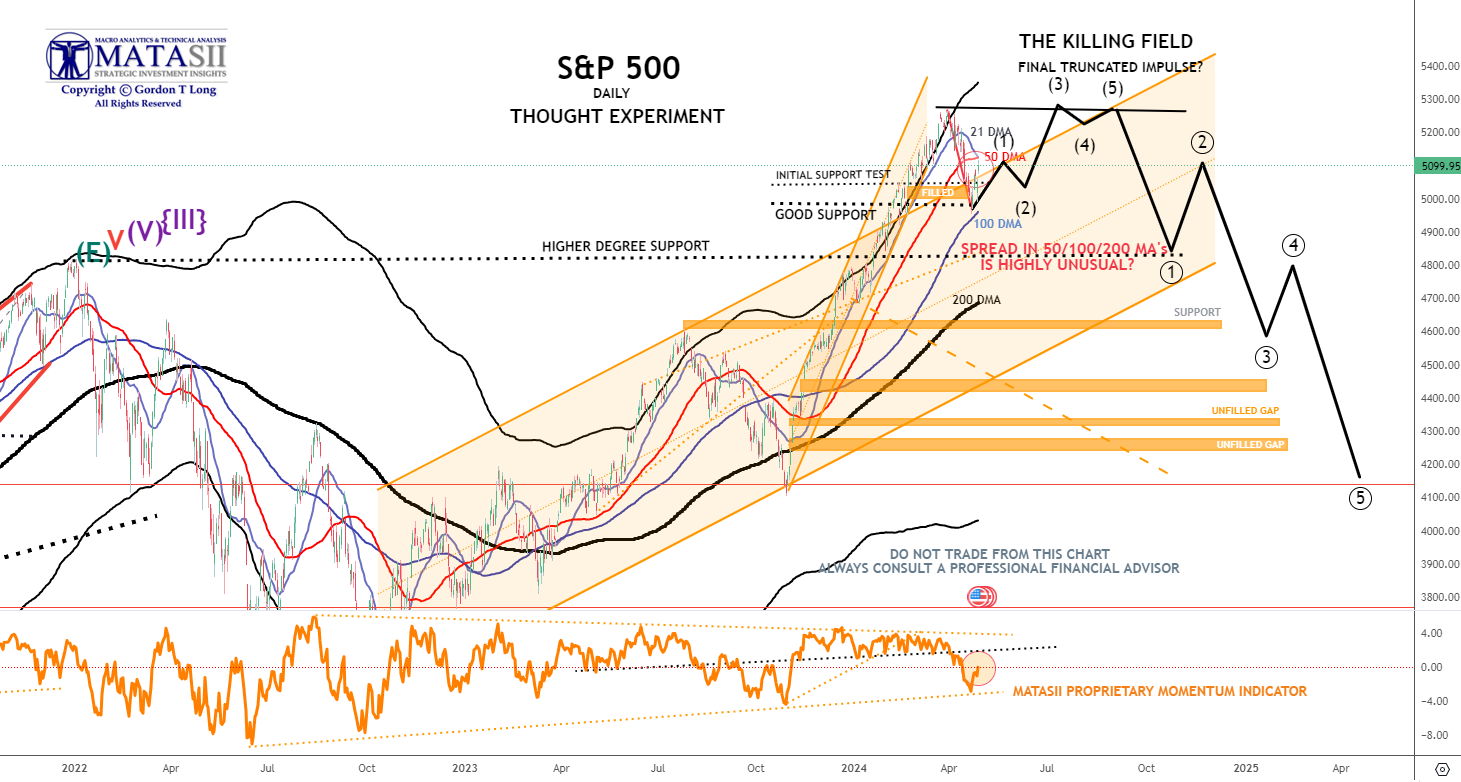
S&P 500 - Daily - Our Though Experiment
CHART RIGHT: So far this is just a "normal" bounce post the sell off. 5150 is key in SPX to the upside. The short term negative trend line comes in there, as well as the 21 day moving average, sloping negatively these days.
Our Though Experiment, which we have discussed many times previously in the way of a projection, suggests we have put in a near term top (or very close to it) and will now consolidate before possibly completing one final small impulse higher OR put in a final Wave 5 of a higher degree.
NOTE: To reiterate what I previously wrote - "the black labeled activity shown below, between now and July, looks like a "Killing Field" where the algos take Day Traders, "Dip Buyers", the "Gamma Guys" and FOMO's all out on stretchers!"
- The S&P 500 found support at its lower 100 DMA before retracing upward to retest the underside of its 50 DMA.
- Momentum )lower pane) also found support at its lower trend support line before retracing towards its upper trend momentum. From a momentum perspective it appears to still have further upside to go.
|  | |
YOUR DESKTOP / TABLET / PHONE ANNOTATED CHART
Macro Analytics Chart Above: SUBSCRIBER LINK
| |
STOCK MONITOR: What We Spotted
| | | |
BOND MARKET
CONTROL PACKAGE
There have FIVE charts we have outlined in prior chart packages that we will continue to watch closely as a CURRENT "control set".
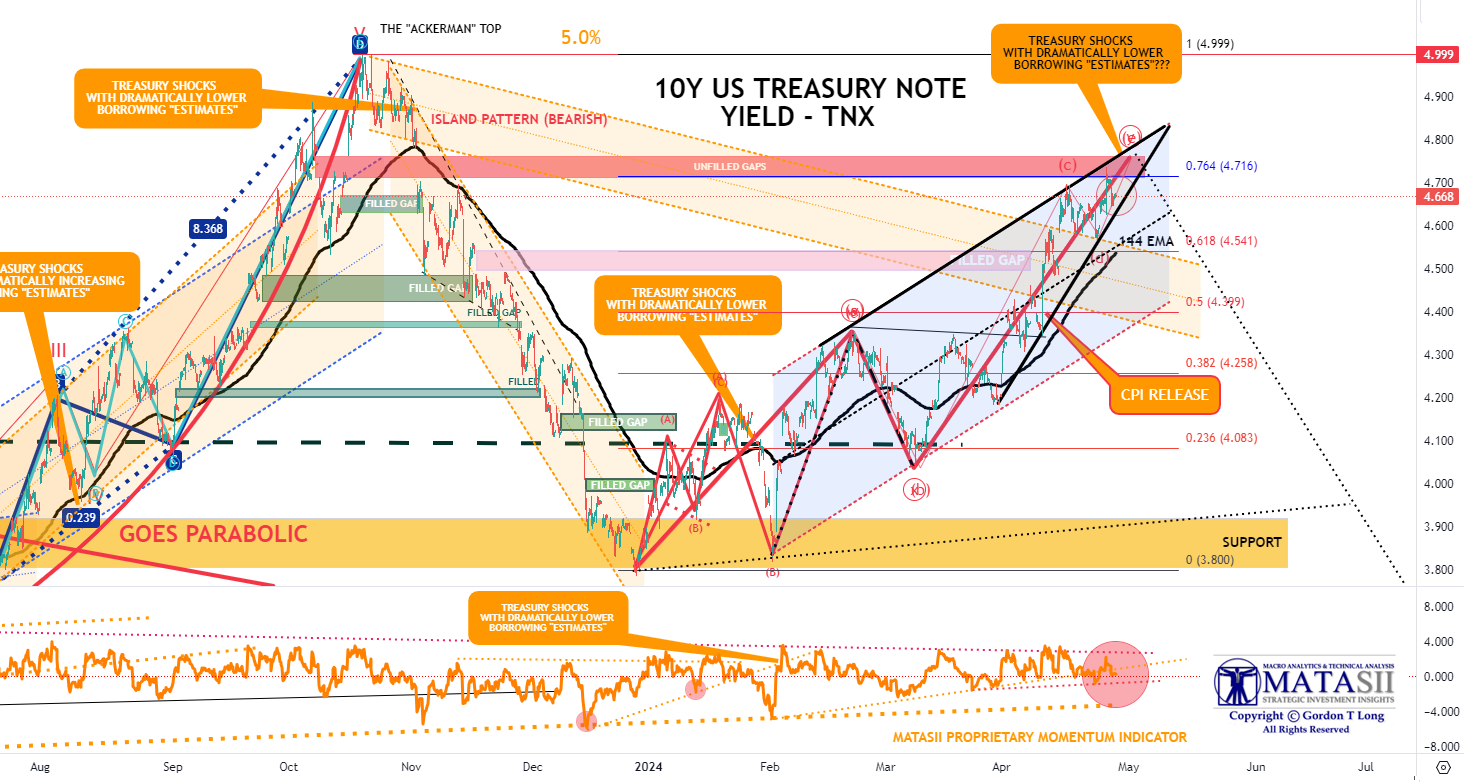
- The 10Y TREASURY NOTE YIELD - TNX - HOURLY (CHART LINK)
- The 10Y TREASURY NOTE YIELD - TNX - DAILY (CHART LINK)
- The 10Y TREASURY NOTE YIELD - TNX - WEEKLY (CHART LINK)
- The 30Y TREASURY BOND YIELD - TNX - WEEKLY (CHART LINK)
- REAL RATES (CHART LINK)
FISHER'S EQUATION = 10Y Yield = 10Y INFLATION BE% +REAL % = 2.438% + 2.247% = 4.685%
THURSDAY 7Y TREASURY AUCTION
- A respectable, albeit not amazing, USD 44bln 7yr auction from the Treasury, stopping on the screws at 4.716%, not as strong as March's 0.8bp stop-through despite the c. 50bps of cheapening since then, albeit better than the six-auction avg. tail of 0.6bps.
- The auction was covered 2.48x beneath the prior 2.61x and avg. 2.57x.
- Dealers were left with 13.9%, more than March's 12.9% but beneath the avg. 15.1%, with the rise in Directs to 21% from 17.4% offset by the fall in Indirects to 65.1% from 69.7%.
- There were certainly some concerns that the rates volatility after the hot Q1 GDP prices release earlier on Thursday could have seen primary demand step back, but that has not been the case, despite the upside risks to Friday's March Core PCE data.
- Additionally, given the auction settles on April 30th, the offering likely benefitted from some month-end demand, given it is the last coupon auction of the month.
- Note also that next week's QRA is expected to be relatively uneventful, with the Treasury expected to keep coupon auction sizes unchanged.
- The Intermediate term rise in the 10Y TNX Yield appears to be completed with a touch of the 4.76%
- Monday's Treasury upcoming announcement of the size of auctions planned by treasury type and Wednesday QRA schedule of auctions with size will be extremely important to the Treasury market.
- Yellen has every incentive to signal slightly smaller sizes to the market now that she has taken the TGA to $1Trillion in size.
|  | |
YOUR DESKTOP / TABLET / PHONE ANNOTATED CHART
Macro Analytics Chart Above: SUBSCRIBER LINK
| |
NOTICE Information on these pages contains forward-looking statements that involve risks and uncertainties. Markets and instruments profiled on this page are for informational purposes only and should not in any way come across as a recommendation to buy or sell in these assets. You should do your own thorough research before making any investment decisions. MATASII.com does not in any way guarantee that this information is free from mistakes, errors, or material misstatements. It also does not guarantee that this information is of a timely nature. Investing in Open Markets involves a great deal of risk, including the loss of all or a portion of your investment, as well as emotional distress. All risks, losses and costs associated with investing, including total loss of principal, are your responsibility.
FAIR USE NOTICE This site contains copyrighted material the use of which has not always been specifically authorized by the copyright owner. We are making such material available in our efforts to advance understanding of environmental, political, human rights, economic, democracy, scientific, and social justice issues, etc. We believe this constitutes a ‘fair use’ of any such copyrighted material as provided for in section 107 of the US Copyright Law. In accordance with Title 17 U.S.C. Section 107, the material on this site is distributed without profit to those who have expressed a prior interest in receiving the included information for research and educational purposes. If you wish to use copyrighted material from this site for purposes of your own that go beyond ‘fair use’, you must obtain permission from the copyright owner.
========
| |
IDENTIFICATION OF HIGH PROBABILITY TARGET ZONES | |
Learn the HPTZ Methodology!
Identify areas of High Probability for market movements
Set up your charts with accurate Market Road Maps
Available at Amazon.com
| |
The Most Insightful Macro Analytics On The Web | | | | |