FAIR REPRESENTATION & REDISTRICTING
FOR NEW YORK STATE GRANTMAKERS
|
|
In 2018, the New York Community Trust announced the creation of a pooled fund to work on a complete count for census 2020 and fair redistricting. Counting individuals is important to ensure New York receives its fair share of federal resources to support vital community programs and infrastructure. At the same time, ensuring all New Yorkers have fair representation is equally as important. Just like census, redistricting is part of the democratic process to ensure that communities are fairly represented.
If you want to learn more about how your foundation can engage in this work or if you have grantees looking for resources, networks, and connections, please contact us.
|
|
A Year In Review of the
New York State Census Equity Fund
|
|
And at the same time, we began focusing on understanding the process for fair redistricting and how philanthropy could support a fair and transparent process. In the summer, the Fund provided grants to key local statewide organizations engaging diverse communities in the redistricting process that prioritized public education and mobilization, advocacy, and documenting, assessing, and suggesting revisions to the State's redistricting commission's procedures for 2031.
We are grateful to the following grantees for their leadership and partnership in the redistricting process:
- CUNY Mapping Center
- New York Civic Engagement Table
- NY League of Women Voters
- MinkWon Center for Community Action
- Yemeni American Merchant Association
- New York Law School
As our work progressed, we relied on our national partners to help support other critical partners in New York. We are grateful to the following organizations for their continued partnership in advocating and supporting fair redistricting reforms:
- New York Immigration Coalition
- Common Cause New York
- Make the Road New York
What's in Store for 2022?
In 2022, the Fund will pivot from supporting congressional redistricting to local redistricting efforts. We encourage funders who will support local effort efforts to reach out to the Fund. Also, in 2022, the Fund will release the addendum to the evaluation report that was released in April 2021, which seeks to analyze the self-response census data the Bureau released in September and look at the Fund's grantmaking activities.
We want to thank all the Foundation leaders in New York State who have supported census and redistricting efforts to date either through the Fund or through their own efforts. While we know most foundations do not have a separate portfolio for this work, it is critical to ensure our communities have the resources, voice, and political power they are afforded by law. Thank you for your continued partnership! We look forward to working together again in 2022.
|
|
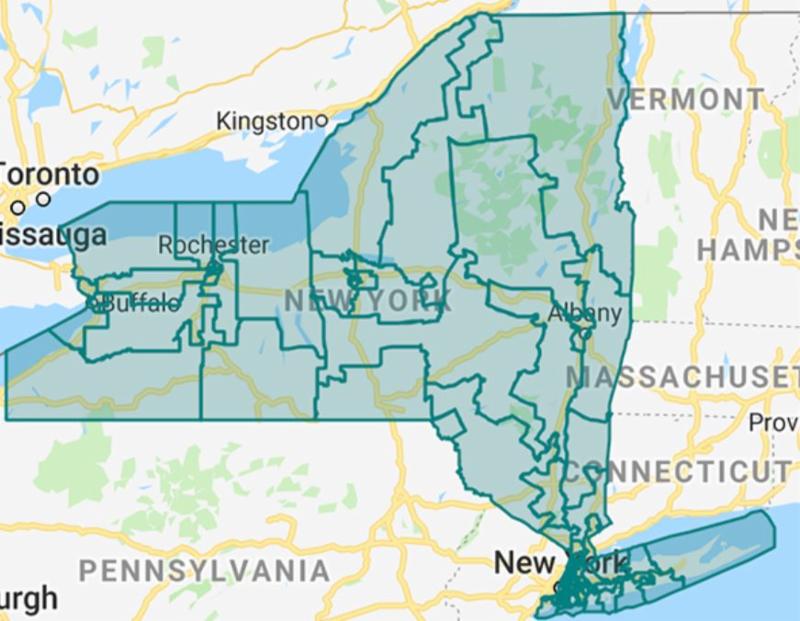
Update from the New York State Independent Redistricting Commission |
|
The New York State Independent Redistricting Commission (IRC) completed the last of its 27 public hearings meetings on December 5th. The Commission held regional meetings over the summer for initial feedback on the map-drawing process. The second round of meetings began in October to solicit feedback on the two maps the Commission released on September 15, 2021. For those that missed the IRC meetings, you can view them here. Now, the Commission is tasked with taking all the information it received over the past several months to develop one set of maps. For more information regarding the New York Redistricting Timeline, click here.
The Commission is scheduled to meet on Monday, January 3rd to review and vote on the congressional, senate, and assembly maps to be sent to the legislature for review. The Congressional deadline for the IRC to submit its map to the legislature is January 15, 2022.
|
|
Update on Redistricting Reform in New York |
|
This past November, New York voters did not support Prop 1, which would have reformed the redistricting processes including:
- Change the vote thresholds for adopting redistricting plans when one political party controls both legislative chambers;
- Require that incarcerated persons be counted at the place of their last residence for redistricting;
- Require the state to count residents, including people who are residents but not citizens, should the federal census fail to do so;
- Remove the block-on-border requirement for Senate districts;
- Cap the number of state senators at 63; and
- Move up the timeline for redistricting and repeal inoperative language.
The following podcast explains what this means for lawmakers and the bipartisan redistricting commission. Jeff Wice, senior fellow, and professor at New York Law School. Listen here
|
|
NATIONAL NEWS
NEW YORK CITY
The New York City Unity Map Coalition Unveils its Maps for New York City
The Unity Map Coalition, comprised of the leading legal voting rights advocacy organizations representing people of color in New York City, unveiled its proposed Senate and Assembly redistricting plans for New York City.
The Unity Map attempts to demonstrate that fair and equitable districts for all New Yorkers are possible, ensuring that all communities, particularly those most vulnerable, have full and fair political power and representation. Click here for more information
|
|
Some findings from the report include:
- Nearly all the state’s largest cities outside New York City (11 out of 12) experienced growth between 2010 and 2020, increasing by a total of 4%. Mount Vernon’s population grew the fastest at 9.8%. Buffalo added the most people (17,039) – an increase of 6.5% – after losing more than half its population from 1950 to 2010. Yonkers grew by 8%, passing Rochester as the state’s third-largest city. Almost all of the state’s smallest cities (10 out of 12) shrank, declining by 3.9%.
- The share of the population reported as white decreased in all classes of local governments. In cities outside of New York City, this group decreased by nearly 12% between 2010 and 2020 and now accounts for just under 51% of the aggregate population.
- Outside of New York City, the number of Black people increased in all classes of local government, with towns experiencing the largest increase, at 9.3 percent. People that identify as Hispanic or Latino increased by almost 28% in cities and villages and 38% in towns. The Asian American population also had significant double-digit growth in all classes of local government.
- The number of occupied housing units in cities outside of New York City grew 3.7% from 2010 to 2020, faster than in towns or villages, but this class also saw a 2% increase in vacant units, so overall city vacancy rates stayed fairly constant.
|
|
|
REDISTRICTING TOOLS TO HELP FUNDERS |
|
CUNY Redistricting & You Interactive Map
This tool developed by the Center for Urban Research at the Graduate Center of the City University of NY (CUNY) will help various stakeholders understand the local implications of redrawing legislative district lines across the country. With support from the NYSCEF, there are specific New York maps. The team at CUNY updates the map regularly with new features and tools - we encourage you to check it out!
New York State Demographic Information
Cornell University’s Program on Applied Demographics (PAD) has posted detailed information with regional charts and a county map showing the state’s population changes from 2010-2020 by county, region, race, and ethnicity. Click here to learn more
Redistricting Report Card
In response to the 2021 redistricting cycle, the Princeton Gerrymandering Project developed this report card as a tool to help the public identify gerrymandered maps. The Redistricting Report Card uses a powerful and unique set of analytics to grade each state’s newly-drawn maps during the redistricting process. Information and new more maps are being added as they are received. Click here to learn more
Census Bureau's Historical Interactive Apportionment Map
The new online mapping tool from the Census Bureau displays 10 decades of appointment and population data. Click here to learn more
Redistricting Data Hub
The nonpartisan Redistricting Data Hub was founded by experts with backgrounds in pioneering redistricting legal cases, the establishment of independent redistricting commissions, and related ballot initiatives in different states. The goal of the Redistricting Data Hub is to provide individuals, civic organizations, and good government groups the data, tools, and knowledge to participate effectively in redistricting processes by learning how to define their communities, provide meaningful public input, recognize gerrymandering, and advocate for fair and legal maps. Click here to learn more
|
|
This email was generated by Engage New York in support of the NYS Census Equity Fund; a pooled fund focused on supporting a fair and accurate census count as well as fair representation in the redistricting process.
|
|
|
|
|
|
|