Chesapeake Times
Technical Review, Issue 7
October 2021
|
|
Letter from the General Manager
This time of the year, we go from wearing costumes to wearing ugly holiday sweaters, from carving pumpkins to carving turkeys and counting down the seconds till we start all over again next year. However, before we get to Auld Lang Syne, I still have a few things to do around here. With three months to go, the team is busy at work going through the list of features. A common theme I heard this year is the transition to automation, to make the processing faster with less interaction. We’re working on that, and more.
I also use this time of year to reflect on what we have done in 2021. Since January, we made over 300 updates to the program. We added new tools to our program, updated others, and fixed those that just didn’t work. But most of all, we continued to support our clients in the field, as the survey work never stops.
In the movie, the Adventures of Buckaroo Banzai, the hero Buckaroo tries to stop aliens from the 8th dimension. (Physics aside, it’s a movie). I look at the movie as a venture into something not done before. At Chesapeake, we also venture – to think outside the box, to give our clients something different, unique, or in many cases, a solution to make their survey work a bit easier. Our roadmap for 2022 is filled with projects that continue to make the software better. And although we stop at the third dimension, who knows, one day we can try to get to the eighth.
Over the next few months - and before the singing starts - we will have a new release with the updates to handle language translations. The Unicode work is done, and programs have all been converted over. Updates to processing, to our drivers, and our utilities are part of the changes, and you’ll read about some of them in the newsletter.
I also want to invite everyone to our Winter training event, to be held on December 13-16 in Charleston. We made a few changes to the training, with a new schedule and afternoons with our partners and boats, and added a pre-class day for new users, called SonarWiz101. There is more information about it in the newsletter and online.
Enjoy the newsletter. And hope to see everyone in Charleston!
- Harold Orlinsky, General Manager
|
|
New Features and Technical Notes
Creating a GeoTIFF From an Online Basemap ...... Christopher Favreau, CTO
Quick Survey Time Estimation ................................ Jonathan Fleetwood, Engineer
Creating Single-Band GeoTIFFs of Sidescan Data David Finlayson, Chief Scientist
Mind the Gap – in Sidescan .................................... Harold Orlinsky, General Manager
Updating Support & Docs to the 21st Century ........ Patrick Zynda, Support Engineer
SonarWiz December 2021 Training Event .............. Ashley & Stephen, Sales/Marketing
|
|
Creating a GeoTIFF From an Online Basemap |
|
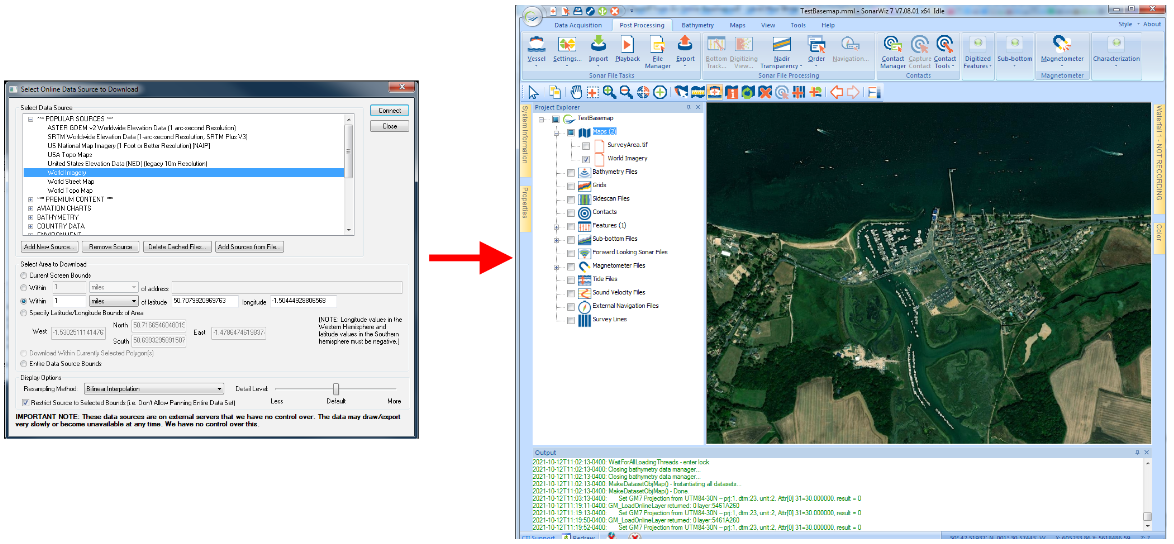
SonarWiz contains many individual capabilities. This alone makes it powerful software. These capabilities can be combined in various ways to extend that functionality. In this article I will go over one such use where I will configure an Online Basemap and then convert it to a GeoTIFF Basemap.
In SonarWiz, a Basemap is a raster or vector map that is shown on the Plan View behind the sonar and other imagery. SonarWiz has many types of maps that it can use as a Basemap. The Online Basemap option will download the satellite image from an online database. While SonarWiz does store the map for offline use, it does not store it with your project. It will not open on another offline computer. In addition, it is more efficient and convenient to use a GeoTIFF as a Basemap.
Creating a GeoTIFF from a Basemap consists of 3 simple steps. Each one uses a different SonarWiz tool or capability.
Add a Basemap
Using the Map Manager in SonarWiz I added a Basemap to the project using the online World Imagery source and selected to download the area within 1 mile of the Latitude/Longitude coordinates of the project.
|
|
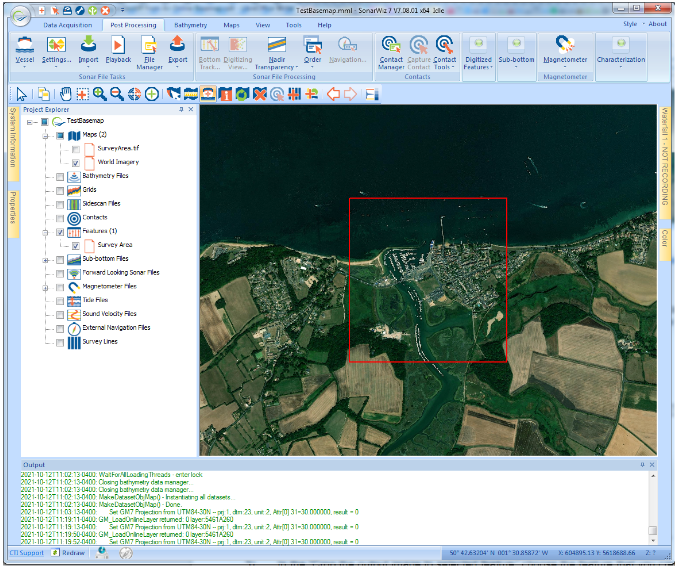
Create a Digitized Feature
SonarWiz has the ability to create highlighted areas we call Digitized Features. These can be used for many purposes. In this instance I used a rectangular Digitized Feature to outline the survey area by clicking and dragging the rectangle in the Plan View area. The rectangle size and orientation can be modified after it is initially created using the mouse.
|
|
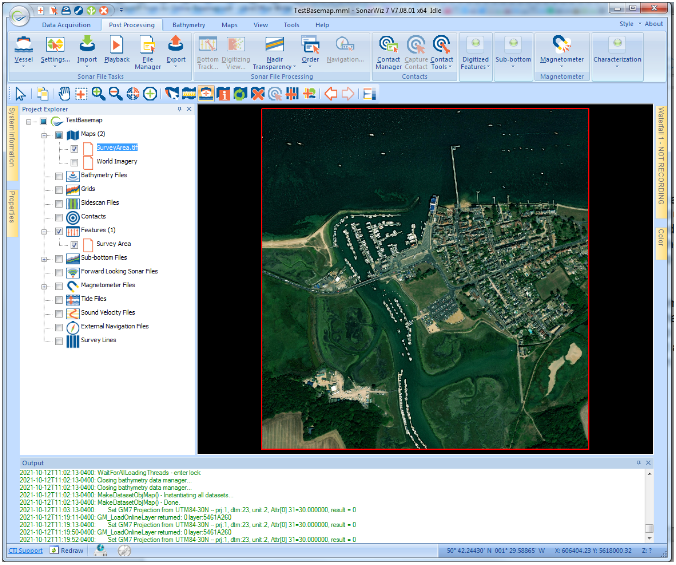
Export the GeoTIFF
For this final step I used the Save Project as GeoImage tool to create a GeoTIFF that is cropped to the rectangular Digitized Feature. It makes it easy to only include the Basemap imagery that I need. Usually the Save Project as GeoImage tool is used for exporting mosaicked sonar imagery. However, it can be used to export any data shown in the Plan View to a GeoTIFF file. This makes it useful for converting data of all kinds to GeoTIFF images which then can be used in SonarWiz or other software easily.
|
|
- Christopher Favreau, CTO |
|
Quick Survey Time Estimation
There are a handful of tools in SonarWiz, that, together, can help you make quick work of putting together a survey time estimate.
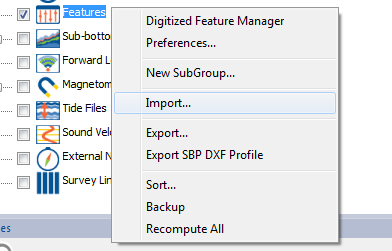
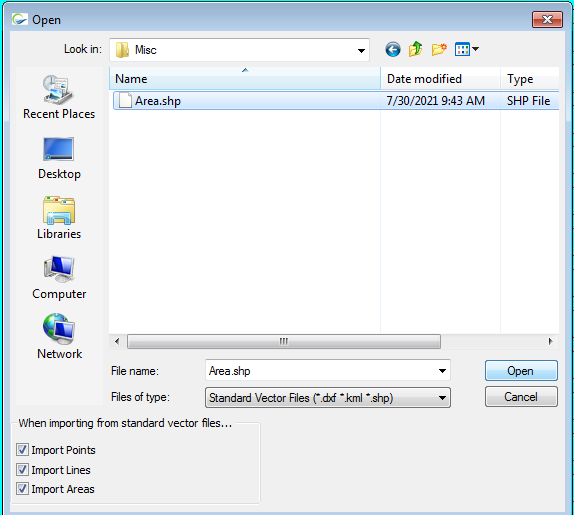
After creating a project in the intended location/zone, create or import a closed polygon feature matching the area to be surveyed. In this example I'll import a 1.8km x 1.9km rectangle from a shapefile; if no vector representation of the area is available, making a closed polygon feature by hand will do for a quick estimate.
Right-click the Features node of the Explorer tree and select "Import..." to open the feature import window:
|
|
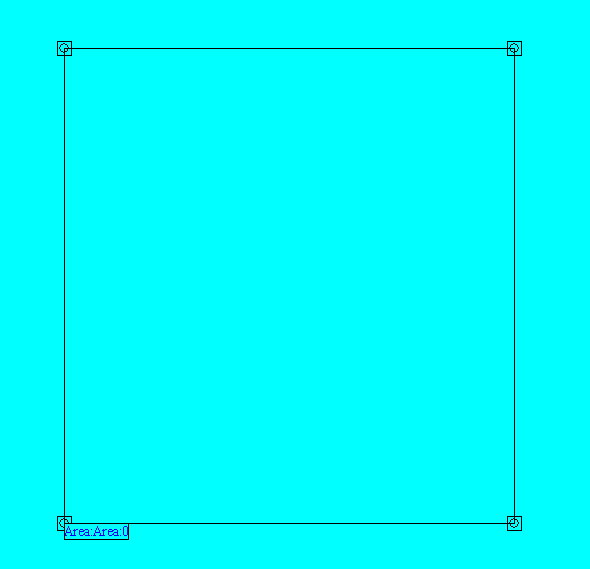
In this case, I've chosen a shapefile containing just one rectangle, resulting in a feature that looks like this: |
|
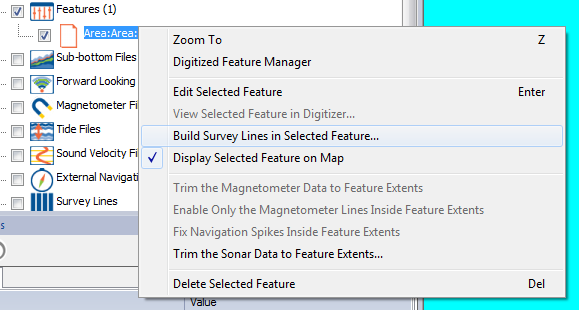
Right-click the new feature in the Explorer tree and select the "Build Survey Lines in Selected Feature..." menu item. This will invoke a tool that will let you fill a polygon with survey lines of a given spacing and orientation: |
|
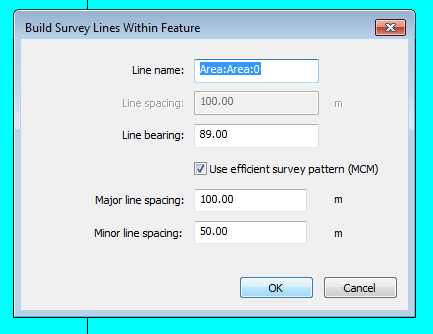
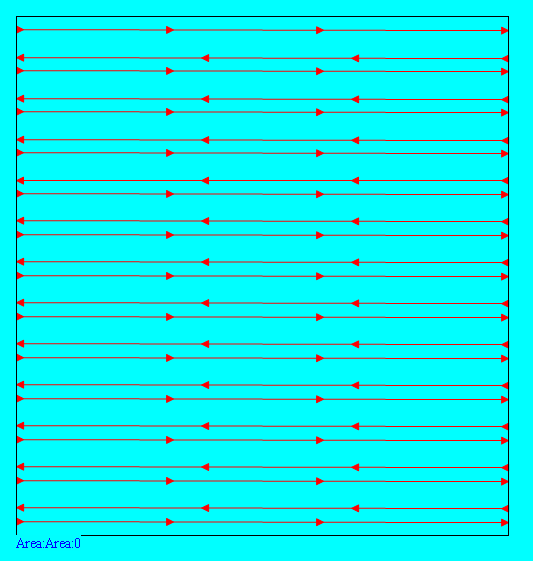
Here, SonarWiz will fill the area using the efficient survey pattern (see Patrick's article from the Times, issue four), running approximately east-west lines. I've nudged the bearing by a degree to account for the grid convergence angle at this location, to better match the orientation of the lines with the feature they're filling. Accepting these values produces a set of survey lines like this: |
|
|
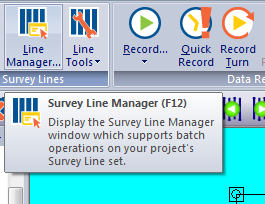
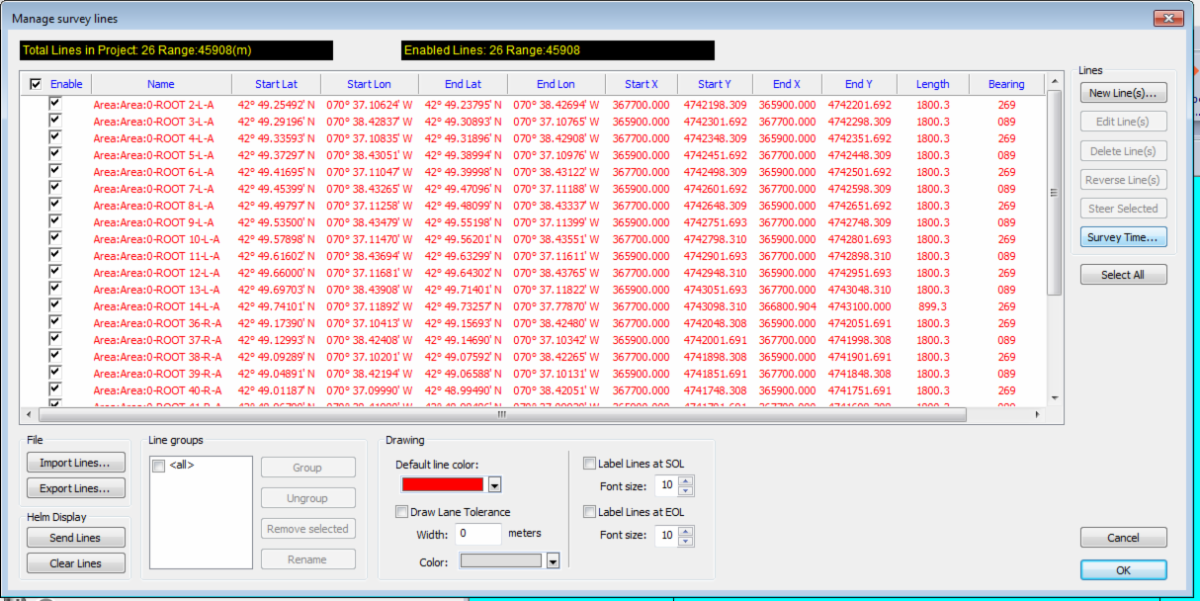
From the Data Acquisition toolbar, launch the survey line manager window: |
|
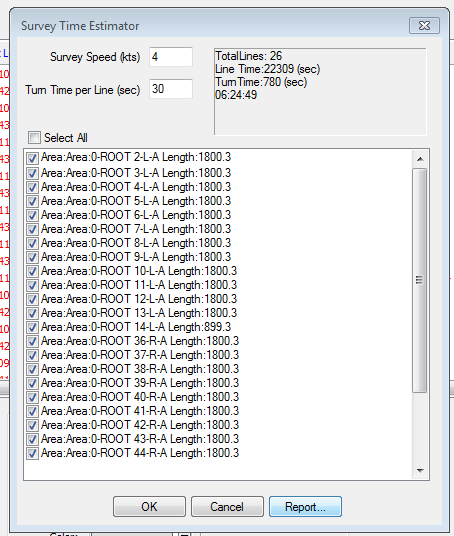
Click the "Survey Time..." button near the right edge to bring up the survey time estimator: |
|
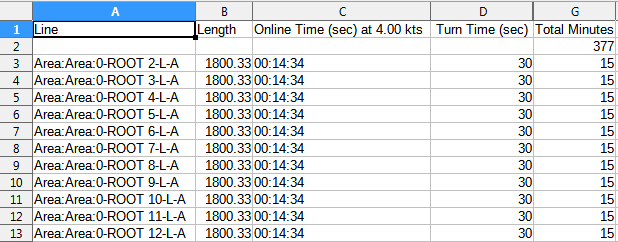
Here, I've chosen a speed of four knots, having determined that there's sufficient along-track resolution at that speed. Turning time between lines is estimated at 30 seconds. Clicking the "Report..." button at the bottom of the window will write out a CSV file with survey time estimates per line. A little spreadsheet formula work gives us an overall estimate of 377 minutes - around six and a half hours to cover a bit less than four square kilometers. |
|
That's all there is to it. In just five minutes or so, I've got a rough estimate of the time it would take to cover this area, and by repeating the last couple steps, I can do the same for varying speeds. Further, I've got a working set of survey lines to use with SonarWiz's realtime and helm display tools when on the water.
- Jonathan Fleetwood, Engineer
|
|
Creating Single-Band GeoTiffs of Sidescan Data |
|
What is a Vertical GeoTIFF??
GeoTIFF is a public domain metadata standard which allows georeferencing information to be embedded within a TIFF file (Wikipedia). Normally, the GeoTIFF format is used for geo-referenced images, where each pixel in the TIFF represents a color to display at a specified geographic location. The metadata in the TIFF encodes the geospatial information needed to render the image at the appropriate location on the earth. SonarWiz offers extensive support for exporting seafloor imagery in this format.
More recently, GeoTIFFs have been used to encode physical measurements rather than just imagery. For example, you can use a GeoTIFF to encode elevation data or seafloor amplitude information. In this format, the GeoTIFFs are serving as a raster or grid. The advantage of the GeoTIFF-as-raster format is that it is non-proprietary and the georeferencing information is well defined and embedded in the file itself. In SonarWiz, we refer to these types of GeoTIFFs as “Vertical” GeoTIFFs, to distinguish them from conventional image GeoTIFFs.
The current version of SonarWiz can convert any Grid into a “Vertical” GeoTIFF, that is, if you have a grid of bathymetry, you can convert it into a sing-band GeoTiff encoding the elevation data, or likewise, if you have a grid of sidescan amplitude data, you can convert that into a single-band GeoTIFF encoding the backscatter values.
Creating a single-band GeoTiff of sidescan data
An interesting example is to convert a sidescan mosaic into a “Vertical” GeoTIFF. This will create a single-band TIFF file where the pixel values encode the actual backscatter values instead of the mosaic colors as they are displayed in SonarWiz. At the end of the example, we will show the use of QGIS to offer more control over the bit-depth of the output TIFF.
|
|
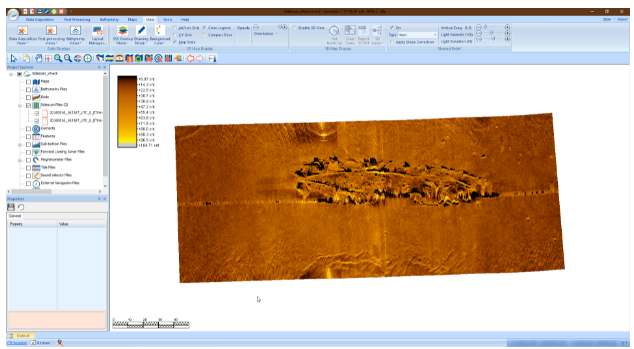
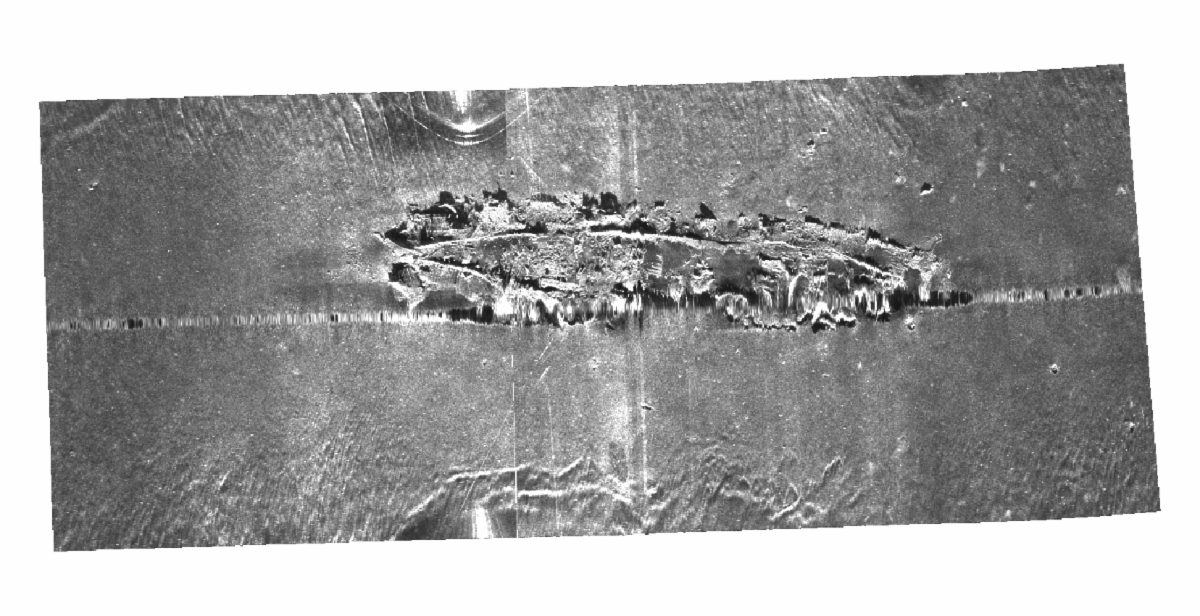
Figure 1: Sidescan mosaic of a shipwreck |
|
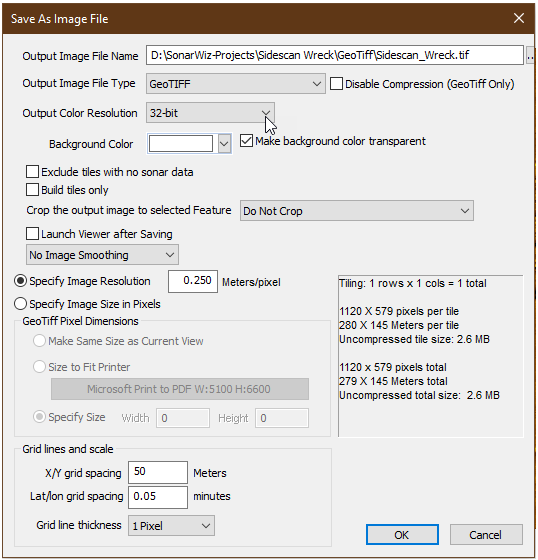
The dataset consists of two sidescan files that have been fully processed in SonarWiz (Figure 1). To create a conventional GeoTiff of this mosaic, we use the Save Project As GeoTIFF utility in the Post Processing Ribbon. This utility gives us a number of options for GeoTIFF output including setting the bit depth from 8-bit to 32-bit (Figure 2). No matter which option you choose, the GeoTIFF will always be a picture of the sonar data, not the data itself. That is, each pixel will contain the color of the data exactly as it was displayed in the main window. This is NOT a vertical GeoTIFF.
|
|
Figure 2: The Save Project As GeoImage command stores a picture of the data in the GeoTiff, not the data itself. |
|
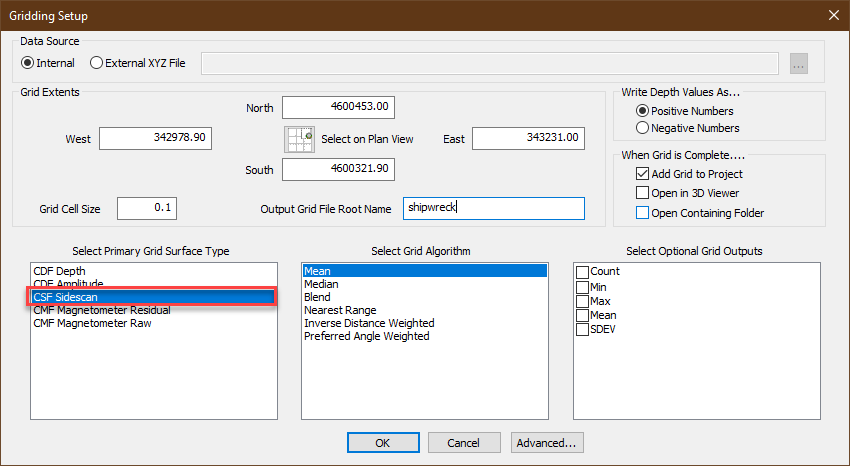
To create a Vertical GeoTIFF we need to first create a grid of the sidescan data. Right click on the Grids branch in the Project Explorer and select the Create a New Grid command. This opens the Gridding Setup dialog (Figure 3). Set the data source to Internal, specify an appropriate cell size for your data and pick CSF Sidescan as your Grid Surface Type. There are several different gridding algorithms available.
|
|
Figure 3: The Gridding Setup dialog used for gridding sidescan data |
|
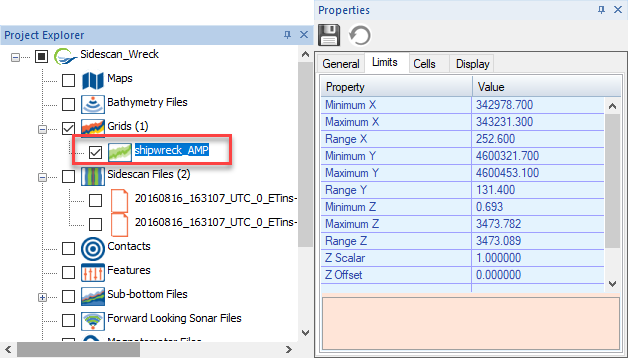
Once the grid is created, it will appear in the Grids Branch of the project Explorer (Figure 4). If you select the grid you can see the grid limits in the Properties window. In our case, our sidescan amplitude is the Z value of the grid and ranges from a minimum value of 0.693 to a maximum value of 3473.089. |
|
Figure 4: Grid of sidescan data appears in the Project Explorer and Properties window |
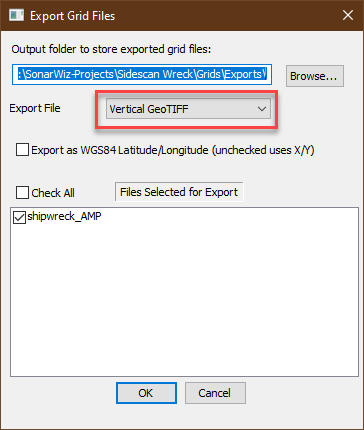
The final step is to export the grid as a Vertical GeoTIFF. Right-click on the grid and select the Export Grid As… command. There are many export formats available, we are interested in the Vertical GeoTIFF option as shown in Figure 5.
|
|
Figure 5: Export the sidescan grid as a Vertical GeoTiff |
|
Comparing a regular GeoTIFF to Vertical GeoTIFF
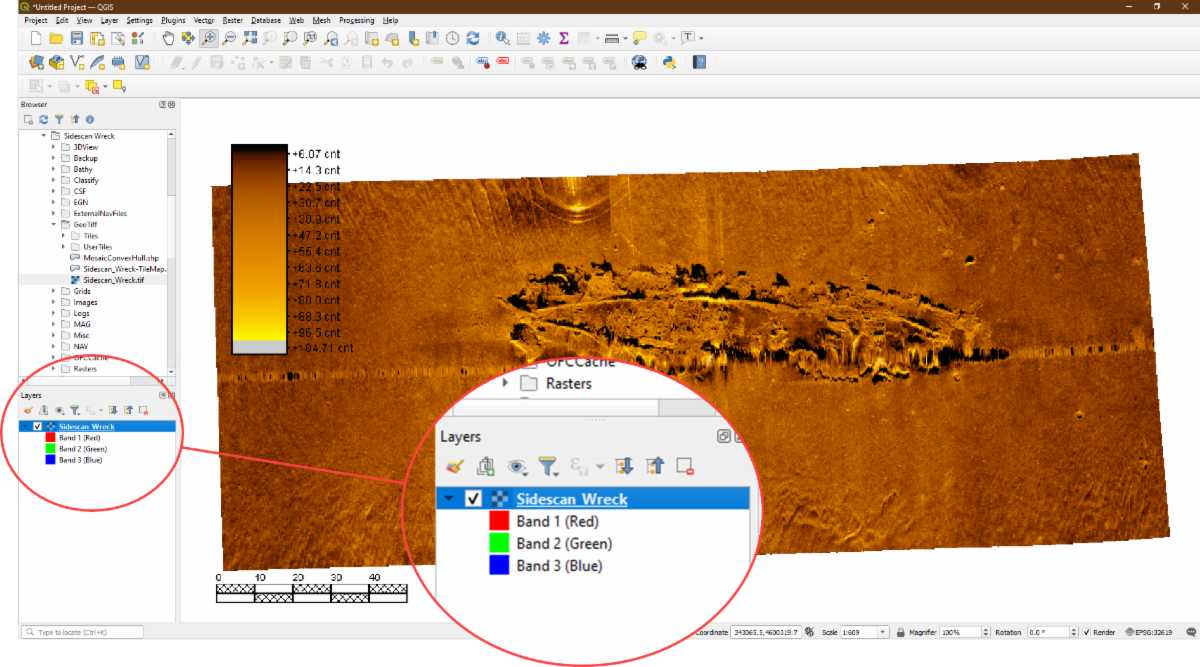
You can compare the difference between a regular (image) GeoTIFF and a Vertical GeoTIFF in QGIS. When we load the tiff exported by the Save Project as GeoImage command in SonarWiz, the tiff comes in as an 8-bit, 24-bit or 32-bit color image. In this example, the TIFF was exported as a 32-bit TIFF where band 1 represents the red color, band 2 represents the green color, band 3 represents the blue color and band 4 represents the alpha channel (transparency) (Figure 4). Notice that the image looks good out of the box using the exact color scheme we had set in SonarWiz, including all of the map decorations such as a scale bar and color legend. This is because the GeoTIFF exported by the Save Project As GeoImage command exports a picture of our mosaic, not the raw sidescan data itself.
|
|
Figure 6: Regular GeoTiff exported with Save Project as GeoImage command exports a 3-band tiff with band 1 representing Red, band 2 representing green and band 3 representing blue. Band 4, not shown has the alpha (transparency) channel |
|
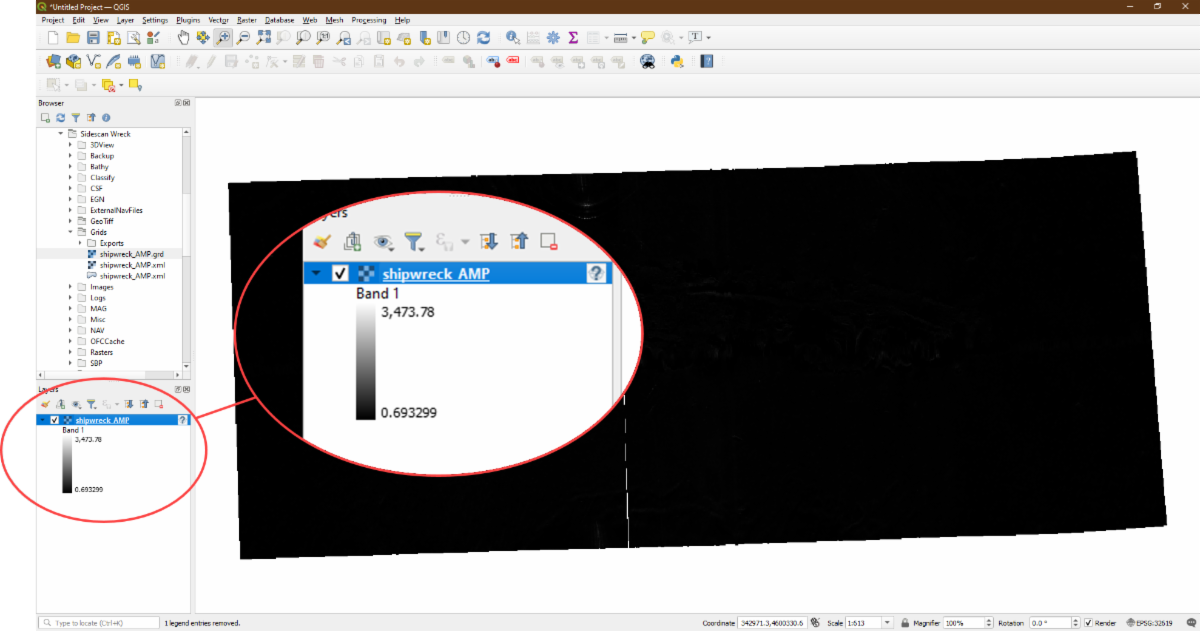
In contrast to this, if we open the Vertical GeoTIFF we exported from the Grid, the TIFF loads as a single band raster, where band 1 ranges from 0.693 to 3473.78. These are the exact amplitude values of our sidescan grid created above. In other words, the amplitude data was loaded, not a picture of the data. The image is washed out because it has not been properly rendered (yet). You will have to color the data using your GIS color settings settings, not SonarWiz. This is easily done as shown in Fig. 8. |
|
Figure 7: Vertical GeoTiff of exported sidescan data created by exporting a grid to a Vertical GeoTiff |
|
Figure 8: QGIS rendering of single-band GeoTiff above after modifying the color map. |
|
Controlling the Bit-Depth of Exported Vertical GeoTIFFs
When you export a grid as a vertical GeoTIFF, SonarWiz automatically selects the bit depth to contain your data without truncation. Usually, SonarWiz selects a 16-bit storage because most sidescan data are 12-bit or 24-bit these days. If you instead need an 8-bit image, you can easily convert the data in QGIS using the Translate command found under the Raster > Conversion menu.
- David Finlayson, Chief Scientist
|
|
Figure 9: QGIS Translate command can be used to convert a 16-bit TIFF to an 8-bit TIFF |
|
Mind the Gap – in Sidescan |
|
The traditional sidescan system with port and starboard channel have the inherent “space” between the channels when viewing the data. Once bottom tracked, the two sides get stretched to form a filled area. However, the imagery at and close to nadir is never ideal; identifying targets are difficult, and any shadows from them would be small. Standard operation would be to run additional sidescan lines offset from the original line, with good imagery to fill in the data at the nadir area. A decent solution but one that comes with a penalty. A full survey line needs to be run to fill an area that might be just 10 meters wide (based upon the height of the towfish).
Another option has been to fit an extra Forward Looking Sonar, usually to the nose of the towfish, but the oblique angle of the FLS data versus the standard sidescan typically makes for issues when blending the two data sources into one overall data mosaic. Two recent solutions have been proposed: Klein’s MAX-View 600 and EdgeTech's 2205 system. Chesapeake has been able to process these files to add in the gap data between the two sides. What’s interesting is that the two sonars use a different technology and methodology to accomplish this feat, as they both solve the gap problem.
The latest innovation from EdgeTech is the ability to see the nadir gap from both the left and right sides, providing shadows from either direction, as well as in a three- dimensional aspect in the nadir gap. In the EdgeTech Gap-Fill, the shadows are perpendicular to the vehicle’s path and consistent with traditional side scan methods, enabling easy interpretation of data. The gap fill data in the 2205 system is coincident with the side scan data and is therefore geospatially the same.
Along the way, SonarWiz had to be modified to handle the extra data. In the next release, changes to CH5-CH6 have been added. This provides file specific options for JSF files and a new way to blend these multiple channels when they overlay one another. The last point allows the user to have the traditional sidescan data, add in the gap data, and see a nice, nearly seamless merge with the two overlaps. There is no sense adding in a gap fill with a noticeable area where they overlap a lot.
I also found a few subtle tools to make the combined image look like a single filled swath. From the original data, bottom track as normal. But then, remove the small nadir region (3 – 4 meters), to totally clear out the data. Since we have overlapping data, we will fill this in with the other channels.
|
|
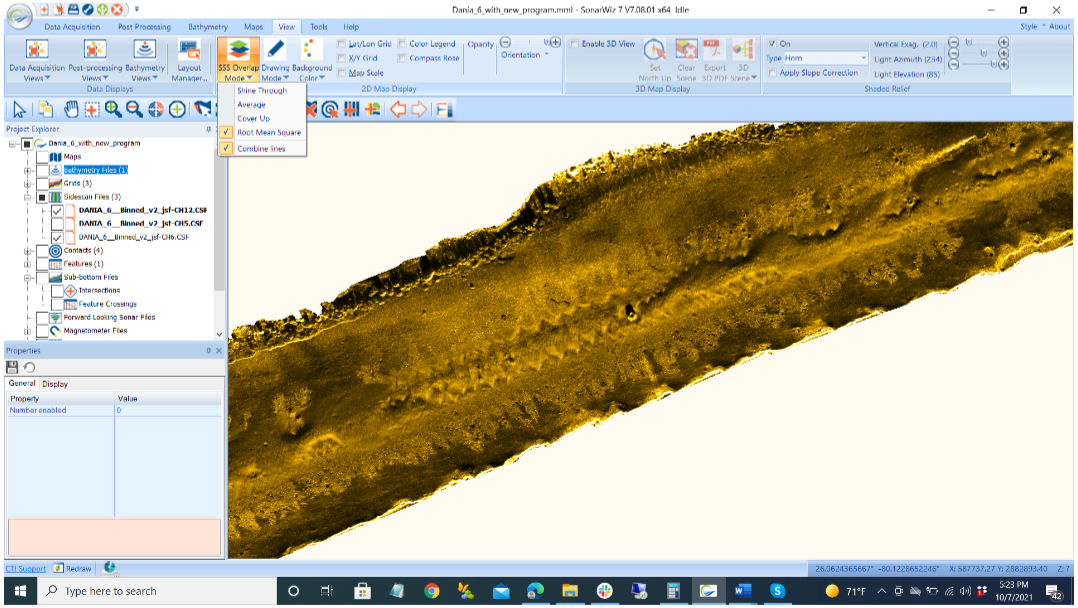
Next, we import the gap fill channel. For the EdgeTech, CH5 is the port side looking towards starboard, CH6 is the starboard side looking to port. They have the same footprint, but we can see the shadows will appear differently on the two.
With the new overlay method “combined”, all files enabled will be blended with the algorithm selected. I like RMS, but give the others a try, and see which one works best for you. What’s really great for the overall mosaic, is that EdgeTech have cleverly managed to propagate the signal intensity in the Gap-Fill results, so alongtrack the Gap-Fill result matches the traditional sidescan as the signal intensity changes with the varying seabed type/material.
CH1-CH2 and CH6 data. Note the tire at center, which was at nadir of the sidescan.
|
|
The idea of the gap fill is not just to fill the area at nadir, but to allow for targets to be easily visualized and measured. For that, we need shadows.
I identified two near nadir targets using the gap fill line, marking each with a point feature (in yellow). Overlaid on traditional Sidescan CH1-2, these would be hard to pick out and even harder to measure. Note one target is right at nadir and would be missed.
|
|
|
|
Traditional Sidescan Line: |
|
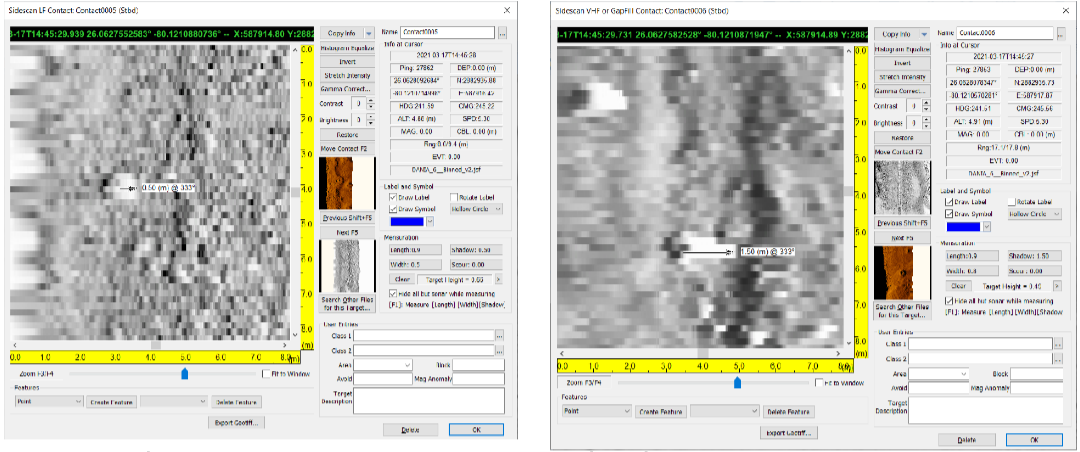
Measuring targets from both data sets, they are 50cm in height. However, the gap fill line had a larger shadow to work with.
Target from CH1-2 line
|
|
Traditional Sidescan Data |
|
|
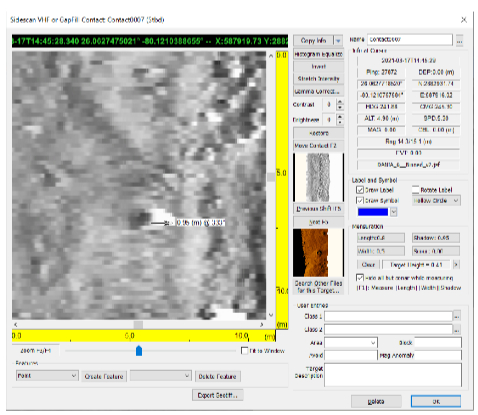
What’s more impressive is the target right at nadir. It is indistinguishable in the traditional sidescan data. However the gap fill showed a clear target with a shadow, so that we can identify a 40cm tall rock. |
|
|
|
This advantage of adding extra data during the same survey line will make survey work go faster, minimizing the total survey lines needed for full coverage.
In London, when riding the tube, we are always aware of the Mind the Gap announcement. With these gap fill sonars, we are now "Filling the Gap."
|
- Harold Orlinsky, General Manager |
|
Updating Support and Documentation to the 21st Century
|
|
Some of our legacy users can remember 20+ years ago when contacting the support team for then “SonarWeb” (the long-ago predecessor of SonarWiz) was simply giving John Gann a ring on his personal number. Over the past few years our goal has been to update our support systems so that our customers can have access to fast and knowledgeable assistance on not just SonarWiz but the industry as a whole.
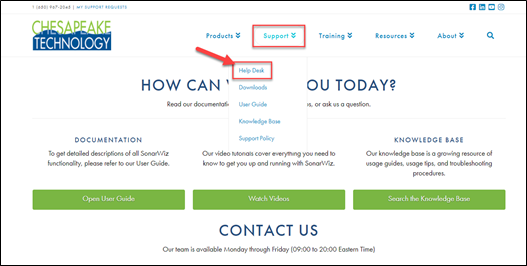
After moving our online support desk over to JIRA in 2018, we have now begun to move our Knowledge Base of documentation over to its linked system Confluence. You can find a link on our website here:
|
|
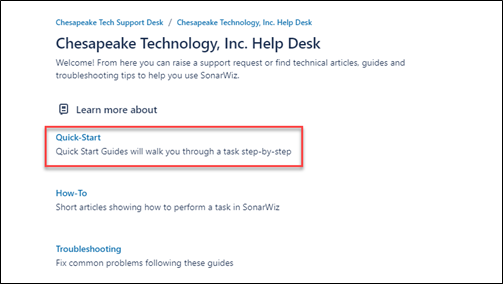
The front page of the help desk breaks down the articles into 5 sections:
Quick Start: for new users; offer a basic step-by-step guide to each of the post processing modules in SonarWiz.
How-To: how to perform specific outputs or actions in SonarWiz like creating coordinate systems or loading S-57 charts.
Troubleshooting: how to resolve common issues that our customers see in SonarWiz
Technical Notes: information about system requirements, supported interfaces and other technical documentation about SonarWiz.
Change Log: our release notes for each version of SonarWiz.
|
|
Our goal is to have a complete library of guides and articles as a resource for our customers. Our SonarWiz User Guide (which comes downloaded with SonarWiz) can still be used as a resource for what a function or button does in SonarWiz, but the Support Desk will contain more step-by-step guides.
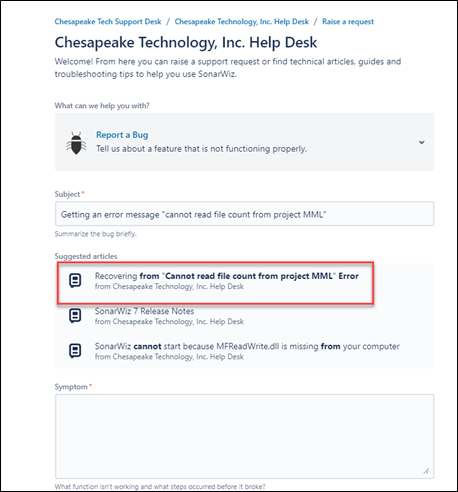
With our Knowledge Base being linked to our Support Desk, you should start to see recommended articles appear when writing into our support team. Although we try to get back with you as soon as possible, sometimes the answer to your question or error message is just a few clicks away!
|
|
|
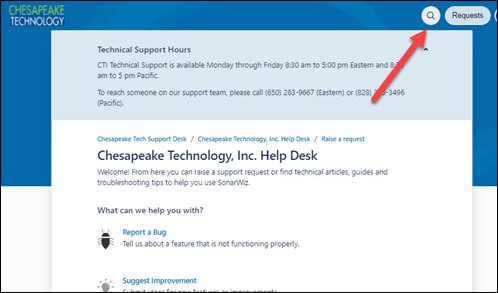
If you are writing into our JIRA support desk when our team is out of the office (17:00 PDT to 8:30 EST) we recommend using the search function to make sure none of the key words indicate an article that might be helpful. |
|
You, our customers, are the reason SonarWiz is still leading the way in the Marine Surveying industry after 20 years. As the industry evolves, we will strive to find systems to meet your needs. Please continue to reach out and let us know how we can improve our customer experience. |
|
- Patrick Zynda, Support Engineer |
|
SonarWiz December Training Event |
|
This year, we're excited to be back in person for our Annual SonarWiz training event on December 14-16 at the College of Charleston. Get the most out of the event with additional sessions on the Monday prior to the class. Visit with our partners during breaks and after class in the atrium, and participate in on-the-water demos at the dock, just a 10-min walk from the school. Each day will include a short lunch break, and end by around 3 to allow time for those activities.
A tentative schedule is as follows:
Monday, December 13:
- 9am - 1pm - EdgeTech + Chesapeake dual workshop
-
2pm - 5pm - EdgeTech 6205, 3400, 4125 live demo of onboard ECHO-81 vessel
- 1pm - 5pm - Intro to SonarWiz: program basics for beginner users
Tuesday, December 14:
- 9am - 3pm - Class. Pre-registration at 8am
- 3pm - 5pm - Meet with partners, boat demos, one-on-ones
-
5pm - 7pm - Evening Reception in Atrium
Wednesday, December 15:
- 9am - 3pm - Class
- 3pm - 5pm - Meet with partners, boat demos, one-on-ones
- 5pm - Evening Social, sponsored by SES
Thursday, December 16:
- 9am - 3pm - Class
- 3pm - 4pm - Meet with partners, boat demos, one-on-ones
Accommodations
We have blocked rooms at a discounted rate at the Francis Marion Hotel, just around the corner from the college. King or Double rooms are available for $149/night here or with group code: CHESAPEAKETECH21
|
|
The class will also be adhering to the following COVID Safety Guidelines:
- We encourage all in-person attendees to be vaccinated
- Face coverings in indoor public settings strongly recommended, regardless of vaccination status
- Masks will be provided, as needed
- Hand sanitizer stations will be located throughout the facility for your use
- Approved food and beverage preparation and service procedures will be followed for the health and safety of all attendees.
- Attendees are requested to confirm that they are not displaying any symptoms of COVID-19 and have not recently been exposed to anyone who tested positive. If you do have symptoms or have been exposed, your registration fee will be refunded or applied toward another event
|
|
We hope you can make it and look forward to seeing you there. |
|
- Ashley Chan & Stephen D'Andrea, Sales and Marketing |
|
Privacy Notice: Your email address (and other personal information, if applicable) is being used to fulfill your request to receive newsletters from CTI. Use is subject to CTI’s Website Privacy Policy. CTI complies with the EU's GDPR laws. Continued reading of the newsletter is implicit acceptance of our Policy, and you may unsubscribe at any time using the link below.
|
|
Your copy should address 3 key questions: Who am I writing for? (Audience) Why should they care? (Benefit) What do I want them to do here? (Call-to-Action)
Create a great offer by adding words like "free" "personalized" "complimentary" or "customized." A sense of urgency often helps readers take an action, so think about inserting phrases like "for a limited time only" or "only 7 remaining!"
|
|
|
|
|
|
|
|
|