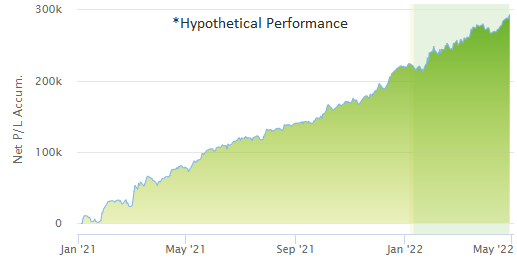
System of the Month:
Algo beta2.2 intraday NQ E-mini Nasdaq
|
|
Many traders choose to diversify their portfolios with algorithmic trading systems. The following system has been selected as the broker's choice for this month. |
|
REQUIRED CAPITAL: $8,700*
PRODUCT: E-mini Nasdaq future
SYSTEM TYPE: Intraday
COST: $550 / month
COMMISSION: $7.50 per side
|
|
|
The performance shown above is hypothetical in that the chart represents returns in a model account. The model account rises or falls by the average single contract profit and loss achieved by clients trading actual money pursuant to the listed system’s trading signals on the appropriate dates (client fills), or if no actual client profit or loss available – by the hypothetical single contract profit and loss of trades generated by the system’s trading signals on that day in real time (real‐time) less slippage, or if no real time profit or loss available – by the hypothetical single contract profit and loss of trades generated by running the system logic backwards on backadjusted data.
|
|
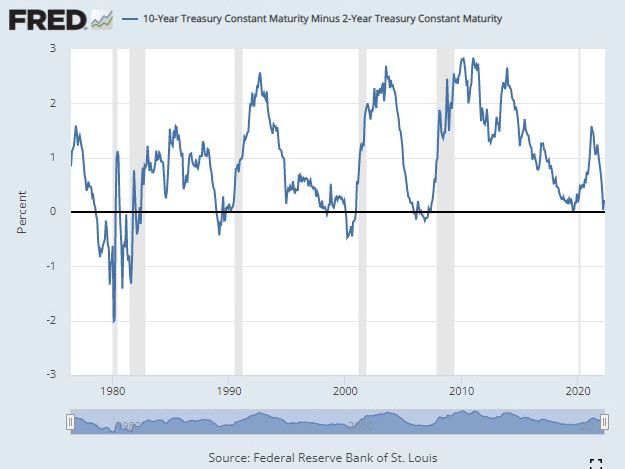
What Does An Inverted Yield Curve Indicate? |
A bond yield is the percentage of interest it pays bond holders. The bond yields changes over time.... When the yield curve inverts, it means that the shorter-term bond yields a higher interest rate return than the longer-term bond...
|
|
|
Upcoming Government Reports & Holidays |
|
May 02
May 03
May 04
May 06
May 09
May 11
May 11
May 12
May 17
May 17
May 18
May 20
May 24
May 24
May 25
May 27
May 30
|
|
CONSTRUCTION SPENDING REPORT
MANUFACTURERS' SHIPMENTS, INVENTORIES & ORDERS - FULL REPORT
US INTERNATIONAL TRADE IN GOODS & SERVICES REPORT
EMPLOYMENT SITUATION REPORT
MONTHLY WHOLESALE TRADE: SALES & INVENTORIES
CONSUMER PRICE INDEX REPORT
BUSINESS FORMATION STATISTICS
PRODUCER PRICE INDEX REPORT
ADVANCE MONTHLY SALES FOR RETAIL & FOOD SERVICES REPORT
MANUFACTURING AND TRADE: INVENTORIES & SALES REPORT
NEW RESIDENTIAL CONSTRUCTION REPORT
ADVANCE SERVICES REPORT
PRELIMINARY US IMPORTS FOR CONSUMPTION OF STEEL PRODUCTS
NEW RESIDENTIAL SALES REPORT
ADVANCE REPORT ON DURABLE GOODS - MANUFACTURERS' SHIPMENTS...
ADVANCE ECONOMIC INDICATORS REPORT
MEMORIAL DAY HOLIDAY
|
|
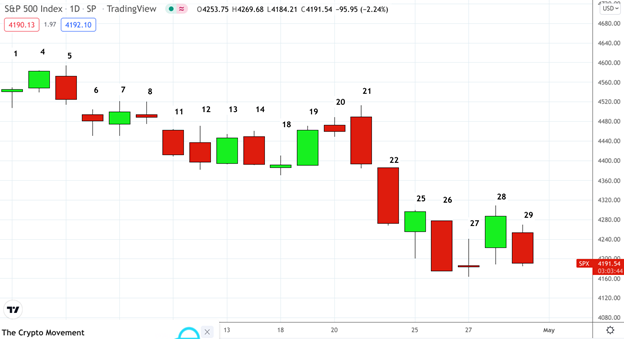
Key Events That Moved the Market in Apr. 2022 |
|
The following is a review of US and world events from the last month. Please be advised that this content is based upon the opinions and research of GFF Brokers and its staff and should not be treated as trade recommendations.
|
|
S&P 500 Index (SPX) - Daily Chart - Apr 1 - 29, 2022 (Source: Tradingview)
April 1
- A positive day on Wall Street with the Dow ending up 139 points, the S&P also up 0.34%, and the tech-heavy Nasdaq eking out a 0.15% gain.
- Rising rate fears played a pivotal role in today’s selloff, as Fed chair Jay Powell signaled bigger rate hikes potentially coming next month.
April 4
- Stocks edged higher, gaining steam into the close.
- The Dow railled 103 points; the S&P, 0.81%; and the Nasdaq finishing the highest among the three, up 2%.
- With tech stocks lifting a good portion of the indices, the growth trade has come roaring back in a big way.
- JPMorgan’s CEO, Jamie Dimon, published his annual letter to investors warning to brace for a negative outcome, citing the war in Ukraine and sanctions that will slow the global economy.
April 5
- It was an eventful day on Wall Street with the Dow swinging more than 500 points from high to low but closing down 280 points. The S&P sank 1.26%. The Nasdaq, falling the hardest, down 2.24%.
- The ISM services index came in rebounding strongly from a one year low in February.
- Fed governor Lael Brainer sent shivers down the market’s spine when taking a very aggressive tone with regard to bringing down inflation.
April 6
- Stocks fell for a second day, with the Dow losing ground by 144 points, The S&P fell nearly a percent while the Nasdaq dropped another 2% as Fed gives policy tightening plans.
- Rates soared to new heights as the Fed gave more guidance on how fast it will tighten monetary policy to fight inflation, raising concerns that it may slow down the economy.
April 7
- A wishy-washy day on Wall Street resulted in a comeback by the close.
- The Dow, down over 300 points, ended the day upn87 points. The S&P rose 0.42% whilet he Nasdaq finally got some relief, gaining 0.23%.
- The 10-year yields topped 2.67%, a three year high, sending the Financial and Tech sector lower while boosting defensive sectors like Consumer Staples, Healthcare, and Utilities.
- There’s also a lot of recessionary talk in the media which is likely weighing on investor sentiment.
April 8
- The week ended lower despite the Dow ending up 137 points. The S&P fell 0.27% while the Nasdaq resumed its slide, down 1.41%.
- Rising yield rates are putting a lot of pressure on Tech and other more speculative stocks. Given the size of the largest tech names and their weighting in in the S&P and Nasdaq, the broader market may not be able to rally without Tech in the mix.
April 11
- Another bout of selling in Tech a nd a rise in 10-year yields sent the broader market to three-week lows to start the week.
- The Dow plunged 413 points, followed by similar drops in the S&P ( -1.69%) and the tech-heavy Nasdaq ( -2.35%).
- Markets may be nervous about the consumer inflation data that’s to be released and its effect on Fed rate policy.
- The new Covid lockdown in China may also be weighing on investors as it can any slowdown to the world’s second-largest economic will have a significant global impact.
April 12
- Stocks got a fleeting relief from a better-than-expected inflation report though still ending in the red.
- The S&P finished down 0.34%. The Dow lost 87 points. The Nasdaq slid a modest 0.36%.
- Core CPI showed another 40 year high at 8.5%, with core inflation coming in less than expected.
- Remember that inflation in the 1970s did not progress consistently higher; there were bouts of volatility in which inflation decreased. The next increase, however, is what counts.
- Investors who are aware of this understand that any further advances in inflation readings may prompt the Fed to take more aggressive action. The fear, of course, is that the Fed’s aggressive actions may drag the economy into a recession.
April 13
- Stocks shook off another blistering inflation report to post their biggest gain in two weeks.
- The Dow bounced 344.25, the S&P rose 1.12%, and the Nasdaq jumped nearly 2% to end the day.
- A key measure of wholesale inflation came in at 11% year over year.
- Markets, however, anticipated this level of inflation and are willing to bet that inflation will soon peak.
April 14
- A downbeat note on Wall Street as markets sag on another rise in bond yields and a batch of uninspiring earnings reports from big banks.
- The S&P slid 1.21%, the Dow, down 113 points, and the Nasdaq fell 2.28%.
- The 10-year yield make a three-year high above 2.8% as the ECB indicated no hurry to raise interest rates, driving up expectations that inflation might remain elevated globally for a longer period of time.
April 15
- Good Friday - markets closed.
April 18
- Stocks got off to a choppy start in and out of positive territory five times today only to end up…
- The Dow lost a mere 39 points. The S&P and Nasdaq both slid, 0.02% and 0.13% respectively.
- Earnings are generally what’s on investors minds this month amid higher prices in energy names and continually advancing bond yields; the 10-year, now at a four-year high, up to 2.9%.
April 19
- The market staged a hefty rebound following Monday’s selloff.
- The Dow surged 500 points to close not far from session highs while the S&P and Nasdaq staged an impressive comeback, up 1.61% and 2.15% respectively.
- Despite a barrage of uncertain news, the markets are still trying to find an excuse to push a little higher.
- Markets appear to be shaking off fears of a more aggressive rate hike stance by the Fed, taking crude oil’s breather as a proxy for inflation which likely triggered today’s market rally.
April 20
- The Dow enjoyed a second day of rallying, up almost 250 points. However, the session was mixed as the S&P lost 0.06% while the Nasdaq fell nearly 1.5%.
- The big news today was arguably Netflix which lost subscribers for the first time in a decade. It’;s loss of 200,000 subscribers came hard against an expected gain of 2.6 million—a huge miss.
April 21
- The early rally fizzed out as Fed chair Jerome Powell signaled bigger rate hikes potentially coming next month.
- The Dow lost 368 points, the S&P, down almost 1.5% and the Nasdaq fell nearly 2%.
- The 2-year Treasury yield which has become another proxy for inflation rose to its highest level since 2018 taking the entire Tech complex lower.
April 22
- Today’s action followed a dramatic reversal Thursday after a speech by Federal Reserve Chair Jerome Powell dented market sentiment.
- The Dow plunged 981 points while the S&P and Nasdaq both lost ver 2.5% by the end of the day.
- Powell said during an IMF panel that taming inflation is “absolutely essential” and a 50-basis-point hike is on the table for May.
- Rates jumped on those remarks. On Friday, the benchmark 10-year Treasury yield dipped slightly to around 2.91%.
April 25
- The markets saw a bit of relieve with the Dow ending up 238 points and the Nasdaq gaining 1.32%. The S&P also rose, however, modestly at 0.57%.
- The turn was likely fueled by tech stocks as investors await Mircrosoft’s earnings tomorrow. Twitter also rose on news that Elon Musk’s takeover bid has been finalized.
April 26
- The market fell sharply continuing a harsh April sell-off after a one-day breather, as investors dumped shares on fears of an economic slowdown.
- The Dow tumbled 809 points while the S&P and Nasdaq lost 2.81% and 3.87% respectively.
- Tech led the decline as investors feared more blow-ups (like the one seen in Netflix) plus worries about the global economy, particularly the Covid surge in China.
- High inflation and Russia’s threat of nuclear war also weighed on market sentiment.
April 27
- The market had a nice rebound a day after the Nasdaq Composite posted its worst daily loss since 2020.
- The Dow gained 61 points; the S&P advanced a modest 0.21%; but the Nasdaq took a modest hit of 0.05%, basically unchanged.
- Strong corporate earningsboosted investor sentiment after yesterday’s big sell-off.
April 28
- Market shrugged off the GDP decline of 1.4% in the first quarter despite analyst expectations of a 1% gain.
- The Dow jumped 614 points while the S&P and Nasdaq pulled off impressive comebacks, rising 2.47% and 3.48% respectively.
- Consumer expenditures rose 2.7%, despite a 7.8% increase in prices.
April 29
- Stocks fell in the last day of the April with the Nasdaq Composite on pace for the worst month since 2008.
- Amazon became the latest victim in the technology-led sell-off.
- The tech-heavy Nasdaq Composite fell 2.6%, weighed down by Amazon’s\plunge. The S&P 500 retreated by 2.3%. The Dow Jones Industrial Average shed about 520 points, or 1.5%.
|
|
Have Questions About Service, Technology or Trading? |
|
|
|
Use our industry expertise to help you make the most of your trading. A Series 3 Licensed Broker will connect with you to discuss your personal trading goals and answer your questions. |
|
Have questions about GFF Brokers services?
*Details regarding Algo beta2.2 intraday NQ E-mini Nasdaq: Please be aware that the suggested capital to trade this system is $75,000. Please speak to your broker for more information about this trading system. The returns for the systems listed are hypothetical in that they represent returns in a model account. The model account rises or falls by the average single contract profit and loss achieved by clients trading actual money pursuant to the listed system’s trading signals on the appropriate dates (client fills), or if no actual client profit or loss available – by the hypothetical single contract profit and loss of trades generated by the system’s trading signals on that day in real time (real‐time) less slippage, or if no real time profit or loss available – by the hypothetical single contract profit and loss of trades generated by running the system logic backwards on backadjusted data.
HYPOTHETICAL PERFORMANCE RESULTS HAVE MANY INHERENT LIMITATIONS, SOME OF WHICH ARE DESCRIBED BELOW. NO REPRESENTATION IS BEING MADE THAT ANY ACCOUNT WILL OR IS LIKELY TO ACHIEVE PROFITS OR LOSSES SIMILAR TO THOSE SHOWN. IN FACT, THERE ARE FREQUENTLY SHARP DIFFERENCES BETWEEN HYPOTHETICAL PERFORMANCE RESULTS AND THE ACTUAL RESULTS SUBSEQUENTLY ACHIEVED BY ANY PARTICULAR TRADING PROGRAM.
ONE OF THE LIMITATIONS OF HYPOTHETICAL PERFORMANCE RESULTS IS THAT THEY ARE GENERALLY PREPARED WITH THE BENEFIT OF HINDSIGHT. IN ADDITION, HYPOTHETICAL TRADING DOES NOT INVOLVE FINANCIAL RISK, AND NO HYPOTHETICAL TRADING RECORD CAN COMPLETELY ACCOUNT FOR THE IMPACT OF FINANCIAL RISK IN ACTUAL TRADING. FOR EXAMPLE, THE ABILITY TO WITHSTAND LOSSES OR TO ADHERE TO A PARTICULAR TRADING PROGRAM IN SPITE OF TRADING LOSSES ARE MATERIAL POINTS WHICH CAN ALSO ADVERSELY AFFECT ACTUAL TRADING RESULTS. THERE ARE NUMEROUS OTHER FACTORS RELATED TO THE MARKETS IN GENERAL OR TO THE IMPLEMENTATION OF ANY SPECIFIC TRADING PROGRAM WHICH CANNOT BE FULLY ACCOUNTED FOR IN THE PREPARATION OF HYPOTHETICAL PERFORMANCE RESULTS AND ALL OF WHICH CAN ADVERSELY AFFECT ACTUAL TRADING RESULTS.
There is a substantial risk of loss in trading futures, options and forex. Past performance is not necessarily indicative of future results. Margins are subject to change at anytime without notice. All material herein was compiled from sources considered reliable. However, there is no expressed or implied warranty as to the accuracy or completeness of this material.
|
|
|
|
|
|
|