Back by popular demand we are rerunning one of our most requested newsletter series.
Part 1 - Chart of Accounts
The financial statements for your practice provide key information for you to use to manage your veterinary hospital. In veterinary medicine, you cannot treat patients without a diagnosis and you cannot make a diagnosis without good, reliable diagnostic information. Understanding your practice is no different. No matter its size or what stage your practice is in, you need a strong understanding of your practice's financial health in order to be successful and reach your goals. With this four-part newsletter series, our mission is to help you have a better understanding of your financial reports and how to use them to manage your practice.
The first thing to understand when reviewing your financials is the Chart of Accounts (COA). By definition, a Chart of Accounts is the framework of the financial reports, or the listing of the accounts available for recording transactions in the accounting software. AAHA published its recommended Chart of Accounts in June 2017, including descriptions for what type of transaction should be recorded in each specific account. This is available for free on the AAHA website. The AAEP has a similar COA available to its members. A COA can have as many or as few accounts as the practice needs in order to record transactions in a way that makes sense for that specific practice. Having too few accounts will make it difficult to break out numbers that you want to measure in detail. Having too many can make it difficult to remember which accounts to use and will also make your financial statements long and cumbersome. The trick is to find a happy medium with the details you need to manage your practice and to be able to extract the details that you and your accountant find beneficial.
In order to have the best information for managing your hospital, the COA should be used consistently. The same type of transactions should be recorded in the same account each time. For example, if you book the travel for an educational seminar as" business travel" one month, but in "continuing education" the next month, you won't be able to accurately measure how much you are spending on either one. It may take a few extra minutes, but it's worth taking the time to check to see how these expenses were recorded in the past to make sure the transactions are categorized consistently. Using a standardized industry COA, such as the one published by AAHA, will also help you compare apples to apples when looking at benchmarks to see how your practice compares to published industry standards.
To accurately and quickly measure your gross profits, you need to have a separate income account for each revenue stream your practice uses. Additionally, you need to have a separate cost of goods sold (COGS) account that correlates with the income account. For example, if you have an account to measure the amount of income generated from vaccinations, you need a partner account in COGS to record the cost of the vaccinations you purchase. Having paired COGS accounts like this for each of the income accounts will allow quick review of income to expense for every category and shows you which areas are generating gross profit and which are not.
Take this paired account concept one step further and match the income accounts in your practice management software to the account names in your accounting software. If you use QuickBooks (QBs), the income accounts in your QBs file should be the same as the revenue accounts in your practice management software. For example, the name and number of the income account for in-house laboratory income should be the same as the code in your practice management software that tracks every time you invoice a client for in-house lab tests. This will enable you to easily record the income from your practice management software into QBs consistently and accurately.
So many important decisions are made from your financial data! Lenders will analyze them to decide whether to approve a loan. If you are considering hiring an associate, your financial data will tell you if you can afford to or not. When you are ready to sell your practice, if transactions are booked incorrectly or not managed properly, it could have a negative effect on the practice's value. The responsibility of managing the books is critical, yet too often it's done by someone who has little to no accounting experience or training. Bookkeeping may seem simple, but so does cutting my own hair, and I would never do that! You shouldn't take this position lightly.
Once you have your Chart of Accounts set up and customized to suit your practice's needs, you are now ready to see how they are organized within the financials, understand what each one measures and also learn some fun analytics to use in order to better understand where your practice stands financially. Stay tuned for next month's newsletter where we will dissect the profit and loss statement and show you some exciting metrics to use to better manage your practice.
Part 2 - Profit & Loss
In accounting curricula and when publicly traded companies issue statements, the balance sheet is commonly presented first. The reason for this is because investors, not business managers, are the ones analyzing them and many of the financial ratios that they analyze are derived from the balance sheet. Some accounting professionals say that the order of the financial statements doesn't matter. But what we have found in our years of managing successful veterinary practices is that the order does matter! Reviewing your financials is just like reading a book; you can't open it in the middle and understand what's happened so far in the story, and you can't rush to the last page and comprehend the ending. To really understand the full story of your practice, reading them in order and from top to bottom makes a huge difference. Even though the balance sheet is commonly presented first, we are going to begin with the profit and loss statement, because it is the statement that people are most familiar with. Next month we will dissect the cash flow statement, and finish our series with the balance sheet, which will tie everything together.
The Profit and Loss Statement is sometimes referred to as the P&L or the income statement. This report summarizes the revenues, costs and expenses incurred during a specific period of time - usually a month, quarter or year. The primary purpose is to show managers and owners whether the company was profitable during the period being reported.
Many people, both inside and outside of your hospital, utilize the P&L. Primarily, business owners and managers make informed operational decisions from it. Since earnings and profit underlie a practices' ability to generate future cash flow, potential buyers also look at it to make purchasing decisions. If you plan to finance a new DR, lenders will use the P&L as one way to decide whether the practice can repay the loan. And of course, tax preparers use it to prepare any required tax returns.
The P&L can be kept on one of two different accounting methods, cash or accrual.
Cash method
is recording transactions when cash is exchanged. For example, when a client pays, the money is recorded as revenue when the deposit is made. When the utility bill is paid, it is recorded as an expense when you write the check. This method is used predominantly for tax reporting for smaller businesses.
Accrual method
is recording transactions when they are
incurred
. With books kept on an accrual basis, when a client is invoiced, the revenue is recorded immediately, regardless when the client actually pays you. When the bill for the utilities is received, it is recorded on the date of the bill, regardless of when you pay it. The accrual method is used for managerial decision making and analytics because it
matches your revenues with the expenses associated with generating that revenue
. This allows you to see how much it cost to produce the amount of revenue in your practice.
We highly recommend keeping your practice's books on an accrual method. (This doesn't change the way the income tax return is prepared! There is a difference between managerial accounting and tax accounting.) As owners and managers of your practice, reviewing reports prepared on the accrual basis will help you get a good idea of where, when, and how the practice is making money. The accrual method requires a few more steps in the monthly recording process, but will be well worth it in the long run, providing the tools needed to manage your practice successfully!
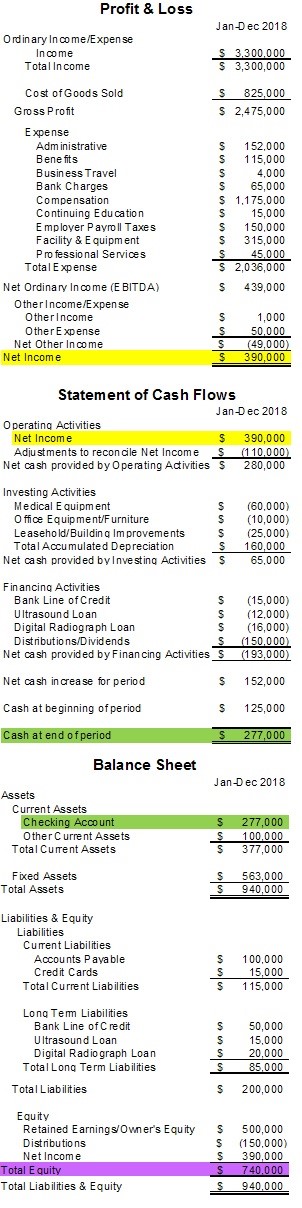
The first section of the P&L reports gross fees. Too often, business owners focus solely on this number. Don't get us wrong, this is an important number, but there are other numbers on this report that are just as important, if not more so. There are costs of goods sold, payroll, facility rent and other expenses that are subtracted from this number to truly measure the financial health of the practice. The bottom line of the P&L is net income or net loss. This number is equally, if not more important than gross fees. Why? Because this number indicates the profit your practice has left over after paying all its costs. Without net income, a business cannot keep the doors open very long.
There are several ways to review your P&L to help manage your hospital and measure progress toward goals. For instance, running the P&L report with a comparison to the previous year can help you quickly see large variances and identify trends. Reviewing data from year to year or period to period is commonly referred to as a horizontal analysis. A vertical analysis presents expenses as percentages of total revenue, which allows you to benchmark your practice against industry standards and will help identify trends within your own practice. Breaking out your revenue accounts and matching cost of goods accounts associated with them, can take you one step further in analyzing profits.
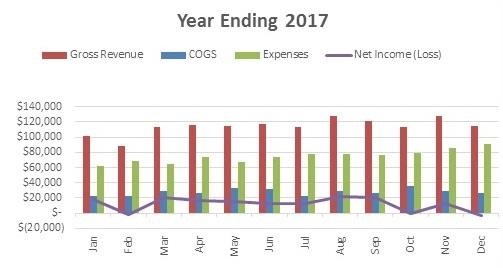
Many different graphs and charts can be created from your P&L numbers to help get better visuals for trends and percentages. One popular chart measures a year of gross revenues, COGS, and expenses with bars by month and net income with a line. This allows for a quick visual of the differences and trends for the year.
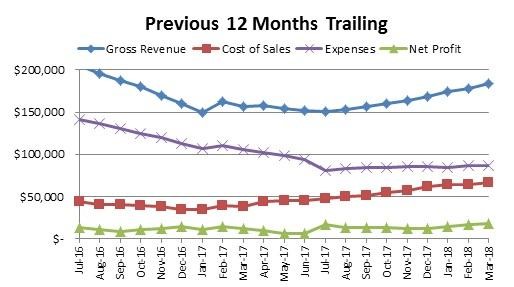
Another good chart to use is called trailing previous 12 months. Each month on this chart, measures the total of the previous 12 months. By viewing a years' worth of numbers at a time, it will help smooth out seasonality and can provide a bigger, clearer picture of trends and the direction the practice is going. It can be viewed over one or more years, the longer the period, the bigger the picture.
These analyses, and many more, show where the practice has been and can help you predict where it could be going.
When you prepare the P&L on an accrual basis, you can see how much revenue the practice produced and how much it cost to produce it. You are now ready to turn the page in the story to the next financial statement, the cash flow statement. This report takes the amount of net income (remember on an accrual basis) and converts it into cash, measuring how much money is in your bank account and where it came from. Have you ever heard the phrase, "Cash is King"? Unfortunately, all too often the lack of profits is not what kills a practice; it's the lack of cash! Join us next month for a dissection of the cash flow statement, the lifeblood of your practice.
Part 3 - Cash Flow Statements
The main question that the cash flow statement answers is what every practice owner wants to know: Does my practice have the cash to stay afloat? Cash flow can be used as a good indication of a company's complete financial strength or health. Have you ever heard the phrase, "Cash is King"? Unfortunately, all too often it isn't a lack of profit that kills a practice; it's a lack of cash! We have seen many practices with high profits fail due to lack of available cash. Examples include practices with a very heavy debt load or where the owners take out too much personally, thereby crippling the operating cash cycle. This is almost always unintentional, but the consequences are dire.
By definition, the cash flow statement provides aggregate data within a specific time frame regarding all cash inflows your practice receives, as well as all cash outflows. The cash flow statement takes the amount of net income from the P&L (remember, on an accrual basis) and converts it into cash, measuring precisely how much money is in your bank account and where it came from.
Cash transactions usually arise from one of three activities - operating, investing and financing. The cash flow statement organizes transactions into these three categories.
Operating
- The first section of the cash flow statement is the operating section, measuring transactions that are part of the normal operations of a veterinary practice. The first line is the Net Income that came over from the P&L. Adjustments are then made to net income to reflect the transactions where cash was not exchanged. For example, when you invoiced a client cash didn't exchange hands, so an adjustment is made to take it out of income. Another example is when you record the utility bill to the expense account, but haven't paid it yet. In this case, an adjustment is made in this section to add that expense back to net income since cash didn't move in that reporting period.
Investing
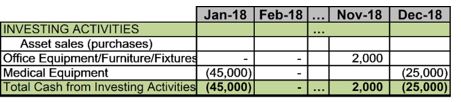
- The second section is investing activities. These reflect changes in the capital assets you own, large purchases such as ultrasound machines and infusion pumps that do not appear on the P&L. For asset purchase, the total price of the equipment is subtracted from cash flow. Alternatively, if you sell a piece of equipment, the money is added since you receive cash from the sale.
Financing
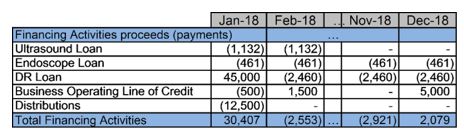
- The third and final section is financing activities. If you borrowed money to purchase a capital asset, the total loan amount is added. Principle payments made on loans each month are subtracted. This is also the section that measures equity, which includes owner distributions. Distributions are subtracted since its money taken out of the practice. If an owner puts money back into the practice for any reason, this section would reflect that by adding it back.
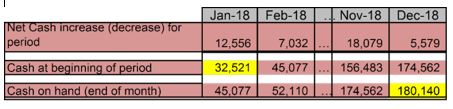
The cash flow statement takes the totals of these three activities and adds them to (or subtracts them from) the cash in the bank account at the beginning of the reporting period to get the amount of cash in your bank account at the end of the reporting period. So the bottom line of the cash flow statement is equal to what is in your bank account or your cash on hand at the end of the reporting period.
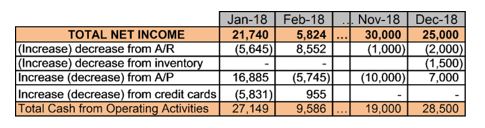
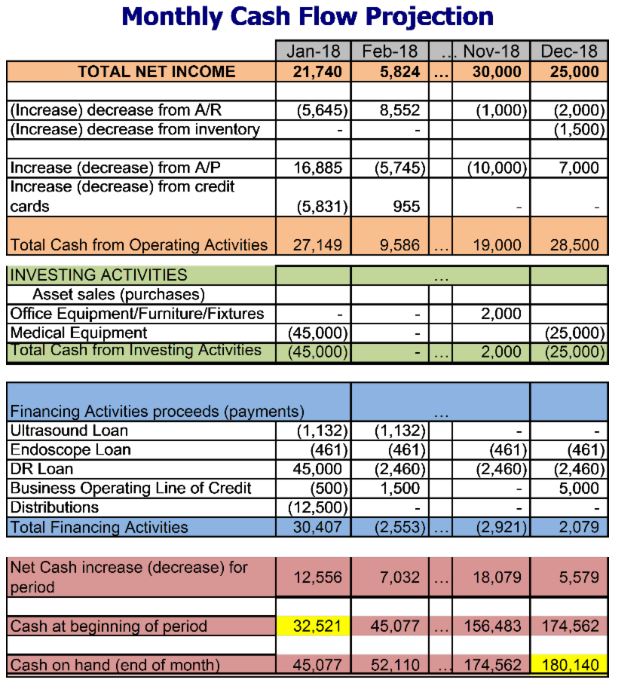
This amount can then be analyzed to see if it's sufficient for sustaining the practice's operating cash cycle, whether there is money to distribute to the owners or if the practice can use any excess cash to reinvest in growth activities. The cash flow statement is a great report to use for creating cash budgets and forecasts to answer these questions. Below is an example of a summary cash budget that can also be used as a forecast when extended out for future months.
This amount can then be analyzed to see if it's sufficient for sustaining the practice's operating cash cycle, whether there is money to distribute to the owners or if the practice can use any excess cash to reinvest in growth activities. The cash flow statement is a great report to use for creating cash budgets and forecasts to answer these questions. Below is an example of a summary cash budget that can also be used as a forecast when extended out for future months.
Cash management is a learned skill that takes time and experience to perfect. The cash flow statement can be the biggest tool in your tool box to manage the cash flow of your practice. A company has to generate an adequate cash flow from its business in order to survive. Veterinary practices are no different. In addition to generating cash from its activities, a practice also needs to manage that cash so that it holds the right amount to meet its immediate needs as well as long-term needs. Managing cash in a proactive way can reduce stress and help you understand where there is room for improvement, which is crucial for all businesses.
Now that you know how much cash you have in the bank and where it came from, you can move onto the final chapter in the financial story, the Balance Sheet. The Balance Sheet measures what you are doing with the money you have made. This report is an accumulation or complete history of your practice, measuring rolling balances of assets, liabilities and equity from the first day the practice's doors opened. Tune in next month to dissect the balance sheet and see what it tells you about your practice.
Part 4 - Balance Sheet
The balance sheet is different; it is measured from a single point in time, like taking a picture or snapshot. The balance sheet's numbers are cumulative, so the numbers reported are from the first day the practice opened its doors, until the date of the reporting period you are measuring.
The categories on the balance sheet measure assets, liabilities and equity. The balance sheet gets its name because the total amount of assets must equal, or "balance", the total amount of liabilities + total equity.
In the first section, the asset section, accounts are listed in order from the most liquid (easily converted to cash) to least liquid, so the first number on the balance sheet is the amount of cash in your bank accounts (which, remember, was also the last number on the cash flow statement). The asset section also includes accounts receivable (the amount that clients owe you), inventory (the dollar amount of products and drugs sitting on your pharmacy shelves), fixed assets (large medical equipment such as ultrasounds, X-ray machines, computer equipment, furniture, etc.) and intangible assets (goodwill, covenants, etc.)
The second section of the balance sheet shows liabilities, which are listed in order of when the liabilities are due, or "payable". For example, current liabilities are amounts that are due in less than a year, which include normal operational accounts payable such as utility bills, along with credit card balances. Long-term liabilities are amounts that are payable in full in a year or longer, such as equipment loans and mortgages.
Equity is the last section of the balance sheet. This is the investment you, as the owner, have made over the life of the practice. The equity section includes the culative net profit or loss from each year minus the money you have taken out in draws or distributions, plus any money you have reinvested into the practice.
The balance sheet totals assets and subtracts all the liabilities to calculate the equity. You may also hear equity referred to as overall net worth; however, this number is not to be confused with the current value of your practice. That is a whole different enchilada for another article. Equity can be called by several different names, depending on the organizational structure of the practice. For Sole Proprietors, it is referred to as Owner's or Proprietor's Equity. In a Limited Liability Company (LLC), it is labeled as Member's Equity. Corporations call it retained earnings, which illustrates a better description of what it truly measures, the earnings the practice has retained over its lifetime. Bringing it home, the last number on the balance sheet represents the blood, sweat and tears you have put into your practice. If equity is positive, it means that the practice has been profitable in the past and you have left a portion of that profit in the practice. If equity is negative, it indicates that either you have been operating at a loss or have taken all of the profit out of the business, and then some.
Several third parties, such as bankers and potential buyers, use ratios from the balance sheet to evaluate the financial strength of the business. Some useful analytics from the balance sheet include how long it takes you to generate enough cash to pay your bills within the vendor's terms, and how those two numbers relate to each other from the standpoint of the operating cash cycle. A useful ratio is the Current Ratio, also known as the working capital ratio. This ratio divides current assets by current liabilities and is mainly used to give an idea of a company's ability to pay back its liabilities with its assets. For example, if a practice has current assets of $550,000 and current liabilities of $450,000, the ratio would be 1.22 ($550,000/$450,000). A ratio higher than 1 indicates that the practice is capable of covering all its debt within the time frame it's due, so this example would be favorable. Another helpful ratio to use is the Inventory Turnover Ratio, measuring how well a practice generates sales from its inventory. Managing inventory levels is vital since it can show whether your prices are sufficient and if costs are being controlled properly. Inventory turnover is the number of times a company sells and replaces its inventory during a period (usually a year) and is calculated by dividing total purchases by average inventory. Average inventory is the beginning inventory plus ending inventory, divided by two. For example, in a practice that spends $800,000 on pharmaceuticals and supplies and has an average inventory value of $80,000, the turnover is 10 turns per year. The higher the inventory turnover number, the better since this means inventory is not stacking up on your shelves. However, if inventory turns over too quickly, the risk of product shortages increases. Dividing the number of turns into 365 days will give you the number of days of inventory is on hand. So this example would be 36.5 (365/10 turns) days of inventory is on the shelf.
To summarize our Financial Anatomy series, the profit and loss statement tells you how you are making profits, the cash flow statement tells you how much of those profits you are keeping in cash, and the balance sheet tells you how you use the cash you get to keep. Your practice's financial statements tell a story; you simply have to read the pages in the right order and understand the language. Now you can understand the big picture of what has happened in the past, what is happening now, and what could happen to your practice in the future.
When you review your practice's financial statements holistically, you can make smarter financial and managerial decisions for your practice. Of course, that's easier said than done in many situations, so be open to asking for help - whether from an accountant, consultant or other resources. Getting your head wrapped around your practice's financial data may be the most important thing you do this year!