|
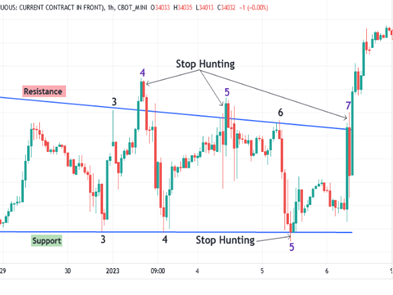
S&P 500 Index (SPX) - Daily Chart - Feb 1-28, 2023 (Source: Tradingview)
February 1
Stocks started off poorly but rebounded significantly by the end of the trading session, with the S&P rising 1.05% and the Nasdaq increasing by 2.16%. The Dow only gained 7 points and was relatively stable. The positive trend was set by a strong jobs report indicating a healthy labor demand amid low unemployment in the US.
February 2
The tech sector continued its strong performance from the previous day, leading to a mixed close for the session. The Dow dropped by 39 points, while the S&P rose 1.47% and the tech-heavy Nasdaq surged by 3.56%. Although Alphabet's stocks declined, other tech stocks rallied during the trading session.
February 3
Wall Street ended the week in the red, with the Dow dropping 127 points, the S&P falling 1.03%, and the Nasdaq declining 1.79%. Warning signs for an overheated market emerged, and stock futures declined as the addition of 517,000 jobs to the economy and strong annual wage growth pointed to the possibility of higher inflation.
February 6
Stocks opened the new week on a downward trend following a jobs report that exceeded expectations. The Dow dropped by 35 points, while the S&P and Nasdaq faced smaller losses of 0.61% and 0.87%, respectively. Corporate earnings reports continue to be challenging, with increased wholesale costs and inconsistent consumer demand causing complications.
February 7
The market had a volatile trading session, but closed in the green with the Dow increasing by 265 points, the S&P rising 1.29%, and the Nasdaq jumping by 2.12%. Federal Reserve Chair Jerome Powell, speaking at an event in Washington, indicated that despite the start of a process to lower inflation, the Federal Reserve intends to continue with rate hikes.
February 8
The market had a negative trading session with the Dow dropping by 207 points, the S&P decreasing by 1.11%, and the Nasdaq falling by 1.83%. There were indications that the Federal Reserve's anti-inflation rate hikes were hurting corporate earnings. The Nasdaq was further affected by Alphabet stocks falling after an error was found in Google's new chatbot promotional video.
February 9
Stocks declined for the second consecutive day as investors looked ahead to new inflation data. The Dow lost 249 points, the S&P decreased by 0.88%, and the Nasdaq fell by 0.91%. Alphabet stocks experienced significant selling pressure due to the threat of AI-enabled search, while Disney's rally lost momentum despite the company reporting healthy results and announcing a cost-cutting plan.
February 10
The trading week ended on a mixed note with stocks edging higher but not enough to recover the week's losses. The Dow gained 169 points, the S&P rose by 0.22%, but the Nasdaq remained in the red, decreasing by 0.62%. Big tech stocks, including Tesla and Alphabet, weighed down on the Nasdaq, with Alphabet continuing its losing streak and being down by 10%.
February 13
Stocks rebounded from the worst week in two months with the Dow up 376 points, the S&P up 1.15%, and the Nasdaq up 1.60%. Growth-oriented tech stocks led the Nasdaq higher, and long-term yields also saw gains. Investors took a cautious wait-and-see approach as monthly CPI data was slated for release.
February 14
Wall Street had a mixed trading day, with the Dow down 156 points and the S&P virtually unchanged with a 0.03% loss while the Nasdaq gained 0.71%. Consumers struggled to cope with January consumer prices that showed stubbornly high inflation.
February 15
Stocks end the trading session in the green, with the Dow rising 38 points, the S&P gaining 0.28%, and the Nasdaq drifting 0.77% higher. Retail sales data shows resilient consumer spending (jumping 3%) despite inflation.
February 16
Markets fail to shake off hot economic data, dragging stocks into the red by the close. The Dow went down by 431 points and the S&P lost 1.38% while the Nasdaq fell 1.93%. PPI reading came in piping hot, coupled with an unprecedented drop in weekly jobless claims, showing a seemingly overheating economy.
February 17
Wall Street ends the week with Dow stocks up 130 points, while both S&P (-0.28%) and Nasdaq (-0.68%) stocks face modest losses. Tech stocks buckle in the face of higher yields across the board, and interest rates become a headwind for the markets.
February 21
The shortened trading week commences with stocks drowning in a sea of red from the get-go. The Dow dropped by 697 points, while the S&P and Nasdaq fell by 2% and 2.41%, respectively. The market was weighed down by rising rates, with two-year yields hitting 52-week highs. Additionally, disappointing guidance from retailers contributed to the market's decline.
February 22
Stocks wavered throughout the session as Federal Reserve commentary caused tentativeness throughout the market. The Dow fell by 84 points and the S&P lost 0.16%, while the Nasdaq managed to eke out a 0.05% gain. Treasury yields slightly declined while some Fed members called for a larger half-point rate hike, as the market remained pinned under heavy inflation.
February 23
The market experienced a modest rally, with the Dow gaining 109 points, the S&P rising 0.53%, and the Nasdaq going up 0.94%. Despite jobless claims falling below expectations, bond yields eased up and investors seemed less worried as the session progressed.
February 24
Stocks met an ugly end to what is currently its worst week of 2023, with the Dow down 337 points, the S&P falling 1.05%, and Nasdaq stocks declining 1.73%. This drop was due to a hot inflation print that showed January personal consumption expenditures higher than expected. Bond yields also climbed higher, with the 2-year treasury yield reaching its highest point since 2007.
February 27
Stocks attempted rallying to a level that might have separated a routine pullback from something much more damaging. The Dow gained 72 points, the S&P 500 rose a third of a percent, and the Nasdaq added 0.74%. Rising bond yields remain a concern, while durable goods order, up higher than expected, signal strength in the US industrial economy.
February 28
The markets are off to a mixed start as the Dow fell 100 points while the S&P 500 and Nasdaq added 0.1% and 0.3% respectively to kick off a seemingly undecided day on Wall Street. Tuesday marks the last day of February, and despite a solid start to the year, the major indexes are on pace for their second negative month in three. Despite a strong start to the year for stocks, a sharp jump in Treasury yields this month dented investor sentiment for stocks, as traders fear that higher Fed rates would be sustained for a longer period of time.
|