|
Gordon T Long Research exclusively distributed at MATASII.com
Subscribe to Gordon T Long Research - $35 / Month - LINK
Complete MATASII.com Offerings - $55/Month - LINK
SEND YOUR INSIGHTFUL COMMENTS - WE READ THEM ALL - lcmgroupe2@comcast.net
| |
|
MARKET PERSPECTIVE
TECHNICAL ANALYSIS
You Are Missing our Subscriber Mid-Week MARKET LAB - You Are Working with only 1/2 the info?
| |
|
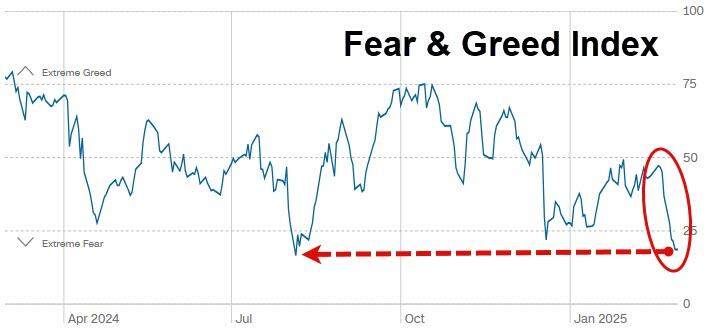
NEGATIVE SENTIMENT GETTING EXTREME
MAG-7 (NOW THE LAG-7) NO LONGER LEADING
| |
|
THE LAG-7
The 'Lagnificent 7' basket of stocks plunged in February, down a stunning $2.2 Trillion in market cap from the December highs, testing its 200DMA...
This was the second biggest monthly drop in Mag7 market cap ever, (April 2022 only one bigger).
CHART RIGHT:
Negative Sentiment is getting extreme!
| |
|
TECHNICAL ANALYSIS
INDEX
| |
|
1 - EQUITY MARKETS
CONTROL PACKAGE
S&P 500
MATASII BANKING INDEX
MATASII FINANCIALS INDEX
RUSSELL 2000 (IWM)
MAGNIFICENT 7
CONTROL PACKAGE
NVDA
GOOG
META
AAPL
TSLA
MSFT
AMZN
FOREIGN EXCHANGES (SITUATIONAL SELECTIONS)
| |  |
|
GLOBAL
2 - COMMODITIES
CRB COMMODITY INDEX
GOLD
SILVER
3 - CURRENCY MARKET
DXY
4 - BOND MARKET
CONTROL PACKAGE
TNX
5 - CREDIT MARKET
YIELD CURVE
JNK (HY)
MARKET MONITOR (SUBSCRIBERS ONLY)
| | |
|
NEW IMAGE CHANGES ARE LABELED WITH A BLUE TRIPLE ***STAR***
OLD IMAGE CHANGES ARE LABELED WITH A RED TRIPLE ***STAR***
OLD IMAGES REFLECT MINIMAL CHANGE, but Narrative is ALWAYS updated.
REMEMBER: SIMPLY CLICK YOUR LIVE SUBSCRIBER LINK TO SEE THE LATEST UPDATED LIVE CHART.
| |
|
CONTROL PACKAGE
There are FOUR charts we have outlined in prior chart packages that we will continue to watch closely as a CURRENT "control set":
- The S&P 500 (CHART LINK)
- The DJIA (CHART LINK)
- The Russell 2000 through the IWM ETF (CHART LINK)
- The MAGNIFICENT SEVEN (CHART ABOVE WITH MATASII CROSS - LINK)
- Nvidia (NVDA) (CHART LINK)
| | |
| |
|
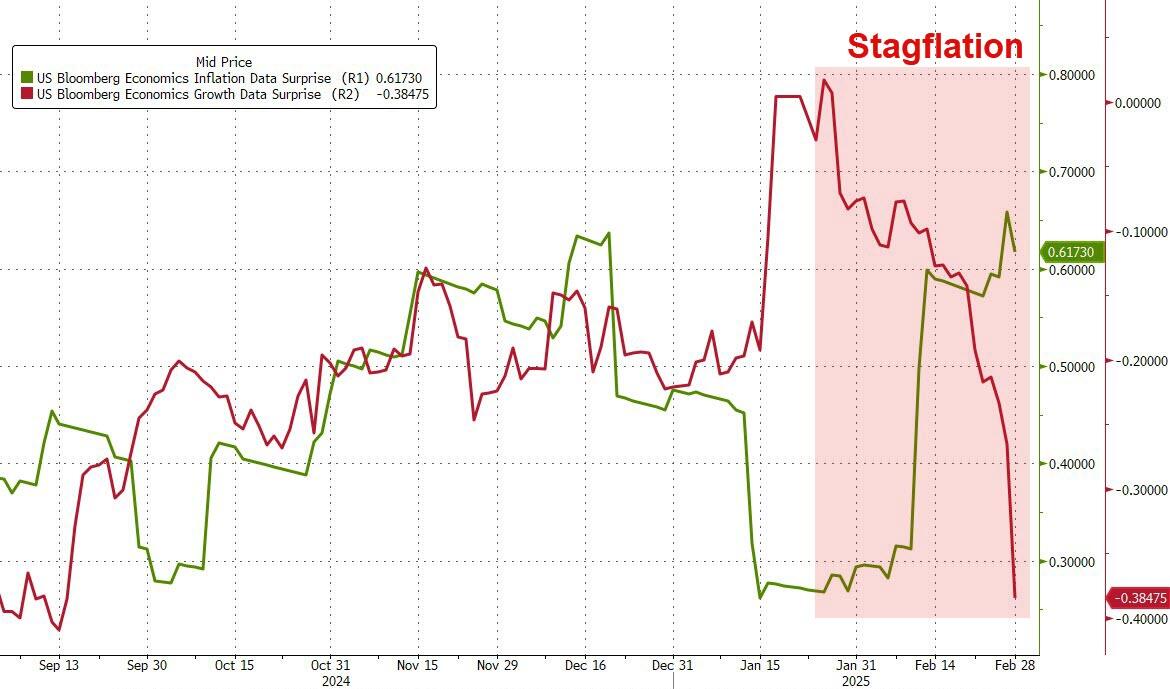
FEBRUARY WAS QUITE A MONTH!!
-
Economy - growth expectations stalling
-
Inflation - disinflationary path is over
- AI/Meme/Momo/Tech stocks - clubbed like a baby seal as CTA thresholds hit and revenues disappoint
-
Crypto - carnage as cash-and-carry trade unwinds
-
Bond yields - plunged as growth fears rise
-
STIRs - rate-cut hopes soared.
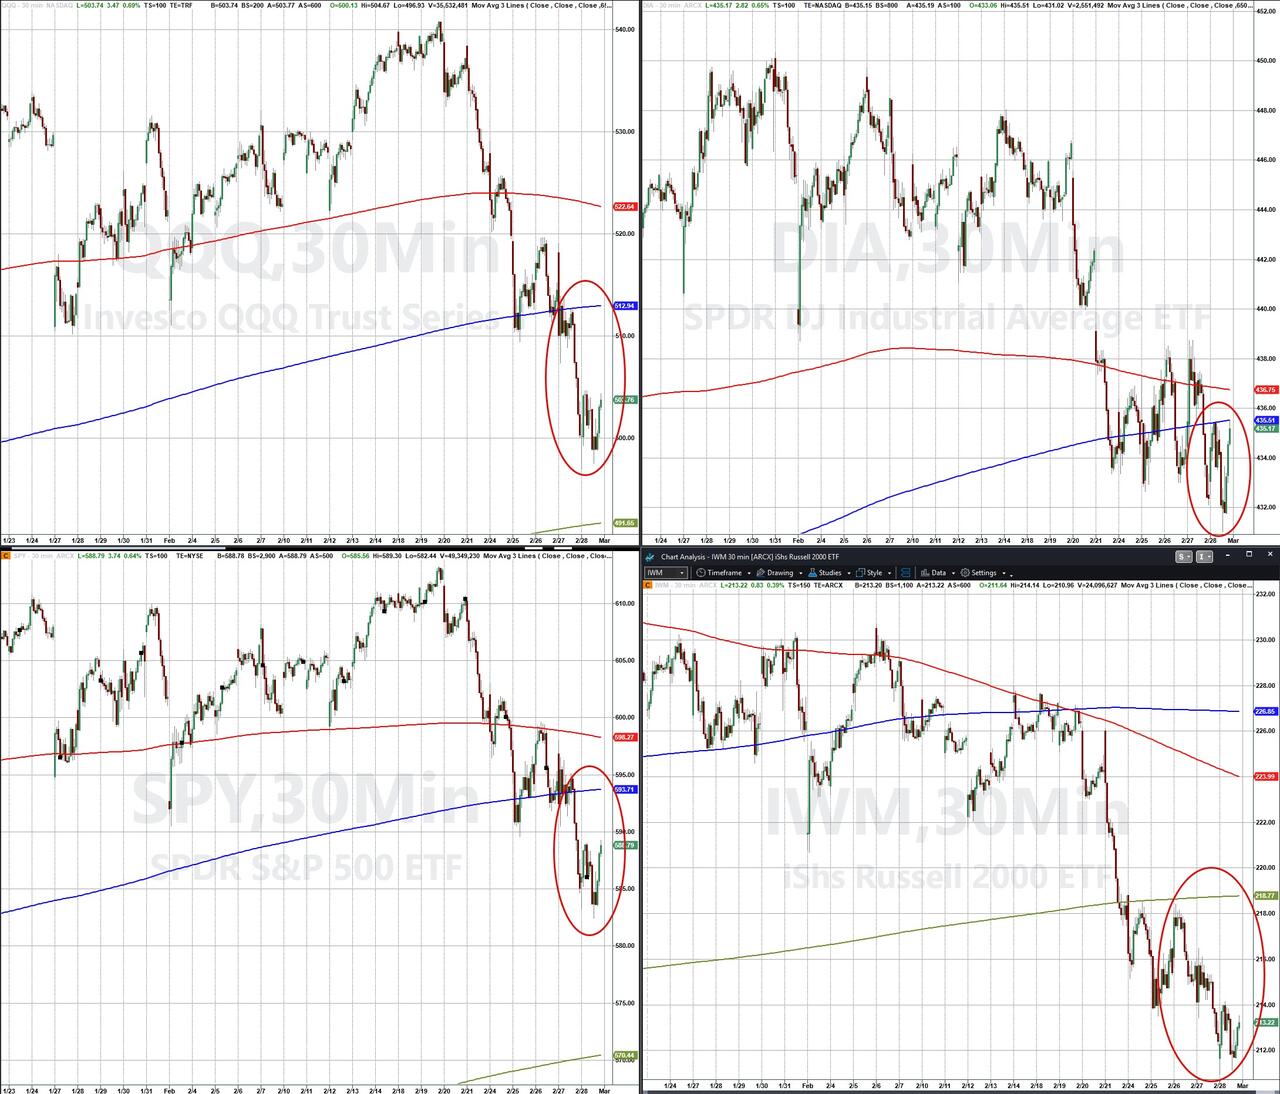
CHART RIGHT: All the US Majors broke below critical technical levels..
All the US Majors are lower in February with Small Caps the biggest loser and Trannies the least ugly horse in the glue factory.
| |
- The major issue for the market is more top-down macro than geopolitical. The policy mix is driving the market to price what looks like a growth shock. Tariff headlines yesterday with implementation of Mexico and Canada meant to hit in early March + the suggestion of tariffs on Europe + European autos + increased China tariffs weighed on risk. Whether tariffs are delivered or not they are quite likely impacting confidence/injecting uncertainty and that hurts capex/spending/forward planning.
As Nomura's Charlie McElligott nicely summarized:
"the Market is coming-around to understand that the early Trump 2.0 policy mix is a Growth DRAG because it HAS TO BE ('Engineering a Mild Recession') in the mind of POTUS and his Administration, in order to achieve the tectonic shift he is seeking...
And that is to rebalance Economic Growth and Labor AWAY FROM dependency upon perpetually higher long-term U.S. Govt spending and hiring-trends, and instead attempt to flatten / bend the trajectory of each back towards the Private-sector, which he can then later stimulate with easier FCI via lower Rates and weaker US Dollar, (BUT YOU GOTTA MAKE IT THERE ALIVE FIRST…hence, THE FATTER LEFT TAIL in the meantime)...
|
 | | .... Dangerously for “market status quo” purposes, and in order to achieve this long-horizon goal of “Re-Privatizing the U.S. Economy,” the theory then becomes that the Administration KNOWS they are gonna have to pump the breaks on the “Perpetual (Money) Machine” of Govt Spending and Employment, which HAS TO crack some eggs (LOL) in an attempt to readjust for the past “Sins of Excess,” particularly via hypothetical Govt Spending cuts and Federal Worker layoffs, along of course with these monster Tariffs (which are WAY over anything we saw in Trump 1.0. Most critically, yesterday’s additional 10% Tariff on all Chinese goods effective March 4th, coming 1 month after his initial 10% tariff increase and raising the cumulative to 20%, as a new round of escalations which hadn’t previously been signaled and taking the estimated average U.S. tariff rate on Chinese goods to approx 33% per Ting Lu) as the blunt-force tools used to reset Global Trade and hit Growth, leading to Disinflationary Impulse which will eventually bring the lower Rates and weaker US Dollar he wants for the Economy in Phase 2...
| |
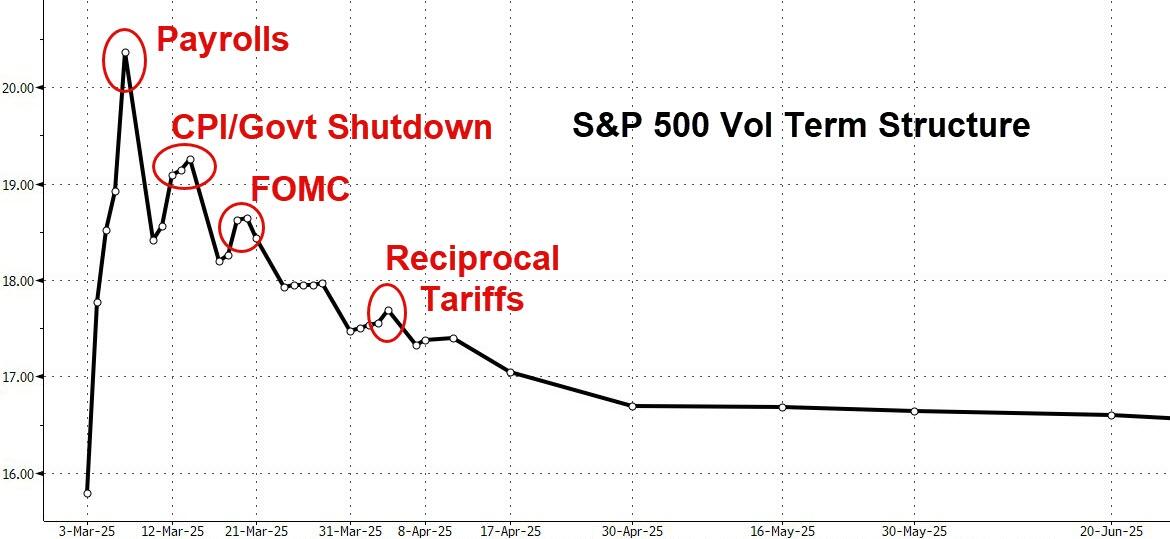
Of course, this theme of “Growth Scare / Repricing the Left Tail Accident” can of course ALSO overshoot.
There IS a “Put Strike” for Trump with Equities in there somewhere, just not here and not yet, because the threats for tariffs hitting next week then seemingly increases the risk that the following April 2nd reciprocal tariffs will be chunky as well — as such, Vol in SPX today is not really giving back much of anything, despite the Spot rally...
| |
|
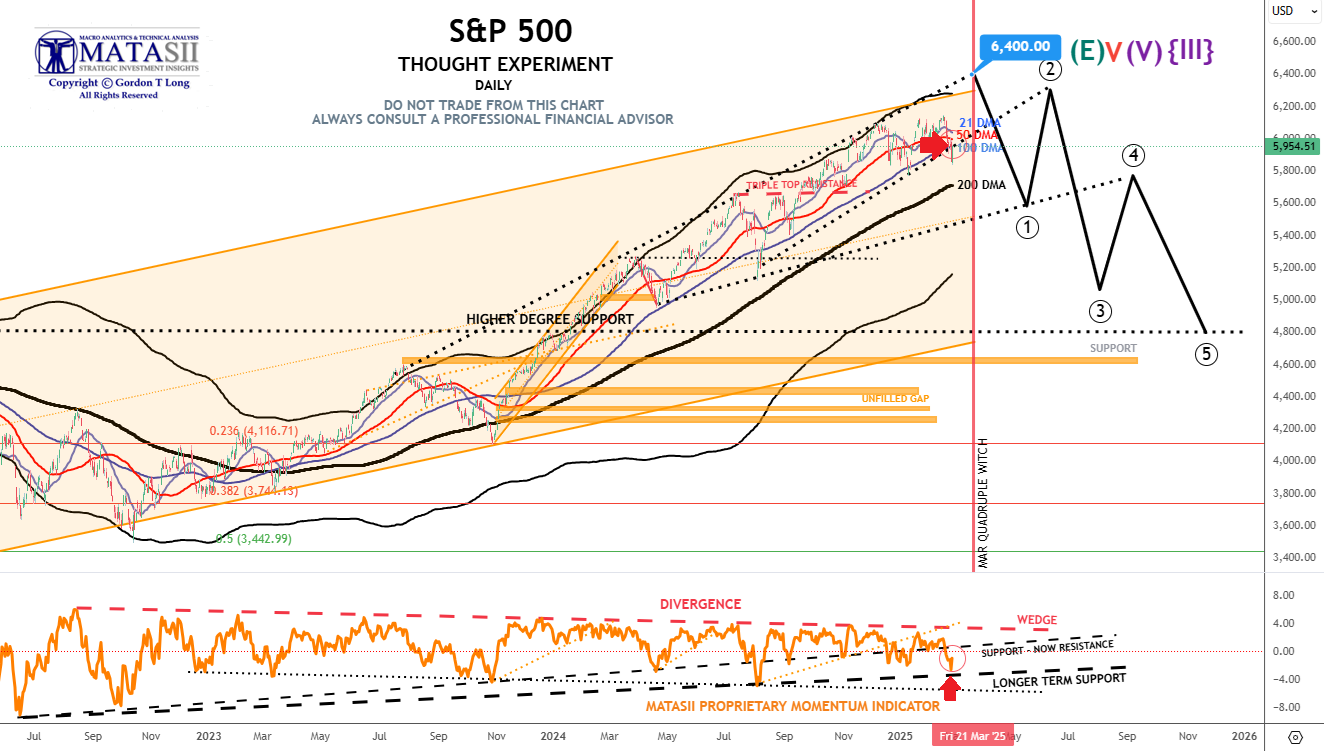
CHART NOTES:
-
PRICE - The S&P 500 was trading at the cash close Friday at 5954.51 up+92.95 (+1.59%) compared to last Friday's close at 6013.12.
-
DMA - Price found overhead resistance form the Friday bounce at the 100 DMA level.
-
MATASII PROPRIETARY MOMENTUM INDICATOR - Momentum in the middle panel offered support from which the bounce on Friday occurred (at the black dashed trend line & marked by the red arrow).
| | |
|
MARKET LAB
Being bearish on US mega-cap tech carries higher risk than being bullish.
Timing is crucial—history shows that even correctly calling the 2000 tech bubble peak but being early led to massive rallies against short positions (13% in one month, 31% in three, and 94% in six).
While today’s market may not have the same upside, shorting US tech still requires near-perfect timing.
| | |
|
YOUR DESKTOP / TABLET / PHONE ANNOTATED CHART
Macro Analytics Chart Above: SUBSCRIBER LINK
| |
|
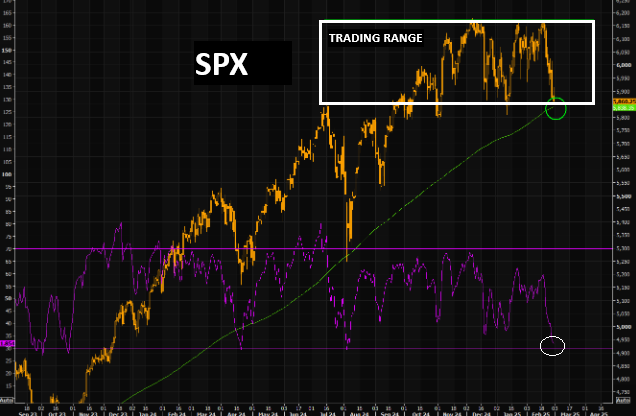
PATTERN:
S&P 500 - 02-28-25
SPX down to the lower part of the range, approaching the 200 day moving average quickly. RSI at the most oversold levels since early August. We are close to "bounce now or never" levels. Don't forget, this market lacks a medium term trend, and it was only last Friday we suggested the market was rolling over.
| | |
|
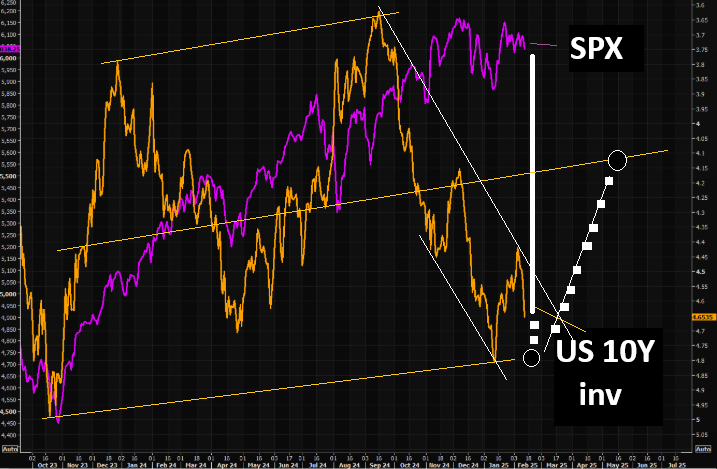
CORRELATION
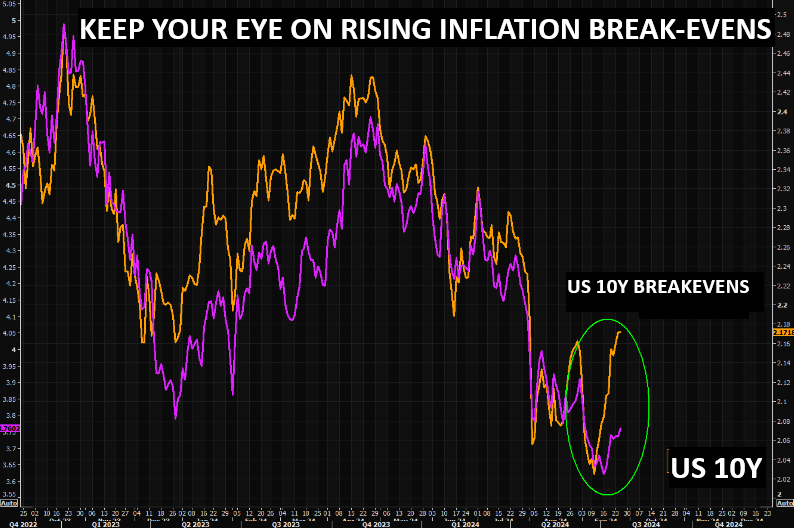
THE JAWS GAP - 02-12-25
The question is whether or not SPX decides to care about rates again. Chart shows SPX vs US 10 year (inv).
| | |
|
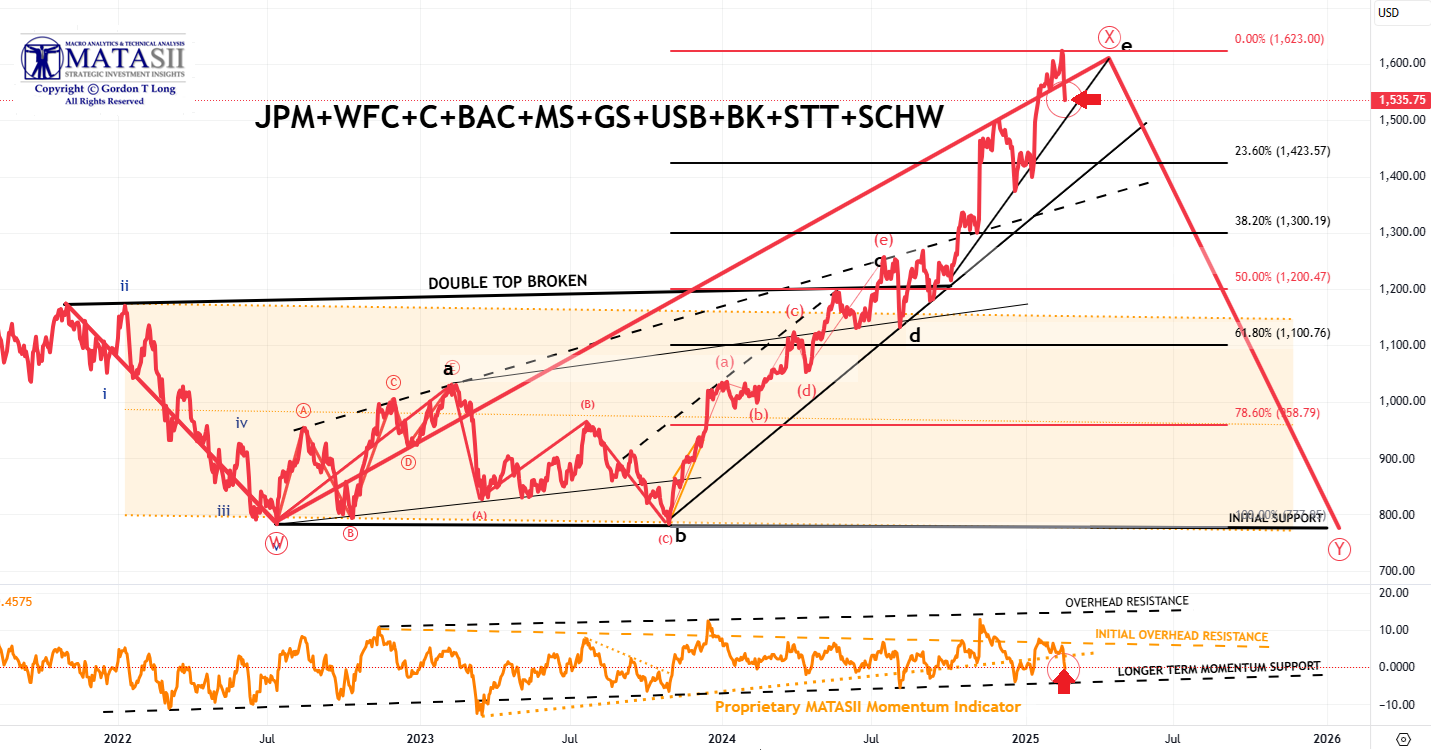
***THE MATASII BANK INDEX***
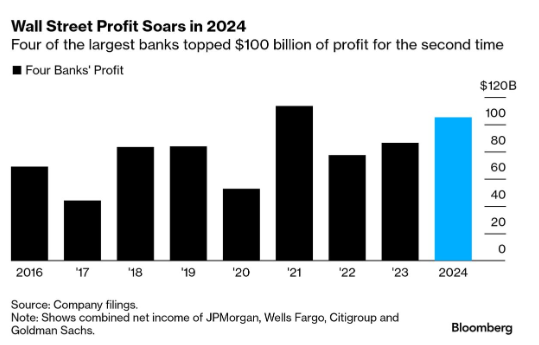
STRONG BANK EARNINGS & WEAKENING YIELDS PROPEL BANKS HIGHER
MATASII CHART NOTES:
-
PRICE - The MATASII Bank Index rose Friday closing at 1539.03 +34.01 (+2.26%) for the day and basically flat for the week compared to last Friday at 1535.75.
-
MATASII PROPRIETARY MOMENTUM INDICATOR - In the bottom panel, the MATASII Proprietary Momentum Indicator has not quite found firm support. Support appears to be lower at the dashed black trend line covered by the red arrow.
| | |
2024 Earnings for the four largest banks surged. | | |
|
YOUR DESKTOP / TABLET / PHONE ANNOTATED CHART
Macro Analytics Chart Above: SUBSCRIBER LINK
| |
MATASII BANK INDEX - ANALYTICS | |
|
PERFORMANCE - 02-17-25:
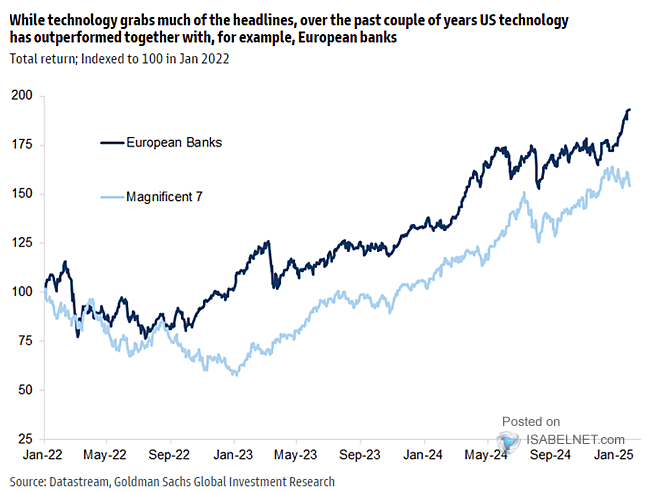
YTD: SX7E +20%, QQQ +5%, MAG +1%.
| | |
|
PATTERN
European Banks have been matching Mag-7 performance!
| | |
|
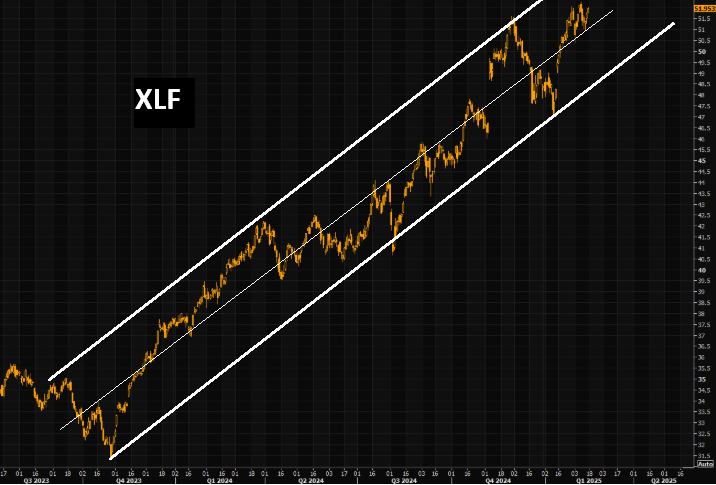
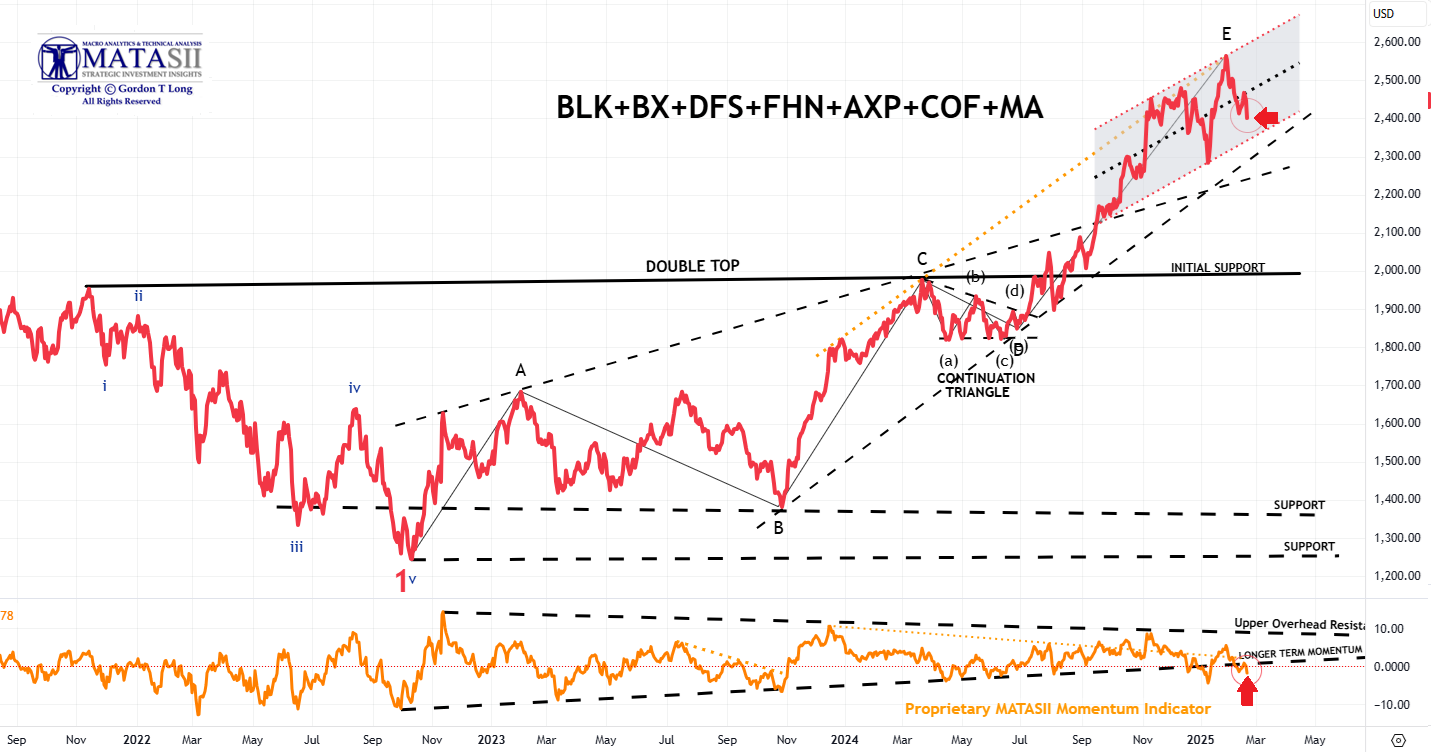
***THE MATASII FINANCIAL INDEX***
FINANCIAL MARKETS CURRENTLY STRONGER THAN MAG-7
MATASII CHART NOTES:
-
PRICE - The MATASII Financial Index rose this week to close Friday at 2433.49 up +62.99 (+2.66%) for the day compared to last Friday at 2400.00.
-
MATASII PROPRIETARY MOMENTUM INDICATOR - In the bottom panel, the MATASII Proprietary Momentum Indicator broke support at the black dashed line trend line highlighted by the red arrow, but rose back to it this week and is now acting as overhead resistance.
| | |
Over the past few weeks, the Financial Select Sector SPDR Fund (XLF) has experienced notable gains. | | |
|
YOUR DESKTOP / TABLET / PHONE ANNOTATED CHART
Macro Analytics Chart Above: SUBSCRIBER LINK
| |
MATASII FINANCIAL INDEX - ANALYTICS | |
|
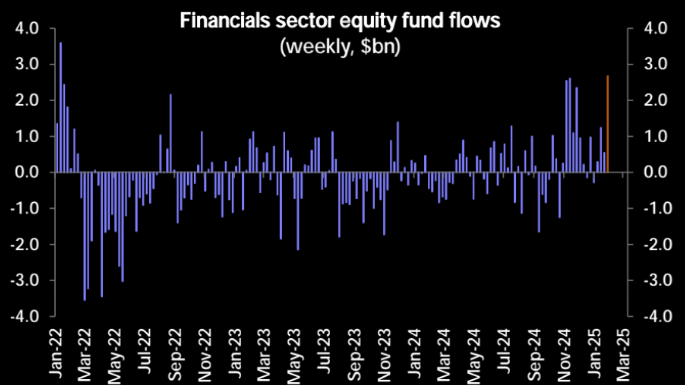
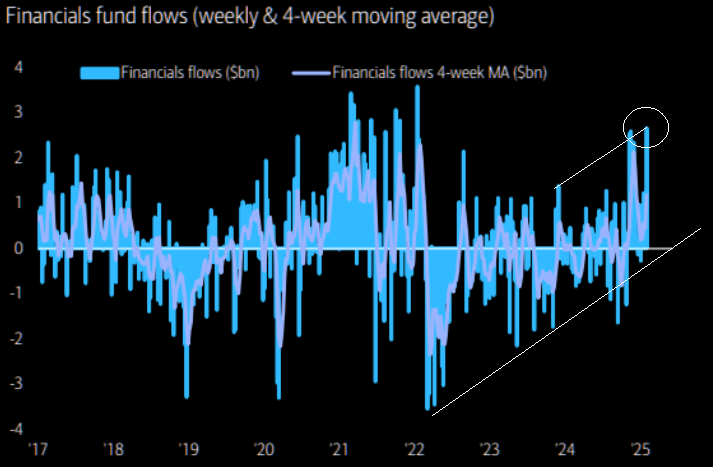
FUND FLOWS
02-04-25
Fund flows to Financials surged to a 3-year high on the back of strong Q4 earnings reports.
| | |
|
FUND FLOWS
02-02-25
Financial Mania - Biggest inflows to financials since Jan’ 22.
| | |
|
***IWM - LONG iSHARE RUSSELL 2000 ETF - Daily***
MATASII CHART NOTES:
-
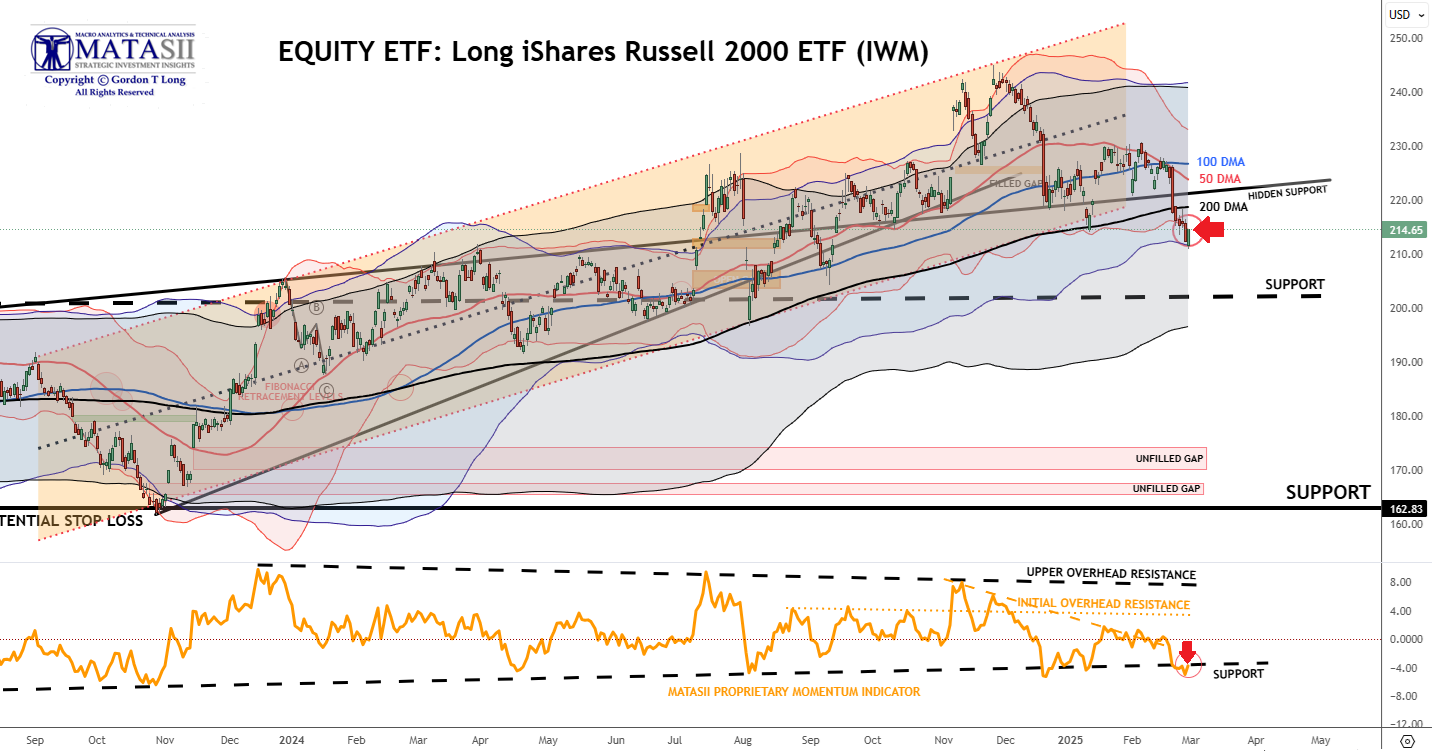
PRICE - The IWM - LONG iShare Russell 2000 ETF was up Friday closing at 214.65 +2.26 (+1.06%) compared to closing last Friday at 217.80.
-
DMA - Price broke support hard to the downside at the 200 DMA level.
-
MATASII PROPRIETARY MOMENTUM INDICATOR - The IWM found support at the Proprietary Momentum Indicator 's major support level (lower panel) shown by the dashed black line marked by the red arrow.
| | |
|
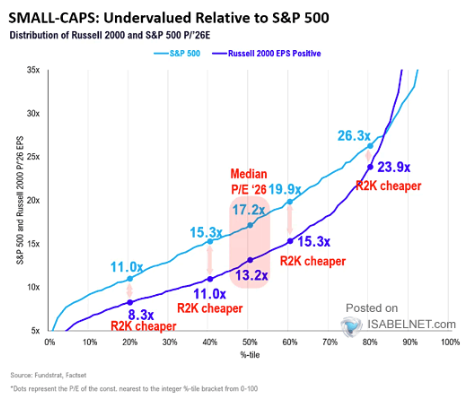
CORRELATION - 02-08-25
RUSSELL undervalued relative to S&P 500
| | |
|
YOUR DESKTOP / TABLET / PHONE ANNOTATED CHART
Macro Analytics Chart Above: SUBSCRIBER LINK
| |
|
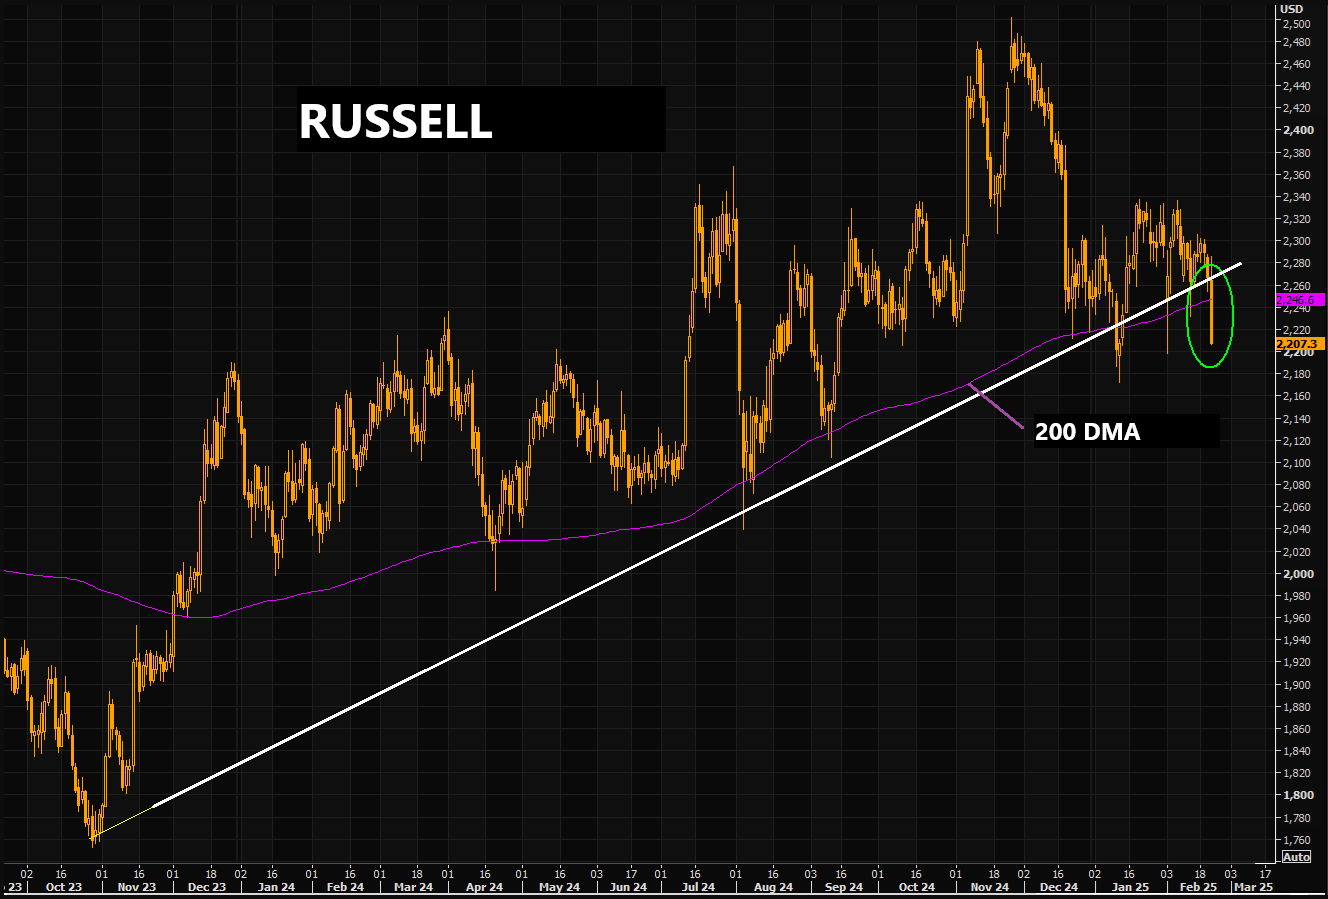
PATTERN - 02-21-25
Russell put in a massive down candle, breaking slightly below the 200 day moving average and the longer term trend line. No bueno.
| | |
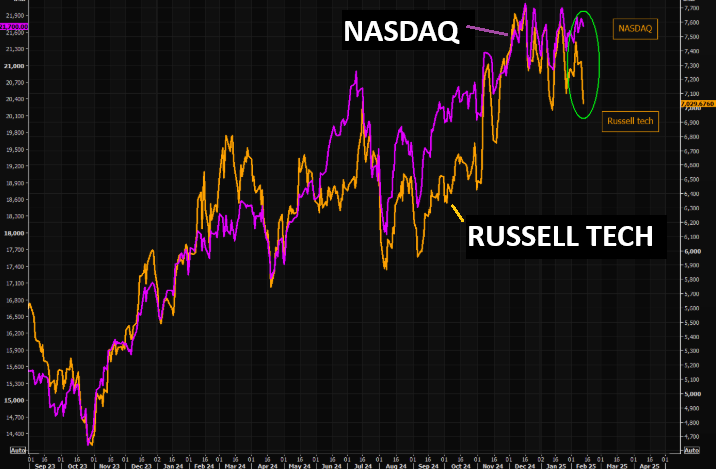
RUSSELL TECH - The low quality tech stuff has been fading lately... | | |
|
CONTROL PACKAGE
- APPLE - AAPL - DAILY (CHART LINK)
- AMAZON - AMZN - DAILY (CHART LINK)
- META - META - DAILY (CHART LINK)
- GOOGLE - GOOG - DAILY (CHART LINK)
- NVIDIA - NVDA - DAILY (CHART LINK)
- MICROSOFT - MSFT - DAILY (CHART LINK)
- TESLA - TSLA - DAILY (CHART LINK)=
| | |
| |
|
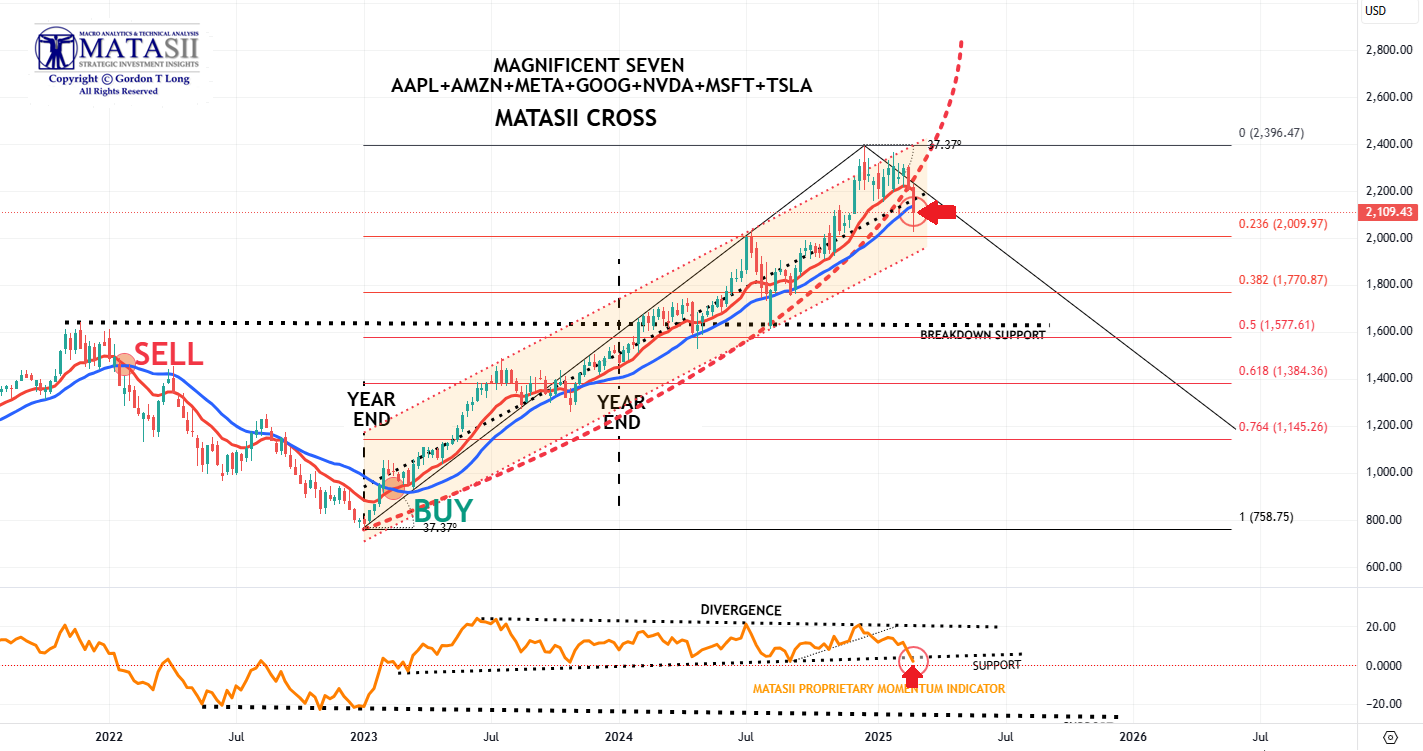
***MAGNIFICENT 7***
MATASII CHART NOTES:
-
PRICE - The Mag-7 closed Friday at 2109.43 up +40.31 (+1.95%) compared to last Friday when we closed at 2207.70.
-
MATASII PROPRIETARY MOMENTUM INDICATOR - Meanwhile the MATASII Proprietary Momentum Indicator (lower panel) showed the support level marked by the dotted black trend line and the red arrow offered support for Friday's rally.
| | |
|
MARKET LAB
Consider that the typically high-performing S&P 500 technology sector lagged the broader index in January by the widest margin since 2016. Four of the Magnificent 7 have recently been trading below their 50-day moving averages, another bearish signal for traders. In addition, hedge funds are increasingly reducing gross exposures to these kinds of stocks for the first time in a year, while company insiders are selling shares at the highest rate since 2021, raising questions about the companies' ability to achieve earnings targets and justify their lofty valuations. (Morgan Stanley)
| | |
|
YOUR DESKTOP / TABLET / PHONE ANNOTATED CHART
Macro Analytics Chart Above: SUBSCRIBER LINK
| |
|
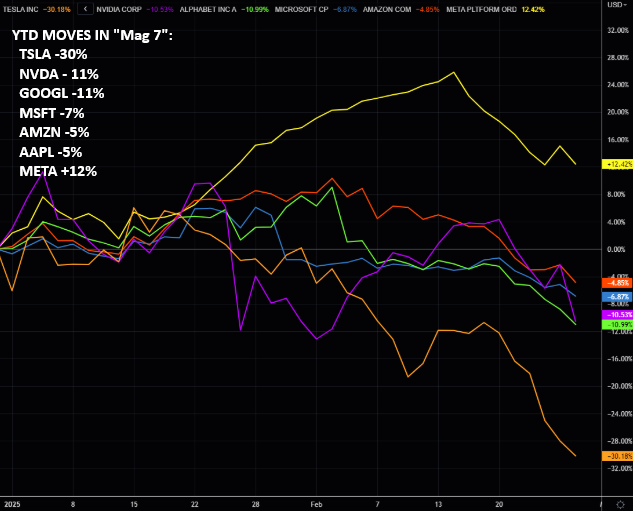
NEW-- PATTERNS - 02-28-25
MAG7 - YTD moves in "Mag 7":
TSLA -30% / NVDA - 11% / GOOGL -11% / MSFT -7% / AMZN -5% / AAPL -5%...META +12%
| | |
|
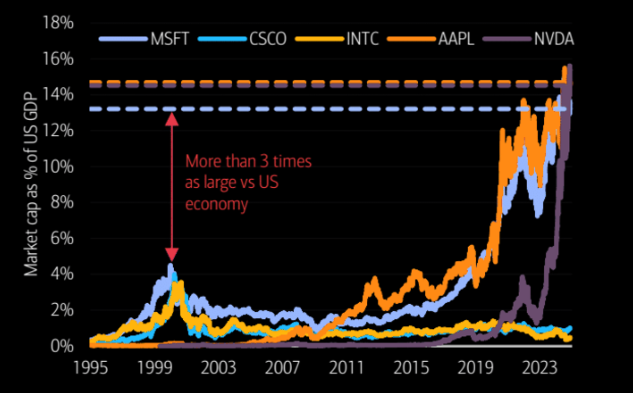
CORRELATION
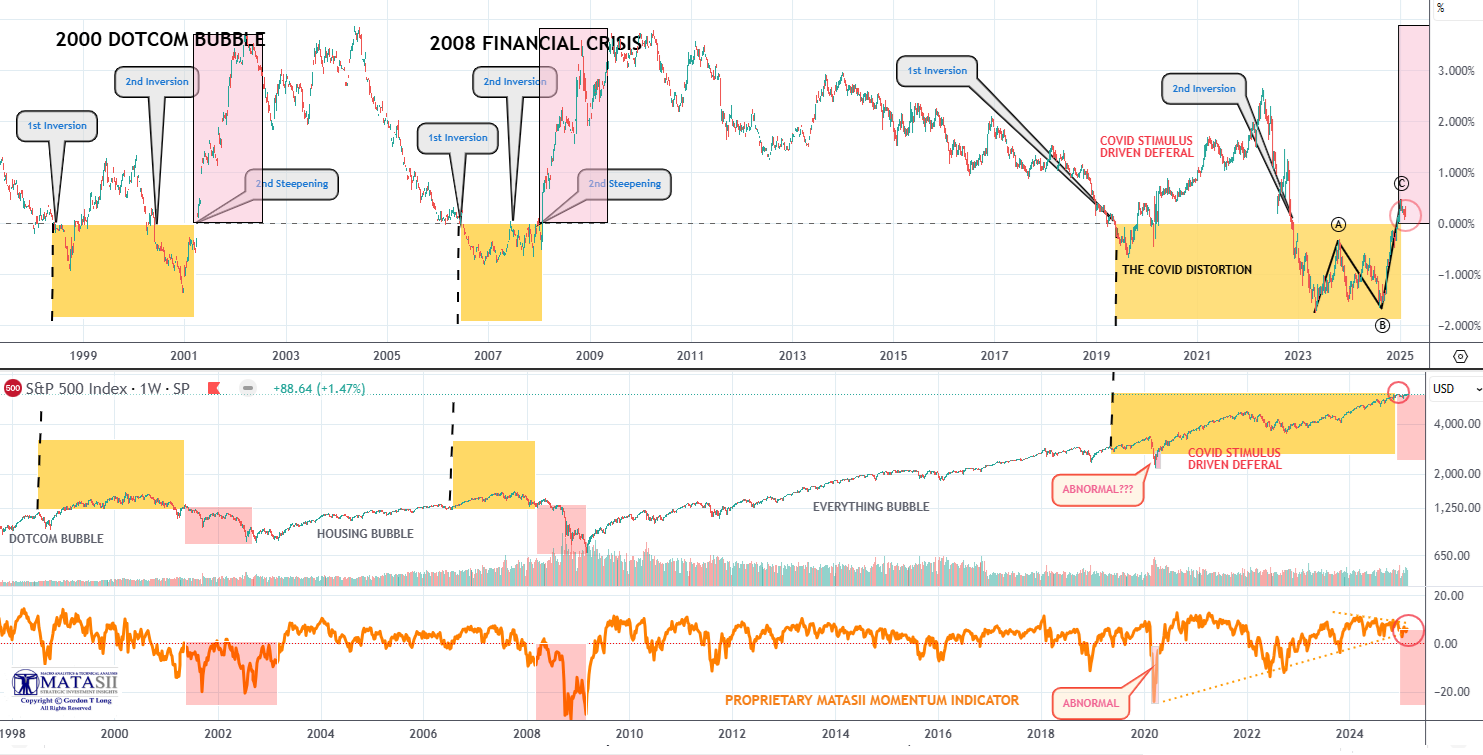
This chart makes the 2000 Dotcom Bubble look like a "minor warm-up"?
| | |
|
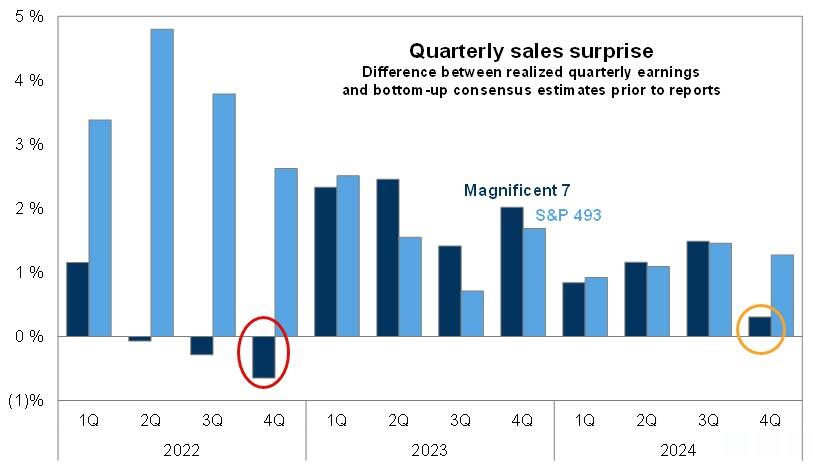
NEW-- EARNING SEASON RECAP
02-28-25
This earnings season was the first time in two years that the 'Magnificent 7' stocks did NOT handily beat sales estimates.
Mag7 stocks are down over $625 billion in market cap in the last two weeks, (with only META and NVDA up this week). The chart below shows the weekly trading percentage changes of each of the Mag-7 since August 2024.
| |
|
|
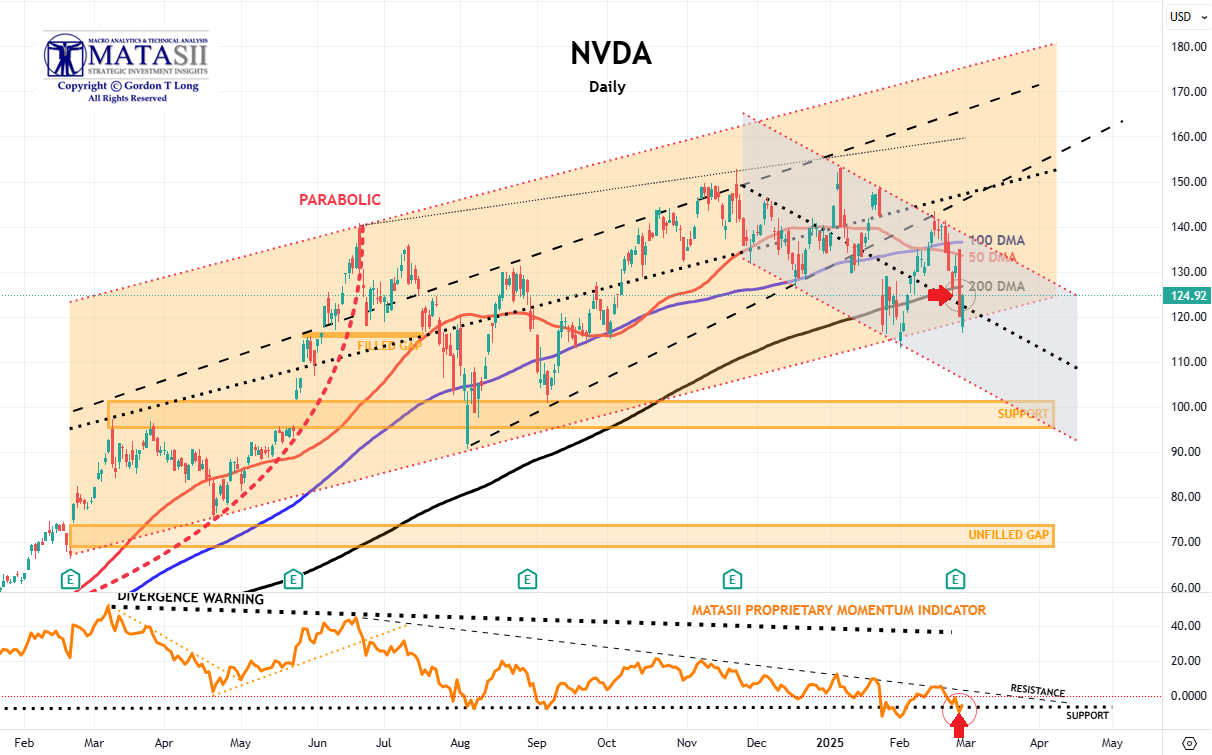
***NVIDIA - NVDA - DAILY***
MATASII CHART NOTES:
-
PRICE - NVDA pushed higher closing Friday at 124.92 up +4.77 (+3.97%) compared to last Friday at 134.43.
-
DMA - Price has broken below the 200 DMA and near the lower bound of the falling trend channel.
-
MATASII PROPRIETARY MOMENTUM INDICATOR - The NVDA MATASII Momentum indicator found support at its lower support level (black dashed line) marked by the red arrow.
NVDA ANNOUNCES ITS EARNINGS WEDNESDAY AFTER THE MARKET CLOSE.
THIS WILL BE AN IMPORTANT EVENT
THIS WEEK.
Prior Longer Term Note:
- At some point, the major unfilled gaps (at much lower levels) must be filled. We anticipate a likely test of the 200 DMA in Q4 2024 or Q1 2025.
- NVDA therefore may no longer become a Short to Intermediate Long Term hold, but rather a position trading stock, as other competitors enter the space, force margins and the earnings growth rate contracts.
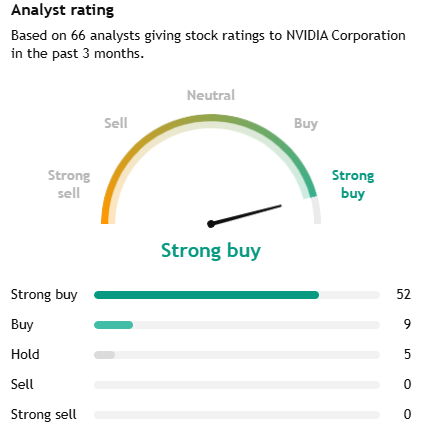
NOTE RIGHT: Analyst Rating to the right are always too positive and delayed. History suggests the trick is to BEGIN reducing positions as soon as ANYONE changes their rating to Hold or Lower
5 OUT OF 66 IS A CONCERN
(We use the ratings for Mag-7 Only)
| | |
|
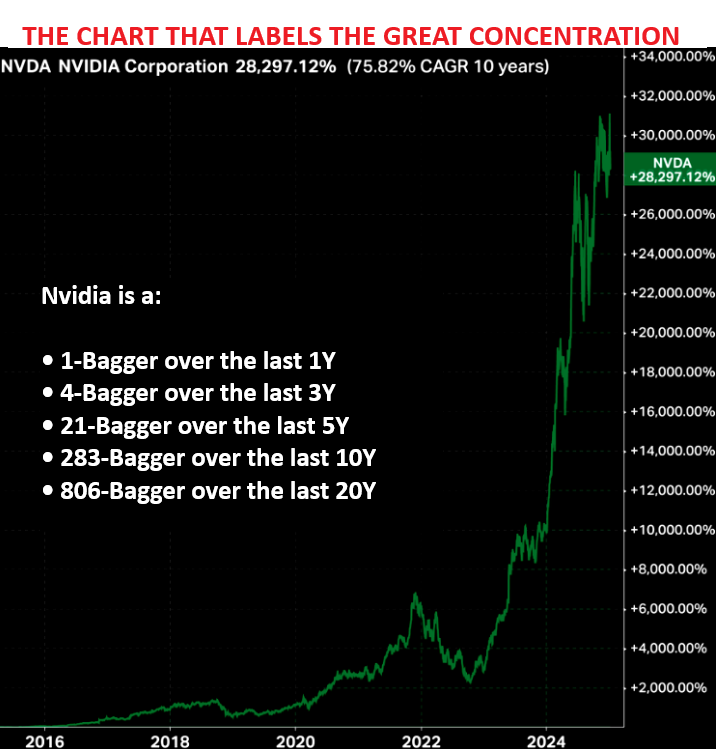
MARKET LAB
AS GOES NVDA SO GOES THE MAG-7!
AS GOES THE MAG-7 SO GOES THE MARKET!
| |
With a market cap of $3.61tn and nearly as big as the entire DAX and CAC combined, earnings are going to be a big event. To give you a scale for their astonishing earnings trajectory over such a short period of time, at the recent lows in Jan 2023 Nvidia earned $4.4bn over the preceded last 12m. However, today the consensus will see then earn $61.4bn over the last 12 months. By the time we hit 2027, they are expected to earn $118.1bn LTM.
The growth in NVDA’s forward revenues and operating earnings have both been remarkable, as has its ability to maintain a forward profit margin north of 55%. Nvidia’s forward P/E of 32.6 is certainly higher than the S&P 500’s forward earnings multiple of 21.6. But it looks reasonable relative to the company’s expected forward earnings growth of 53.1%.
| | |
|
YOUR DESKTOP / TABLET / PHONE ANNOTATED CHART
Macro Analytics Chart Above: SUBSCRIBER LINK
| | |
| |
|
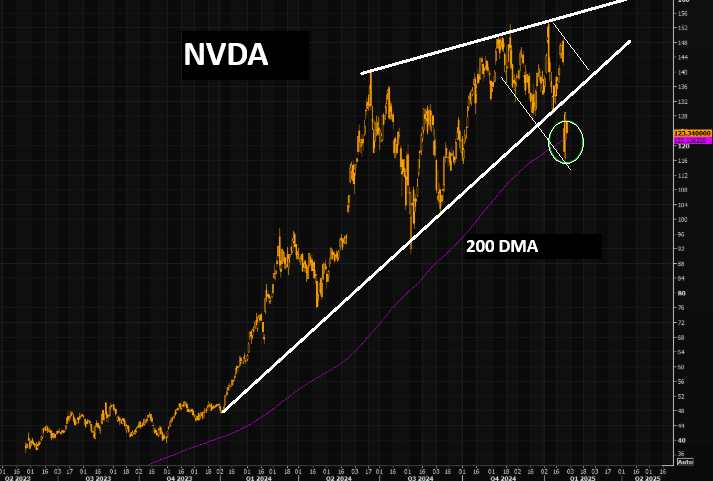
CHART RIGHT-- NVDA - 01-29-25
Fighting the 200 DMA
NVDA is trading right on the 200 day moving average as of writing. Massive moves, especially if you consider the changes in market cap. This is not how strong leaders behave.
| | |
|
***GOOGLE - GOOG - DAILY***
MATASII CHART NOTES:
-
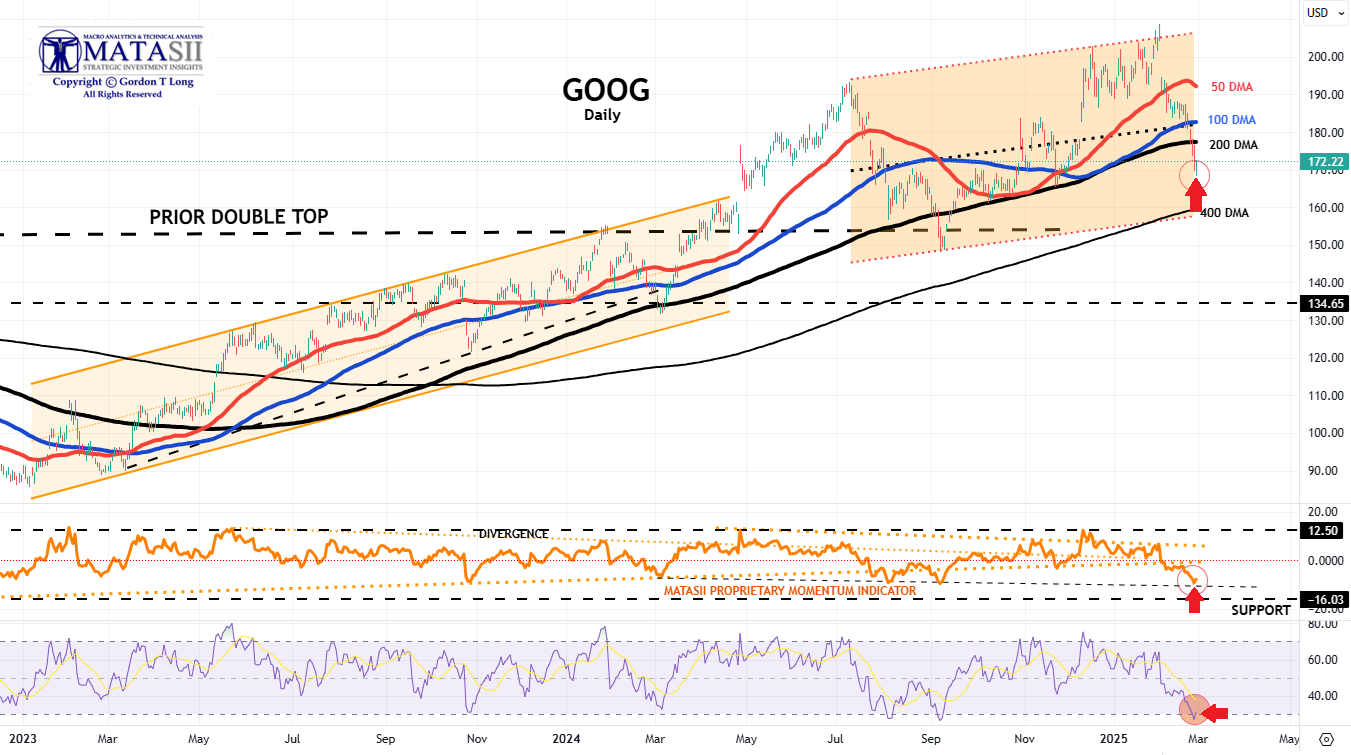
PRICE - GOOG closed higher for the day on Friday at 172.22 up +2.01 (+1.18%) but down significantly when compared to 181-587 last Friday.
-
DMA - Price broke through support at the 200 DMA
-
MATASII PROPRIETARY MOMENTUM INDICATOR - Momentum found support at the dashed black trend level marked by the red arrow in the lower panel.
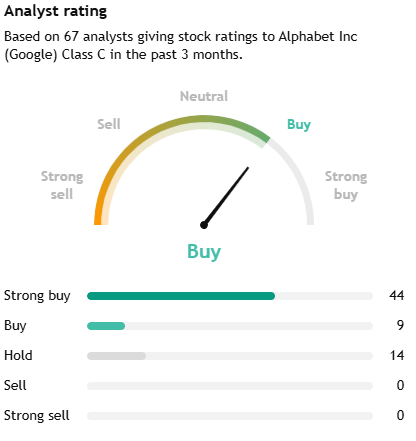
NOTE RIGHT: Analyst Rating to the right are always too positive and delayed. History suggests the trick is to BEGIN reducing positions as soon as ANYONE changes their rating to Hold or Lower
14 OUT OF 67 IS EXCESSIVE
(We use the ratings for Mag-7 Only)
| | |
|
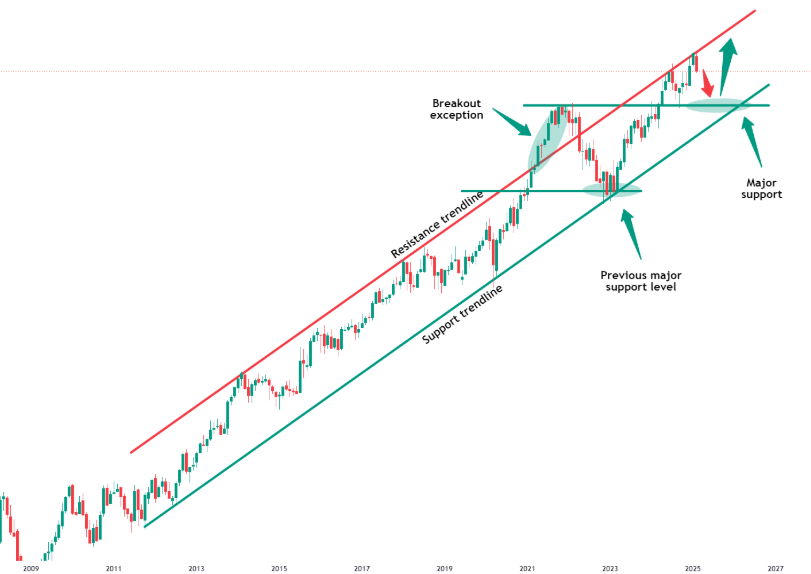
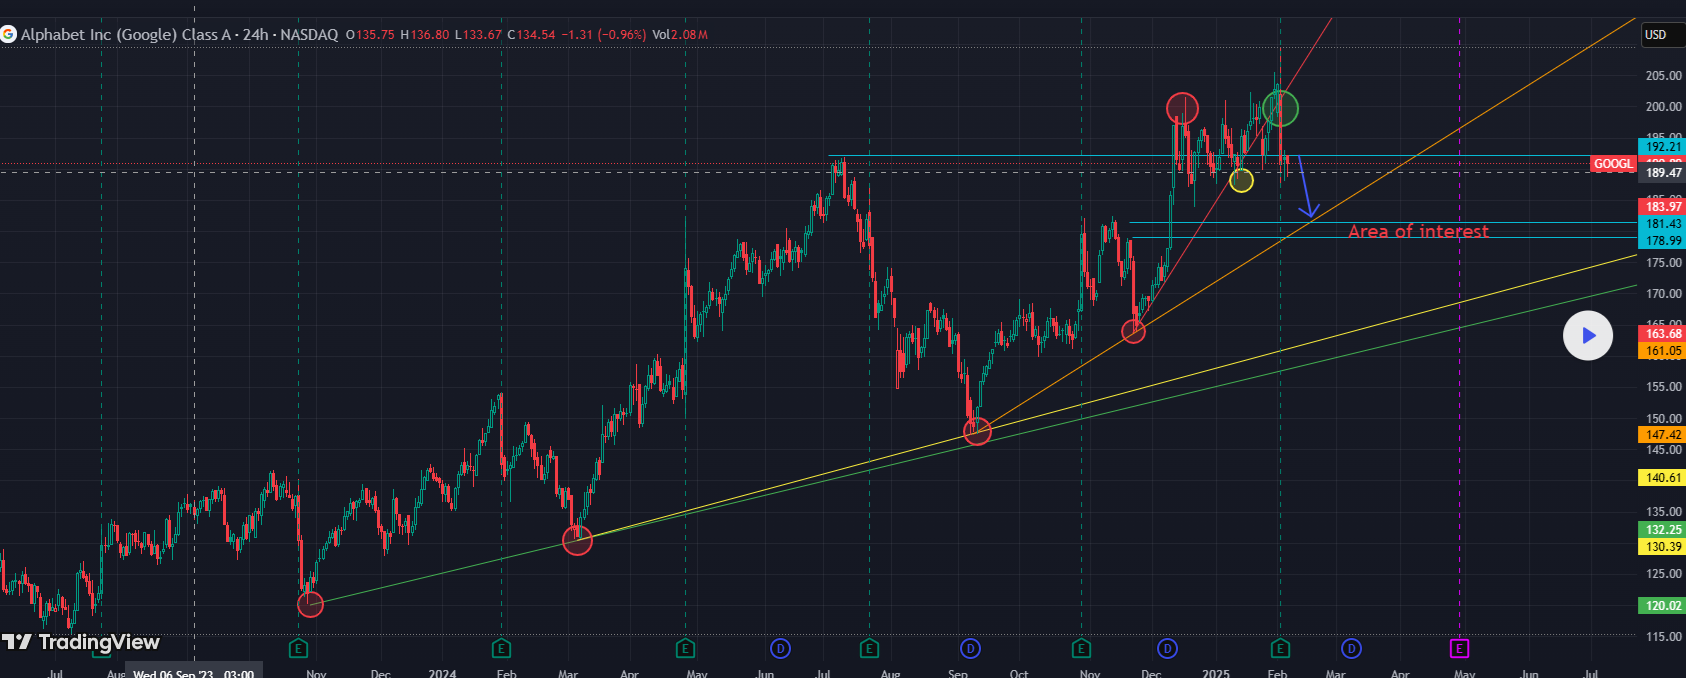
NEW-- GOOG - 02-21-25
Google is slowly but clearly starting to shift back to a bearish market and especially since indices are heading for new all time highs. Google is showing some real weakness. Waiting patiently for another -20% here is key and until then all we can do is sit on the sidelines.
| | |
|
YOUR DESKTOP / TABLET / PHONE ANNOTATED CHART
Macro Analytics Chart Above: SUBSCRIBER LINK
| |
|
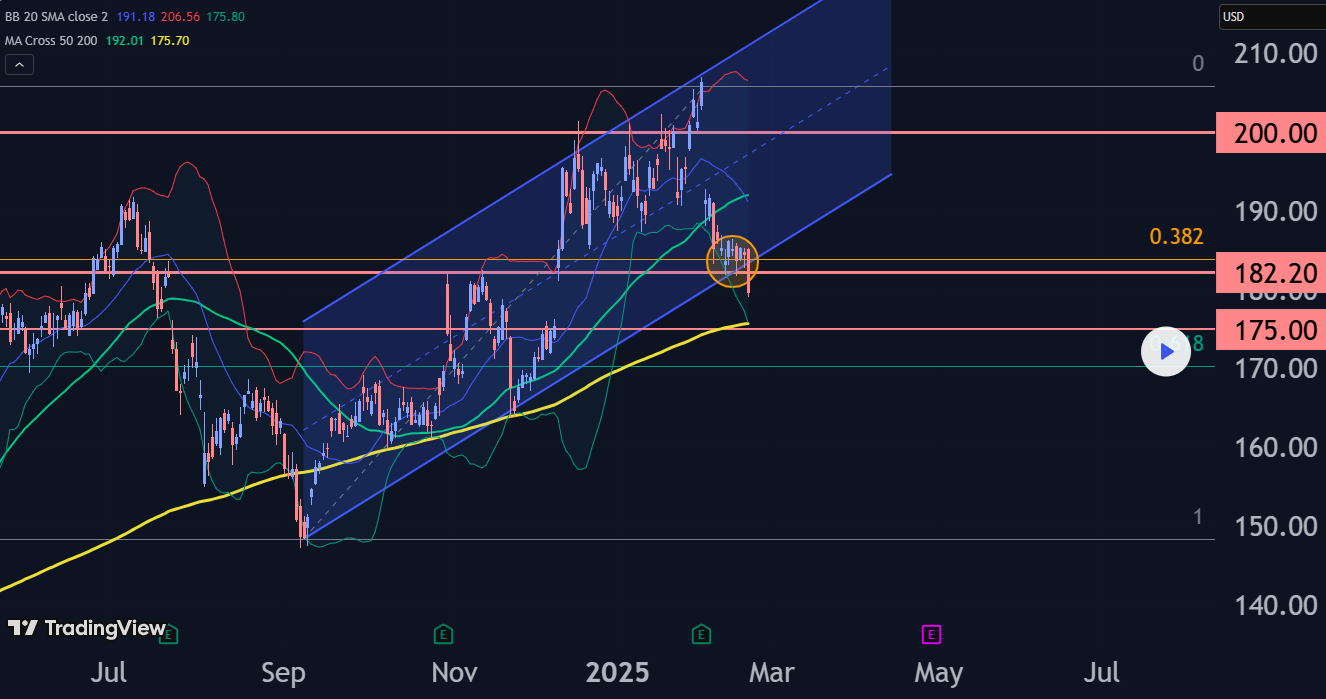
NEW-- GOOG - 02-21-25
Google under bearish pressure - Likely to test support level of 175.00.
| | |
|
NEW-- GOOG - 02-21-25
Looks like GOOG is pulling back with the rest of the market. Discount buying opportunity or more downside to $180 area.
| | |
|
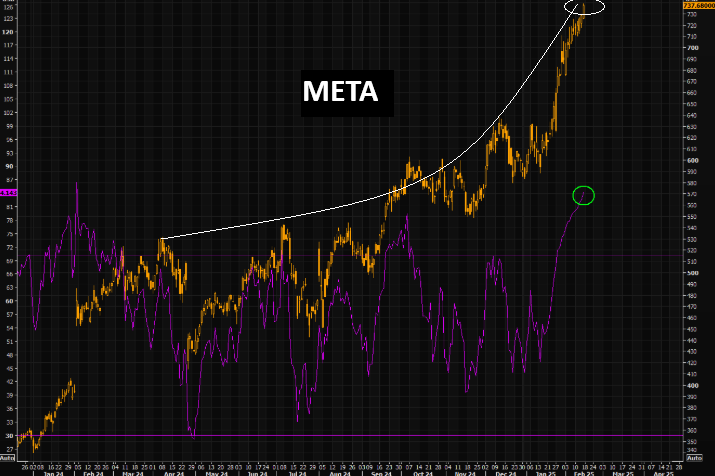
***META - META - DAILY***
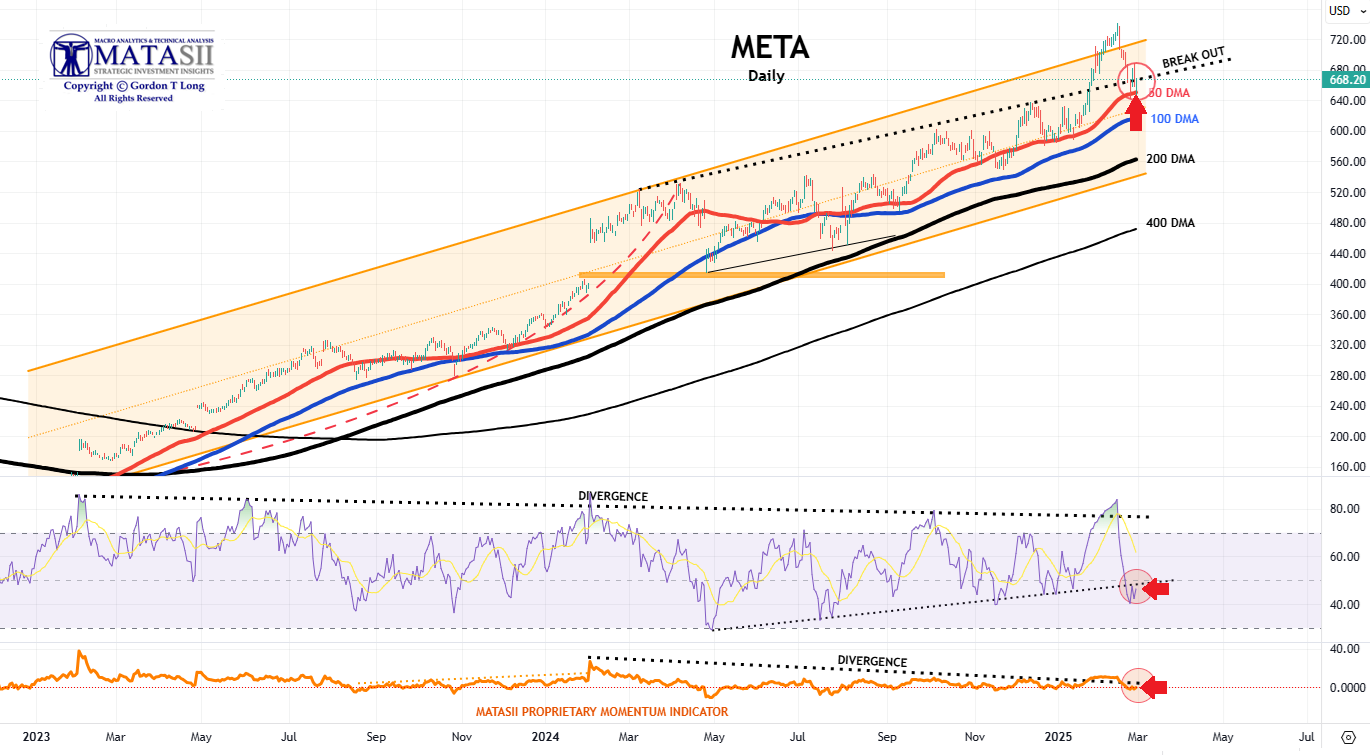
MATASII CHART NOTES:
-
PRICE - META was down to 683.55 -11.29 (-1.62%) from last Friday's close at 736.67.
-
RSI - META is near its support level.
-
MATASII PROPRIETARY MOMENTUM INDICATOR - The MATASII Momentum Indicator is trying to break lower from its previous overhead Resistance level shown by the black dotted trend line and marked by the red arrows.
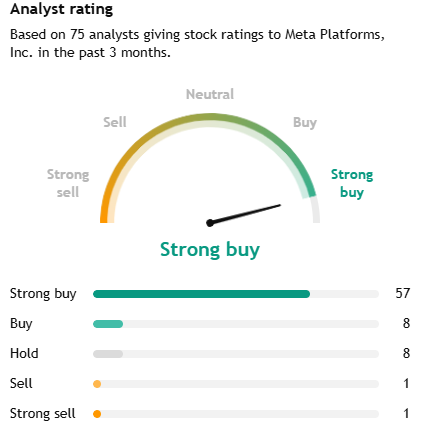
NOTE RIGHT: Analyst Rating to the right are always too positive and delayed. History suggests the trick is to BEGIN reducing positions as soon as ANYONE changes their rating to Hold or Lower
10 OUT OF 75 IS EXCESSIVE
(We use the ratings for Mag-7 Only)
| | |
| |
|
YOUR DESKTOP / TABLET / PHONE ANNOTATED CHART
Macro Analytics Chart Above: SUBSCRIBER LINK
| |
|
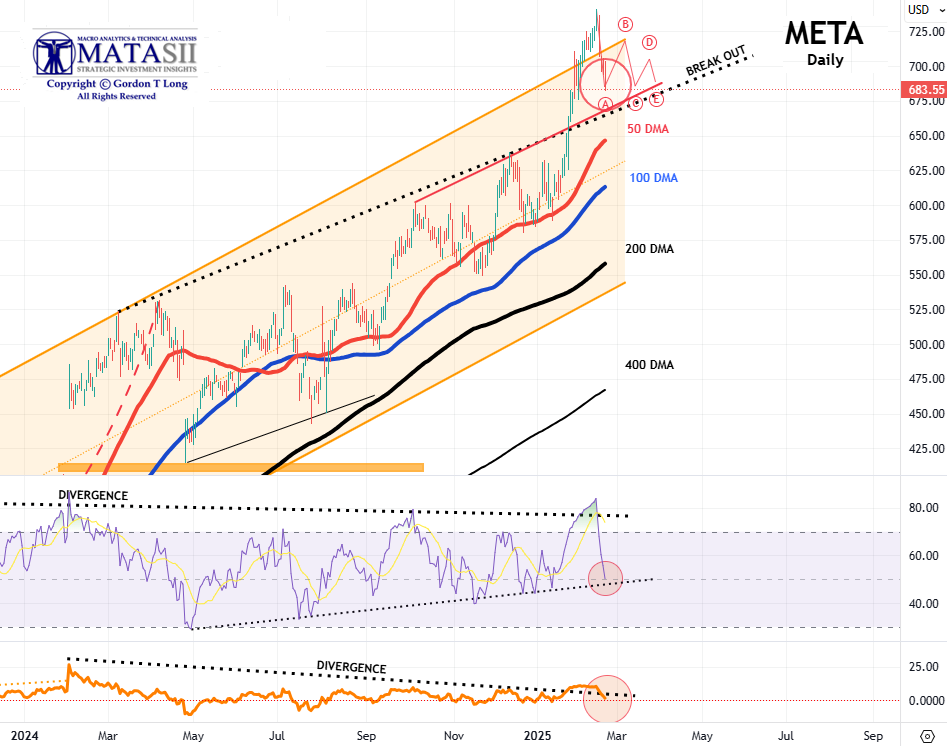
NEW-- PATTERN - META - 02-21-25
META likely to now enter a corrective consolidation.
| | |
|
PATTERN
META MANIA - Another day, another record for META, the stock that can't go down. RSI at 84!
| | |
|
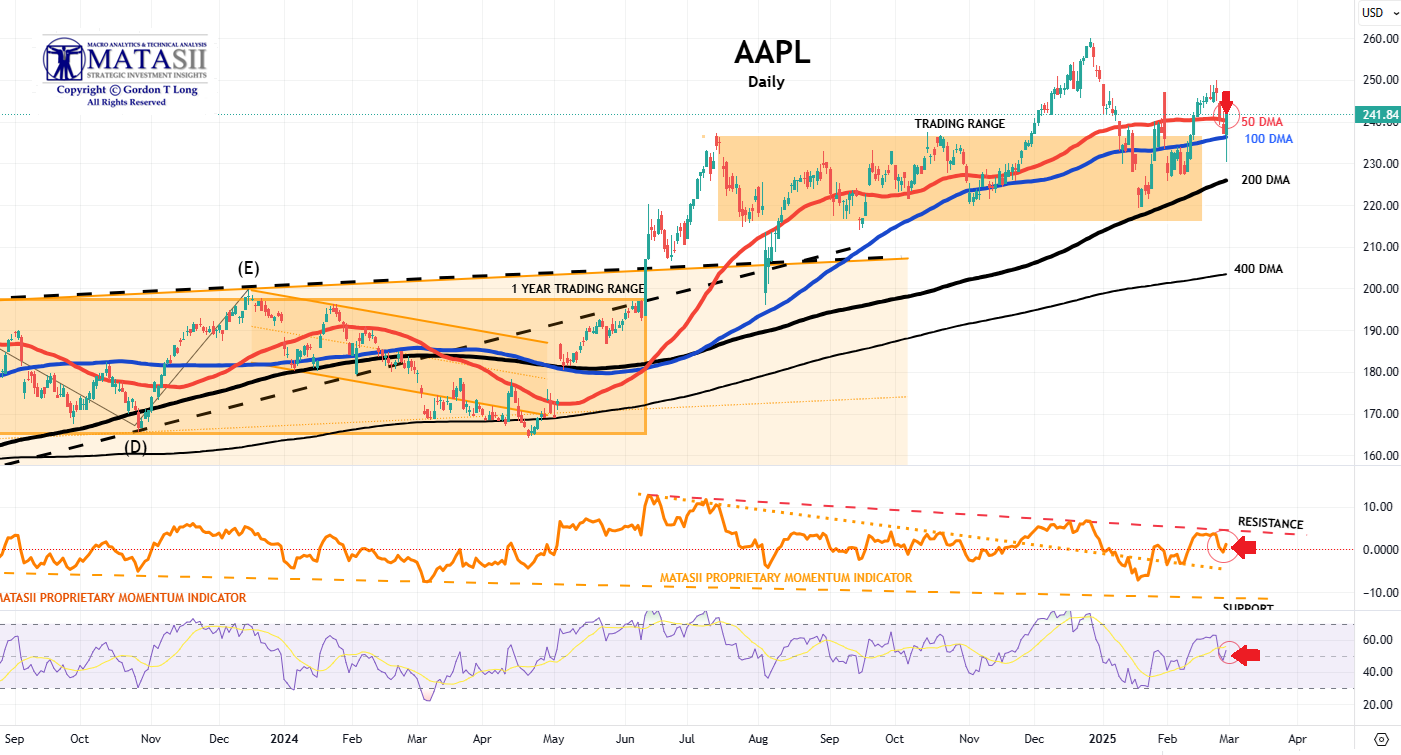
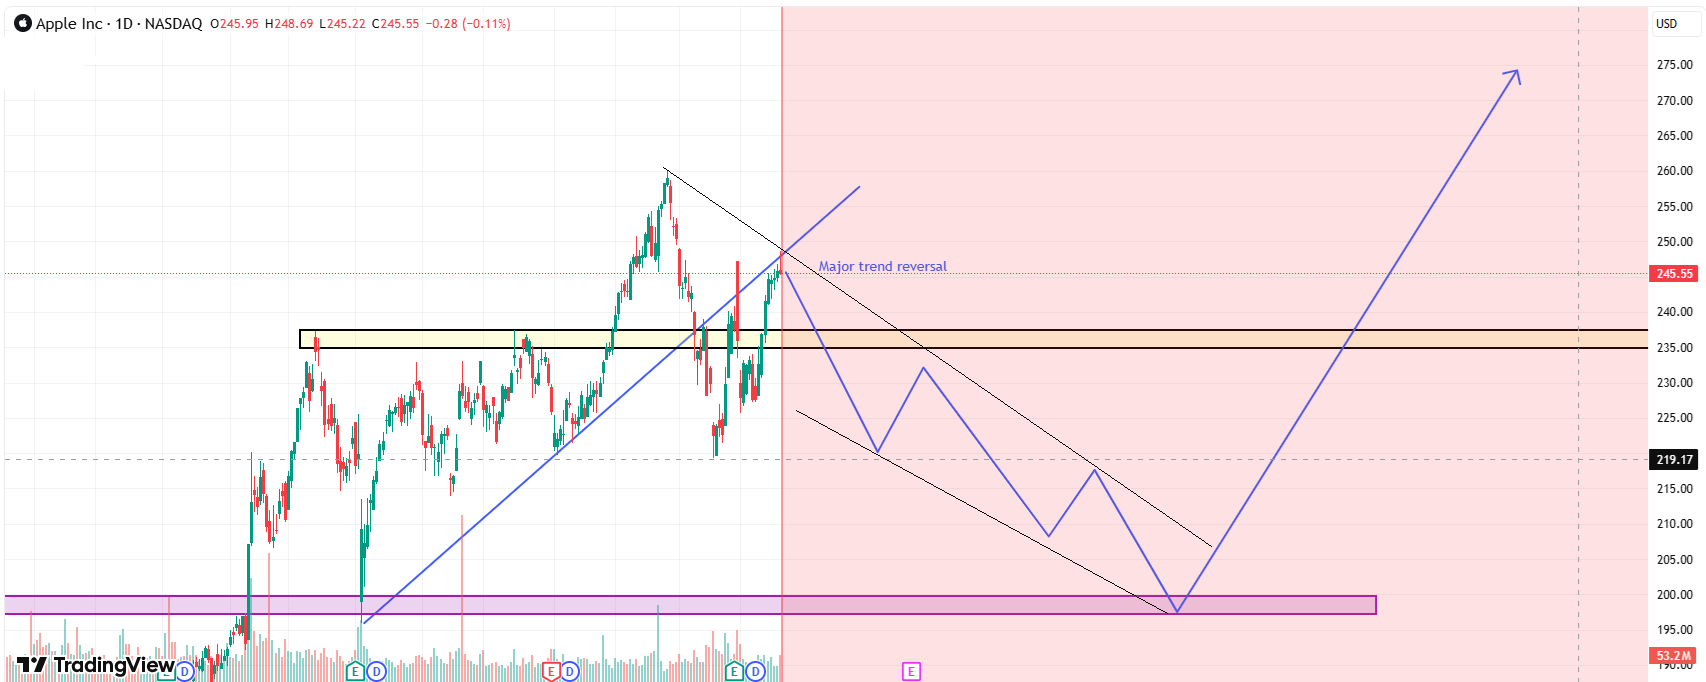
***APPLE - AAPL - DAILY***
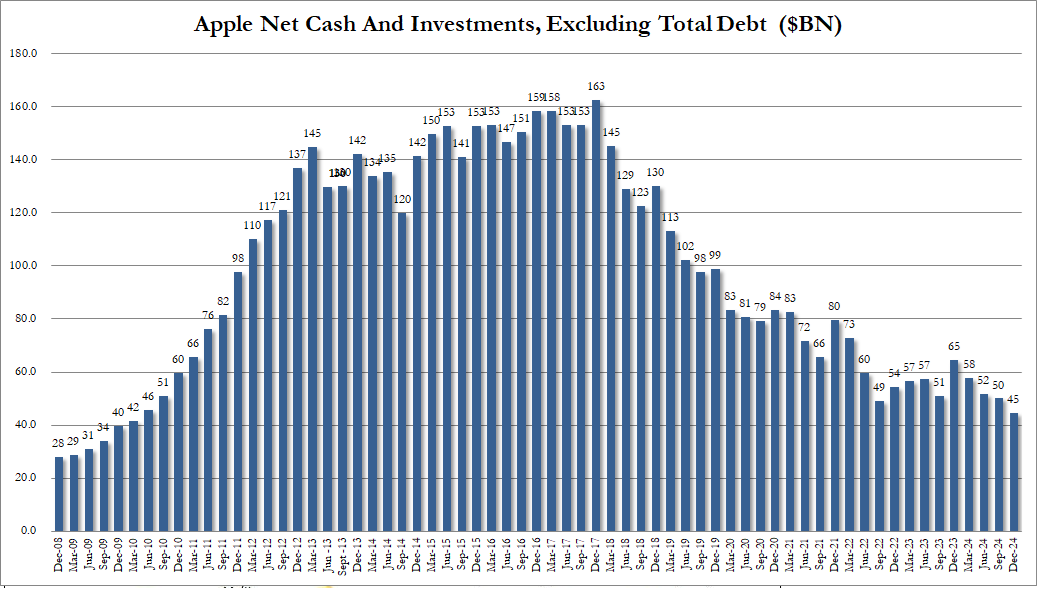
CHART RIGHT: Does Apple have the cash to sustain its highly aggressive stock buyback program which has been supporting its Price per Share?
MATASII CHART NOTES:
-
PRICE - AAPL closed at 241.84 up 4.54 (+1.91%) for the day and compared to last Friday at 244.604.
-
DMA - AAPL has broken higher through the 50 DMA overhead resistance level.
-
MATASII PROPRIETARY MOMENTUM INDICATOR - AAPL's MATASII Proprietary Momentum Indicator marked by the red arrow in the middle panel is currently flat.
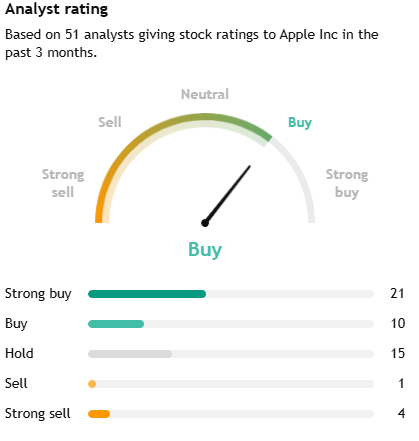
NOTE RIGHT: Analyst Rating to the right are always too positive and delayed. History suggests the trick is to BEGIN reducing positions as soon as ANYONE changes their rating to Hold or Lower
20 OUT OF 51 IS EXCESSIVE
(We use the ratings for Mag-7 Only)
| | |
|
NEW-- AAPL - 02-21-25
AAPL's Net Cash & Investments after excluding total Debt to organically fund buybacks!
| | |
|
YOUR DESKTOP / TABLET / PHONE ANNOTATED CHART
Macro Analytics Chart Above: SUBSCRIBER LINK
| |
|
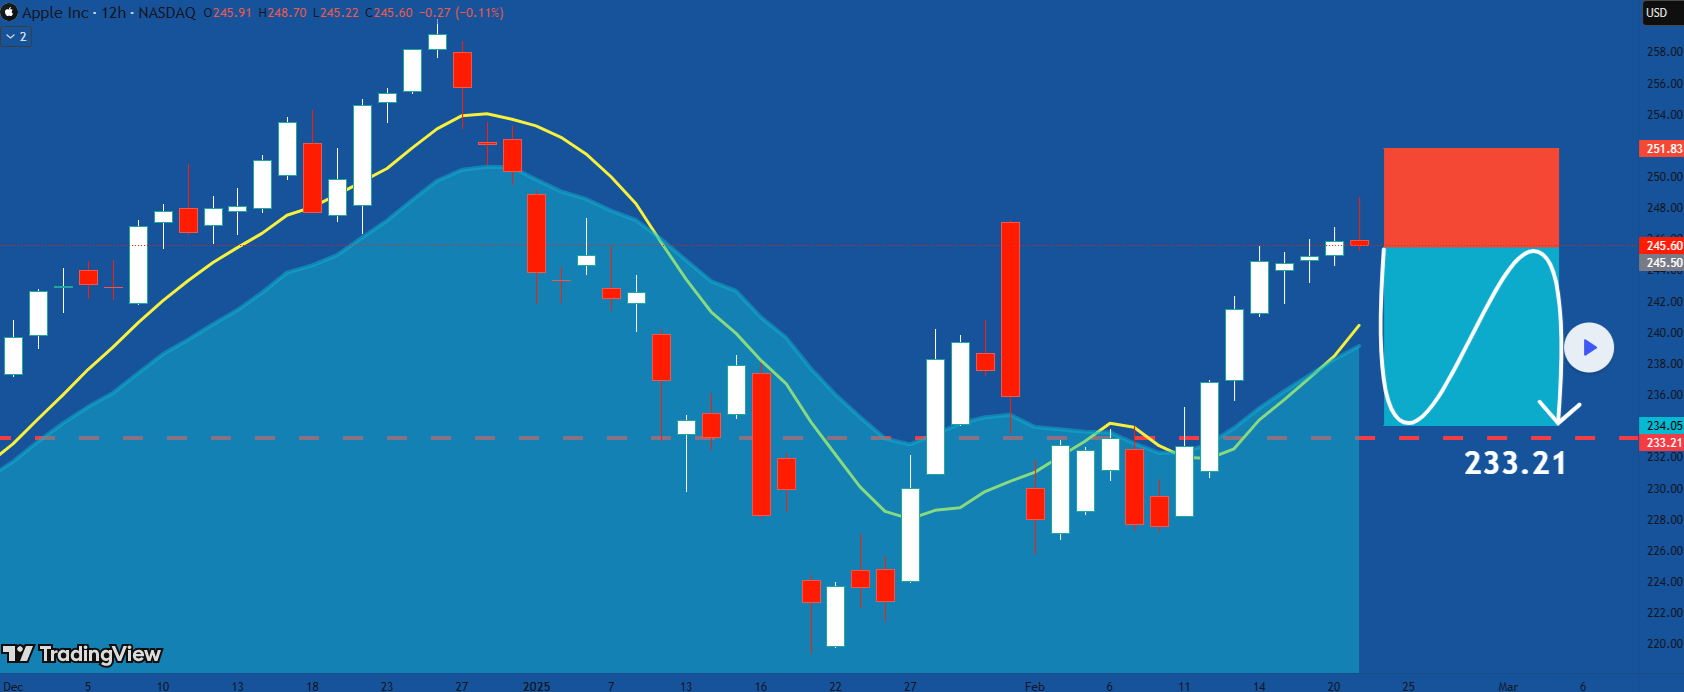
NEW-- AAPL - 02-21-25
We are looking for next phase dump.
| | |
|
NEW-- AAPL - 02-21-25
Classic bearish formation - expect a fall.
| | |
|
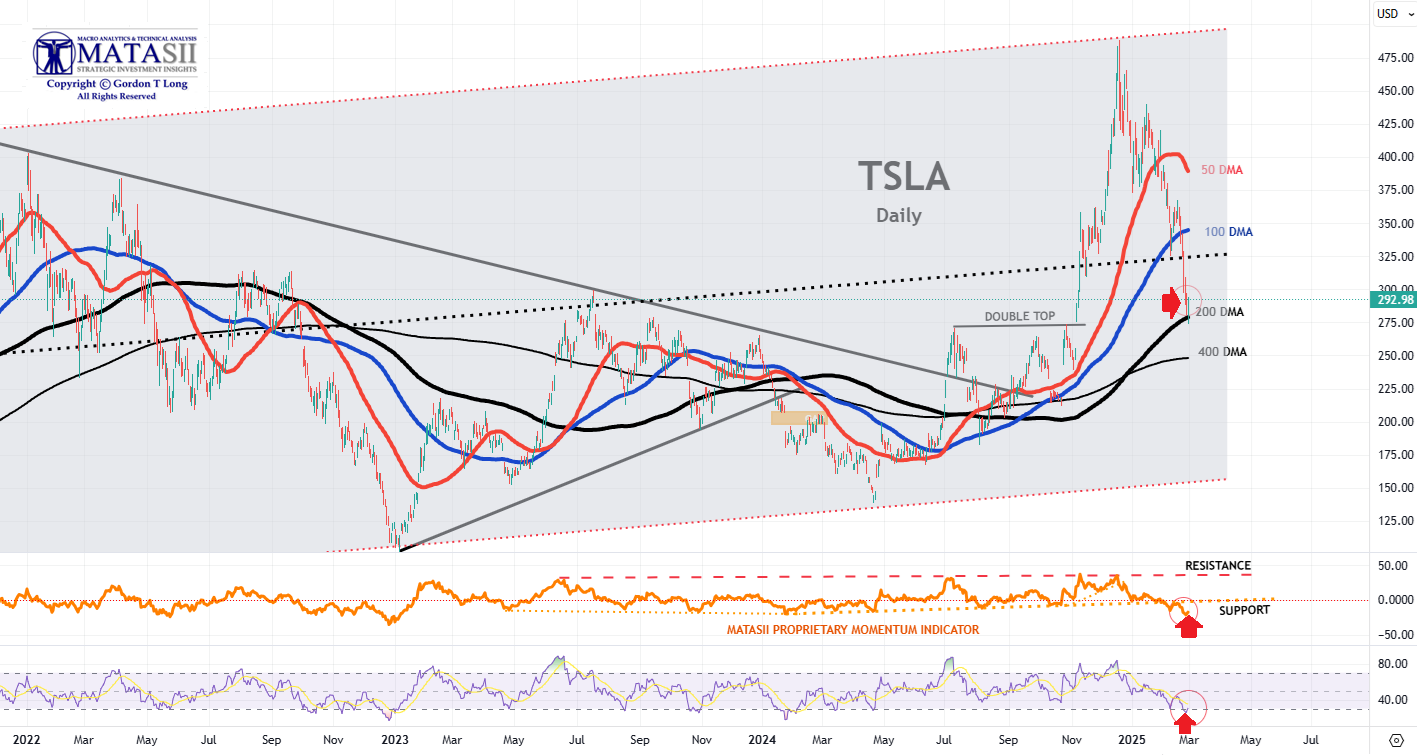
***TESLA - TSLA - DAILY***
MATASII CHART NOTES:
-
PRICE - TSLA closed up Friday at 292.98 +11.03 (+3.91%) compared to last Friday at 337.804.
-
DMA - Price found support at the 100 DMA before bouncing on Friday.
-
MATASII PROPRIETARY MOMENTUM INDICATOR - TSLA's MATASII Momentum Indicator offering support as shown by the orange dotted trend line in the middle panel and marked by the red arrow was decisively broken.
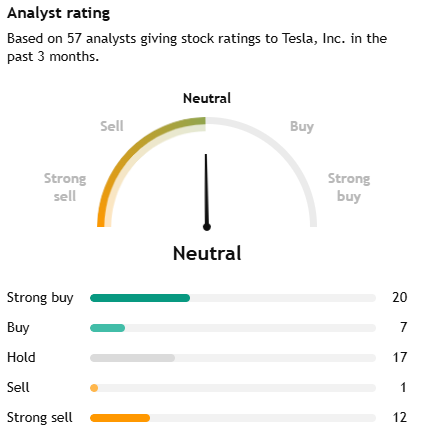
NOTE RIGHT: Analyst Rating to the right are always too positive and delayed. History suggests the trick is to BEGIN reducing positions as soon as ANYONE changes their rating to Hold or Lower
30 OUT OF 57 IS EXCESSIVE
(We use the ratings for Mag-7 Only)
| | |
| |
|
YOUR DESKTOP / TABLET / PHONE ANNOTATED CHART
Macro Analytics Chart Above: SUBSCRIBER LINK
| |
|
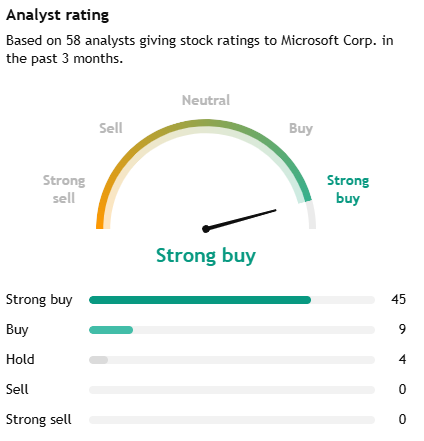
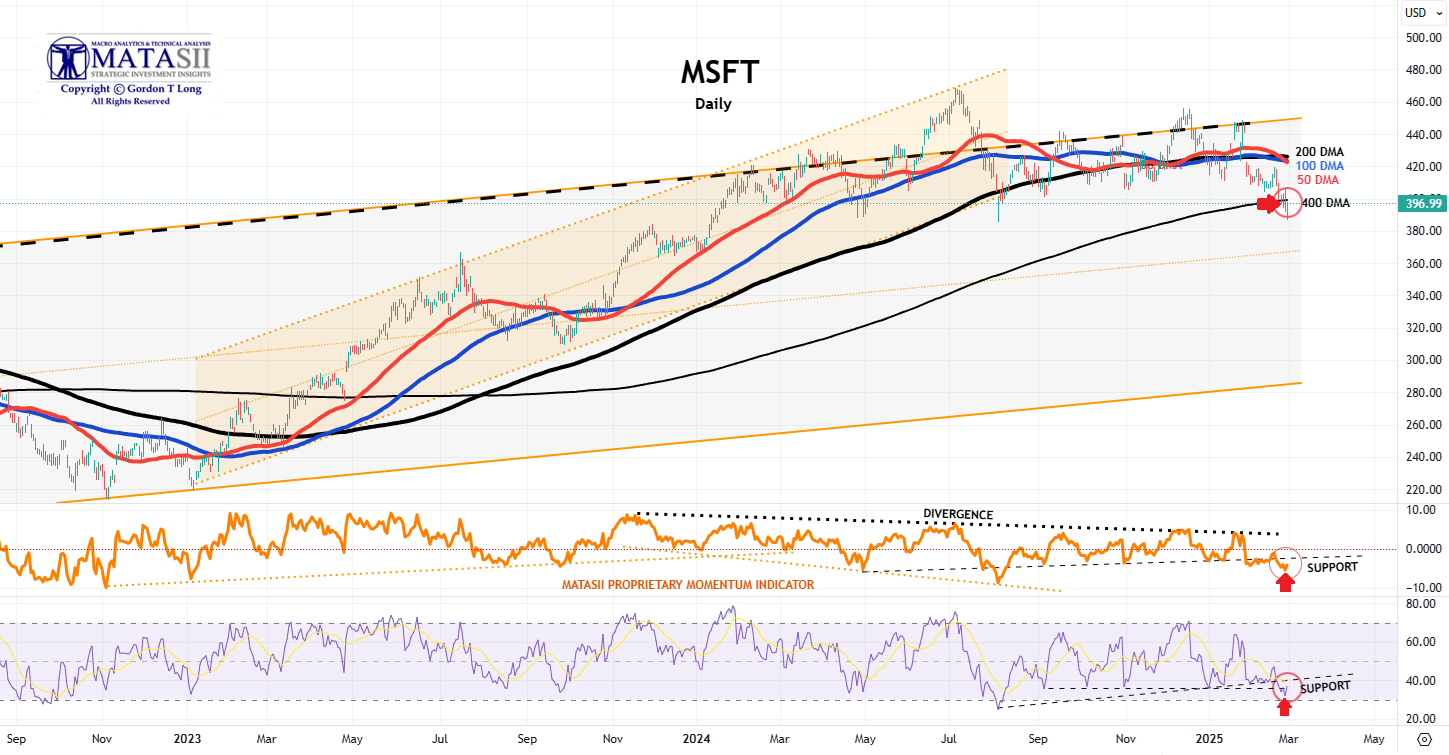
***MICROSOFT - MSFT - DAILY***
MATASII CHART NOTES:
-
PRICE - MSFT closed Friday at 396.99 up + 4.46 (+1.14%) but down from last Friday at 408.21.
-
DMA - MSFT is now well below the 50-100-200 DMAs which are all crossing to the downside. Price found support at the 400 DMA.
-
MATASII PROPRIETARY MOMENTUM INDICATOR - The MATASII Momentum Indicator shown by the black dashed trend line in the middle panel and marked by the red arrow is currently well below support.
NOTE RIGHT: Analyst Rating to the right are always too positive and delayed. History suggests the trick is to BEGIN reducing positions as soon as ANYONE changes their rating to Hold or Lower
4 HOLDS OUT OF 58 IS A CONCERN
(We use the ratings for Mag-7 Only)
| | |
| |
|
YOUR DESKTOP / TABLET / PHONE ANNOTATED CHART
Macro Analytics Chart Above: SUBSCRIBER LINK
| |
|
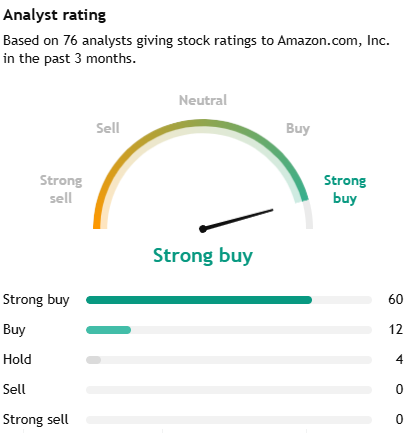
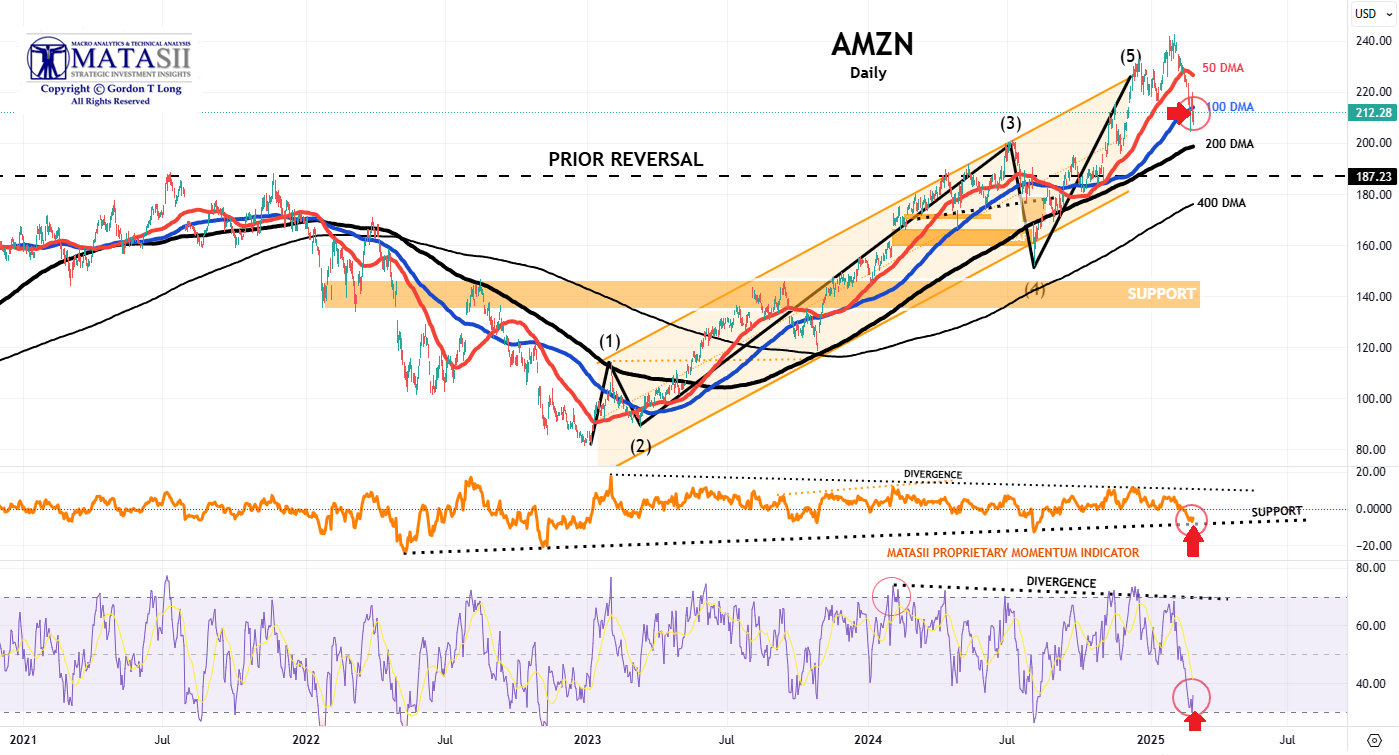
***AMAZON - AMZN - DAILY***
MATASII CHART NOTES:
-
PRICE - AMZN closed up Friday at 212.28 +3.54 (+1.70%) but down from last Friday's 216.58.
-
DMA - The 100 DMA support is currently offering support
- .MATASII PROPRIETARY MOMENTUM INDICATOR - The MATASII Momentum Indicator is currently offering support at the black dotted trend line level marked by the red arrow.
NOTE RIGHT: Analyst Rating to the right are always too positive and delayed. History suggests the trick is to BEGIN reducing positions as soon as ANYONE changes their rating to Hold or Lower
4 HOLDS OUT OF 76 IS A CONCERN
(We use the ratings for Mag-7 Only)
| | |
| |
|
YOUR DESKTOP / TABLET / PHONE ANNOTATED CHART
Macro Analytics Chart Above: SUBSCRIBER LINK
| |
|
FOREIGN EXCHANGES (SITUATIONAL SELECTIONS)
WATCH LIST
- GERMAN DAX (See Weekly Market Lab)
- CHINA TECH (See Weekly Market Lab)
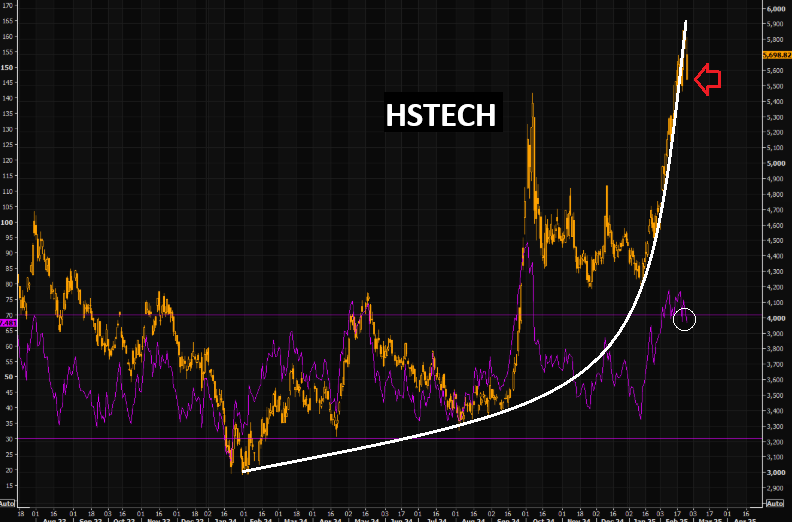
- HSTECH
- KWEB
- BABA
| | |
| |
|
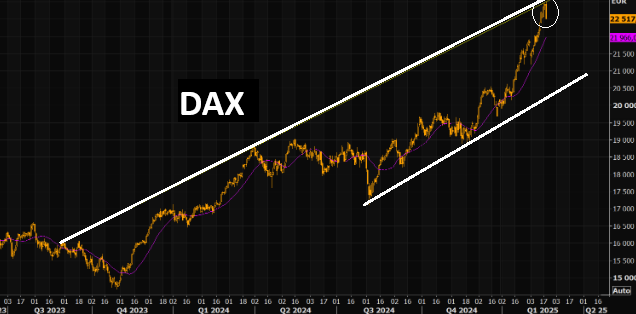
GERMAN DAX - 02-19-25
Our Proprietary MATASii methodology published last weekend (chart left) spotted this drawdown perfectly. DAX reversing perfectly off that huge upper trend line. The DAX squeeze has managed sucking in a lot of suckers. First support at 21k (futures), but this could correct much more.
| | |
| |
|
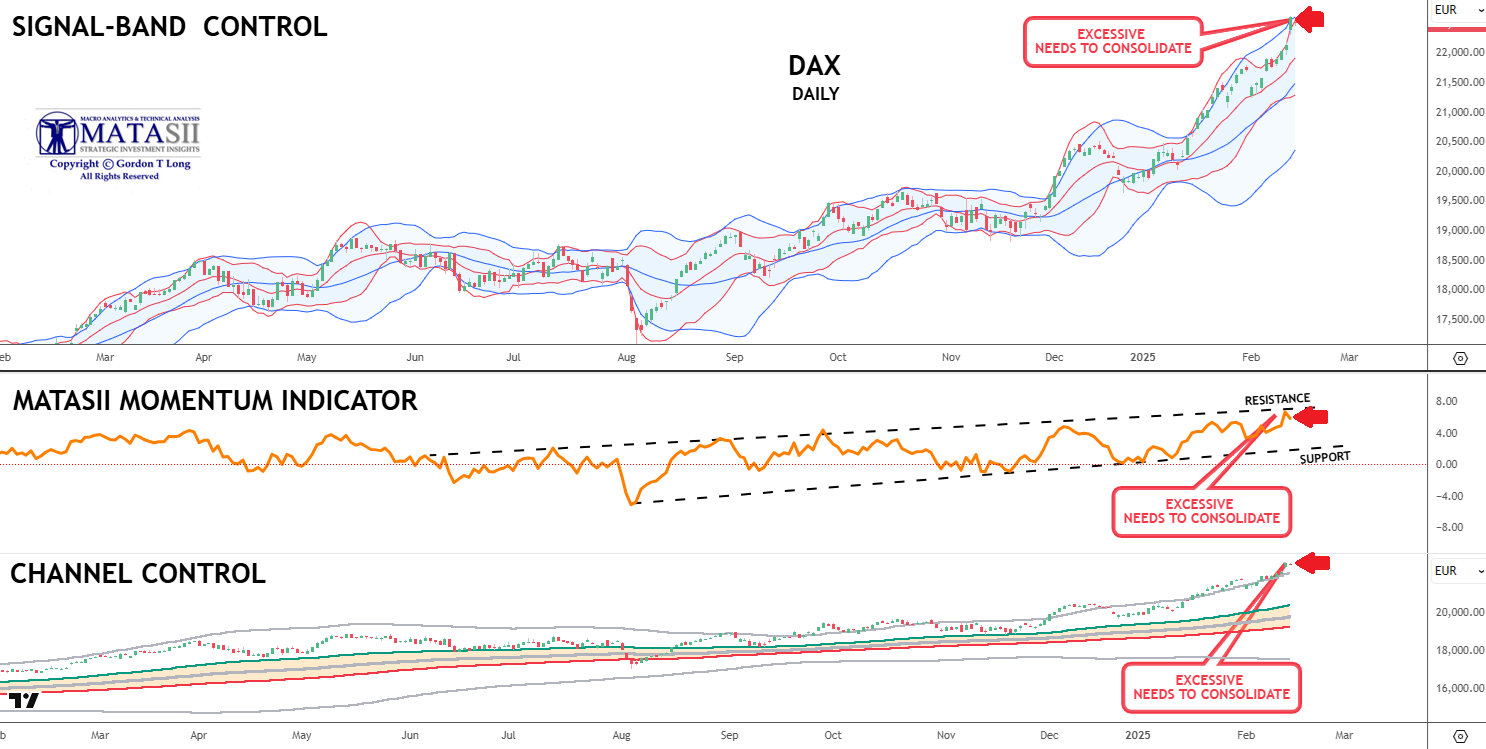
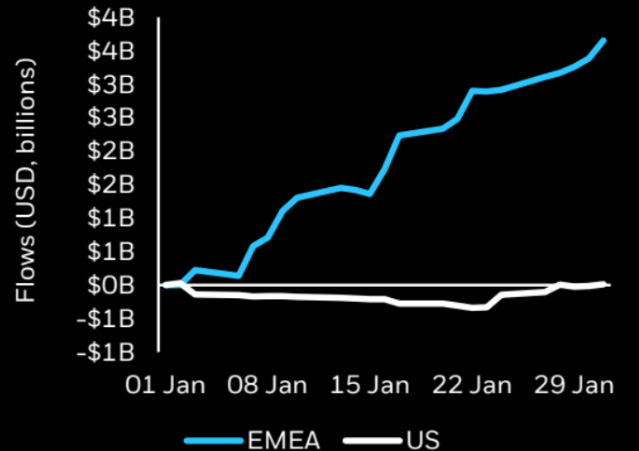
EUROPE ON SALE
GLOBAL MONEY TAKES FULL ADVANTAGE OF A WEAK EURO
AN EXPLODING GERMAN DAX: The DAX is the German stock market index consisting of the 40 major German blue chip companies trading on the Frankfurt Stock Exchange. It is a total return index. Recently we have been witnessing a DAX upside panic buying versus a SPX’s sideways snooze. There is more than a weak Euro driving this lift! (German Elections?) We can't recall when DAX was trading this much above the 200 day moving average. The DAX ended the week on almost a high note. RSI remains at very overbought levels.
The DAX has been showing the spot up, volatility up behavior over the past weeks. This is usually what you see when people are forced to chase longs, expressing views via upside options exposure. DAX volatility is starting to show that NASDAQ whale feature. The gap between DAX "VIX" and VIX widened further as pure upside panic in DAX plays out.
| |
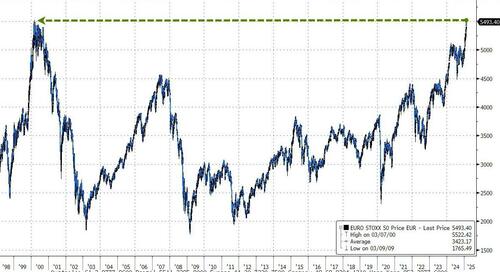
The last time the EuroStoxx50 printed a new all-time high was 14th March 2000...very nearly 25 years go! | | |
FLOWS - European equity flows turned positive in January, with $3.7B of inflows – the highest level since February 2023. | | |
|
CONTROL PACKAGE
- Invesco DB Agricultural Fund (DBA)
- VanEck Agribusiness (MOO)
- Food Producers (FT350 Food Producers - NMX45)
- Teucrium Agricultural Fund ETV (TAGS)
- Advisory Shares Restaurant ETF (EATZ)
- Invesco Food & Beverage ETF (PBJ)
- Teucrium Wheat Fund ETV (WEAT)
- Teucrium Corn Fund ETV (CORN)
- Teucrium Soybean Fund ETV (SOTB)
- Teucrium Sugar Fund ETV (CANE)
| | |
| |
|
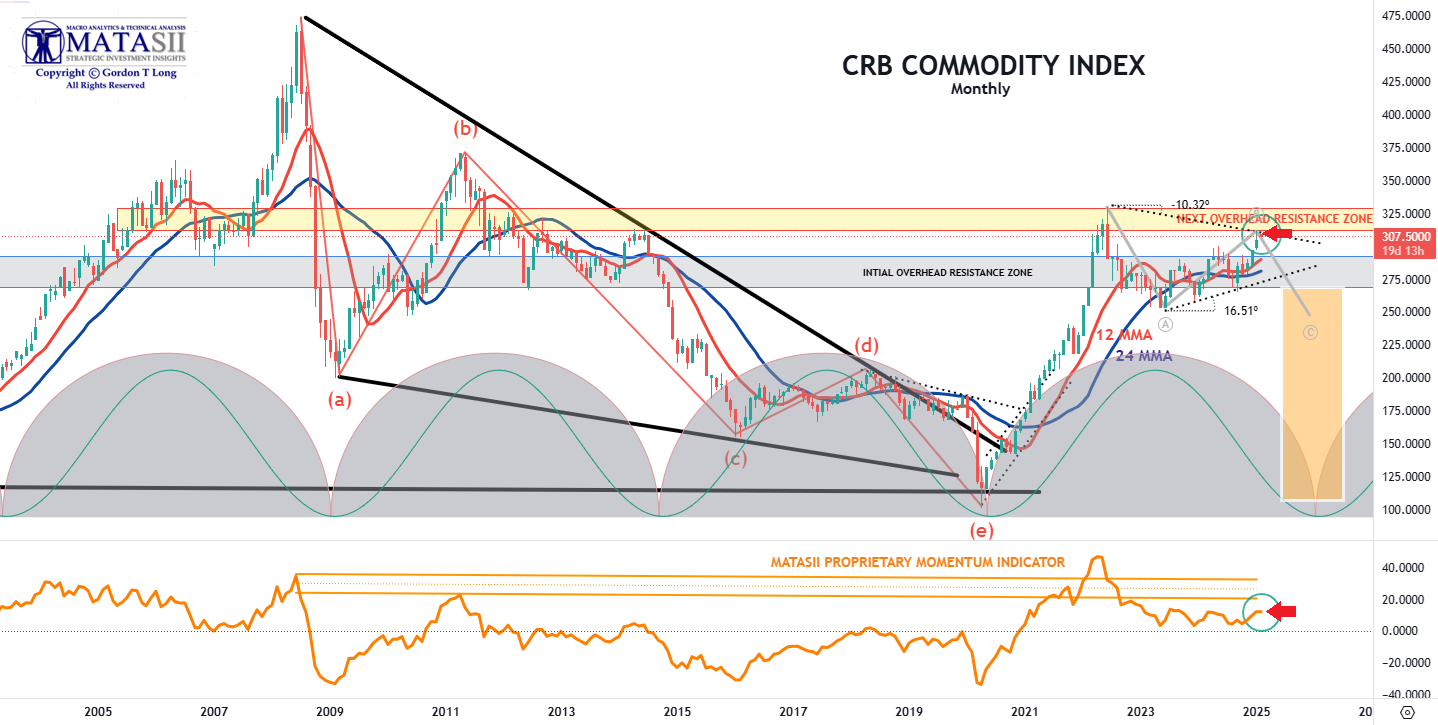
***CRB COMMODITY INDEX***
CHART NOTES:
- The overall Commodity Indexes, as measured by the CRB Commodity, reflect a Corrective / Consolidation is presently nearing completion.
- However, many of the individual sectors (not shown here) have already completed the Corrective / Consolidation and broken higher over the last 30-60 days.
| | |
|
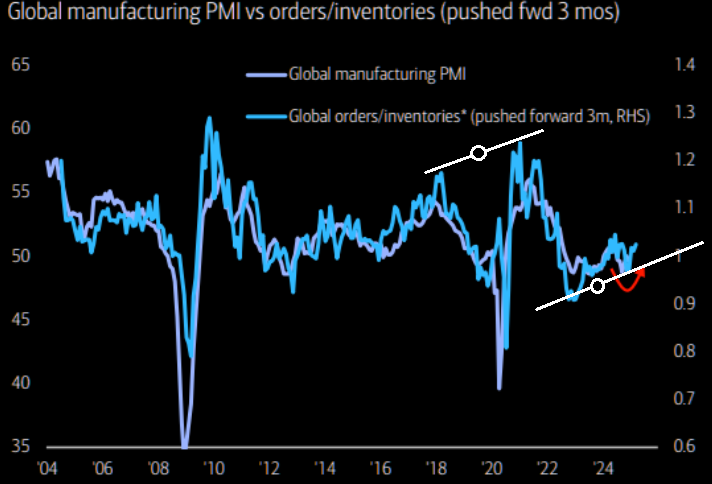
01/18/25: Rising global PMIs = Long commodities
Got Commodities?
| | |
|
YOUR DESKTOP / TABLET / PHONE ANNOTATED CHART
Macro Analytics Chart Above: SUBSCRIBER LINK
| |
|
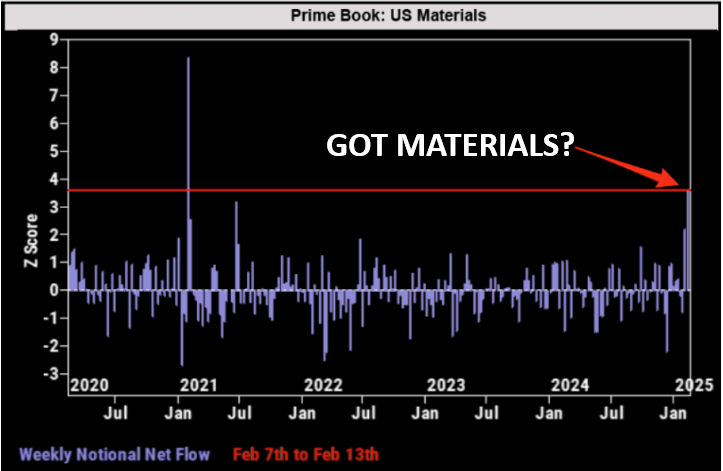
COMMODITIES - MATERIALS
02-20-25
HFs net bought US Materials at the fastest pace since February 2021, driven entirely by long buys.
| | |
|
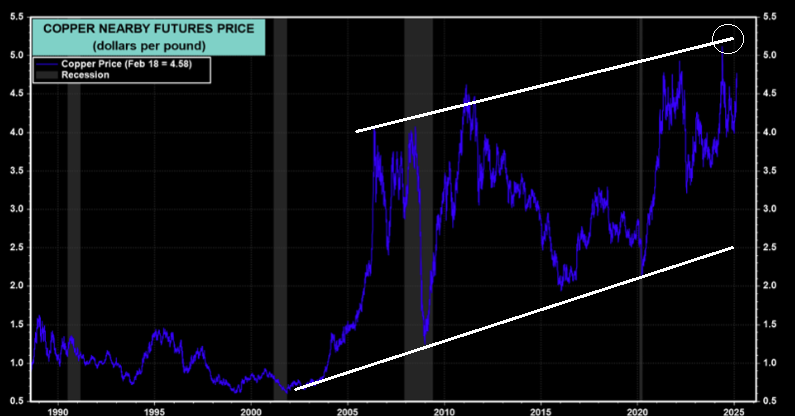
DR COPPER - 02-20-25
"If the aggressive fiscal actions taken by Trump 2.0 and the Chinese government improve global economic growth, that might increase business and consumer confidence and spending. We’ve been watching for signs of this in copper prices, which have popped 14.9% ytd."
| | |
|
***GOLD***
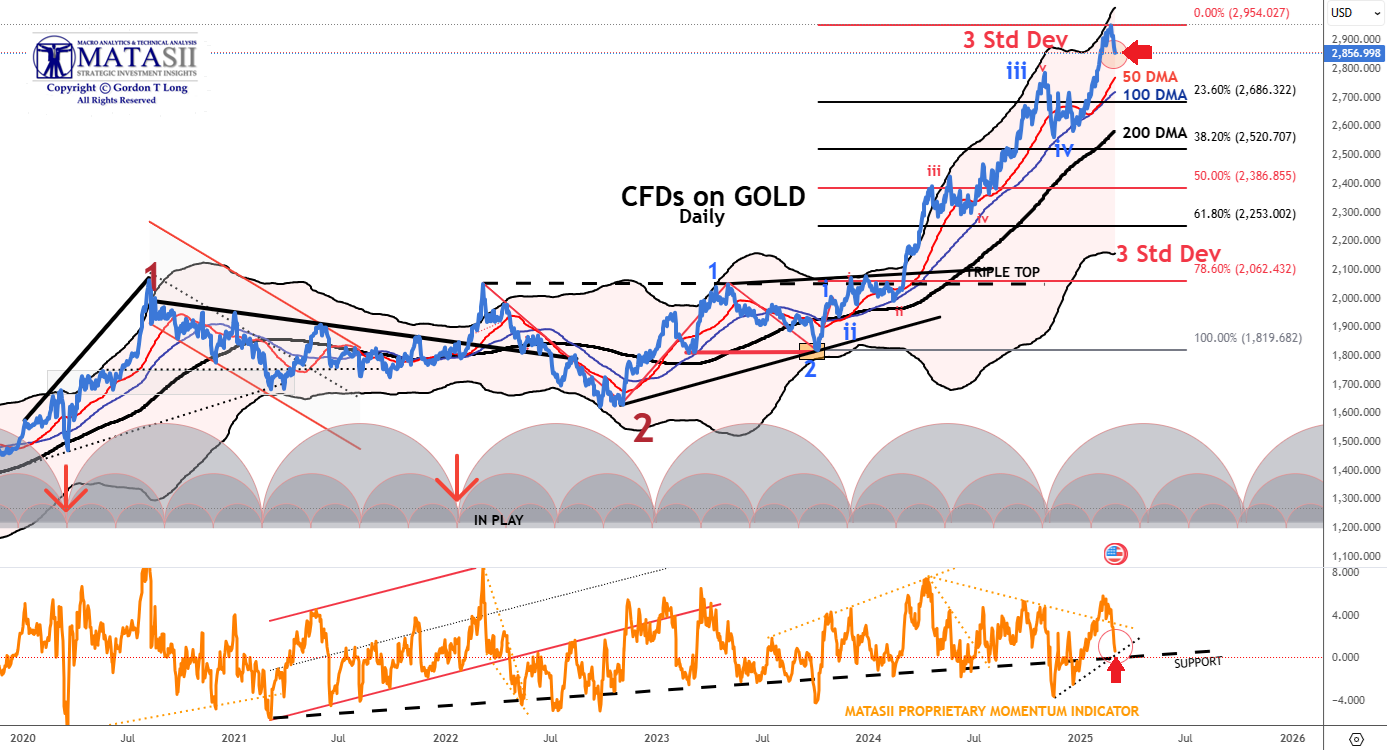
CHART NOTES:
-
PRICE - Gold fell with Friday's post-market trading at 2856.9985 down -19.487 (-0.68) for the day, but well down from last Friday's close of ~2934.955.
-
3 SIGMA BOMAR - Gold having touched its 3 Standard Deviation Bomar Band, (which is always a warning signal), bounced down from it!!!
-
MATASII PROPRIETARY MOMENTUM INDICATOR - Momentum found support at a lower MATASII Momentum Indicator trend line shown in the lower panel and marked by the red arrow and black dashed trend line.
GOLD IS DUE FOR A CORRECTIVE / CONSOLIDATION!
| | |
|
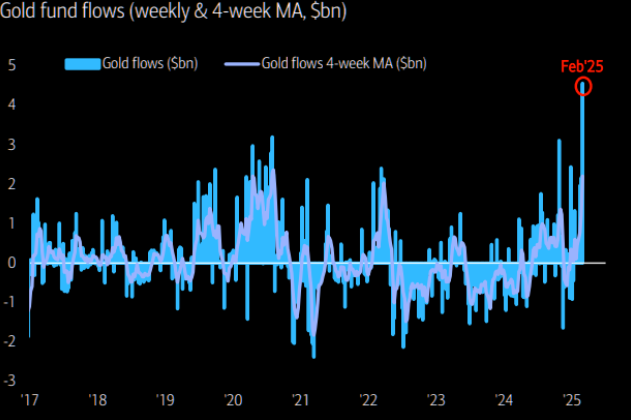
NEW-- FLOWS - 02-28-25
All in gold - Maybe the correction has more room to wash out the nouveau bulls.
| |
SITUATIONAL ANALYSIS
- Gold has recently been supported and further boosted by the PBoC resuming Gold purchases in November after a six-month halt.
- We note that ETF buying however has been surprisingly weak over the past four years, as shown by the 2nd chart above.
| | |
|
YOUR DESKTOP / TABLET / PHONE ANNOTATED CHART
Macro Analytics Chart Above: SUBSCRIBER LINK
| |
|
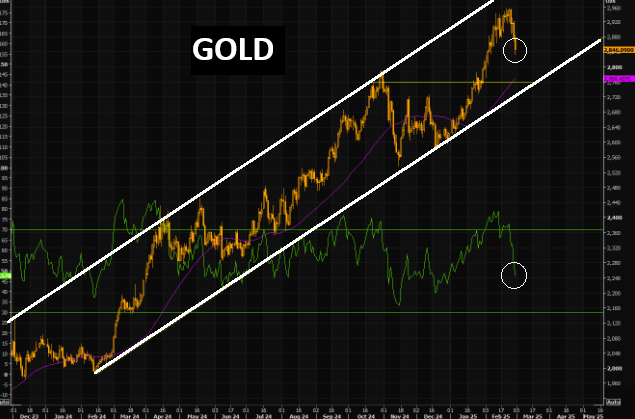
NEW-- PATTERNS - 02-28-25
Gold - so far so good - The much needed pause playing out as it should.
50 day now at $2770, just above the big break out level. RSI has come down, but could come down some more before one starts to nibble again.
| | |
|
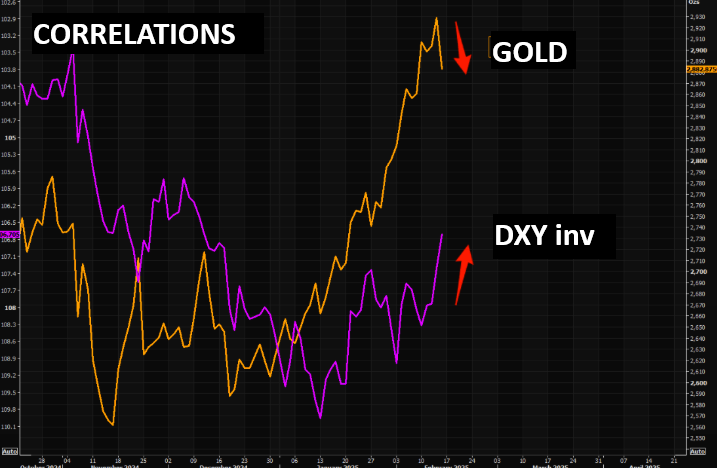
CORRELATIONS - 02-15-25
"Weird" in gold land
The latest melt up in gold started just when the DXY reversed in January. Noteworthy is that gold is putting in the biggest down candle in a while, despite the DXY selling off further.
Chart shows gold vs DXY inv.
| | |
|
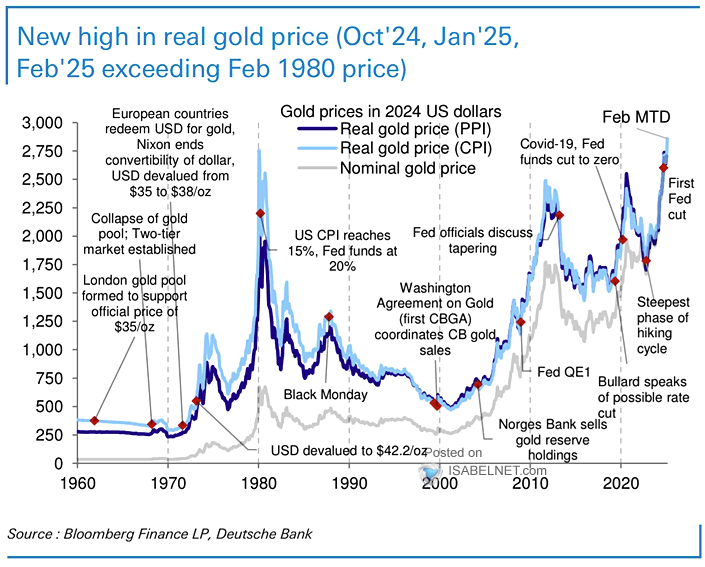
GOLD - 02-14-25
Gold Prices in 2024 U.S. Dollars - The real (inflation-adjusted) price of gold has reached a new all-time high, driven by several factors including U.S. tariff uncertainties, geopolitical tensions, and increased demand from global central banks. - Deutsche Bank
| | |
|
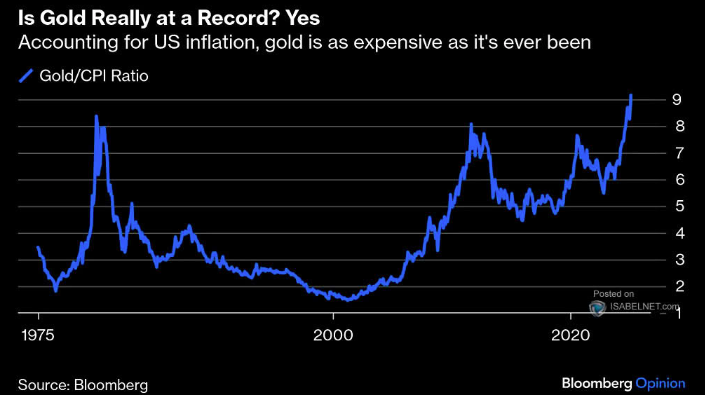
GOLD/CPI RATIO - 02-12-25
The inflation-adjusted price of gold has reached a new high, breaking its previous record from January 1980. This reflects the ongoing devaluation of the U.S. dollar, global economic uncertainties and strong demand from central banks.
| | |
|
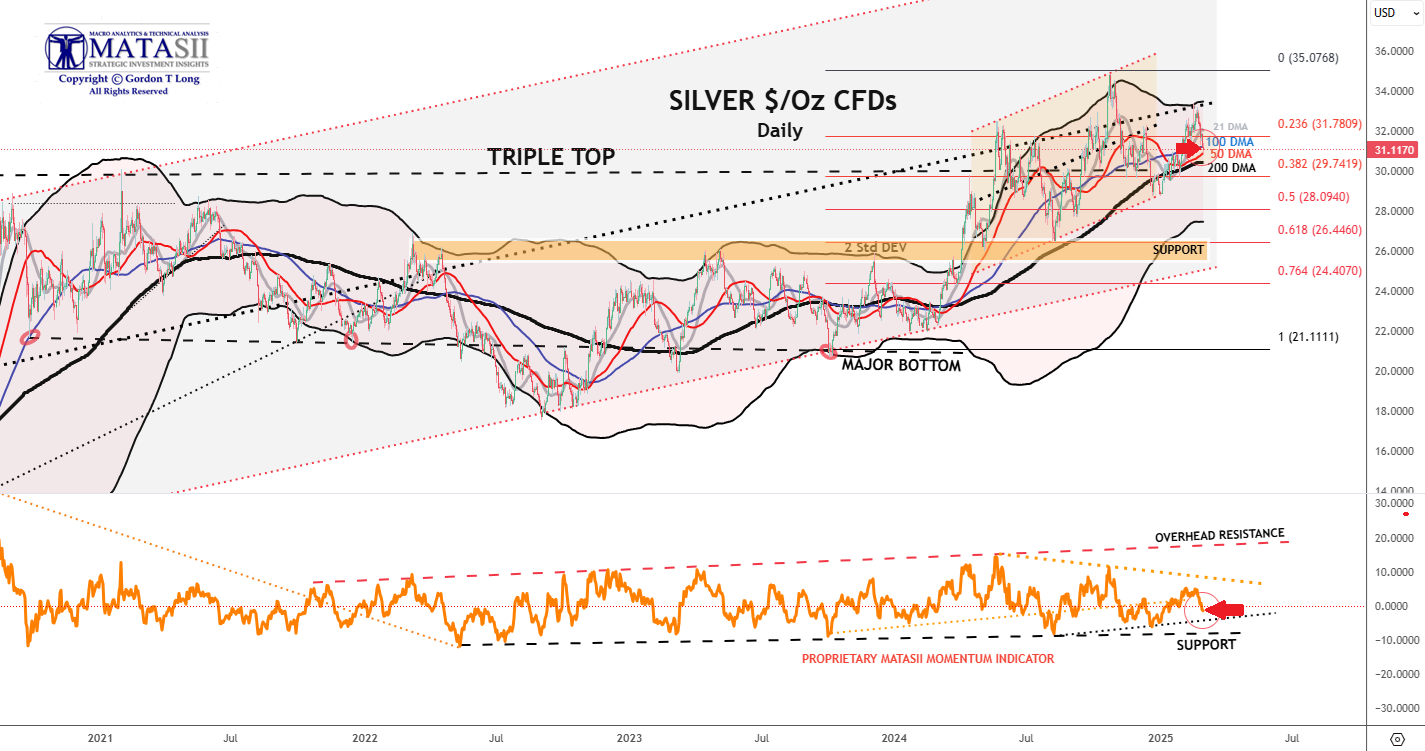
***SILVER***
MATASII CHART NOTES:
-
PRICE - Silver closed Friday at 31.17 down -0.1150 (-0.37%) for the day but also down compared to last Friday's close at 32.4221.
-
DMA - Silver found support at the 100 DMA above its 50 DMA which is turning up.
-
MATASII PROPRIETARY MOMENTUM INDICATOR - The MATASII Proprietary Momentum Indicator has been falling over the last week.
| |
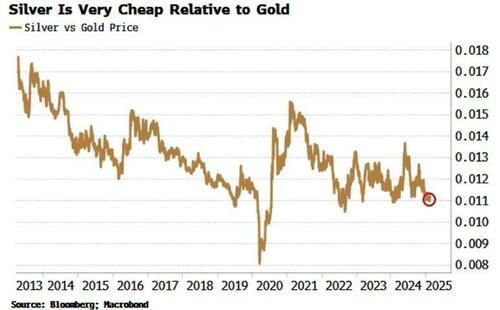
02-17-25: Silver often comes late to the party, but when it finally gets there it can be an unstoppable hedonist. | |
|
YOUR DESKTOP / TABLET / PHONE ANNOTATED CHART
Macro Analytics Chart Above: SUBSCRIBER LINK
| |
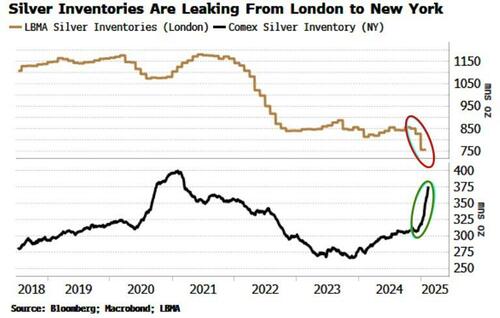
02-17-25: We are seeing the same dynamics with silver as we are seeing with gold. There is a shortage of deliverable physical metal in London after years of EM central-bank hoarding. Comex silver warehouses in the US are filling up while stocks in London are falling. | |
|
|
CONTROL PACKAGE
There are NINE charts we have outlined in prior chart packages, which we will continue to watch closely as a CURRENT Control Set:
-
US DOLLAR -DXY - MONTHLY (CHART LINK)
-
US DOLLAR - DXY - DAILY (CHART LINK)
-
GOLD - DAILY (CHART LINK)
-
GOLD cfd's - DAILY (CHART LINK)
-
GOLD - Integrated - Barrick Gold (CHART LINK)
- SILVER - DAILY (CHART LINK)
-
OIL - XLE - MONTHLY (CHART LINK)
-
OIL - WTIC - MONTHLY - (CHART LINK)
-
BITCOIN - BTCUSD -WEEKLY (CHART LINK)
-
10y TIPS - Real Rates - Daily (CHART LINK)
| | |
| |
|
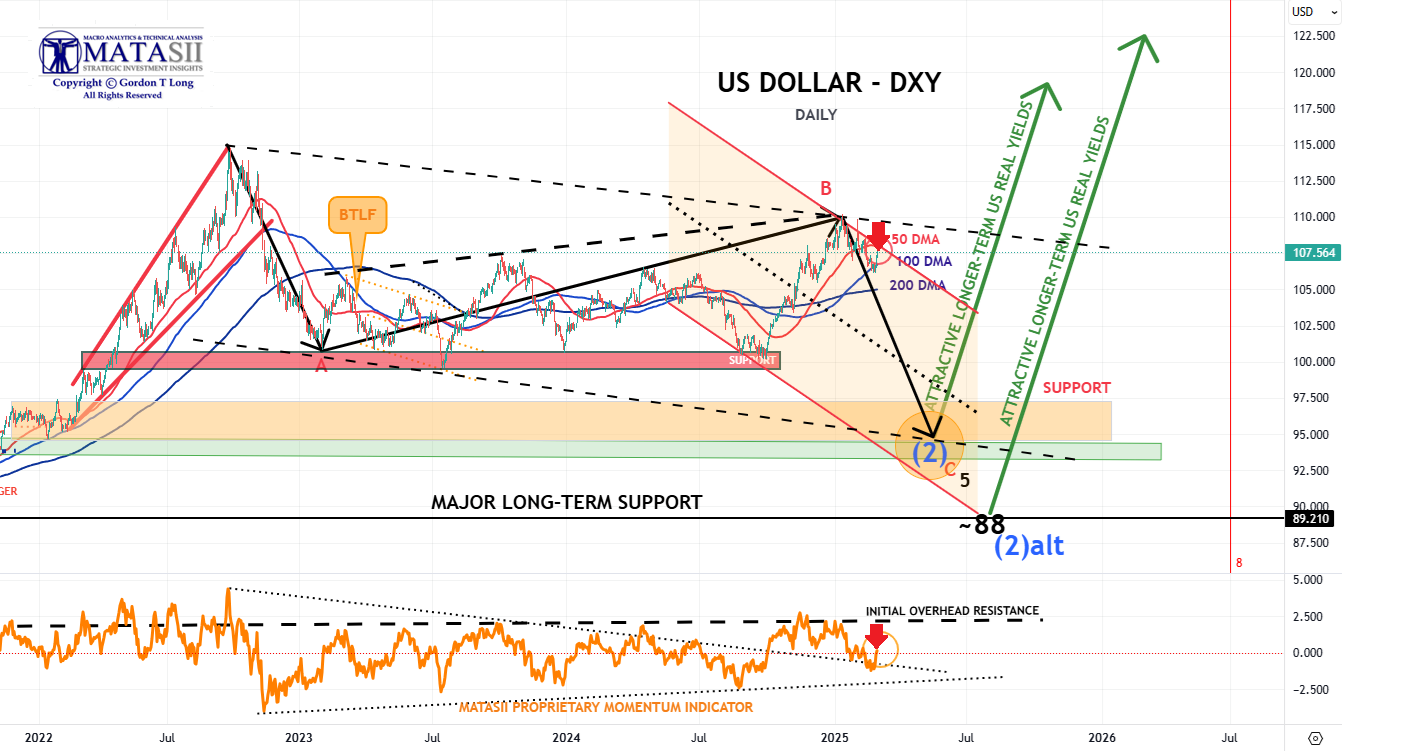
***US DOLLAR - DXY - DAILY***
MATASII CHART NOTES:
-
PRICE - The dollar was up slightly in after hours Friday trading at 107.564 +0.272 (+0.25%) but higher when compared to last Friday at 106.61
-
DMA - The DXY found support at the 100 DMA before rising this week.
-
MATASII PROPRIETARY MOMENTUM INDICATOR - The dollar found support at the MATASII Momentum Indicators' dotted black trend line marked by the red arrow in the lower panel before rising this week.
| | |
|
IMPORTANT!
THE US ELECTION HAS POTENTIALLY MADE MAJOR CHANGES IN THE PERCEPTION OF THE US$ .
THERE IS A STRONG CHANCE THAT THE LOWS SHOWN BELOW ARE
NO LONGER VALID.
| | |
|
YOUR DESKTOP / TABLET / PHONE ANNOTATED CHART
Macro Analytics Chart Above: SUBSCRIBER LINK
| |
|
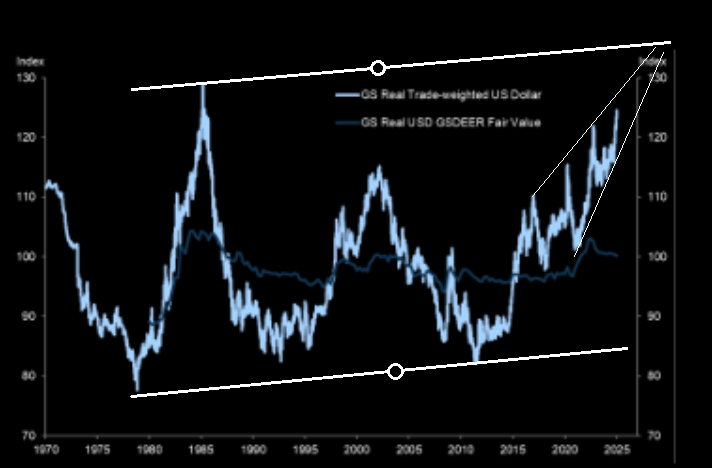
NEW--1- OVERVALUED US DOLLAR
02-21-25
The chart below takes the real-effective exchange for each major currency – its trade-weighted value adjusted for inflation – and looks at its 10-year
Z-score, ie how far above or below it is versus its long-term average. The US REER’s Z-score is second only to Poland’s.
| | |
|
NEW--2- OVERVALUED US DOLLAR
02-21-25
Do we have a Head & Shoulders pattern potential? The pattern needs to break the Neckline for confirmation.
| | |
|
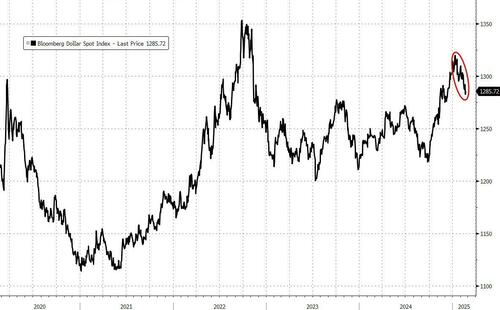
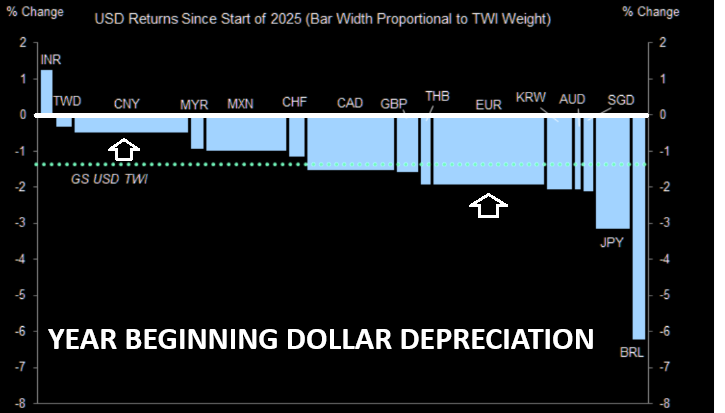
DOLLAR DEPRECIATION - 02-16-25
Modest but broad Dollar depreciation to start the year.
| | |
|
DOLLAR - DXY - 01-18-25
For now just a much needed pause. 21 day and the steep trend line come in around these levels. The Dollar Has Now Surpassed All Previous Peaks, Except 1985.
| | |
|
CONTROL PACKAGE
There are FIVE charts we have outlined in prior chart packages that we will continue to watch closely as a CURRENT "control set":
- The 10Y TREASURY NOTE YIELD - TNX - HOURLY (CHART LINK)
- The 10Y TREASURY NOTE YIELD - TNX - DAILY (CHART LINK)
- The 10Y TREASURY NOTE YIELD - TNX - WEEKLY (CHART LINK)
- The 30Y TREASURY BOND YIELD - TNX - WEEKLY (CHART LINK)
- REAL RATES (CHART LINK)
| | |
| |
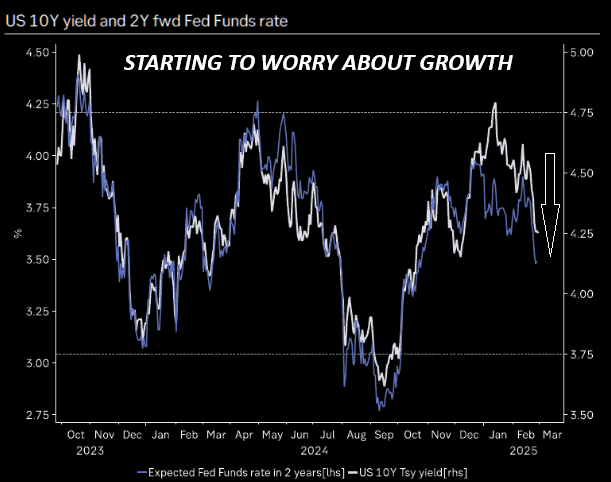
LOWER BOND YIELDS CORRECTLY SPOT A WEAKER MACRO | |
FISHER'S EQUATION = 10Y Yield = 10Y INFLATION BE% + REAL % = 2.381% + 1.928% = 4.309%
-
2YR AUCTION: Overall a strong 2yr auction. The US Treasury sold USD 69bln of 2yr notes at a high yield of 4.169%, stopping through the when issued by 1.1bps, a strong sign of demand when compared to the prior tail of 0.1bps and six auction average of a 0.3bps stop through. The bid-to-cover of 2.56x was lower than the prior and average of 2.66x. Nonetheless, the breakdown was also encouraging, primarily thanks to a surge in indirect demand, which jumped to 85.49% from 65.0%, well above the 68.9% six auction average. This more than offset the drop in direct demand to just 7.64% (prev. 21.3%, avg. 18.3), seeing dealers take just 6.87% of the auction, beneath the 13.7% prior and six-auction average of 12.8%.
- US sold USD 80bln (exp. 76bln) in 3mth bills at high rate of 4.195%, B/C 2.90x ; Sold USD 71bln (exp. 68bln) in 6mth bills at high rate of 4.180%, B/C 3.05x
US Treasury to sell:
- US Treasury to sell USD 70bln in 5yr notes on February 25th; to settle February 28th.
- USD 44bln in 7yr notes on February 26th; to settle February 28th.
- USD 28bln of 2yr FRN on February 26th, to settle February 28th.
- USD 75bln of 6wk bills on February 25th; to settle February 27th.
-
5YR AUCTION: Overall a strong 5yr note auction. The US Treasury sold USD 70bln of 5yr notes at a high yield of 4.123%, a lower yield than the January offering's 4.33%. The auction stopped through the when issued by 1bps, a greater sign of demand than the prior 0.6bps stop through, and much better when compared to the six auction average of a 0.1bps tail. The bid-to-cover of 2.42 was in line with priors and averages. The breakdown of buyers saw very strong indirect demand of 74.87%, rising from the prior 62.8% and above the 68.6% average. Direct demand fell however to 14.54% from 26.1%, beneath the 19% six auction average. This left dealers with a slightly below average and prior 10.59% of the auction.
- US sold USD 75bln of 6wk bills (exp. USD 75bln) at high rate of 4.230%, B/C 3.05x.
US Treasury to sell:
- USD 44bln in 7yr notes on February 26th; to settle February 28th.
- USD 28bln of 2yr FRN on February 26th, to settle February 28th.
- USD 60bln of 17wk bills on February 26th; to settle March 4th.
- USD 75bln in 8wk bills on February 27th; to settle March 4th.
- USD 80bln in 4wk bills on February 27th; to settle March 4th.
-
7YR AUCTION: Another strong 7yr auction but in line with recent averages. The US Treasury sold USD 44bln of 7yr notes at a high yield of 4.194%, stopping through the when issued by 0.9bps, matching the prior auction stop through but not quite as strong as the six auction average, with a tail not seen in a 7yr auction since August 2024. The bid-to cover was in line with prior and averages. The breakdown was in fitting with the prior auction, although indirect demand was beneath the six auction average while direct demand was above. Dealers were left with 8.8% of the auction, marginally beneath the prior and average.
- US sold USD 60bln (exp. 60bln) of 17wk bills at high rate of 4.200%, B/C 2.78x.
US Treasury to sell:
- USD 75bln in 8wk bills on February 27th; to settle March 4th.
- USD 80bln in 4wk bills on February 27th; to settle March 4th.
| |
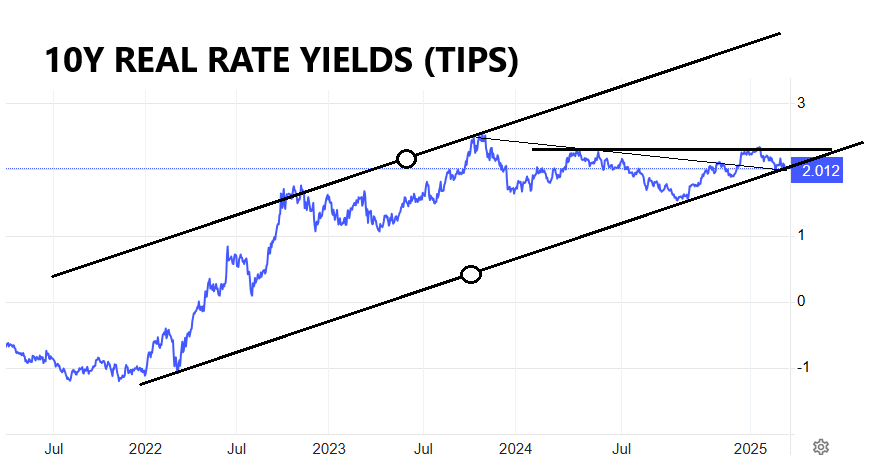
10Y REAL YIELD RATE (TIPS)
Real Rates have broken through its descending trend wedge channel line, (shown in the chart to the right - as of close 02/21/25). (LATEST)
The latest US NY Fed SCE has seen inflation expectations continue to increase across the forecast horizon.
| |
|
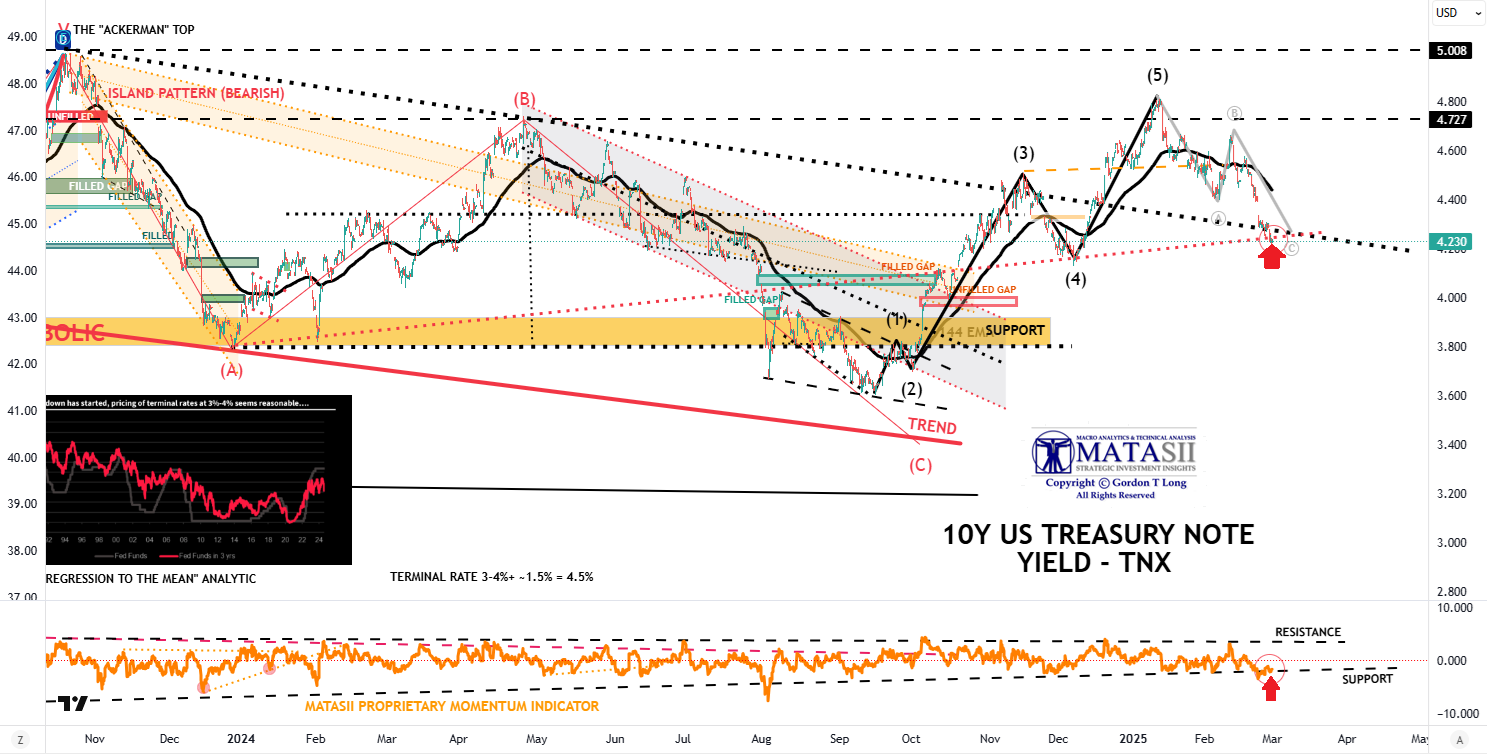
***10Y UST - TNX - WEEKLY***
MATASII CHART NOTES:
-
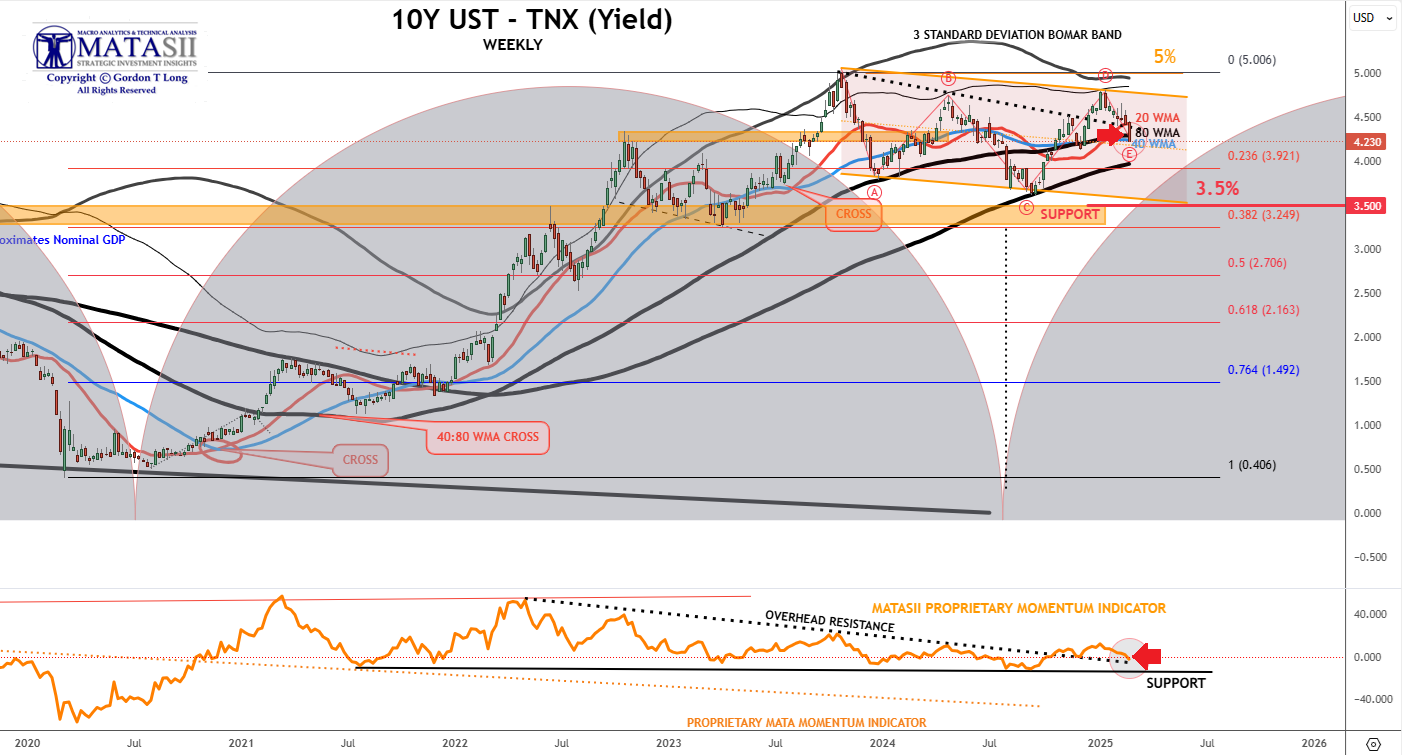
PRICE - The TNX closed Friday at 4.23 down -0.056 (-1.31%) for the day and down significantly from last Friday's 4.421.
-
WMA - Price has fallen to the 40 WMA and below the downward dotted black trend line marked near the red arrow.
-
MATASII PROPRIETARY MOMENTUM INDICATOR - The Proprietary MATASII Momentum Indicators' (lower pane) support levels, shown by the dotted black line and highlighted by the red arrow, which had been broken to the upside now looks to need to be retested.
| |
|
YOUR DESKTOP / TABLET / PHONE ANNOTATED CHART
Macro Analytics Chart Above: SUBSCRIBER LINK
| |
|
***10Y UST - TNX - HOURLY***
CHART NOTES:
-
PRICE - The TNX closed Friday at 4.23 down -0.056 (-1.31%) for the day and down significantly from last Friday's 4.421.
-
MATASII PROPRIETARY MOMENTUM INDICATOR - The Proprietary MATASII Momentum Indicators (lower panel) shows the support level (dashed black line) highlighted by the red arrow is now acting as support.
| |
|
YOUR DESKTOP / TABLET / PHONE ANNOTATED CHART
Macro Analytics Chart Above: SUBSCRIBER LINK
| |
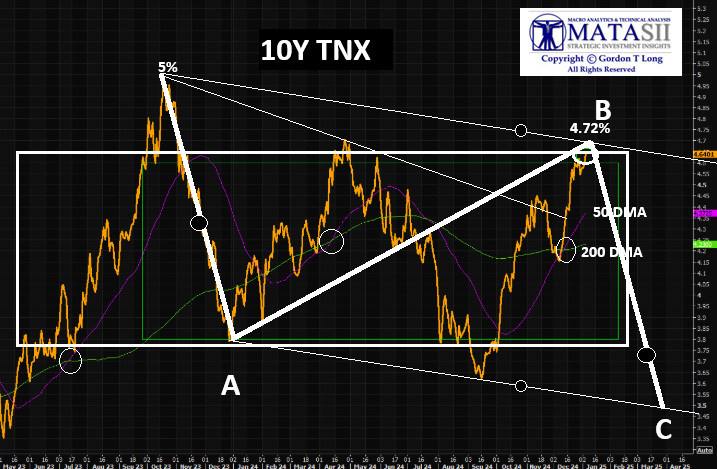
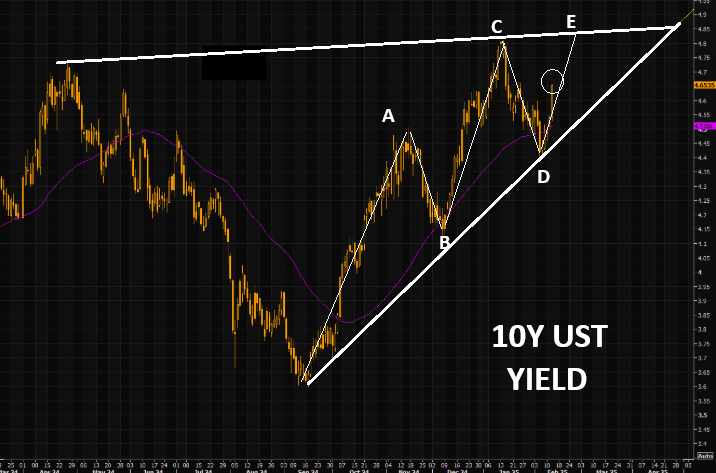
There is a strong possibility that 4.72%, which was achieved recently, was the high for the current cycle. We are now
"decisively" above the range, and there is no real stop until recent highs around 5%. The golden cross we have been pointing out for weeks is well in place. Last time a similar cross occurred, the 10 year gained some 125 bps over a few months. We are up around 70 bps since the latest Golden Cross kicked in.
| |
|
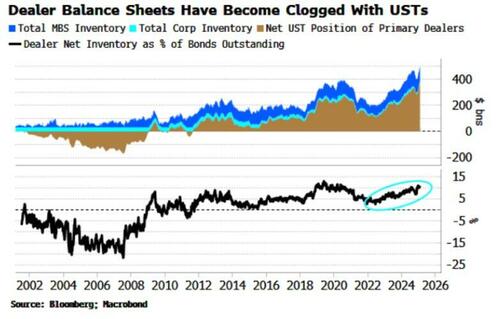
NEW--2- PRIMARY DEALER BALANCE SHEETS 02-20-25
Primary Dealers must backstop Treasury auctions. The inventory of USTs on their balance sheets had been building as the inverted yield curve made US government bonds less attractive for carry traders. But that inventory has kept rising both in asset terms (chart right) and outright, hitting new records — even as the curve has dis-inverted. The zeal for Treasuries is waning!
| | |
|
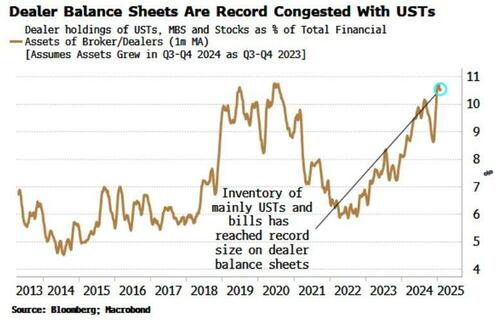
NEW--3- PRIMARY DEALER BALANCE SHEETS 02-20-25
The tranche of securities accumulated on dealer balance sheets – the bulk of which are Treasuries – has risen to all-time highs in outright terms and relative to the financial assets they hold.
| | | |
| |
|
TNX - 10Y UST - 02-12-25
Higher for longer - Massive move higher in the 10 year. Haven't seen such a "clean" up candle in a while.
Note we are once again well above the 50 day. Upside resistance levels: 4.7% and then the big 4.8% level.
| | |
|
***10Y-FED FUNDS RATE YIELD CURVE***
MATASII CHART NOTES:
- The Yield Curve has reverted and is now within the warning zone as marked by the red circle in the upper panel on the right.
| | |
| |
YIELD CURVE - 10Y-FED FUNDS RATE (FFR) | |
|
TRUMP needs lower long term yields which means lower term premiums. Trump also wants to reduce the trade deficit through Tariffs. A reduced trade deficit can normally be expected to lead to higher yields as demand for dollar reserve assets will fall. (It already is falling, which is ultimately why gold is flooding out of London vaults and into Comex warehouses in the US.)
As a consequence this leaves a lot resting on DOGE to reduce fiscal excess - current Polymarket odds are 38% that more than $250 billion is saved in 2025. With spreads so tight, the risk-reward for even tighter ones is diminishing.
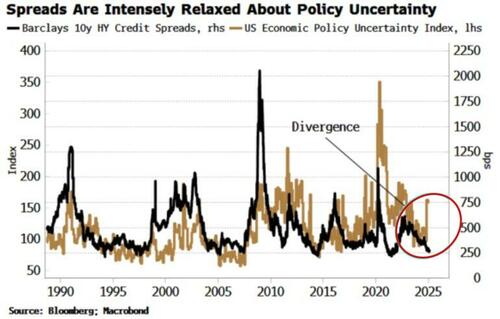
HIGH YIELD (HY) - JNK
| |
|
02-17-25
High-Yield (JNK) spreads are near the tightest they have ever been. That’s in contrast to measures of economic policy uncertainty, which are elevated and which spreads generally track.
| | |
|
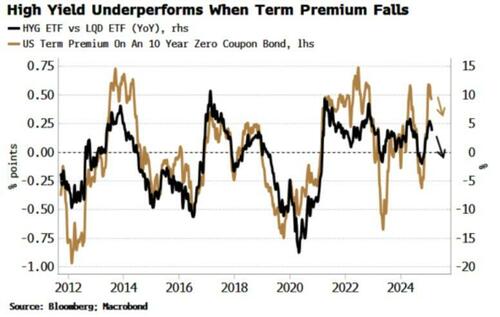
02-17-25
High Yield (JNK) Underperform whenTerm Premiums Fall. The debt of high-yield firms underperforms that of investment grade firms which – when HY spreads are already so tight – likely means they widen if term premium falls.
| | |
THIS WEEK'S MARKET MONITOR | |
NOTICE Information on these pages contains forward-looking statements that involve risks and uncertainties. Markets and instruments profiled on this page are for informational purposes only and should not in any way come across as a recommendation to buy or sell in these assets. You should do your own thorough research before making any investment decisions. MATASII.com does not in any way guarantee that this information is free from mistakes, errors, or material misstatements. It also does not guarantee that this information is of a timely nature. Investing in Open Markets involves a great deal of risk, including the loss of all or a portion of your investment, as well as emotional distress. All risks, losses and costs associated with investing, including total loss of principal, are your responsibility.
FAIR USE NOTICE This site contains copyrighted material the use of which has not always been specifically authorized by the copyright owner. We are making such material available in our efforts to advance understanding of environmental, political, human rights, economic, democracy, scientific, and social justice issues, etc. We believe this constitutes a ‘fair use’ of any such copyrighted material as provided for in section 107 of the US Copyright Law. In accordance with Title 17 U.S.C. Section 107, the material on this site is distributed without profit to those who have expressed a prior interest in receiving the included information for research and educational purposes. If you wish to use copyrighted material from this site for purposes of your own that go beyond ‘fair use’, you must obtain permission from the copyright owner.
========
| |
IDENTIFICATION OF HIGH PROBABILITY TARGET ZONES | |
Learn the HPTZ Methodology!
Identify areas of High Probability for market movements
Set up your charts with accurate Market Road Maps
Available at Amazon.com
| |
The Most Insightful Macro Analytics On The Web | | | | |