Market Update - January 2023 | |
I'm sure we are all glad to put 2022 behind us. Next year will be very interesting as we go into recession, the Fed (probably) cuts rates, and the markets (potentially) bottom. There is still some hope that we only have a mild recession. | |
- During December, the bear market continued its downward trajectory. While the Federal Reserve (the Fed) only raised rates 0.50% as expected, they emphasized that rates would stay higher-for-longer conditional upon the employment data.
- Economic data continues to indicate that the mild recession that began in early 2022 continues to deteriorate. In particular, housing sales data is falling faster than during the financial crisis. Employment remains strong and earnings are only slightly weaker.
- The weakness in stock and bond markets towards the end of December indicates heavy tax-loss selling. With the turn of the year, this selling pressure should ease allowing for an early January rally. We do not believe it will be sustainable as the Fed is planning to raise rates at least one more time.
- This month's note reviews historical bear markets and recent economic reports:
- Long-term investors may have to wait a long time for the next market peak
- Wounds that never heal
- Economic growth continues to weaken
- Inflation is eating into consumer spending
- Gasoline demand weakness confirms a slowing economy
- Stress is building as private equity funds halt redemptions
- Investors did not capitulate in 2022
- If the Fed cuts interest rates, I should...
- Will the Bear market end before recession is declared?
- Similarities to recent bear markets
- Bonds typically rally in recessions
- Important retirement plan changes in the recent Omnibus bill
| |
Table 1: Performance update as of 12/31/2022 (LIMW) | |
Every asset class seemed to fall during the month of December except gold and cash. Stocks, bonds, and most commodities fell as the Fed raised rates and promised to keep them higher for longer. In Europe, the European Central Bank (the ECB) removed over $700 billion of stimulus by shrinking their balance sheet. The passage of the $1.7 trillion Omnibus spending bill by Congress also inflamed fears that excessive US government spending would push inflation higher. There are clear signs of inflation in every economy coincident with signs of economic slowdown. In general, inflation hurt news bonds while slowdown data hurt stocks. | |
Long-term investors may have to wait a long time for the next market peak | |
|
We talk to many investors that are confident they can stick with their portfolio as the current bear market evolves. It is great to be optimistic, but investors must understand that waiting for new market highs can take a long time.
There are many studies that measure the duration and size of bull and bear markets. However, not many analysts want to measure the distance between market peaks because it can be very discouraging.
Let's say you invested at the very peak of an equity bull market. How long would it take for the market to return to that peak and go higher?
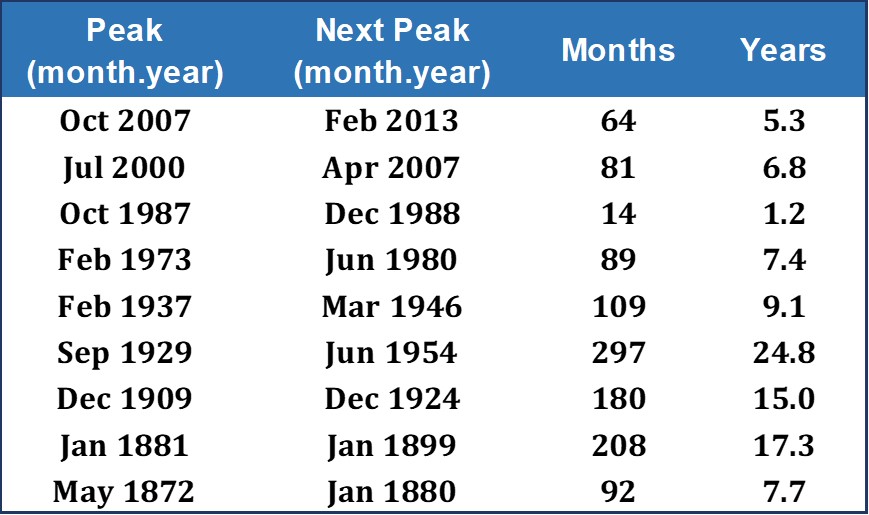
This is not a trivial question. Most adults today only recall the 1980-2020 experience of falling inflation and low interest rates. In other periods of US market history, the time to make new market highs has exceeded 15 years.
Table 2: Time between equity market peaks (LIWM, data from Dr Robert Shiller, Nobel prize winner, Yale University)
| |
|
The analysts at GMO (Grantham Mayo Van Otterloo) produced an interesting chart they called "Wounds that never heal". They were trying to measure the time required for equity markets to achieve a long-term average real return of 6% after a bear market (real return means nominal return adjusted for inflation). By adding the bear market losses to bull market returns, you get a sense for how long it takes to get back to long-term average return expectations.
This is another way of looking at the time for markets to recover from a bear market. It also confirms that people who invest in stocks at market tops sometimes have to wait decades for the portfolio returns to catch up to the long-term averages that are initially hoped for. GMO's choice of a 6% long term equity return is significant because it is to what many financial planners use in their planning software.
This is a key reason why we are underweight equities at this point in the Fed tightening cycle. We sincerely hope to avoid the pain of capital losses and reinvest our bonds and cash at more attractive valuation levels.
| |
Figure 1: Wounds that never heal - GMO Asset Allocation team Oct 2021 | |
Economic growth continues to weaken | |
|
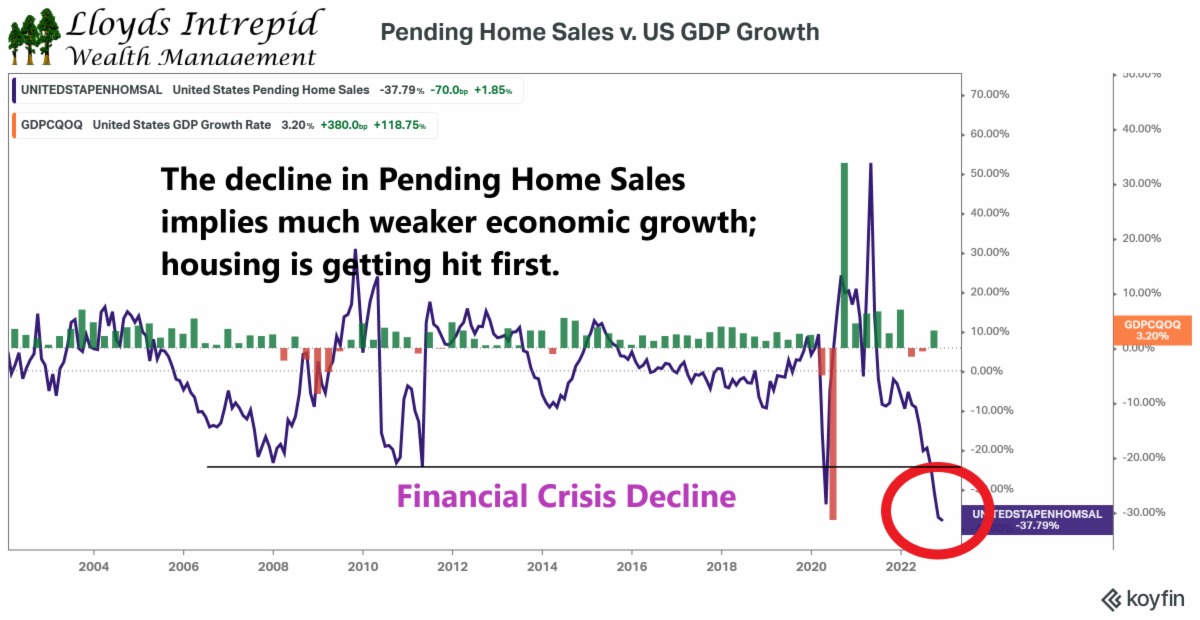
On December 28th, the Pending Home Sales report announced a decline of 38% from last year. Most of you are aware that mortgage interest rates rose along with other yields in the bond market. Housing is one of the most interest-rate sensitive industries in the United States and it is reacting as expected to the Federal Reserve's aggressive rate hikes.
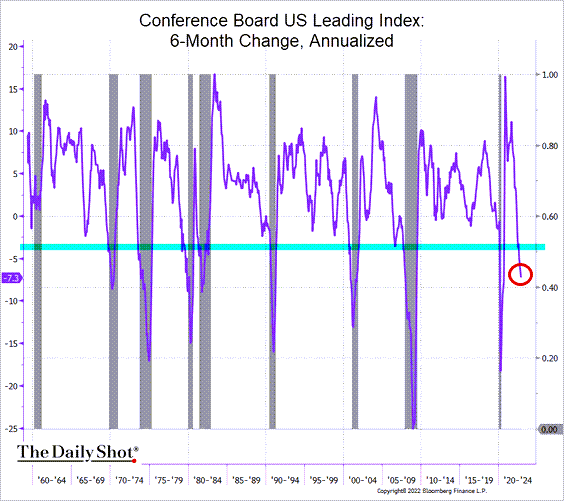
Other economic indicators such as the Conference Board's Leading Indicator continue to weaken, while employment remains strong. The Fed is very focused on employment strength. This means that even if cyclical parts of the economy slow down dramatically, with strong employment the Fed will be reluctant to cut interest rates.
Figure 2: Pending Home Sales versus US GDP Growth (LIWM)
| |
Figure 3: Conference Board Leading Indicator 6-month change (Conference Board, Bloomberg) | |
Inflation is eating into consumer spending | |
|
Investors follow retail spending data closely. Our nation's Gross Domestic Product is closely tied to consumer behavior, so anything that affects it is important.
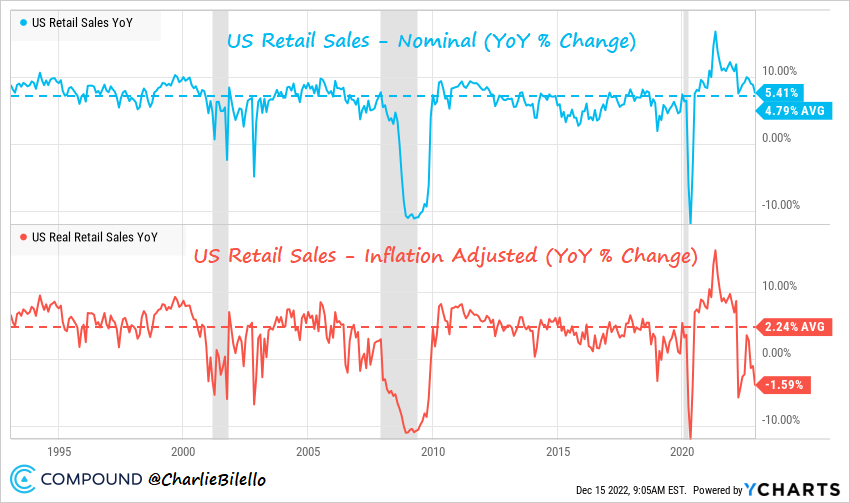
From a headline or nominal perspective, consumer spending seems fine. However, when you subtract out inflation, consumer spending looks a lot weaker. Because of inflation, consumer's spending power declines and they buy fewer goods. In economics, we call this the money illusion; we have more dollars to spend but can't actually buy more.
This is important because it signals hidden weakness in the economy. Current inflation-adjusted spending is down at recessionary levels right now.
Figure 4: Nominal and Real Retail Spending (Biello)
| |
Gasoline demand weakness confirms a slowing economy | |
|
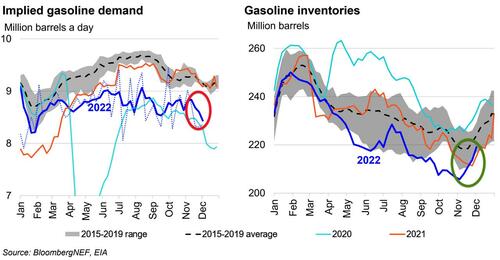
One of the other non-standard measures of economic health is gasoline demand. Despite government efforts to suppress the price of crude oil by withdrawing oil from the Strategic Petroleum Reserve (SPR), gasoline demand in the United States has remained weak.
In the chart below, you can see that implied demand (Demand = Supply - Storage) is trending well below pre-pandemic levels. This trend is very noticeable in mid-summer 2022. What happened in early 2022 that could be affecting this? Take your pick: aggressive Fed rate hikes, slowing housing market, war in Europe, or slowing exports.
Figure 5: Implied Gasoline Demand in the United States (Bloomberg)
| |
Stress is building as private equity funds halt redemptions | |
|
Private equity funds are interesting investment vehicles. The theory is that by investing in illiquid companies with new, professional management, private equity investors will be able to generate above average returns compared to public companies.
What we see in practice is that private equity returns are not immune from losses and follow the economic cycle with a long lag. We have not been recommending private equity for a few years because our research indicated that these investments would not only do poorly during a Fed tightening cycle but be impossible to sell.
This can become a systemic problem if it encourages investors to panic. If investors can't sell investment A, they sell two of investment B, maybe three of investment C.
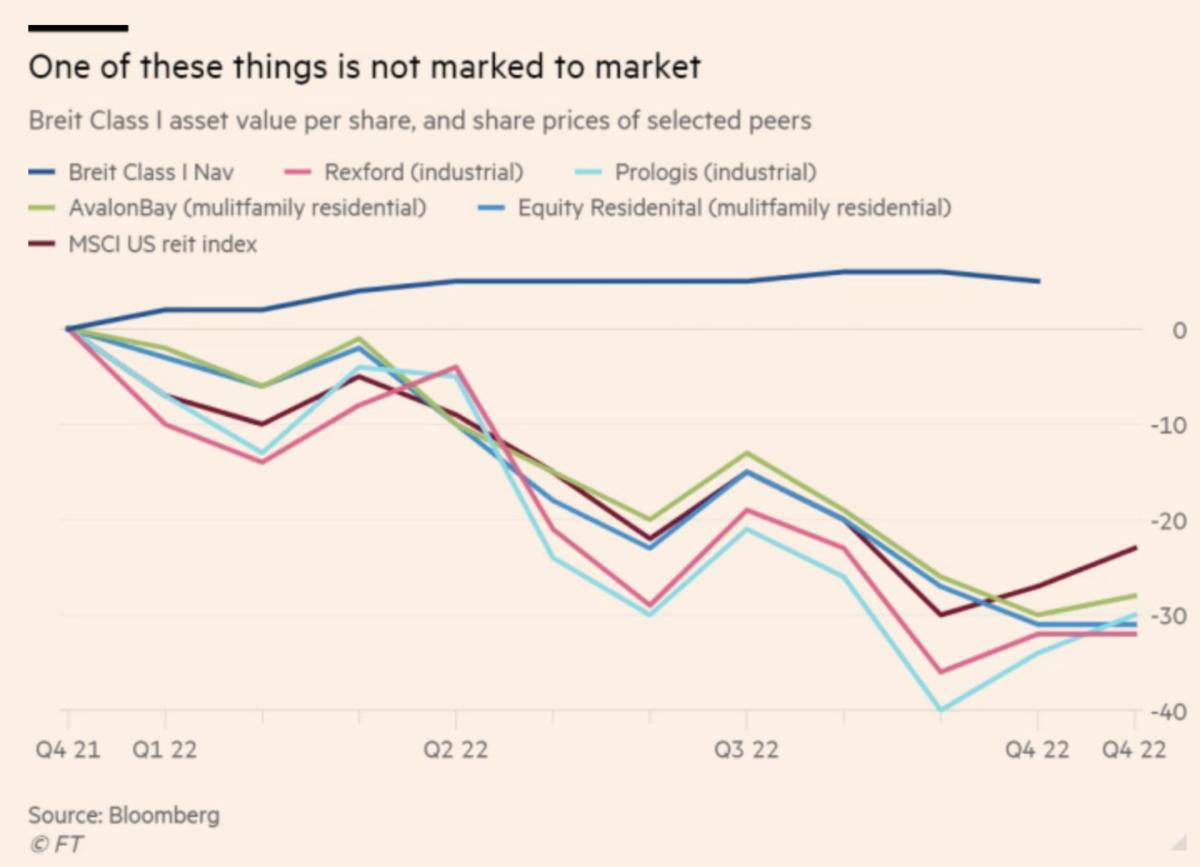
Blackstone, one of the largest private equity fund companies in the world, has recently closed several real estate funds. This means that investors can't get their money out anytime soon. This is a frustrating situation because the public real estate trusts are all trading down significantly year-to-date.
Why is this important? During the financial crisis in 2008, the closing of funds induced panic in the investment community. It was a "shoot first, ask questions later" situation when it came to raising cash. We will be watching this closely during 2023.
Figure 6: Comparison of Blackstone Private Equity with Public Equity Funds (Financial Times London)
| |
Investors did not capitulate in 2022 | |
|
One of the signs that a bear market is coming to an end is the capitulation of individual investors. As they become discouraged, they reduce their equity exposure and invest in other asset classes such as cash, bonds, or real estate.
In the chart below you can see the 1970s and 2000s were two decades where investors became extremely discouraged about equities as an attractive asset class. Today, it looks like sentiment is just beginning to turn down. That means the 2022 low was probably not the big bottom everyone is looking for.
Figure 7: Equity exposure and individual investor capitulation (All Star Charts)
| |
If the Fed cuts interest rates, I should... | |
|
When the Federal Reserve (The Fed) is raising interest rates, we call this a "tightening" cycle. The Fed is trying to tighten or restrict financial conditions to slow the economy and reduce inflationary pressures. Is this effective? Yes, very effective. Look at the Pending Home Sales chart in Figure 2 as a reminder.
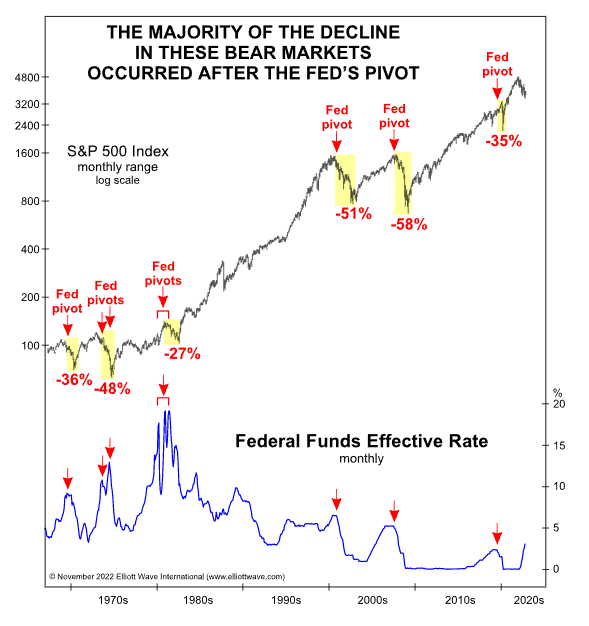
Here is a key question we get asked: Should you get bullish at the first Fed rate cut? Several studies indicate "no". It is usually well after the last Fed rate cut that the market bottoms and the economy begins to re-accelerate.
Remember, changes in Fed policy act with a long lag on the real economy. It may take several quarters for changes to affect behavior. Sadly, this lag is not constant and varies each cycle because of other variable such as inflation, government spending or war.
Figure 8: Market behavior after the first Fed rate cut in an easing cycle (Elliot Wave International)
| |
Will the Bear market end before recession is declared? | |
|
Most of Wall Street looks at monthly data to determine whether the economy is in recession or recovery. The official arbiter of recessions is the National Bureau of Economic Research (NBER), but they are notoriously late in declaring the beginning and end of recessions.
We can look at the factors they believe are important and try to measure the timing ourselves. The key factors are:
- Real personal income minus transfer payments (currently ok)
- Non-farm payrolls (currently strong)
- Real personal consumption expenditures (currently ok)
- Real retail sales (currently weak)
Using these monthly factors, we cannot say we are in recession, yet. But the signs of economic weakness are there. Unfortunately for the stock market, there has never been a situation since WWII where the bear market ended before a recession was declared.
This analysis indicates that the equity market bottom is not in place, yet.
Table 3: Number of bear markets that ended before recession onset (Carson research)
| |
Similarities to recent bear markets | |
|
Bull markets and Bear markets are dramatically affected by investor behavior. During a Bull phase, greed and optimism are fed by good earnings and low interest rates. In a Bear phase, fear and pessimism are fed by higher interest rates and weak earnings.
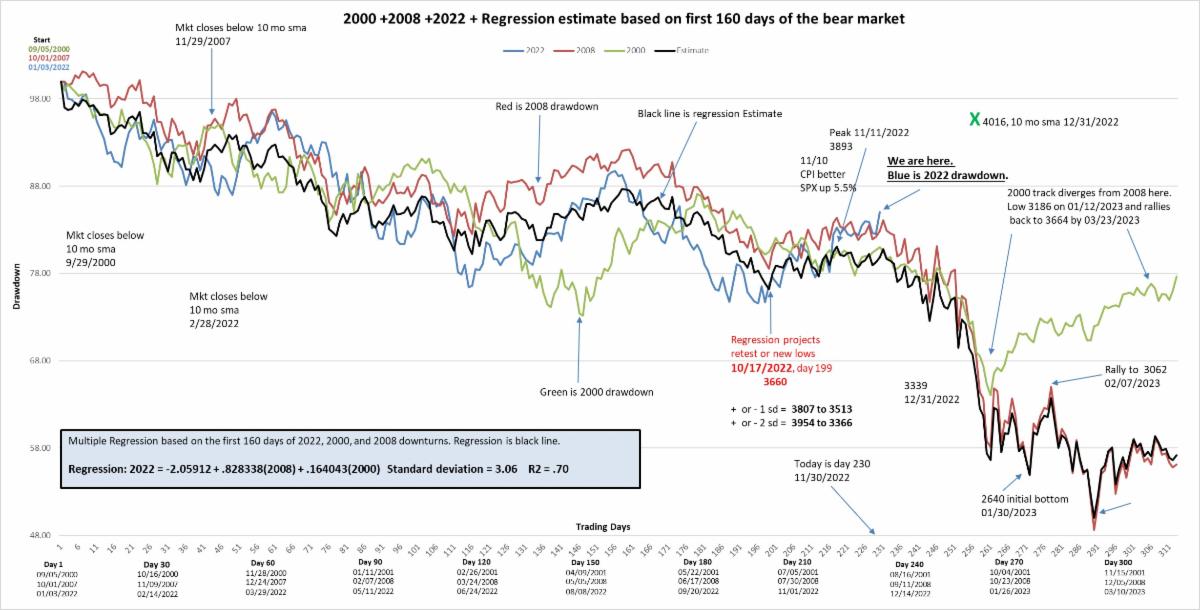
Both phases play out over time. Typically, Bear phases are shorter than Bull phases. Here is an analysis from a former portfolio manager at Invesco that compares the current market with 2000, 2008 and 2022. The goal of this graph is to compare market behavioral conditions today to those of past bear markets. It indicates that the 1Q2023 equity market may be weak if we are following the script of the last 3 major Bear markets.
Figure 9: 2000, 2008, 2022 Bear market regression and forecast (Chris Costanzo)
| |
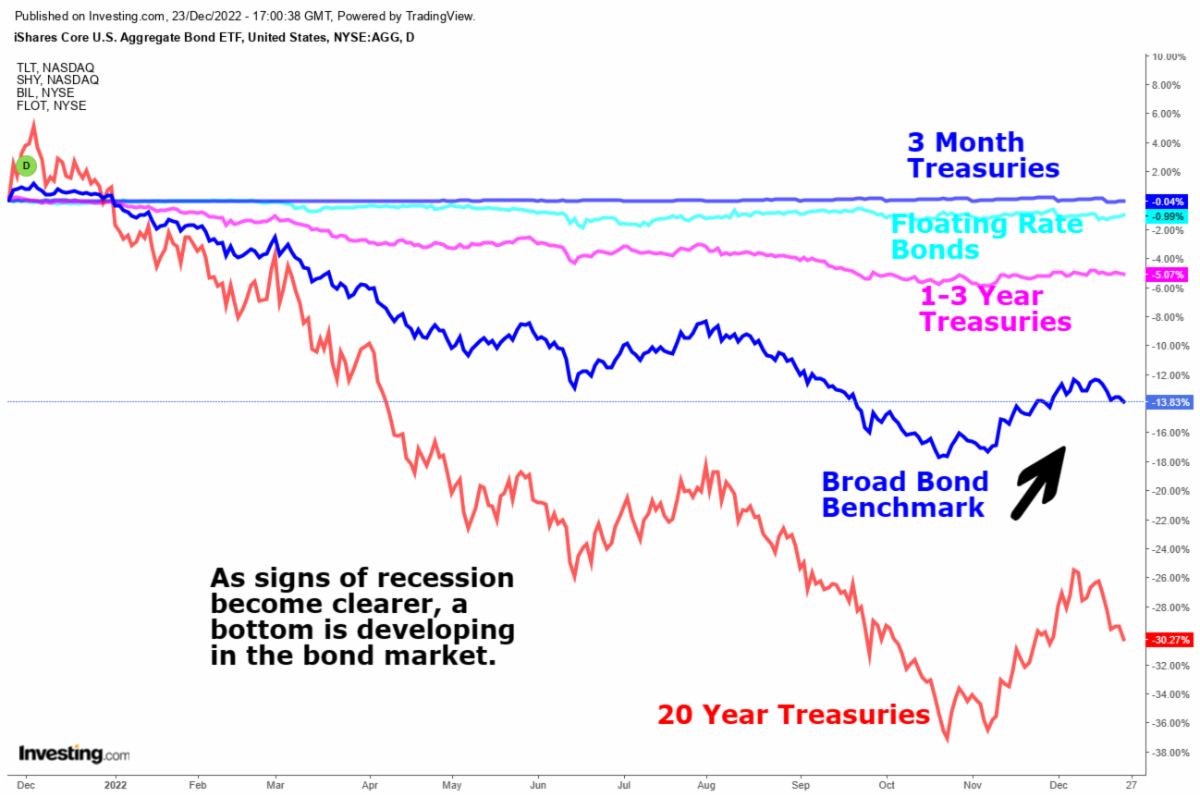
Bonds typically rally in recessions | |
Bonds have been awful investments in 2022. Normally, they provide diversification by going up when stocks go down. However, since their peak in 2020, it's been a one-way ticket down as waves of stimulus flowed through the economy and inflation roared to 40-year highs.
Historically, as an economy enters recession, economic activity and inflation usually fall. This anomaly can be found in most business cycles including that of the 1970s. This provides a good fundamental story for putting your toes in the water with traditional investment grade bonds. The yields are attractive and there is the potential for a 5-10% price appreciation as yields fall (remember, for bonds it is "yields down = price up").
The one wrinkle in this investment thesis is that the Omnibus Funding bill in late December injects more federal cash into the economy. This type of fiscal spending is inflationary and a problem for our thesis on recession causing lower inflation.
| Figure 10: Comparison of various bond investments during 2022 (LIWM) | |
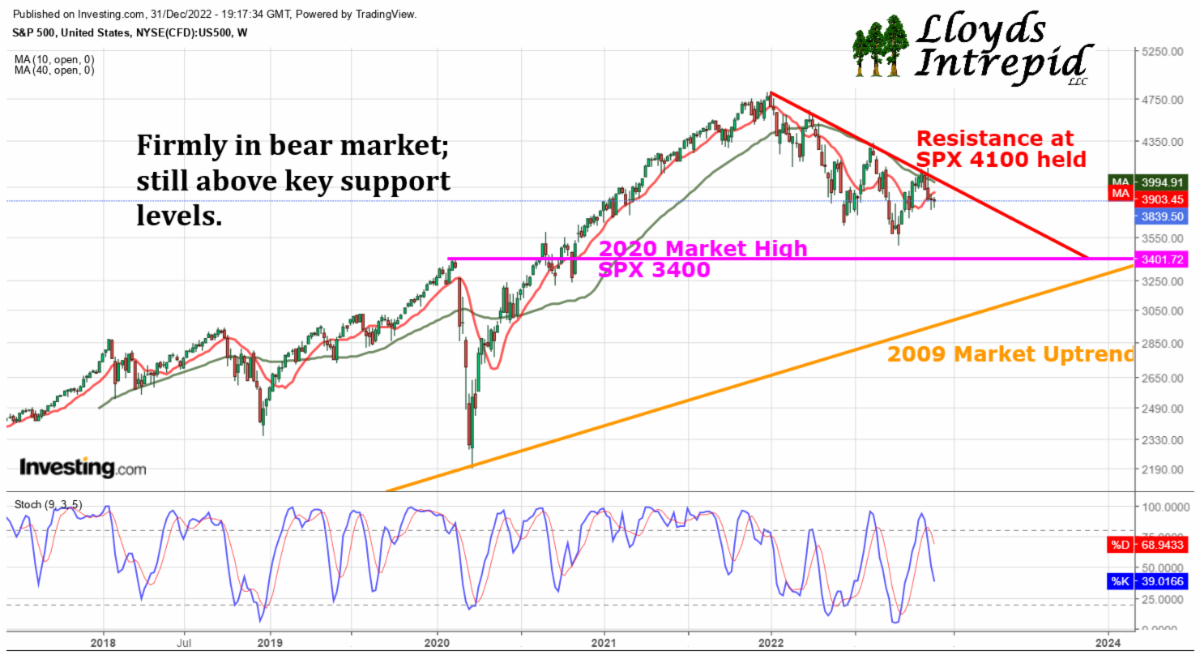
Equities are firmly in a bear market, but remain above key support | |
While we naturally tend to look at the losses from the all-time market highs, it is good to also recognize that the S&P 500 is well above the 2020 pre-pandemic highs and above the long-term uptrend that started in 2009. These remain areas of support in the coming months.
Where the market ultimately bottoms will be a function of Fed policy, earnings, and economic strength as we transit 2023.
| |
Important retirement plan changes in the recent Omnibus bill | |
|
Increased Required Minimum Distribution (RMD) Age
The first SECURE Act passed in 2019 increased the RMD age to 72. The SECURE Act 2.0 raises those ages again in 2 stages. Starting January 1st of 2023, the RMD age increases to 73. For those born after 1950 it is increased to 75 beginning in 2033.
529-to-Roth Rollovers
| |
One of the questions many diligent savers have regarding 529 plans is what to do with unused funds. After beneficiaries complete their withdrawals, the typical 529 account is liquidated and becomes after-tax investment capital of the account's owner. The SECURE Act 2.0 will allow 529 plan beneficiaries to make rollovers of up to $35,000 from 529 accounts into their Roth IRAs.
The rollover amount is limited each year to the Roth IRA contribution limits, meaning it would take several years of rollovers to exhaust the $35,000 lifetime limit. Nonetheless, this opens the door to a tax-friendly alternative to traditional strategies for unused 529 savings.
| |
New Emergency Savings Accounts | |
Finally, Congress is allowing the creation of a new type of savings account for retirement savers. In an effort to address the tendency of individuals to rely on retirement savings for emergency expenses, a new type of emergency savings account will be allowed in which employees can make 4 withdrawals each year without any penalty. Annual contributions are capped at $2,500, and when leaving employment the employee may roll these emergency savings accounts into a Roth IRA.
IRA Catch-Up limit increases
The IRS allows those in their final working years to make extra contributions to retirement accounts known as “catch-up” contributions. Typically, every few years Congress will increase the catch-up limit to adjust for inflation, but the SECURE Act 2.0 will let the catch-up limit increase with inflation automatically each year without requiring extra legislation from Congress. Additionally, those turning age 60-63 years old in 2025 will have the catch-up limits on their employer sponsored retirement plans increased from $6,500 to $10,000.
| |
|
We are in the midst of a difficult bear market. The Fed is still raising rates, inflation is high, earnings are slightly weaker, and employment is strong. We expect the Fed to continue raising rates, which will have negative effects on the markets and economy.
We remain underweight equities heading into 2023, underweight traditional bonds, and overweight short duration bonds and certificates of deposit. It is possible we get another bear market rally in January as tax-loss selling eases. However, news similar to the awful Pending Home Sales data (Figure 2) will encourage sellers to act.
You can find the performance of our discretionary portfolio composites at the link below. It should be ready by January 6th.
Our Performance | Lloyds Intrepid Wealth Management
If you are concerned about your situation and would like to speak with us, please reach out.
| |
|
As always, please call if you'd like to discuss:
Rob 281-402-8284
Chris 281-547-7542
| |
|
Christopher Lloyd, CFP ®
Vice President and Senior Wealth Planner
Lloyds Intrepid Wealth Management
1330 Lake Robbins Dr., Suite 560
The Woodlands, TX 77380
281-547-7542
Chris.Lloyd@lloydsintrepid.com
www.lloydsintrepid.com
| Lloyds Intrepid LLC is an Investment Advisor registered with the State of Texas, where it is doing business as Lloyds Intrepid Wealth Management. All views, expressions, and opinions included in this communication are subject to change. This communication is not intended as an offer or solicitation to buy, hold or sell any financial instrument or investment advisory services. Any information provided has been obtained from sources considered reliable, but we do not guarantee the accuracy, or the completeness of, any description of securities, markets or developments mentioned. We may, from time to time, have a position in the securities mentioned and may execute transactions that may not be consistent with this communication's conclusions. Please contact us at 281.886.3039 if there is any change in your financial situation, needs, goals or objectives, or if you wish to initiate any restrictions on the management of the account or modify existing restrictions. Additionally, we recommend you compare any account reports from Lloyds Intrepid LLC with the account statements from your Custodian. Please notify us if you do not receive statements from your Custodian on at least a quarterly basis. Our current disclosure brochure, Form ADV Part 2, is available for your review upon request, and on our website, www.LloydsIntrepid.com. This disclosure brochure, or a summary of material changes made, is also provided to our clients on an annual basis. | |
|
Performance Disclosures
INVESTING INVOLVES RISK, INCLUDING THE POSSIBLE LOSS OF PRINCIPAL. PAST PERFORMANCE IS NOT A GUARANTEE OF FUTURE RESULTS.
NOT FDIC INSURED. NOT BANK GUARANTEED. MAY LOSE VALUE.
Lloyds Intrepid LLC is doing business as Lloyds Intrepid Wealth Management. Lloyds Intrepid LLC offers investment advisory ser-vices and is a registered investment adviser in the State of Texas where registered and in other jurisdictions where exempted. Registration does not imply a certain level of skill or training. Lloyds Intrepid LLC and its advisers do not provide legal, tax or ac-counting advice. Lloyds Intrepid LLC formulates retirement plans, investment strategies, portfolio construction and investment due diligence for clients with signed investment advisory agreements with us.
This presentation is offered for informational purposes only and is not a specific offer or solicitation by Lloyds Intrepid LLC to buy or sell any investment product or service. This presentation is not investment advice. All opinions and outlooks are subject to change. The information contained herein has been obtained from sources believed to be reliable, but the accuracy of the information cannot be guaranteed. Investments possess a variety of risks. Equity securities possess more risk than bonds or other debt securities and are particularly subject to fundamental change as well as changes to economic, legal, regulatory, and monetary policy, both in the U.S. and abroad. Smaller and international equities have more risk than large US stocks. Bonds are subject to credit risk, interest rate risk, inflation risk and default risk. Treasury bonds tend to have little credit and default risk but are highly sensitive to changes in interest rates and inflation. Corporate bonds tend to be more sensitive to credit risk and default risk. Municipal bonds typically pay tax exempt interest and despite being government entities are subject to credit risk, interest rate risk, inflation risk and default risk. Mortgage bonds possess credit risks and prepayment risks not found in other bond categories. In-vestments in real estate are subject to interest rate, default, and economic risk. International investments, either through direct investment, ADRs or funds, possess unique risks associated with currency translation, different accounting standards, and legal risk from operating in a foreign jurisdiction. Commodities possess unique risks that include regulatory risk, high price-volatility risk, along with interest rate risk, inflation risk and credit risk. Portfolio strategies that use asset allocation, diversification, re-balancing, indexing, or security selection do not ensure profit gains or loss avoidance. Indexes are unmanaged and not available for direct investment; index fund performance will differ from index performance due to management fees. Losses will likely occur in declining markets.
This performance report is generated from the returns of actual portfolios. Composites represent actual portfolios that are managed together in a single discretionary strategy. Lloyds Intrepid LLC performance has not been independently verified. All advisory fees, commissions and client paid expenses are reflected in this net-of-fees presentation. Some portfolios are portfolios that pay no fee and have less than $10,000 of value. These will be disclosed if requested. There are no material factors for comparing returns to benchmarks; each strategy is matched with an appropriate benchmark for comparison. Strategies presented reflect the performance of Lloyds Intrepid LLC discretionary portfolios. Investment objectives are consistent with the assigned benchmarks.
These portfolios have a potential for losses as well as gains. Returns are presented net-of-fees. Risk measures, when presented, are calculated gross-of-fees. Performance is reported in U.S. Dollars. Composites exclude portfolios that have changed model during the measuring period. Internal dispersion is not presented for composites with less than five portfolios. Dividends are included in portfolio return. Investments cannot be made directly into an index.
Lloyds Intrepid LLC offers discretionary portfolios where holdings and asset allocations are actively managed. Unless noted otherwise, these strategies do not use leverage, derivatives, or short positions, are generally liquid and carry the risks associated with index, mutual fund and exchange-traded-fund investing. Occasionally, these strategies will hold individual stocks. The investment objective for each strategy is to exceed the long-term performance of the associated benchmark. Here is a list of our strategies:
Bonds
Bond portfolios target an asset allocation of 99% bonds.
Conservative
Conservative Portfolios target an asset allocation of 25% stocks and 75% bonds and cash.
Moderate Conservative
Moderate Conservative portfolios target an asset allocation of 37% stocks and 63% bonds and cash.
Moderate
Moderate portfolios target an asset allocation of 50% stocks and 50% bonds and cash.
Moderate Aggressive
Moderate Aggressive portfolios target an asset allocation of 63% stocks and 37% bonds and cash.
Aggressive
Aggressive portfolios utilize an asset allocation target of 75% stocks and 25% bonds and cash.
Stocks
Stock portfolios target an asset allocation target of 99% stocks.
Blended benchmarks are custom benchmarks that are applied to the performance of each named composite and reflect the long-term asset allocation target for each strategy. The composites presented here are those where LIWM has complete portfolio and asset allocation discretion.
Bond composite benchmark is 100% Bloomberg Barclays Aggregate Bond. The Bloomberg Barclays Aggregate Bond benchmark is used in the blended benchmarks below.
Stock composite benchmark is 100% S&P 500 total return. The S&P 500 benchmark is used in the blended benchmarks below.
Conservative composite blended benchmark is 25% stocks and 75% bonds.
Moderate Conservative composite blended benchmark is 37% stocks and 63% bonds.
Moderate composite blended benchmark is 50% stocks and 50% bonds.
Moderate Aggressive composite blended benchmark is 63% stocks and 37% bonds.
Aggressive composite blended benchmark is 75% stocks and 25% bonds.
While returns are presented here as net-of-fees, gross-of-fees returns are available for institutional investors on request and reflect the deduction of transaction costs and custodian fees but not the deduction of investment management fees.
| | | | |