The-Lead-Left-logo-with-PC_Newsletter image

PDF | Research | Week of January 22, 2024

Quote of the Week

“Sellers have conceded to lower valuations and the pressure to meet a certain return on investment is ticking.”

– Pete Stavros, co-head, global private equity, KKR.

Four for ’24 (Fourth of a Series)

sean-pollock-PhYq704ffdA-unsplash-scaled image

3. Stay Alive to Thrive: Portfolio excellence sustains investment activity/playing offense.


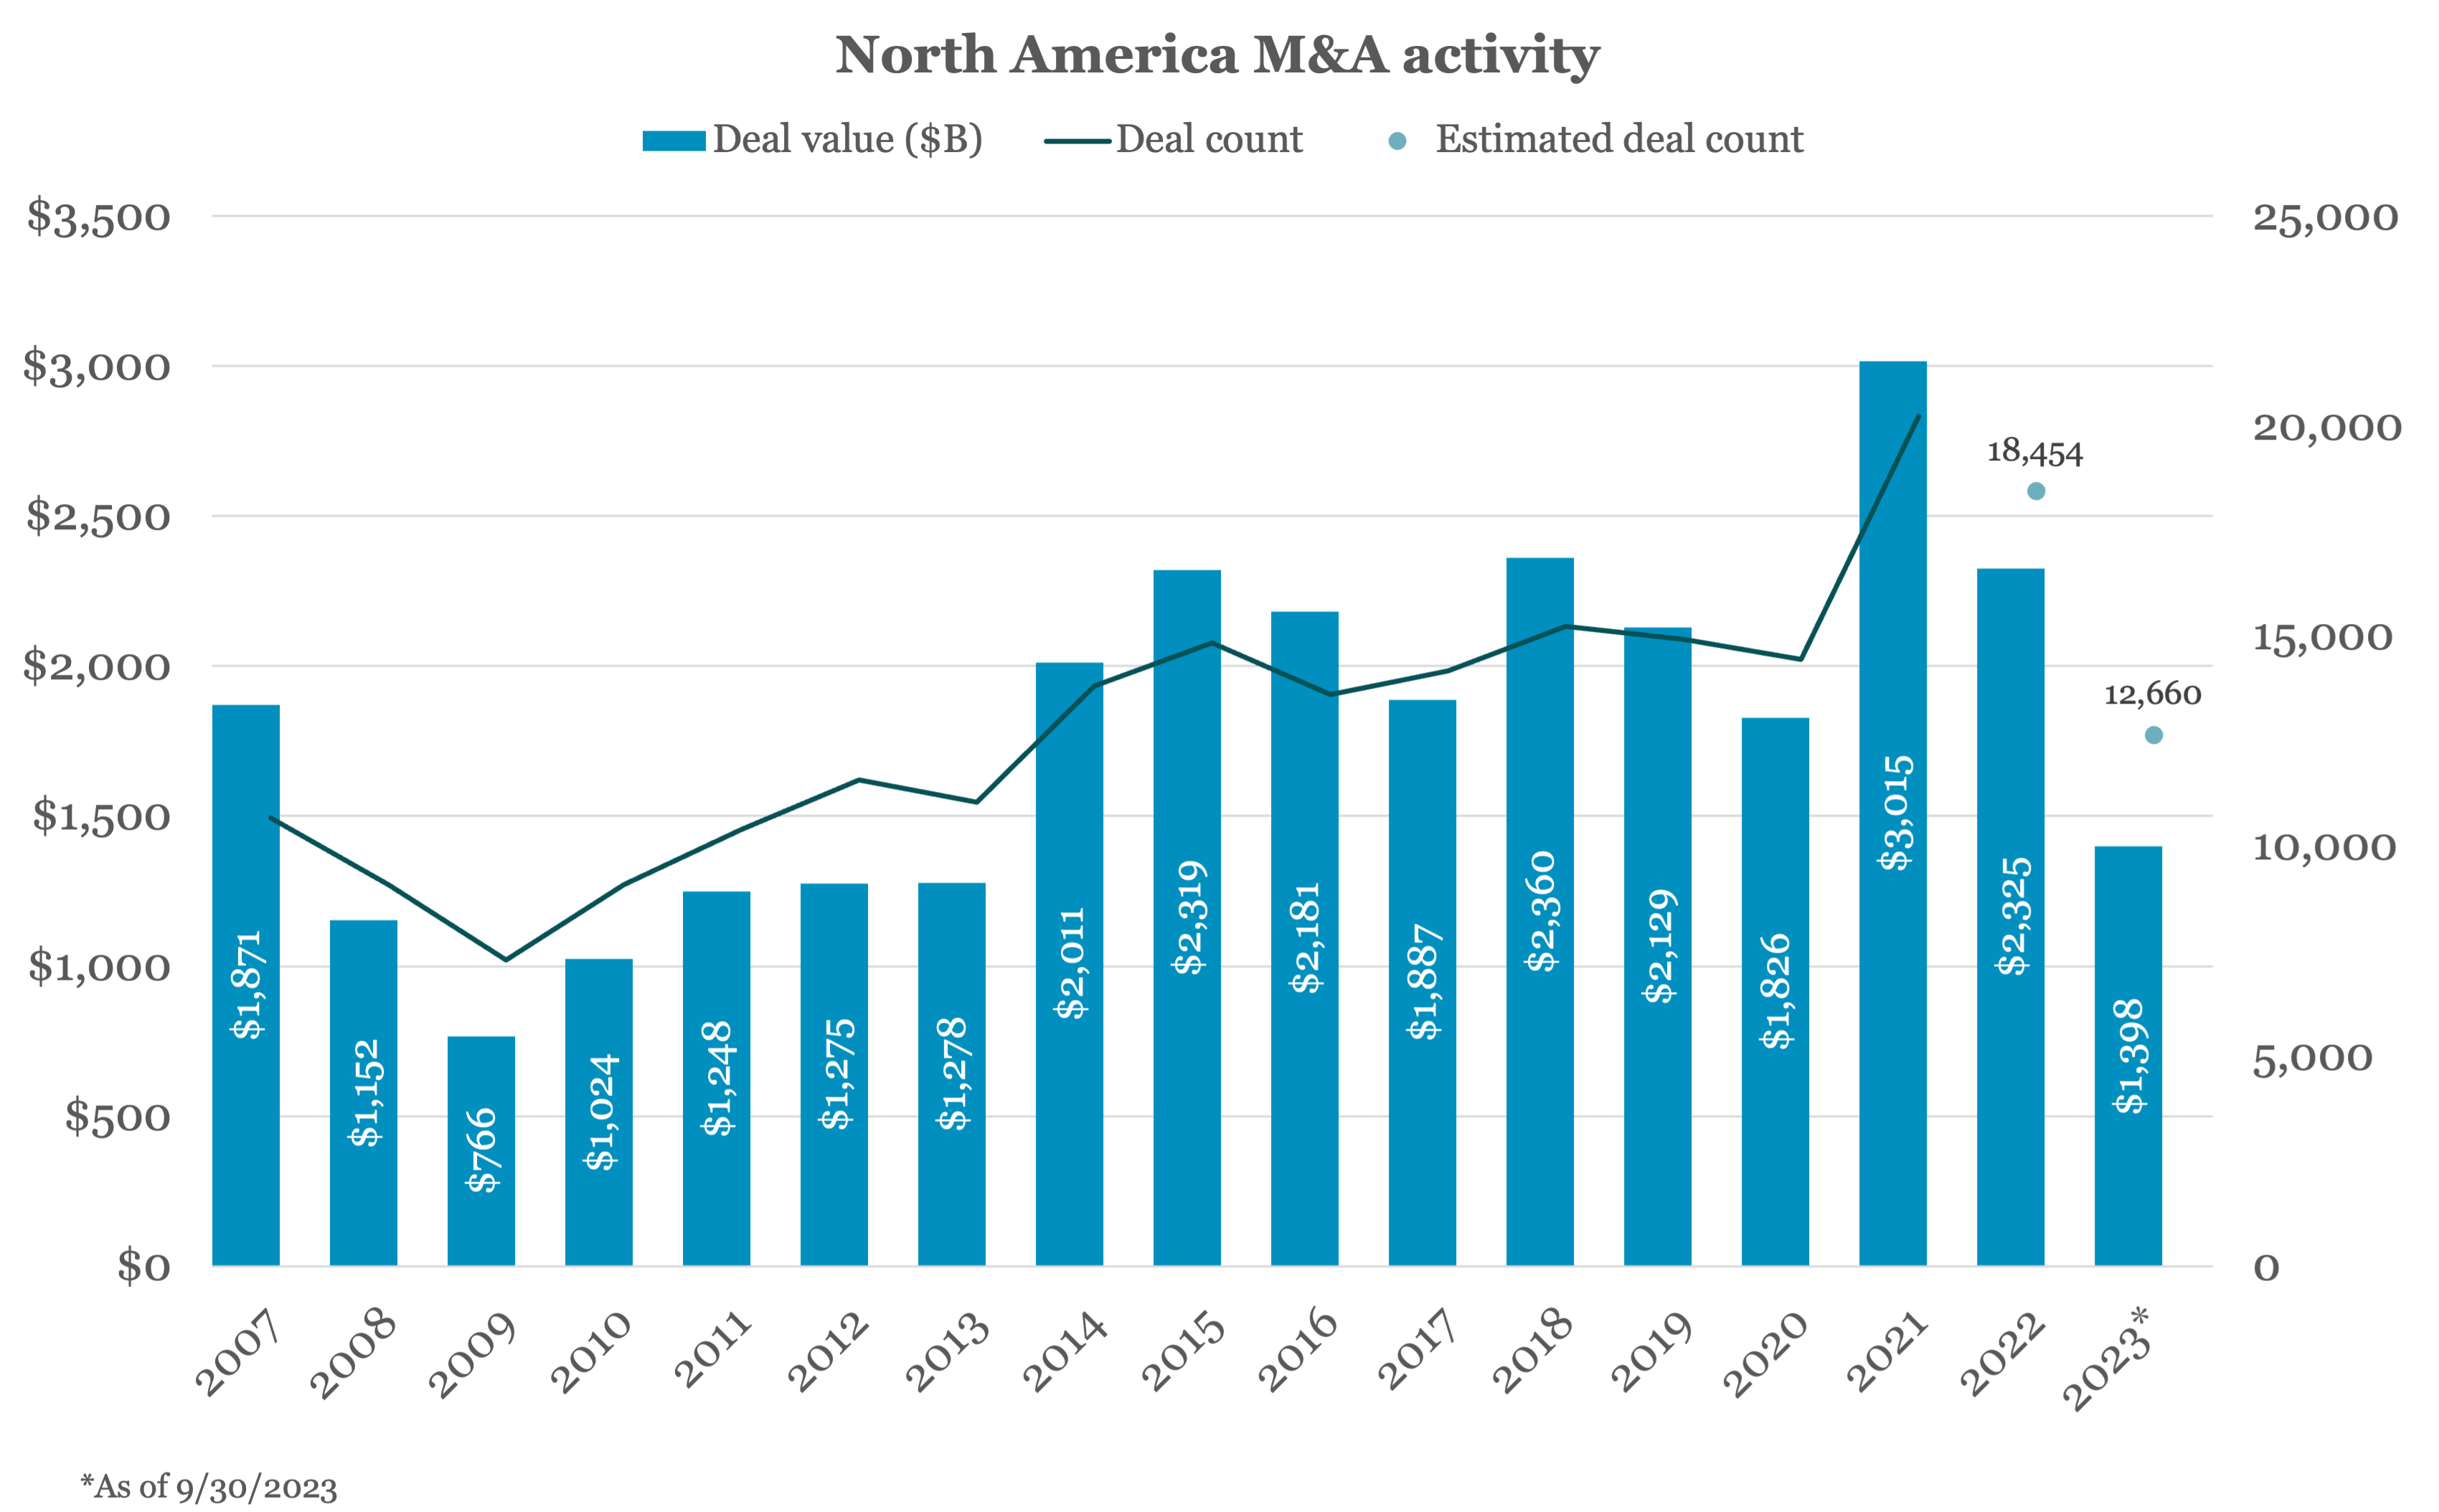
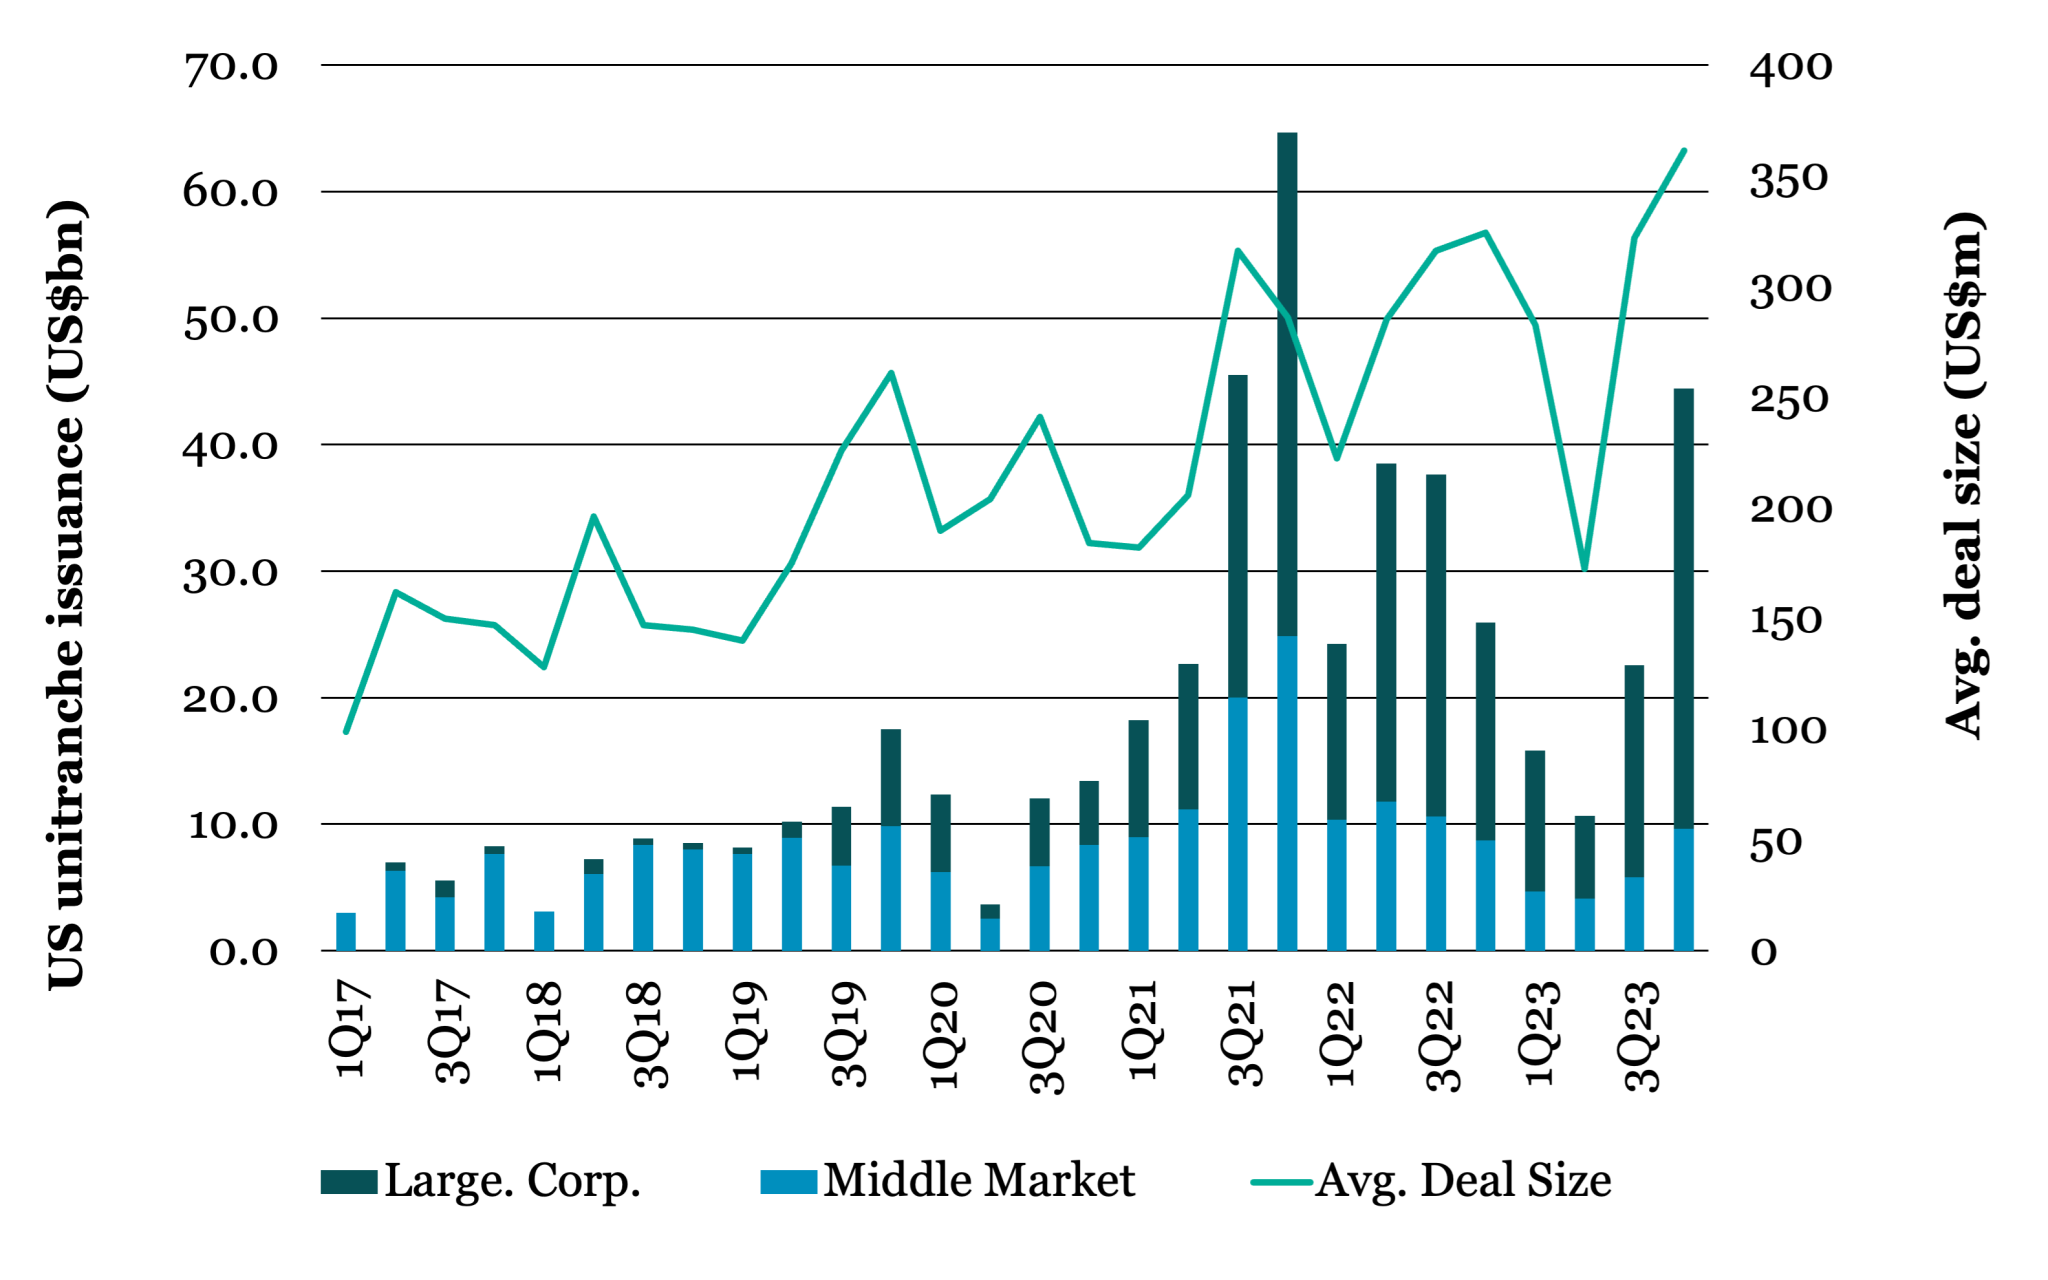
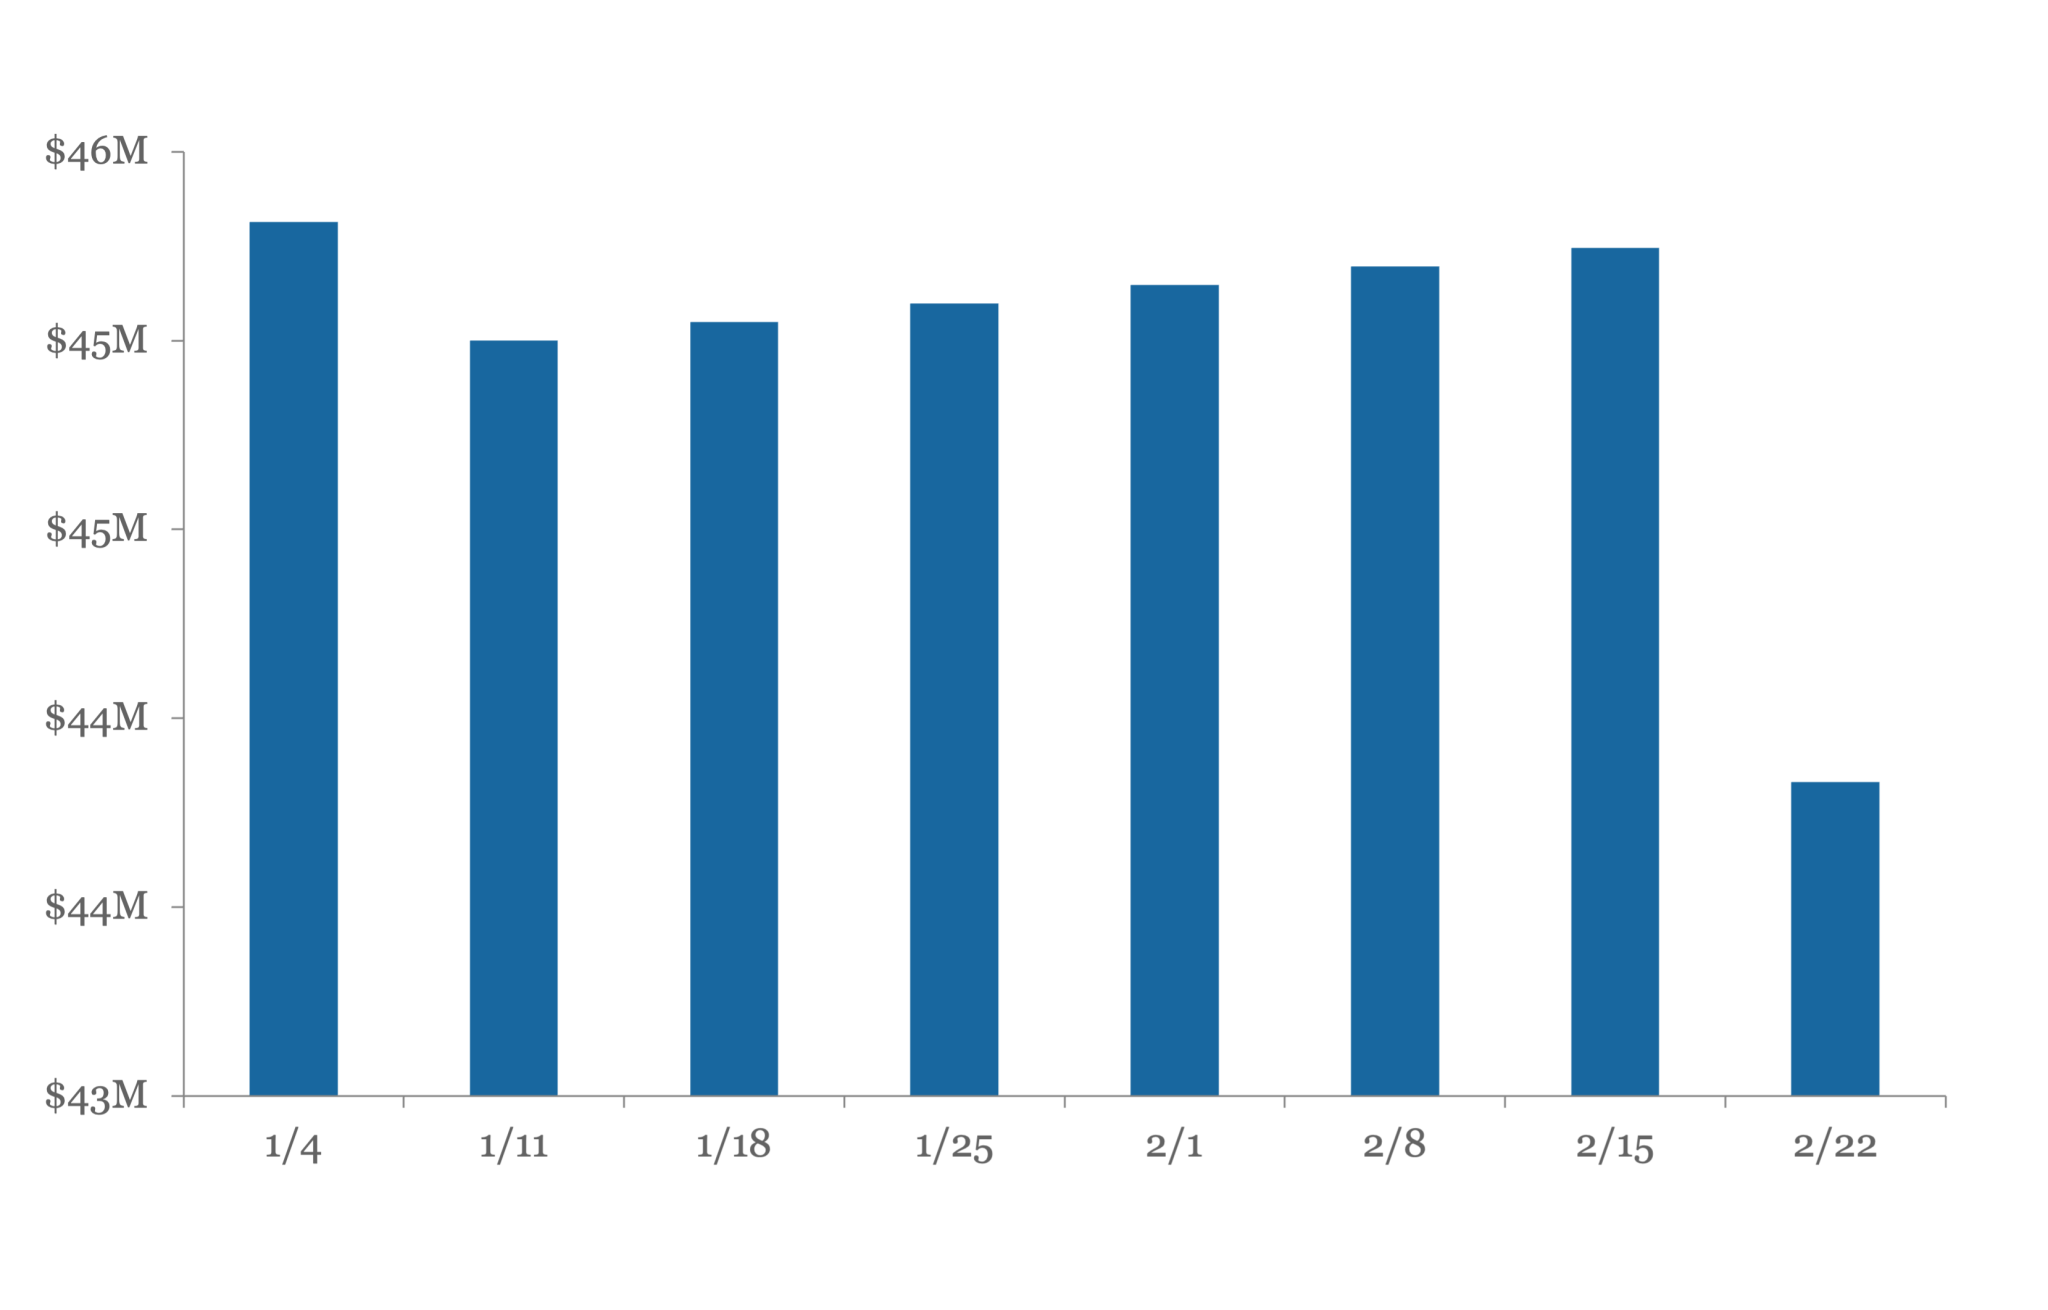
Last week we wrote about the growing gap between private capital winners and losers. That will only accelerate as today’s winners emerge from the higher rate market. Experienced managers with healthy, high-quality portfolios can and will continue to play offense and take market share. Our own portfolio expanded nicely despite a marked decline in overall middle market M&A volume. 


What goes into creating portfolio excellence? We put it into three operating principles: 


First, diversification as a shield. It’s easy to talk about portfolio diversification (everyone does), but what does “diversified” really mean? Diversification must be evaluated across multiple dimensions: sector, deal structure, leverage profile, sponsor relationships, company model, and so on. 


Absolutely fundamental is having no outsized loan commitments relative to the size of the portfolio. As one example, our average position size is well below 1%. This intense focus on diversification minimizes the impact of any challenged investment. So, while we have certainly seen headwinds in certain areas such as multi-unit healthcare, third-party logistics and digital marketing, the platform continues to play offense with deployment up smartly. 


“Flight to quality” was a key theme for investors in 2023 given overall market uncertainty. Prioritizing high quality assets should always be a focus, irrespective of economic conditions. By consistently backing strong businesses (in bull and bear markets), investors can have a durable portfolio with sustained growth despite a tough environment with minimal watch-list names. Quality businesses are those that 1) have strong cash flows and margins; 2) offer non-discretionary products or services and (3) operate in service-oriented, B2B end markets. 


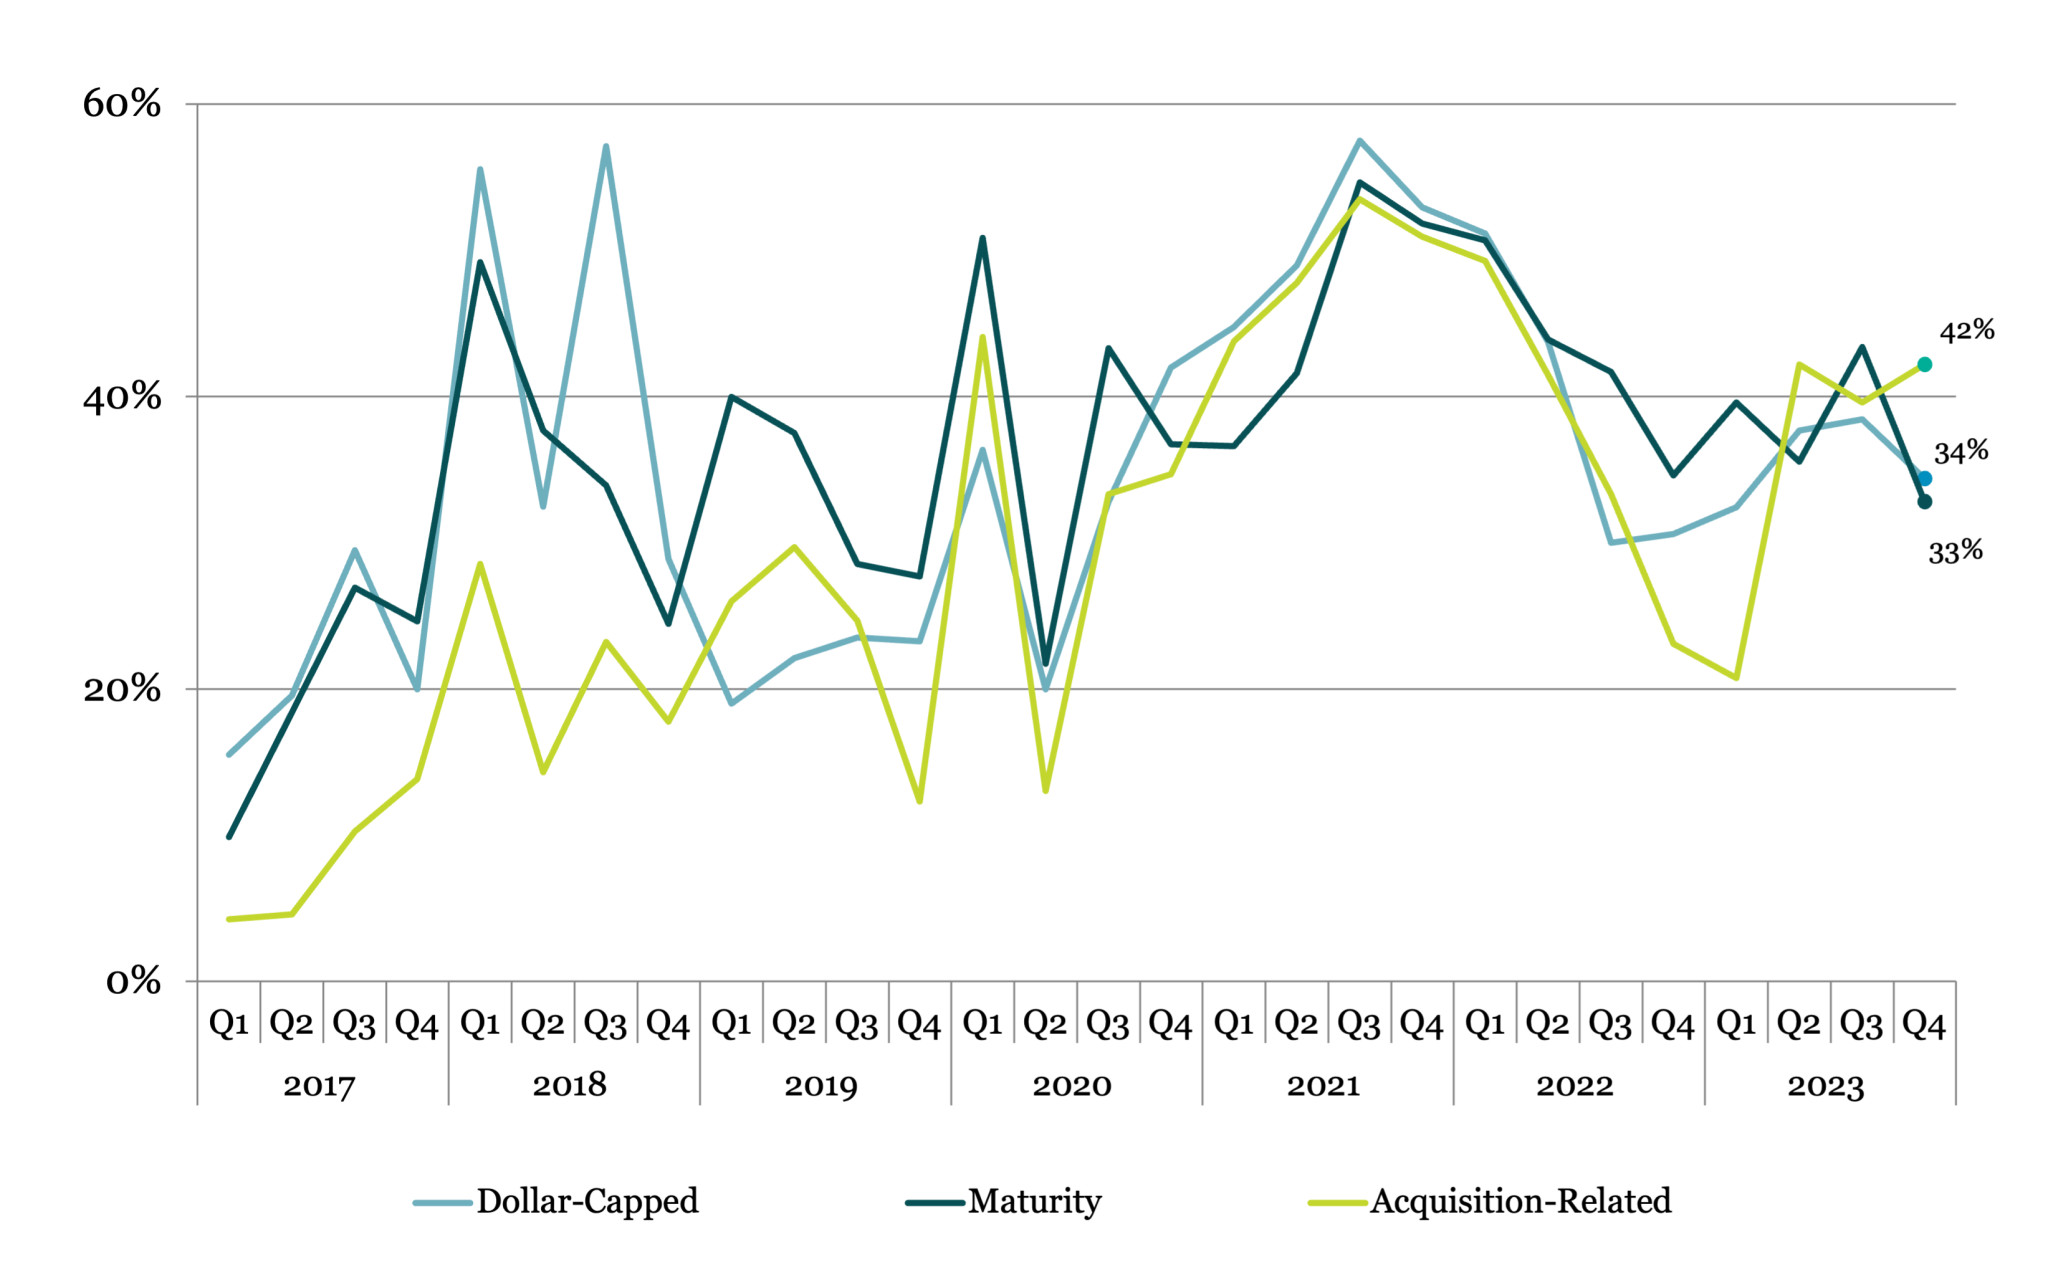
Finally, investing behind sponsor-backed portfolio companies has been crucial to mitigating risk. GPs not only bring deep experience creating value through market cycles, but also have meaningful skin in the game, typically through a significant cash equity investment. In today’s portfolios, it’s not unusual for buyers to contribute 60% equity or more. 


This dynamic creates real alignment between lenders and PE firms, helping to drive positive outcomes when things go sideways. By focusing on sponsor-backed financings, private capital investors can efficiently allocate resources to the best opportunities.  


By maintaining a diversified portfolio, focusing on resilient sectors, and mitigating risk through strong alignment, private capital investors will not only survive challenges but can also thrive amidst uncertainty. In 2024, if overall market M&A volume picks up as expected, these winners should be very well-positioned for another strong year.  

Visit our Website

February 6 & 7, 2024

Encore at the Wynn in Las Vegas, NV

SFNet’s Asset-Based Capital Conference 2024

Doing What We Do Best

Learn More

#SFNetABCC24

Chart of the Week

Buy and Cellar

With higher rates creating financing and valuation challenges, M&A has plummeted.

CTW-0122 image

Source:  PitchBook

(Past performance is no guarantee of future results.)

Lead with Your Left

30-DAY FREE MEMBERSHIP


Join the leading voice of the middle market. Try us free for 30 days.
Learn More

Stat of the Week

Jan-22-2024-Stat-edited image

Loan Stats at a Glance 

PitchbookLCD-Logo-for-newsletter image
LCD-2024-01-22- image

Contact: Ryan Brown/ PitchBook LCD

PDI Picks

Investors stick with tried and trusted

PDI-0122-1-2048x1217 image

North America and direct lending are more in favour than ever, PDI’s LP Perspectives survey discovered. 

In this column last week, we reflected on some of the headline findings from our LP Perspectives survey, which obtained the views of 117 institutional investors on the current state of private markets. We commented on how investors were looking to commit more to the asset class over the next 12 months – buoyed by the easing of over-allocation concerns and by expectations of strong performance.


But there were other observations to be made that we didn’t have room for last week. One is the strong attachment that investors have to the longest-established regions and strategies. Almost a third (30 percent) of LPs said they would have a greater interest in North America over the next year – and that’s on the back of North America already being comfortably the most popular region (see chart). By comparison, the figures for Europe and Asia-Pacific were 17 percent and 14 percent respectively and no other region scored higher than 5 percent.

When it came to strategies, it was also the case that investors were keen on more of the same – with 45 percent planning to invest more in direct lending, private debt’s biggest area of investment, over the next 12 months. No other area of investment saw more than 18 percent of investors saying a greater amount would be committed to it over the next year.


While some might see this as a lack of adventurousness, the truth is many investors are still coming to private debt for the first time – either completely new to the asset class, or at least carving out new private debt-specific allocations. These newcomers are highly likely to turn to mainstream regions and strategies as the building blocks of their exposures. As time passes, and commitments stretch over the long term, so private debt’s more esoteric strategies will come under consideration. 

Leveraged Loan Insight & Analysis

Daily Analytic: US unitranche issuance climbed sharply in 4Q23 across both the large corporate and middle markets

LSEG-0122-2048x1280 image

Unitranche lending moved markedly higher in 4Q23, with volume totaling US$44.4bn, the third busiest quarter on record. The jump in unitranche volume was evident across both the large corporate and middle markets. Large corporate unitranche volume surged by 108% in 4Q23 to US$34.8bn, the second highest quarter recorded. At the upper end, there were five unitranche deals in 4Q23 that

topped US$2bn in size. Middle market unitranche lending, on the other hand, jumped 65% to US$9.6bn in 4Q23, though it remained far below the record of US$24.9bn set in 4Q21. Leverage levels continued to move lower for middle market unitranche structures in 4Q23, ticking down to 5.52x from 5.66x in 3Q23 and 5.86x in 2Q23.

Contact: CJ Doherty / LSEG LPC

The Pulse of Private Equity

PE buying to selling and the net exit gap ($B)

PB-0122-1-1024x619 image
Download  Data & Report

Contact: Garrett Black / PitchBook

KBRA Direct Lending Deals: News & Analysis

DLD-Logo image

TTM Default Volume, Count

KBRA-0122-2048x1345 image

Contact: Eric Rosenthal / KBRA DLD

Middle Market & Private Credit

Fitchratings-for-newsletters image

European and US LevFin Default Rates Will Continue to Rise in 2024

Fitchratings-EU-1-2048x1373 image
Fitchratings-US-2048x1420 image

Leveraged finance default rates increased in 2023 in Europe and the US and will continue to rise in 2024 due to high interest cost burdens and macroeconomic pressure. Both the European and US leveraged finance sector outlooks remain deteriorating.

Fitch forecasts 2024 default rates of 3.5%–4.0% for US leveraged loans, and 5.0%–5.5% for US high-yield bonds. Fitch forecasts default rates for European high-yield bonds and leveraged loans to rise to 4% in 2024 and 2025 from 2.5% and 3% respectively in 2023.


Learn more

Contact: Brad Hamner / FitchRatings

Covenant Trends 

Percentage of Loans with MFN Carveouts

CR-0122-2048x1285 image
Download Data

Contact: Steven Miller / Covenant Review

High-Yield Bond Statistics

Launched Volume

Levfin-LV-0122-2048x1292 image

New-issue Yields

Levfin-NIY-0122-2048x1338 image

Weekly Fund Flows

Levfin-WFF-0122-2048x1310 image

Weekly fund flows source: Lipper

Download Data

Contact: Robert Polenberg / LevFin Insights

Debtwire Middle-Market

debtwire-0122-3-1024x647 image

The blue line in the chart is the current dividend yield of the *VanEck BDC Income ETF (currently at 10.7% as of 22 January, down from the highest level in last 12 months of 12.1% in May 2023) that tracks the overall performance of publicly traded business development companies (BDCs, lenders to privately held middle-market businesses that tend to be below investment grade or not rated, with most lending comprising of senior secured loans). The brown line displays the BofA Merrill Lynch US High Yield (US HY index - currently at 7.6% as of 22 January, decline from the highest level in last 12 months of 9.5% in October 2023), which tracks the performance of USD denominated below investment grade corporate debt publicly issued in the US.


Although, interest rates remained unchanged (5.25% - 5.5%) and paused since July 2023 by the FED, rate cuts are anticipated in 2024. In December 2023, inflation increased to 3.4%, from 3.1% in November 2023, due to rising costs of shelter, food, energy, motor vehicle insurance and medical care. However, inflation is down by almost half from 6.4% in January 2023. A soft landing of inflation in January and February may be an important factor in determining the rate cuts in the FED’s March meeting.


The spread of BIZD dividend yield minus the US High Yield (shaded area in gray) shows the premium/discount of middle-market loans over traditional high yield. As of 22 January, BIZD dividend yield was at a premium of 307bps to the US High Yield Index, 51bps above the 1-year average of 256bps. The premium for middle market, to some extent, depicts illiquidity for private loans and the credit risk associated with middle market companies. The spread of BIZD dividend yield minus the 2-year treasury (shaded area in light blue) stood at 632bps as of 22 January, marginally below the 1-year average of 636bps.


*As of 31 December 2023, BIZD’s weighted average market cap stands at USD 4.8bn, with PE ratio of 8.97 and PB of 0.98, with the entire portfolio holdings in publicly traded BDCs. Click here for top holdings.

Download Data

Contact: Suneet Chandvani / Debtwire 

Middle Market Deal Terms at a Glance

SPP-Jan-2024 image

Contact: Stefan Shaffer / SPP Capital Partners

Churchill-2020-logo-white-for-event-invite image
STAY CONNECTED
Twitter  Linkedin  Youtube  

This publication is a service to our clients and friends. It is designed only to give general information on the market developments actually covered. It is not intended to be a comprehensive summary of recent developments or to suggest parameters for any prospective financing opportunity.