|
Producers can keep track of their price risk protection through revenue insurance in a given growing season by comparing the Harvest (Fall) Price to the Projected (Spring) Price determined by USDA-RMA. A previous article examined the price protection offered by Revenue Protection (RP), Supplemental Coverage Option (SCO), and Enhanced Coverage Option (ECO) crop insurance for corn and rice (Biram, 2023). That article only considered the change in prices and did not consider the potential change in yield. This article builds on the previous one by considering both the price and yield protection offered by ECO and providing a snapshot of how county yields may change for indemnities to trigger.
ECO is an area-based crop insurance product and must be paired with farm-level insurances like Yield Protection (YP) or RP. The liability insured by ECO is calculated using the same parameters as RP (e.g., APH farm yield and futures prices) at coverage levels of 90% and 95%. The futures price used is based on the higher of the Projected Price and the Harvest Price determined by USDA-RMA. Unlike RP – which triggers indemnities based on farm-level losses –ECO triggers an indemnity based on county-wide losses and will trigger a full indemnity when county-level revenue losses fall to 86%.
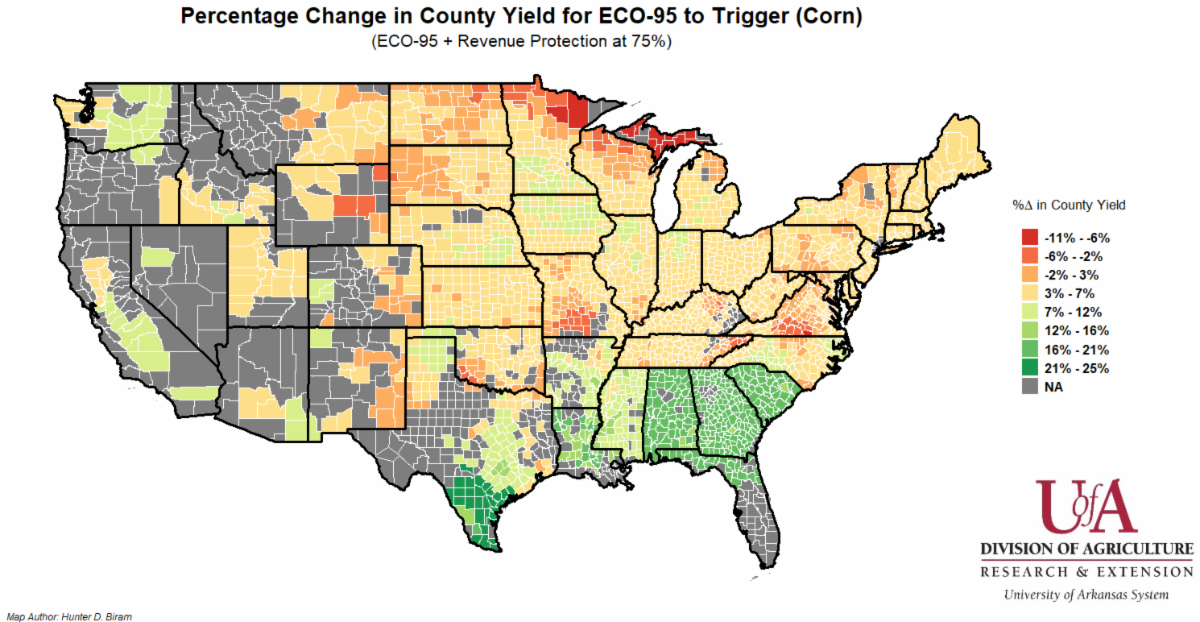
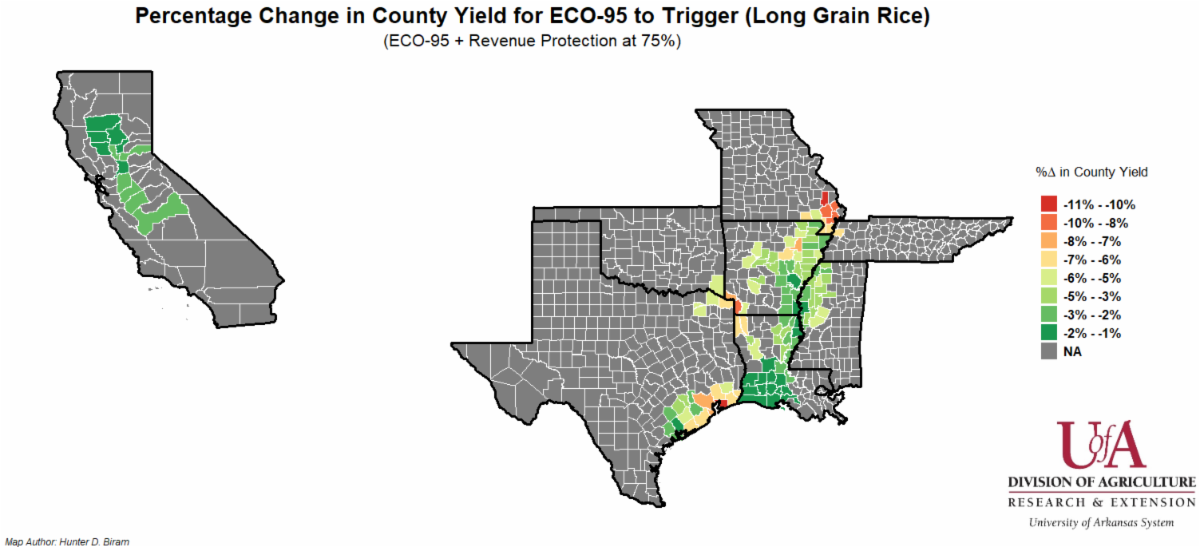
A county-level map is provided which shows the extent to which the final county yield can change relative to the expected county yield and still trigger an indemnity for corn that is equal to the producer paid premium (Figure 1). In other words, this map answers the question of how much county yield can change to trigger an indemnity that will at least cover the producer-paid premium. The producer premium was determined for RP at the 75% coverage level (RP-75) under optional units paired with ECO at the 95% coverage level (ECO-95) with the associated premium subsidy rate applied. Projected and Harvest Prices reported by the RMA Price Discovery Tool are used with the associated price volatility.
As an example, a county shaded in the darkest green tells us that the final county yield may increase at least 21-26% for an indemnity to trigger which covers the producer premium. This would suggest the price decline in the futures market was severe enough to allow for yield upside risk that would offset indemnities triggered on price alone. Conversely, a county shaded in the darkest red indicates that the final county yield must decline at least 6-11% before an indemnity would trigger large enough to cover producer premium. This implies that the price decline was not severe enough to trigger an indemnity on price alone. Most counties have experienced severe enough price declines in corn that there is yield upside available to still provide a net indemnity potentially above zero (e.g., yellow and green shaded counties).
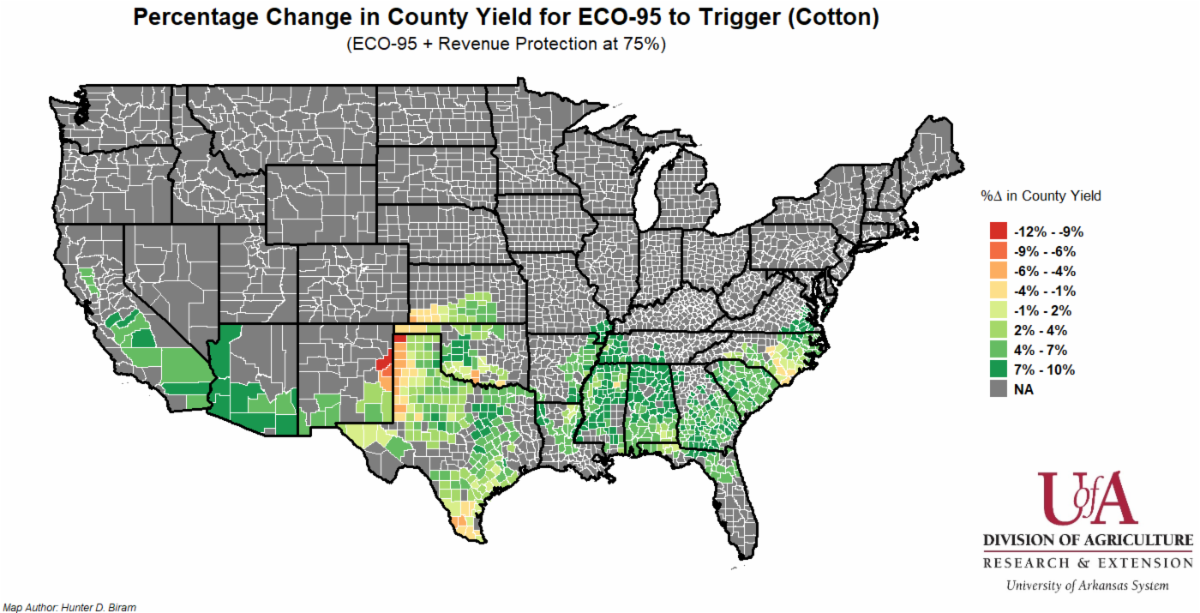
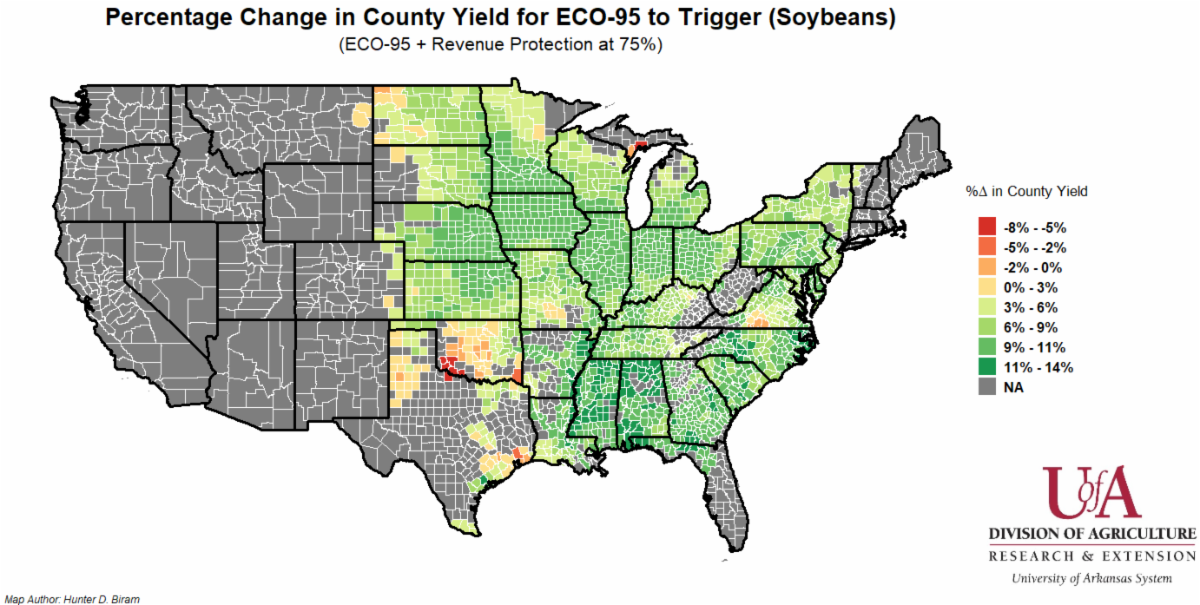
A similar pattern exists for cotton and soybeans (Figures 2-3). Nearly all counties insuring cotton under ECO-95 and RP-75 allow for yield upside risk to determine an indemnity equal to producer premium with most counties allowing for 7-10% yield upside risk. The same story holds for soybeans with potential yield upside risk of 9-14% for most counties which indicates the extent of futures price declines for both cotton and soybeans in 2024. Rice is the exception with no counties allowing for yield upside potential in determining an indemnity equal to producer premium (Figure 4). This is expected given there was virtually no change in the rough rice futures price between planting and harvest.
This analysis shows that price risk protection, which does not require a crop insurance premium, could be provided through ECO-95 if yields do not increase by more than 5% across most counties. However, given the potential for record yields across most of the U.S., this potential may be largely eclipsed. While this yield upside could be beneficial, it only considers one half of the profit equation, gross revenue. Further, price declines, paired with elevated production expenses, have not been met by risk protection from other farm bill programs, such as Price Loss Coverage and Agriculture Risk Coverage. This underscores the lack of price risk mitigation provided by current farm policy tools and the need for an updated farm safety net.
|