Pfau & Company Real Estate Market Update - March 2024 | |
This spring is starting out beautifully, although we need some serious rain to fill up the aquifers and lakes. Out at the ranch our creek is full, but if we ride West to Lake Buchanan or a little S-West to Travis, we see the full effect of the drought. Pray for rain! | |
|
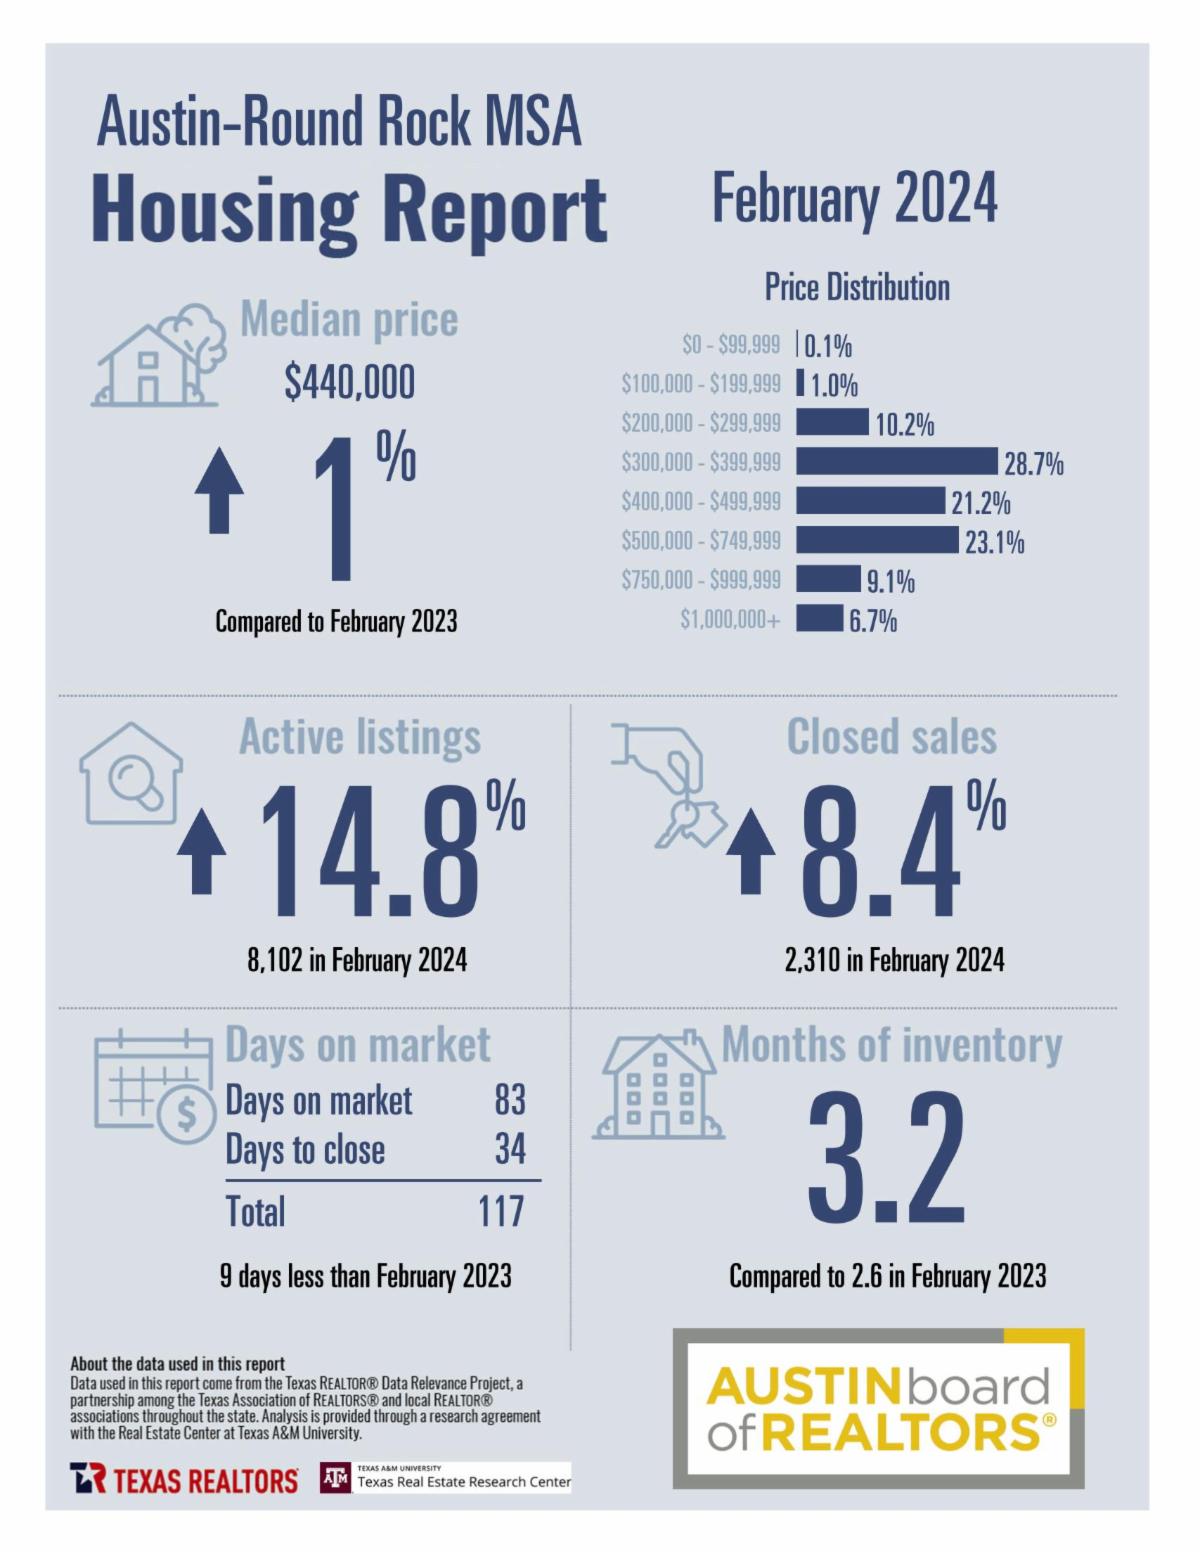
In February across the Austin-Round Rock-Georgetown MSA, new listings jumped 44.9% to 3,915 listings bringing the total months of inventory for the region to 3 months, up 0.1 months more than February 2023, according to the latest Central Texas Housing Report released by Unlock MLS. The data indicates that sellers are feeling more favorable about the market, while buyers have a broader range of home options to select from.
Last month I wrote the following summary: "C.J. and I have worked in the real estate industry for well over 30 years each, and we have weathered some storms, and witnessed the thaw. we believe our current market is filled with pent up demand from buyers and sellers who will enter the market when the mortgage rates and lower prices reach a sweet spot of affordability." We're seeing some positive signs and more of the same. The first is more inventory, which is great. But lower pending sales activity in most areas besides Bastrop and Caldwell counties is due to still high mortgage rates. Once the Fed begins lowering the bank rate, mortgage rates should follow, and expectations of that are for June. We're still selling houses though, contact us to learn more about your situation.
| |
|
Austin Round-Rock-Georgetown MSA
- 2,144 – Residential homes sold, 1.3% more than February 2023.
- $443,065 – Median price for residential homes, 1.2% more than February 2023.
- 3,915 – New home listings on the market, 44.9% more than February 2023.
- 7,991 – Active home listings on the market, 5.5% less than February 2023.
- 1,920 – Pending sales, 15.7% less than February 2023.
- 3.0 – Months of inventory, 0.1 months more than February 2023.
- $1,195,496,123 – Total dollar volume of homes sold, 0.1% less than February 2023.
- 95.4% – Average close to list price, compared to 92.2% in February 2023.
City of Austin
- 717– Residential homes sold, 3.0% more than February 2023.
- $543,200 – Median price for residential homes, 2.8% less than February 2023.
- 1,476 – New home listings on the market, 41.7% more than February 2023.
- 2,785 – Active home listings on the market, 19.6% more than February 2023.
- 554 – Pending sales, 27.7% less than February 2023.
- 3.1 – Months of inventory, 0.8 months more than February 2023.
- $508,514,541– Total dollar volume of homes sold, 3.5% more than February 2023.
- 95.2% – Average close to list price, compared to 93.0% in February 2023.
Travis County
- 953 – Residential homes sold, 1.1% more than February 2023.
- $500,000– Median price for residential homes, 0.1% more than February 2023.
- 1,958– New home listings on the market, 42.8% more than February 2023.
- 3,920 – Active home listings on the market, 12.8% more than February 2023.
- 815 – Pending sales, 19.8% less than February 2023.
- 3.2 – Months of inventory, 0.6 months more than February 2023.
- $634,113,309 – Total dollar volume of homes sold, 5.8% more than February 2023.
- 95.2% – Average close to list price, compared to 92.7% in February 2023.
Williamson County
- 777 – Residential homes sold, 2.0% more than February 2023.
- $423,000 – Median price for residential homes, 1.9% more than February 2023.
- 1,172 – New home listings on the market, 41.7% more than February 2023.
- 2,234 – Active home listings on the market, 26.6% less than February 2023.
- 655 – Pending sales, 19.4% less than February 2023.
- 2.4 – Months of inventory, 0.6 months less than February 2023.
- $369,621,394 – Total dollar volume of homes sold, 4.6% more than February 2023.
- 95.5% – Average close to list price, compared to 92.3% in February 2023.
Hays County
- 290 – Residential homes sold, 6.5% less than February 2023.
- $385,000 – Median price for residential homes, 1.6% less than February 2023.
- 549 – New home listings on the market, 56.4% more than February 2023.
- 1,289 – Active home listings on the market, 8.1% less than February 2023.
- 312 – Pending sales, 4.3% less than February 2023.
- 3.4 – Months of inventory, 0.3 months less than February 2023.
- $139,721,421– Total dollar volume of homes sold, 5.2% less than February 2023.
- 95.3% – Average close to list price, compared to 91.7% in February 2023.
Bastrop County
- 92 – Residential homes sold, 7.0% more than February 2023.
- $351,875 – Median price for residential homes, 7.2% less than February 2023.
- 160 – New home listings on the market, 32.2% more than February 2023.
- 420 – Active home listings on the market, 3.7% less than February 2023.
- 96 – Pending sales, 4.3% more than February 2023.
- 3.8 – Months of inventory, 0.4 months less than February 2023 and the highest inventory in the MSA.
- $39,384,615– Total dollar volume of homes sold, 10.3% more than February 2023.
- 95.4% – Average close to list price, compared to 90.8% in February 2023.
Caldwell County
- 31 – Residential homes sold, 93.8% more than February 2023.
- $299,900– Median price for residential homes, 9.0% less than February 2023.
- 76 – New home listings on the market, 137.5% more than February 2023.
- 126– Active home listings on the market, 22.3% more than February 2023.
- 38 – Pending sales, 26.7% more than February 2023.
- 3.7 – Months of inventory, 0.5 months more than February 2023.
- $11,755,385– Total dollar volume of homes sold, 115.5% more than February 2023.
- 96.7% – Average close to list price, compared to 99.9% in February 2023.
Burnet County
-
45 – Residential homes sold, 27.4% less than February 2023
-
$377,000 – Median price for residential homes, 1.6% more YOY
-
476 – Active home listings on the market, 37.6% more than February 2023
-
7.6 – Months of Inventory, 4.7 months more than February 2023
-
99 – Days on Market, 21 days more than February 2023
-
Price Distribution: Most, 26.2% sold between $300,000-$399,000 YOY
| |
|
Property Information at: www.Lot3-940EuelMoore.Info
Recently Listed for Sale - Lot 3-940 Euel Moore, Kingsland, Texas 78639 -- This is a rare waterfront lot in Kingsland on gorgeous LBJ, a constant level lake. Kingsland has an HEB, many restaurants and is where the Llano and Colorado Rivers converge, providing spectacular natural scenery as well as big water all the way down to Horseshoe Bay and Wirtz Dam. Head up the Llano towards The Slab for sandy beaches and granite rock outcroppings, explore the Colorado and its' summer camp vibe or find a cove or join the party at a sand island. Dock for food and beverages at Wakepoint LBJ or Boat Town Burger Bar from your future lake house. Big features include 4 completed boat slips with 4 locking storage units and power, creating the perfect place, architectural designs and building plans for a 2400 sq. ft. home. HOA fees are for driveway and channel maintenance. The canal was recently dredged and the lot is approximately 100 yards to open water. Not Builder Restricted. - Listed at $475,000
| |
|
Please remember if you have any questions about purchasing or selling real estate either now or in the future, call us to discuss your plans and we can help you with your plan.
Jon & C. J. Pfau
| |
|
If anyone you know might need help with buying or selling or just want to get monthly information for real estate, our link to our newsletter is below. Send it to friends and family. We won't bother anyone but we will give them monthly updates on the market for their own knowledge.
Pfau & Company News Letter Sign Up Here.
| |
|
Our Business is delivering Exceptional Realty Service -
far exceeding expectations,
grateful to give our best.
Jon: 512-635-0232
C.J.: 512-415-0583
Email: Pfaucorealtors@aol.com
| |
| | | |