System of the Month (for the 2nd month in a row):
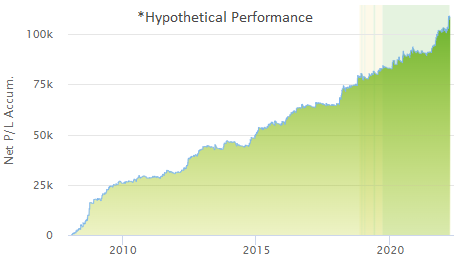
DT Rider M1C ES v2
|
|
Many traders choose to diversify their portfolios with algorithmic trading systems. The following system has been selected as the broker's choice for this month. |
|
REQUIRED CAPITAL: $3,300*
PRODUCT: E-mini S&P future
SYSTEM TYPE: Intraday
COST: $150 / month
COMMISSION: $7.50 per side
|
|
|
The performance shown above is hypothetical in that the chart represents returns in a model account. The model account rises or falls by the average single contract profit and loss achieved by clients trading actual money pursuant to the listed system’s trading signals on the appropriate dates (client fills), or if no actual client profit or loss available – by the hypothetical single contract profit and loss of trades generated by the system’s trading signals on that day in real time (real‐time) less slippage, or if no real time profit or loss available – by the hypothetical single contract profit and loss of trades generated by running the system logic backwards on backadjusted data.
|
|
Tax Advantages of Futures Trading vs. Stock Trading |
Tax Season is no fun for anyone, especially active traders. Taxes for futures trading have a potential capital gains advantage & an exemption from wash sales rules, compared to taxes for stock trading...
|
|
|
What Does It Mean To BTFD? |
BTFD, or Buy The F****** Dip, is trendy crude-speak that suggests purchasing an asset that’s dropped in price or value.
If you follow social trading channels, you’ll often come across BTFD recommendations for an asset that someone deems “undervalued.” BTFD this; BTFD that...
|
|
|
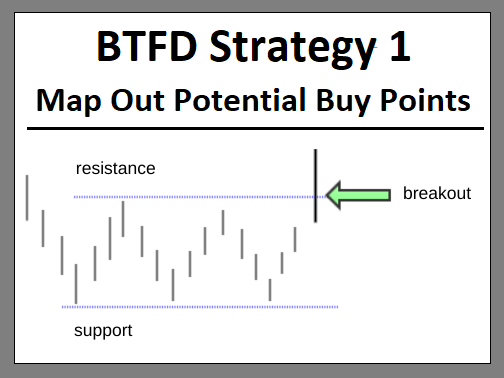
BTFD Strategy 1 – Map Out Potential Buy Points |
Prices can move up and down in a wild volatile manner, so it is helpful to use a price map. Unless you’re accustomed to reading a chart, it’s easy to get lost... unable to see the big picture... Don't get distracted by the ups and downs...
|
|
|
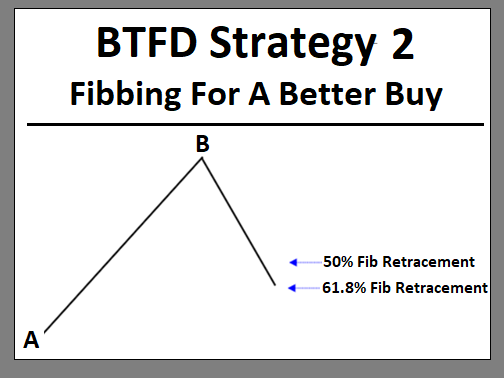
BTFD Strategy 2 – Fibbing for a Better Buy |
When price falls, sometimes it bounces back before it reaches a prior support level, as if reversing course “mid-air...” What might have caused the reversal was a Fibonacci level... Fib retracements help you measure how far price has pulled...
|
|
|
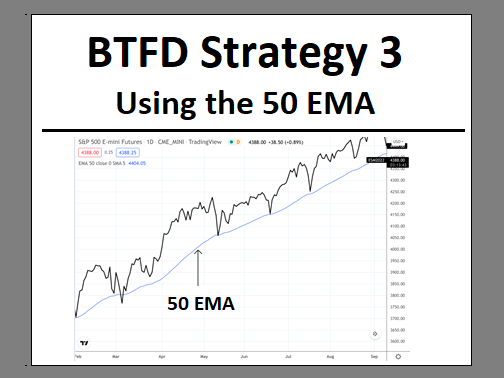
BTFD Strategy 3 – Using the 50 EMA |
A moving average is an “average” of prices across a number of days... The “exponential” part is simply a calculation that gives more weight to near-term prices... The basic idea is that if a moving average is moving up...
|
|
|
How the Russia-Ukraine Conflict is Threatening the Crude & Wheat Markets |
The notion that the Russia-Ukraine conflict poses a threat to the global energy supply seems to be a given. But what some people are probably not expecting is the impact it may have on wheat markets...
|
|
|
Upcoming Government Reports & Holidays |
|
Apr 01
Apr 01
Apr 04
Apr 05
Apr 08
Apr 12
Apr 13
Apr 13
Apr 14
Apr 14
Apr 15
Apr 19
Apr 25
Apr 26
Apr 26
Apr 27
|
|
CONSTRUCTION SPENDING REPORT
EMPLOYMENT SITUATION REPORT
MANUFACTURERS' SHIPMENTS, INVENTORIES & ORDERS - FULL REPORT
US INTERNATIONAL TRADE IN GOODS & SERVICES REPORT
MONTHLY WHOLESALE TRADE: SALES & INVENTORIES
CONSUMER PRICE INDEX REPORT
BUSINESS FORMATION STATISTICS
PRODUCER PRICE INDEX REPORT
ADVANCE MONTHLY SALES FOR RETAIL & FOOD SERVICES REPORT
MANUFACTURING AND TRADE: INVENTORIES & SALES REPORT
GOOD FRIDAY HOLIDAY
NEW RESIDENTIAL CONSTRUCTION REPORT
PRELIMINARY US IMPORTS FOR CONSUMPTION OF STEEL PRODUCTS
NEW RESIDENTIAL SALES REPORT
ADVANCE REPORT ON DURABLE GOODS - MANUFACTURERS' SHIPMENTS...
ADVANCE ECONOMIC INDICATORS REPORT
|
|
Key Events That Moved the Market in Mar. 2022 |
|
The following is a review of US and world events from the last month. Please be advised that this content is based upon the opinions and research of GFF Brokers and its staff and should not be treated as trade recommendations.
|
|
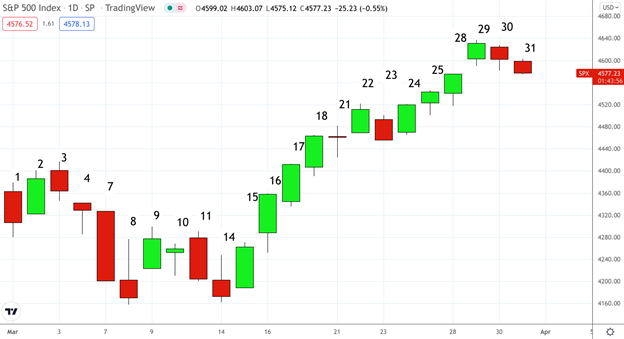
S&P 500 Index (SPX) - Daily Chart - Mar 1 - 31, 2022 (Source: Tradingview)
March 1
- It was another tumultuous day of trading on Wall Street as the Dow fell 597.65 points; the S&P, -1.55%; and the Nasdaq,-1.63%.
- Russia’s invasion of Ukraine remains center focus, driving crude oil over $100 a barrel and giving wheat and gold prices a boost.
March 2
- Markets provided some bounce back relief following remarks by Fed Chair Jerome Powell who testified on Capitol Hill.
- The Dow jumped 596 points, the S&P is up 1.86%, and the Nasdaq advanced 1.70%.
- Powell reassured the markets by saying that the Fed expects to make a 0.25% rate hike this month, enough to begin tackling inflation but not too big a hike to kill economic growth.
March 3
- Stocks slipped today with the Dow pulling back 96 points, the S&P falling a mere 0.53%, and the Nasdaq taking the hardest hit, down 1.46%.
- News of a third round of bilateral talks between Ukraine and Russia helped ease investors' fears who saw the prospects as neutral.
- Meanwhile, crude oil’s advance took a pause while other commodities like grains and various metals continued to move higher.
March 4
- Another wild day of trading in the books as stocks continue to move sharply lower to end the week..
- The Dow fell 179 points; the S&P, down 0.79%, and the Nasdaq ended the day lower by 1.41%.
- Overnight news of fighting near a nuclear power plant in the Ukraine—the largest power plant in Europe—spooked the markets.
- The jobs report delivered positive news of 678,000 news jobs in February with wages flat” on the month but up 5% year over year.
March 7
- Wall Street kicked off the week with another big plunge with the Dow declining 797 points, the S&P falling almost 3%, and the Nasdaq losing 3.75%.
- The war in Ukraine continues to inject uncertainty into the markets.
- Crude oil spiked to a 13 year high over $130 a barrel as the US considers a stand alone ban on Russian oil.
March 8
- Stocks staged a remarkable reversal after a tumultuous session with the Dow swinging 800 points before closing down only 184 points. The S&P lost 0.72%, and the Nasdaq ended lower by 0.39%.
- President Biden announced that the US will be banning all Russian oil imports.
- Unverified reports that Ukraine’s President Zelensky will be withdrawing the country’s request to join NATO, leading to a potential ceasefire, helped buoy market sentiment, reversing its plunge.
March 9
- The Dow rallied 808 points before closing up 653 points higher. The S&P rose 2.5% while the Nasdaq got a boost of 3.58%.
- The dizzying market action came in part from crumbling WTI crude oil prices, plunging 10% overnight as news that the UAE has agreed to possibly ramp up oil production to ease the supply shortage.
March 10
- Another choppy trading day minus the kind of volatility we’ve been seeing over the last few sessions, the Dow fell over 400 points to end the day down 112 points. The S&P fell almost half a percent while the Nasdaq ended the day lower by 1.10%.
- The latest CPI read on inflation came in at a 40 year high: 7.9% year over year.
- And this was before the Russia-Ukraine war, meaning before crude and other commodities began surging in price due to constrained supply.
March 11
- Wall Street capped off a downbeat week with more choppiness.
- The Dow, -229.88 points; the S&P, -1.30%; and the Nasdaq, -2.13%.
- The Dow is now riding a five-week losing streak; the most since May 2019.
- Selling accelerated across the markets after President Biden called on Congress to suspend normal trade with Russia, clearing the way for tariffs down the road (something markets tend to view unfavorably).
March 14
- Another early rally fizzled out mid session today.
- The Dow ended unchanged, the S&P down a mere 0.74%, and the Nasdaq fell the most by 1.92%.
- More chaos in the Ukraine added to the markets many layers of uncertainty including inflation, Fed rate hikes, and slowing global growth.
- In short the fundamentals are beginning to look murkier by the day.
March 15
- Markets staged an impressive comeback, adding to the technical outlook that the markets may be finding a bottom.
- The Dow jumped 599 points; the S&P advanced 2.14%, and the Nasdaq got the biggest boost, up 3.16%.
- The day kicked off on a positive note when the February PPI came in lower than expected; in addition to this, crude oil prices collapsed due to China’s economic slowdown, easing fears of advancing inflation.
March 16
- Markets continued the previous day’s rally with the Dow advancing 518 points. The S&P and Nasdaq were also up, 2.24% and 3.7% respectively.
- The positive kick off was the Federal Reserve’s 0.25% rate hike, which came at the level markets had already priced in.
March 17
- Stocks staged another remarkable rally this Thursday with the major averages finally breaking out a very tight trading range over the last couple of weeks.
- The Dow, +417.66 points; the S&P, +1.23%; the Nasdaq, +1.16%.
- The Energy sector led the charge, while banks were the biggest loser.
- The problem with today’s rally, however, was that the action was very choppy; in short, not a lot of buying conviction.
March 18
- Markets wrapped up another eventful week with strong gains.
- The Dow managed to gain 274 points; the S&P advanced 1.17%; the tech-heavy Nasdaq rose 2.14%.
- Today, it was Tech stocks and Consumer Discretionary stocks that led the charge; the biggest loser was Energy.
March 21
- Markets ended the day relatively unchanged.
- Although stocks rallied for most of the morning session, it was Fed Chair Powell’s statement that took the markets down mid-day.
- Powell expressed a renewed sense of urgency over the longer-term threat of inflation; raising the possibility of a more aggressive rate hike program in the months to come.
March 22
- Stocks edged higher wiping out all of yesterday’s declines.
- The Dow sprung forward a solid 254 points; the S&P gained 1.13%; the Nasdaq ended up 1.94%.
- Yields of 2-year and 10-year Treasuries have also risen to levels not seen since 2019.
March 23
- Markets took a breather from an impressive rally as the Dow ended lower by 448 points; the S&P declined 1.23%; the Nasdaq, lower by 1.41%.
- 10-year yields are rising after Powell earlier in the week opened the door to a possible 50 basis point rate hike in the coming FOMC session.
March 24
- Stocks took another step forward, resuming its recovery from a one-day slip.
- The Dow, +349.44; the S&P, +1.43%; the Nasdaq, +2.20%.
- Today saw the lowest level in weekly jobless claims in more than 50 years spotlighted the tight labor market.
- Investors also gave some credence to the Fed’s idea of lifting rates several times in the coming months without doing much harm to workers.
March 25
- Rate fears and worries over oil supply disruptions contributed to the choppy market actions but overall, the markets continued their advance.
- The Dow rose 153 points with the S&P gaining half a percent, and the Nasdaq sliding a mere 0.08%.
- If you noticed, lately the stock market values have been reliant on oil prices; when oil goes up, stocks go down.
- Investors are looking forward to a deluge of data this coming week including new home prices, consumer prices, and the March jobs report,
March 28
- Stocks clawed their way up from their session lows with the Dow rising by 94.65 points, the S&P holding ground at 0.71%, and the Nasdaq making the largest strides at 1.58%.
- With only three days left in the quarter, the S&P is down only 4% which is remarkable considering the long list of uncertainties the market has been grappling with throughout the entire month.
March 29
- Wall Street found its boost today in positive news concerning bilateral talks between Ukraine and Russia.
- The Dow gained an impressive 338 points, the S&P rising 1.23%, and the Nasdaq advancing by 1.68%.
- Futures jumped on headlines saying that bilateral talks in Turkey were constructive and that Russia has agreed to scale down military activity in Northern Ukraine.
March 30
- The market rally took a pause as investors began having doubts that Russia will hold true to its pledges of scaling down military activity in Northern Ukraine.
- The Dow fell 65 points; the S&P fell 0.63%; and the tech-heavy Nasdaq pulled back 1.10%.
- Rising rates are beginning to take a toll on the housing market as mortgage refi demand plunged 60% year over year.
March 31
- Wall Street wraps up its first losing quarter in two years.
- Reporting mid-day, the Dow slipped 180 points, the S&P 500 slid roughly 0.4%, and the Nasdaq Composite dipped 0.6%.
- Core PCE prices, one of the Fed’s favorite inflation measures, came in at 5.4% growth year over year for February. Economist consensus expected a rise of 5.5%.
|
|
Have Questions About Service, Technology or Trading? |
|
|
|
Use our industry expertise to help you make the most of your trading. A Series 3 Licensed Broker will connect with you to discuss your personal trading goals and answer your questions. |
|
Have questions about GFF Brokers services?
*Details regarding DT Rider M1C ES v2: Please be aware that the suggested capital to trade this system is $15,000. Please speak to your broker for more information about this trading system. The returns for the systems listed are hypothetical in that they represent returns in a model account. The model account rises or falls by the average single contract profit and loss achieved by clients trading actual money pursuant to the listed system’s trading signals on the appropriate dates (client fills), or if no actual client profit or loss available – by the hypothetical single contract profit and loss of trades generated by the system’s trading signals on that day in real time (real‐time) less slippage, or if no real time profit or loss available – by the hypothetical single contract profit and loss of trades generated by running the system logic backwards on backadjusted data.
HYPOTHETICAL PERFORMANCE RESULTS HAVE MANY INHERENT LIMITATIONS, SOME OF WHICH ARE DESCRIBED BELOW. NO REPRESENTATION IS BEING MADE THAT ANY ACCOUNT WILL OR IS LIKELY TO ACHIEVE PROFITS OR LOSSES SIMILAR TO THOSE SHOWN. IN FACT, THERE ARE FREQUENTLY SHARP DIFFERENCES BETWEEN HYPOTHETICAL PERFORMANCE RESULTS AND THE ACTUAL RESULTS SUBSEQUENTLY ACHIEVED BY ANY PARTICULAR TRADING PROGRAM.
ONE OF THE LIMITATIONS OF HYPOTHETICAL PERFORMANCE RESULTS IS THAT THEY ARE GENERALLY PREPARED WITH THE BENEFIT OF HINDSIGHT. IN ADDITION, HYPOTHETICAL TRADING DOES NOT INVOLVE FINANCIAL RISK, AND NO HYPOTHETICAL TRADING RECORD CAN COMPLETELY ACCOUNT FOR THE IMPACT OF FINANCIAL RISK IN ACTUAL TRADING. FOR EXAMPLE, THE ABILITY TO WITHSTAND LOSSES OR TO ADHERE TO A PARTICULAR TRADING PROGRAM IN SPITE OF TRADING LOSSES ARE MATERIAL POINTS WHICH CAN ALSO ADVERSELY AFFECT ACTUAL TRADING RESULTS. THERE ARE NUMEROUS OTHER FACTORS RELATED TO THE MARKETS IN GENERAL OR TO THE IMPLEMENTATION OF ANY SPECIFIC TRADING PROGRAM WHICH CANNOT BE FULLY ACCOUNTED FOR IN THE PREPARATION OF HYPOTHETICAL PERFORMANCE RESULTS AND ALL OF WHICH CAN ADVERSELY AFFECT ACTUAL TRADING RESULTS.
There is a substantial risk of loss in trading futures, options and forex. Past performance is not necessarily indicative of future results. Margins are subject to change at anytime without notice. All material herein was compiled from sources considered reliable. However, there is no expressed or implied warranty as to the accuracy or completeness of this material.
|
|
|
|
|
|
|