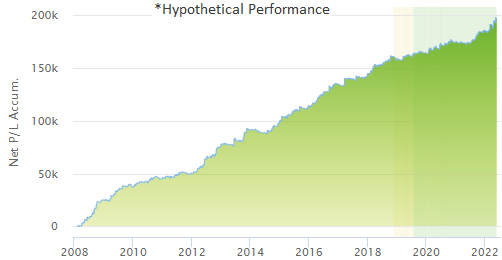
System of the Month: DT Rider M3C ES v2 | |
Many traders choose to diversify their portfolios with algorithmic trading systems. The following system has been selected as the broker's choice for this month. | |
|
REQUIRED CAPITAL: $9,200*
PRODUCT: E-mini S&P future
SYSTEM TYPE: Intraday
COST: $170 / month
COMMISSION: $7.50 / side
| |
|
The performance shown above is hypothetical in that the chart represents returns in a model account. The model account rises or falls by the average single contract profit and loss achieved by clients trading actual money pursuant to the listed system’s trading signals on the appropriate dates (client fills), or if no actual client profit or loss available – by the hypothetical single contract profit and loss of trades generated by the system’s trading signals on that day in real time (real‐time) less slippage, or if no real time profit or loss available – by the hypothetical single contract profit and loss of trades generated by running the system logic backwards on backadjusted data.
| |
What Is Slippage & What Does It Mean For You? | |
Slippage is the difference between the price you expected to enter a trade and the actual price at which your trade order was filled... You can prevent slippage if you use Limit Orders, but there's a catch...
View Full Article
| |
|
Upcoming Government Reports & Holidays | |
|
Jun 01
Jun 02
Jun 03
Jun 07
Jun 07
Jun 07
Jun 08
Jun 09
Jun 10
Jun 10
Jun 14
Jun 15
Jun 15
Jun 16
Jun 19
Jun 20
Jun 24
Jun 24
Jun 27
Jun 28
| |
|
CONSTRUCTION SPENDING REPORT
MANUFACTURERS' SHIPMENTS, INVENTORIES & ORDERS - FULL REPORT
EMPLOYMENT SITUATION REPORT
US INTERNATIONAL TRADE IN GOODS & SERVICES REPORT
QUARTERLY FINANCIAL REPORT: MANUFACTURING, MINING, WHOLESALE...
QUARTERLY FINANCIAL REPORT: RETAIL TRADE
MONTHLY WHOLESALE TRADE: SALES & INVENTORIES
BUSINESS FORMATION STATISTICS
CONSUMER PRICE INDEX REPORT
QUARTERLY SERVICE SURVEY
PRODUCER PRICE INDEX REPORT
ADVANCE MONTHLY SALES FOR RETAIL & FOOD SERVICES REPORT
MANUFACTURING AND TRADE: INVENTORIES & SALES REPORT
NEW RESIDENTIAL CONSTRUCTION REPORT
JUNETEENTH
JUNETEENTH OBSERVED
PRELIMINARY US IMPORTS FOR CONSUMPTION OF STEEL PRODUCTS
NEW RESIDENTIAL SALES REPORT
ADVANCE REPORT ON DURABLE GOODS - MANUFACTURERS' SHIPMENTS...
ADVANCE ECONOMIC INDICATORS REPORT
| |
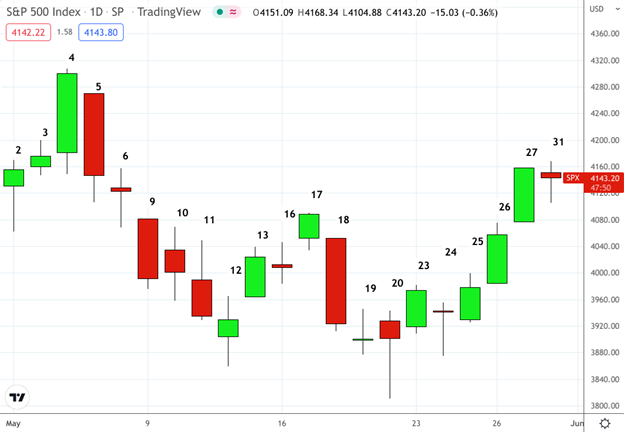
Key Events That Moved the Market in May 2022 | |
The following is a review of US and world events from the last month. Please be advised that this content is based upon the opinions and research of GFF Brokers and its staff and should not be treated as trade recommendations. | |
|
S&P 500 Index (SPX) - Daily Chart - May 1 - 31, 2022 (Source: Tradingview)
May 2
- Stocks struggled to shake off April’s ugly selloff but managed to stave off the losses by the close.
- The Dow closed higher by 84 points, the S&P gained 0.57%, and the Nasdaq rose 1.72%.
- Markets are largely nervous as the Federal Reserve gears up for the big FOMC meeting this week.
May 3
- Stocks fluctuate between gains and losses in another choppy session but all three ended the day in the green.
- The Dow rose 67 points, the S&P ended the day higher by 0.48%, and the tech-heavy Nasdaq continued its advance, now up 0.48%.
- The big expectation is for the Fed to raise rates by 50 basis points and delay the groundwork for another hefty hike in June.
May 4
- An outstanding day on Wall Street as investors bet the Fed can slow inflation without causing a recession.
- The Dow advanced 932 points, the S&P surged ahead 2.81%, and the Nasdaq ended the day with a whopping 3.41% gain.
- While the central bank announced that it was hiking its benchmark interest rate 50-basis-points, the markets moved sharply higher when Fed Chair Powell said the central bank was not considering an even more aggressive hike in future meetings.
May 5
- In stark contrast to yesterday’s rally, the Dow and Nasdaq experienced their worst single-day drop since 2020.
- The Dow fell 1063 points, the S&P declined 3.5%, and the tech-heavy Nasdaq plunged 5%.
- Worker productivity fell 7.5% in Q1, the fastest decline since 1947. Labor costs as measured against productivity soared 11.6%, bringing the increase over the past four quarters to 7.2%, the fastest rise in about 40 years.
- And to top it off, weekly jobless claims increased to 200,000, well above analyst expectations.
May 6
- The relief rally earlier in the week seems short-lived: the Dow continued its slide, down 98 points, while the S&P heald relatively steady only losing 0,57%; the Nasdaq fell the hardest, down 1.22%.
- Analysts are saying that unless inflation quickly reverses its course, the Fed may have no other choice than to slow growth in order to ease inflation.
- A key area to keep an eye on is the labor force participation rate, which remains weak and well below its pre-pandemic level. Economists believe that a recovery in participation could help stem the rise in wages and, by extension, inflation.
May 9
- Wall Street struggled to find its footing after last week’s wild swings.
- The Dow is down 653 points. The S&P fell 3% while the Nasdaq plunged almost 4%.
- Consumer staples was the only sector in the green as investors are flocking to more defensive and dividend-yielding names.
May 10
- Markets seesawed as the Dow slipped for a fourth day while the major averages struggled to bounce back from a bout of heavy selling.
- The Dow lost 85 points while the S&P and Nasdaq rose slightly, 0.25% and 1.3% respectively.
- Much of the recent market action has been driven by the Fed and speculations as to how aggressively it will act to curb rising inflation.
- Meanwhile, investors continue to search for a bottom while keeping an eye on the pandemic lockdown in China and the ongoing conflict in Ukraine.
May 11
- Stocks continue their slide following another hot inflation report.
- The Dow declined -326 points as the S&P and Nasdaq dialed back yesterday's gains, losing ground by 1.65% and 3% respectively.
- While the markets want to see energy and food and labor costs come down, the mechanism by which that can be achieved is to hike rates aggressively.
- April’s consumer price index showed an 8.3% jump, higher than the 8.1% increase expected by economists.
May 12
- The S&P and Nasdaq fell modestly, down 0.13% and 0.18% as the Dow took the greater loss of 103 points.
- Producer prices at the wholesale level rose 11% over the past year and 0.5% in April alone, the Bureau of Labor Statistics reported Thursday.
- But the biggest news today was in the crypto markets which saw over a loss of over $200 billion across the board,
May 13
- Today squaw a strong and long-awaited bounce to punctuate a grueling week for Wall Street with the Dow snapping back 466 points, the S&P advancing 2% and the Nasdaq delivering a robust rally up 3.7%.
- With no crucial economic data on the calendar, the market was left to technical indicators, deeply oversold levels, and potential exhaustion of aggressive selling.
May 16
- Stocks started lower and rallied midday, but couldn’t hold on to the gains by the end of the session.
- The Dow advanced 26 points while the S&P and Nasdaq slid 0.39% and 1.16% respectively.
- Investors are awaiting tomorrow’s retail sales and industrial production data.
May 17
- The market rose in today’s trading, the Dow rising 431 points, the S&P ending the day 2% higher, and the Nasdaq advancing 2.62%.
- Tomorrow we’ll get data on housing starts and building permits to get a gauge where housing markets stand as mortgage rates and tighter inventory continues to weigh on homebuilders sentiment.
May 18
- The selloff on Wall Street intensifies as the Dow sees its largest drop since 2020.
- The Dow ended the day down 1164 points; the Nasdaq fell 5%; and the broader S&P fell 4%.
- Markets commenced their heavy selling after two back-to-back quarterly reports from Target and Walmart stoked investor fears of rising inflation taking a bite out of corporate profits and consumer demand.
May 19
- Another day of modest declines on Wall Street with the Dow falling the hardest, down 236 points, and the S&P and Nasdaq sliding 0.58% and 0.44%.
- The S&P, however, is just a few points away from bear market territory.
- Existing home sales fell to their lowest levels since the start of the pandemic,
- Meanwhile, U.S. weekly jobless claims rose to 218,000 for the week, the latest hint that economic growth may be slowing.
May 20
- A very wild ride that ended in a spinning top with all three indices nearly unchanged.
- The Dow barely scratched out a gain, up 8 points the S&P followed suit, up 0.01%, while the Nasdaq fell a modest 0.34%.
- While there’s no official bear market designation on Wall Street, some will count Friday’s decline at the intraday lows as confirmation of a bear market, whereas some analysts may say it’s not official until it closes 20% off its high.
- Yet what we’re seeing is the biggest downturn of this magnitude since March 2020 which counts as the shortest bear market by historical standards.
May 23
- Wall Street began the week with solid gains as the Dow bounces back from an 8-week losing streak.
- The Dow jumped 618 points to end the day, the S&P is up 186%, and the Nasdaq bounced back by 1.68%.
May 24
- It was a mixed day on Wall Street as the Dow advanced a modest 48 points while the S&P fell 0.81% and the Nasdaq took a big tumble, down over 2%.
- New home sales also took a dive, down 16.6%, to levels matching those at the onset of the pandemic.
- Along with tech stocks, which have been hit during the recent plunge, the sell-off has also been driven by losses in the retail sector following weak earnings and guidance.
May 25
- It was a positive day on Wall Street as the Dow rose 191 points, the S&P closed up 0.95%, and the Nasdaq rose 1.48%.
- The Fed’s May minutes was released and the markets noted it for its “stay the course” attitude signaling another two 50 basis point hikes in the coming FOMC sessions.
- Economic data shows some general slowing but that’s also what the Fed is hoping to achieve as it attempts to raise rates in a manner that avoids slowing the economy too aggressively.
May 26
- Stocks staged a rip-roaring rally with the dow rising 516 points by the end of the day, the S&P advancing nearly 2%, and the Nasdaq jumping 2.79%.
- Although the rally was broad-based (all 11 sectors participating), all sectors are vulnerable if tomorrow’s PCE numbers which happen to be one of the Fed’s preferred inflation indicators come in higher than expected.
May 27
- Markets ended the day and the week on a positive note with the Dow rising 575 points, the S&P rallying 2.47%, and the Nasdaq advancing ver 3%.
- Key inflation measures came in lower this morning.
- Although inflation is stil rising, it’s doing so at a slower rate with core April PCE coming in at 4.9%. Bear in mind that the Fed pays close attention to these numbers which can affect how fast and how high the Fed raises interest rates.
May 31
- US stocks fell to close out the month of May in the red.
- The S&P is once again flirting with bear market territory amid inflation and recession fears.
- In absence of any major economic data for the day, the Dow fell about 190 points, or 0.6% while the S&P 500 fell 0.5%. The Nasdaq Composite eased 0.3%, after being up 0.5% at its highs and down nearly 1.6% at its lows.
| |
Have Questions About Service, Technology or Trading? | | |
|
Use our industry expertise to help you make the most of your trading. A Series 3 Licensed Broker will connect with you to discuss your personal trading goals and answer your questions. | |
|
Website: www.GFFBrokers.com
Have questions about GFF Brokers services?
Call us toll free at 844.896.7432 or Local/International at 1.818.510.4590
*Details regarding DT Rider M3C ES v2: Please be aware that the suggested capital to trade this system is $20,000. Please speak to your broker for more information about this trading system. The returns for the systems listed are hypothetical in that they represent returns in a model account. The model account rises or falls by the average single contract profit and loss achieved by clients trading actual money pursuant to the listed system’s trading signals on the appropriate dates (client fills), or if no actual client profit or loss available – by the hypothetical single contract profit and loss of trades generated by the system’s trading signals on that day in real time (real‐time) less slippage, or if no real time profit or loss available – by the hypothetical single contract profit and loss of trades generated by running the system logic backwards on backadjusted data.
HYPOTHETICAL PERFORMANCE RESULTS HAVE MANY INHERENT LIMITATIONS, SOME OF WHICH ARE DESCRIBED BELOW. NO REPRESENTATION IS BEING MADE THAT ANY ACCOUNT WILL OR IS LIKELY TO ACHIEVE PROFITS OR LOSSES SIMILAR TO THOSE SHOWN. IN FACT, THERE ARE FREQUENTLY SHARP DIFFERENCES BETWEEN HYPOTHETICAL PERFORMANCE RESULTS AND THE ACTUAL RESULTS SUBSEQUENTLY ACHIEVED BY ANY PARTICULAR TRADING PROGRAM.
ONE OF THE LIMITATIONS OF HYPOTHETICAL PERFORMANCE RESULTS IS THAT THEY ARE GENERALLY PREPARED WITH THE BENEFIT OF HINDSIGHT. IN ADDITION, HYPOTHETICAL TRADING DOES NOT INVOLVE FINANCIAL RISK, AND NO HYPOTHETICAL TRADING RECORD CAN COMPLETELY ACCOUNT FOR THE IMPACT OF FINANCIAL RISK IN ACTUAL TRADING. FOR EXAMPLE, THE ABILITY TO WITHSTAND LOSSES OR TO ADHERE TO A PARTICULAR TRADING PROGRAM IN SPITE OF TRADING LOSSES ARE MATERIAL POINTS WHICH CAN ALSO ADVERSELY AFFECT ACTUAL TRADING RESULTS. THERE ARE NUMEROUS OTHER FACTORS RELATED TO THE MARKETS IN GENERAL OR TO THE IMPLEMENTATION OF ANY SPECIFIC TRADING PROGRAM WHICH CANNOT BE FULLY ACCOUNTED FOR IN THE PREPARATION OF HYPOTHETICAL PERFORMANCE RESULTS AND ALL OF WHICH CAN ADVERSELY AFFECT ACTUAL TRADING RESULTS.
There is a substantial risk of loss in trading futures, options and forex. Past performance is not necessarily indicative of future results. Margins are subject to change at anytime without notice. All material herein was compiled from sources considered reliable. However, there is no expressed or implied warranty as to the accuracy or completeness of this material.
| | | | | |