The very big picture (a historical perspective):
The long-term valuation of the market is commonly measured by the Cyclically Adjusted Price to Earnings ratio, or “CAPE”, which smooths-out shorter-term earnings swings in order to get a longer-term assessment of market valuation. A CAPE level of 30 is considered to be the upper end of the normal range, and the level at which further PE-ratio expansion comes to a halt (meaning that further increases in market prices only occur as a general response to earnings increases, instead of rising “just because”). The market was recently at that level.
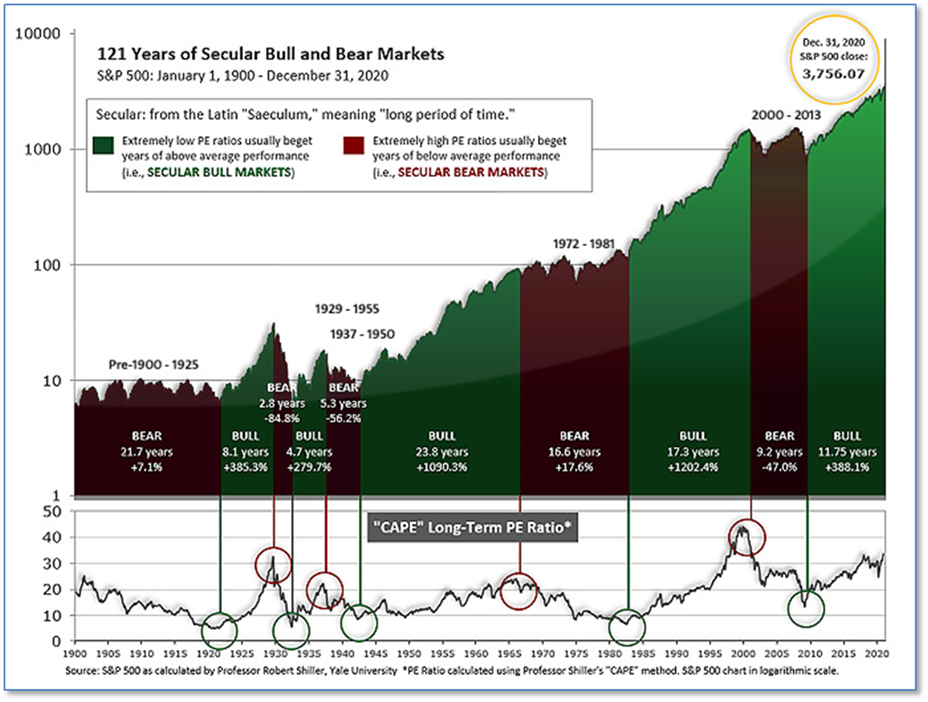
Of course, a “mania” could come along and drive prices higher - much higher, even - and for some years to come. Manias occur when valuation no longer seems to matter, and caution is thrown completely to the wind - as buyers rush in to buy first, and ask questions later. Two manias in the last century - the “Roaring Twenties” of the 1920s, and the “tech bubble” of the late 1990s - show that the sky is the limit when common sense is overcome by a blind desire to buy. But, of course, the piper must be paid, and the following decade or two were spent in secular bear markets, giving most or all of the mania-gains back.
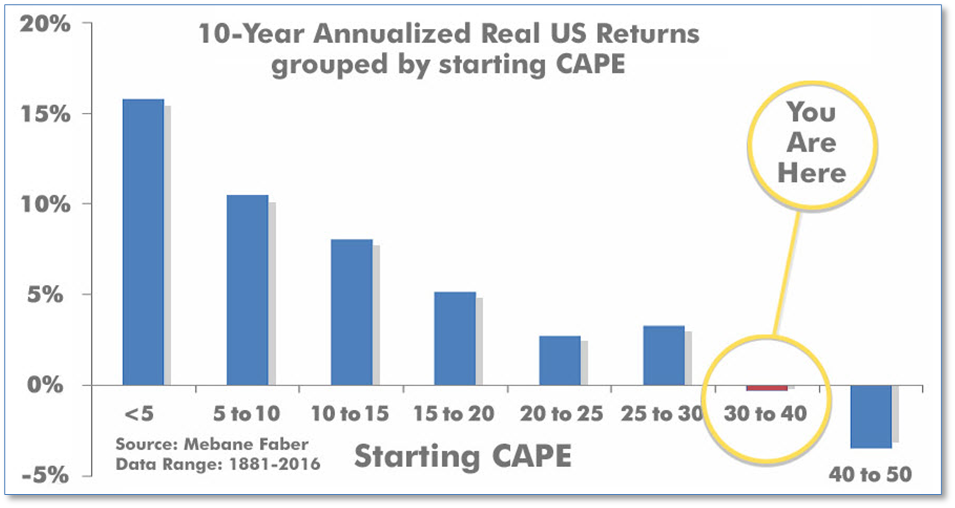
See Fig. 1 for the 100-year view of secular bulls and bears. The CAPE is now at 35.83, up from the prior week’s 35.39. Since 1881, the average annual return for all ten-year periods that began with a CAPE in the 30-40 range has been slightly negative (see Fig. 2).
Note: We do not use CAPE as an official input into our methods. However, if history is any guide - and history is typically ‘some’ kind of guide - it’s always good to simply know where we are on the historic continuum, where that may lead, and what sort of expectations one may wish to hold in order to craft an investment strategy that works in any market ‘season’ … whether current one, or one that may be ‘coming soon’!
The Very Big Picture: 120 Years of Secular Bulls and Bears