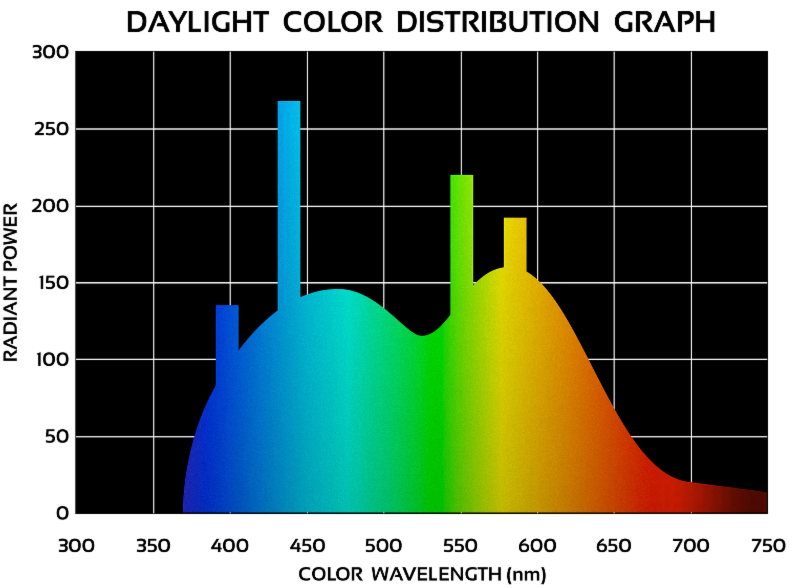
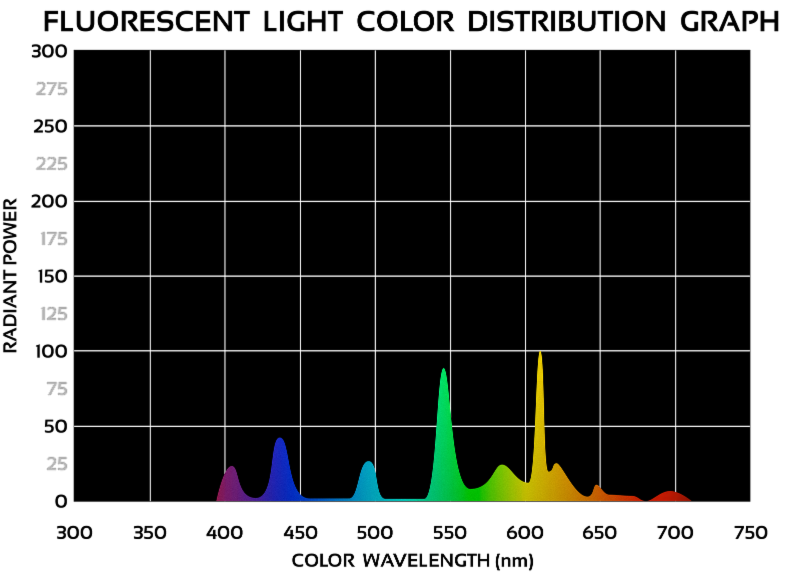
The most obvious difference between these two color distribution graphs is the lower level of color in the fluorescent light when compared to daylight. You can see a few color ‘spikes’ in the fluorescent light, but only certain wavelengths (the spikes) are strongly represented.
These spikes indicate which parts of the color spectrum will be emphasized by the fluorescent light when in use to illuminate objects like the apples.
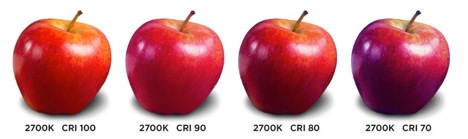
The ability of fluorescent lights to illuminate the color of apples with a CRI of 82 is not bad, but certainly much worse than daylight, which has a CRI closer to 100, depending on time of day. Notice the deep troughs in the graph for the fluorescent light where the curve almost reaches zero for certain colors.
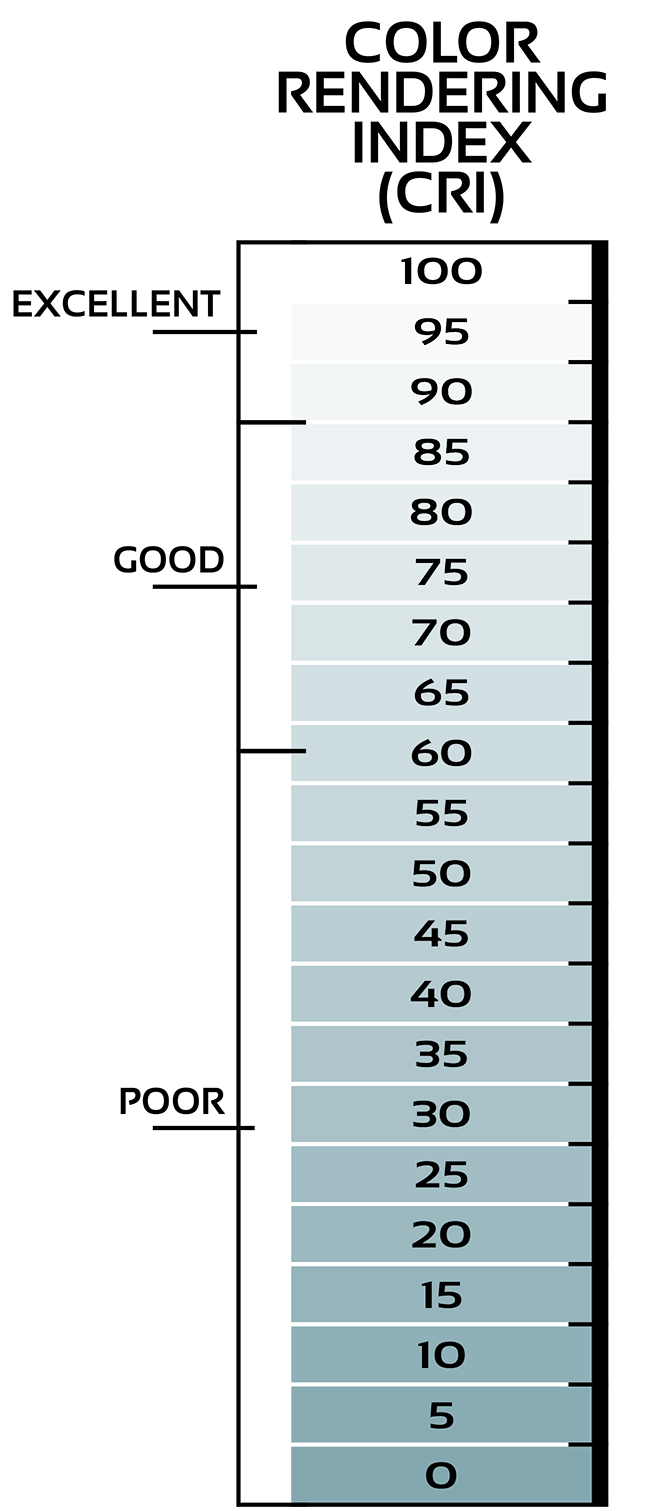
CRI, or Color Rendering Index, is a numerical scale of 0 to 100 (Chart to right) used in lighting to indicate how a light source will make the color of an object appear to human eyes. The higher the number, the more ‘accurate’ and appealing the objects color appears.
The highest attainable CRI is 100. Lamps with CRIs above 70 are typically used in office and living environments. A standard "cool white" fluorescent lamp will have a CRI near 62.
For certain applications such as illuminating apples, artwork or for shopping in retail clothing stores, a higher CRI can make all the difference.